

Abstract
Presynaptic elements of axons, in which action potentials (APs) cause release of neurotransmitter, are sites of high densities and complex interactions of proteins. We report that the presence of Kv3 channels in addition to Kv1 at glutamatergic mossy fiber boutons (MFBs) in rat hippocampal slices considerably limits the number of fast, voltage-activated potassium channels necessary to achieve basal presynaptic AP repolarization. The ∼10-fold higher repolarization efficacy per Kv3 channel compared with presynaptic Kv1 results from a higher steady-state availability at rest, a better recruitment by the presynaptic AP as a result of faster activation kinetics, and a larger single-channel conductance. Large-conductance calcium- and voltage-activated potassium channels (BKCa) at MFBs give rise to a fast activating/fast inactivating and a slowly activating/sustained K+ current component during long depolarizations. However, BKCa contribute to MFB–AP repolarization only after presynaptic Kv3 have been disabled. The calcium chelators EGTA and BAPTA are equally effective in preventing BKCa activation, suggesting that BKCa are not organized in nanodomain complexes with presynaptic voltage-gated calcium channels. Thus, the functional properties of Kv3 channels at MFBs are tuned to both promote brevity of presynaptic APs limiting glutamate release and at the same time keep surface protein density of potassium channels low. Presynaptic BKCa channels are restricted to limit additional increases of the AP half-duration in case of Kv3 hypofunction, because rapid membrane repolarization by Kv3 combined with distant calcium sources prevent BKCa activation during basal APs.
Introduction
During the initial step of information transmission at chemical synapses, the presynaptic action potential (AP) governs calcium influx and therefore is one key determinant of synaptic strength (Augustine, 1990; Ma and Koester, 1996; Sabatini and Regehr, 1997; Borst and Sakmann, 1999; Geiger and Jonas, 2000). We have shown recently that the currents underlying the depolarization–repolarization sequence of the AP at glutamatergic hippocampal mossy fiber boutons (MFBs) are optimized with regard to immediate functional costs (Alle et al., 2009). Simulations predicted that the separation of sodium (Na+) and potassium (K+) currents is paralleled by comparatively low K+ conductance densities (GK), suggesting a minimized K+ channel protein density for any channel type. Individual K+ channel types and families, however, differ widely with respect to single-channel conductance, maximal open probability, steady-state availability (Coetzee et al., 1999; Dodson and Forsythe, 2004; Gutman et al., 2005), and recruitment in response to brief depolarizations (Baranauskas et al., 2003; Martina et al., 2007); thus, the protein density for a given conductance density could vary considerably.
According to anatomical data, candidate fast-activating K+ channels contributing to the repolarization of presynaptic MFB–APs are of the families Kv1, Kv3, and large-conductance calcium- and voltage-activated potassium channels (BKCa) (Kues and Wunder, 1992; Weiser et al., 1994; Veh et al., 1995; Knaus et al., 1996; Riazanski et al., 2001). Functional Kv1 channels were identified at MFBs, presumably containing Kv1.1 and Kv1.4 subunits and/or β-subunits (Geiger and Jonas, 2000). In heterologous expression systems, Kv1 exhibit small single-channel conductances compared with Kv3 and BKCa (Gutman et al., 2005; Wei et al., 2005). Functional properties and roles of Kv3, in turn, have not yet been described at MFBs or other hippocampal glutamatergic synapses; however, these channels play a unique role in AP repolarization at the glutamatergic calyx of Held (Ishikawa et al., 2003). In heterologous expression systems, Kv3 exhibit medium-sized single-channel conductances (Gutman et al., 2005), and, at the calyx, they have faster activation kinetics than Kv1 channels (Nakamura and Takahashi, 2007). BKCa exhibit the largest single-channel conductance of the candidate channel families (Wei et al., 2005). Their activation requires a sufficient and coincident elevation of membrane potential and intracellular calcium concentration, a requirement that could be met by close spatial interactions with voltage-gated calcium channels (Cav) (Fakler and Adelman, 2008).
Pharmacologically, it has been observed that 4-aminopyridine (4-AP), a broad-spectrum Kv channel blocker, can substantially increase EPSCs at the MFB–CA3 pyramidal neuron synapse at concentrations of 5–10 μm (Rutecki et al., 1987). Reported half-maximal inhibitory concentration values (IC50) for 4-AP of homomeric Kv1.1 [147 μm (Stephens et al., 1994)] and homomeric Kv1.4 [647 μm(Judge et al., 1999)] channels and the wide insensitivity of BKCa to 4-AP (Wei et al., 2005) raise the question whether K+ channel families other than Kv1 (Geiger and Jonas, 2000) and BKCa contribute to fast MFB–AP repolarization. Therefore, we set out to analyze fast-activating K+ channel families at the MFB and the relationships of their biophysical adaptations and protein densities required to perform basal presynaptic AP repolarization.
Materials and Methods
Slice preparation.
Three- to 4-week-old Wistar rats of either sex were anesthetized with isoflurane and decapitated according to institutional guidelines. Transverse 300-μm-thick hippocampal slices were cut using a custom-built vibratome. For dissection and storage of slices, a solution containing 80 mm NaCl, 25 mm NaHCO3, 1.25 mm NaH2PO4, 2.5 mm KCl, 25 mm glucose, 85 mm sucrose, 0.5 mm CaCl2, and 3 mm MgCl2, equilibrated with 95% O2 and 5% CO2, was used. Slices were incubated at 34°C for ∼30 min and subsequently stored at room temperature.
Recording solutions.
Slices were superfused with a physiological extracellular solution [artificial CSF (ACSF)] containing the following (in mm): 125 NaCl, 25 NaHCO3, 1.25 NaH2PO4, 2.5 KCl, 25 glucose, 2 CaCl2, and 1 MgCl2 (equilibrated with 95% O2 and 5% CO2). For standard whole-cell MFB (whole-MFB) recordings and standard outside-out patch recordings from MFBs, pipettes were filled with a solution containing the following (in mm) 155 KCl, 2 MgCl2, 10 HEPES, 0.2 EGTA, 2 Na2-ATP, 5 Na2-phosphocreatine, and 0.5 Na2-GTP. For outside-out patch recordings of Figure 6A (BKCa single-channel recordings), the internal solution contained no calcium chelator but added calcium of 1, 10, or 100 μm. The internal solution used in experiments of Figure 7, C and D, contained the following (in mm): 135 KCl, 2 MgCl2, 10 HEPES, 10 K4BAPTA or K4EGTA, 2 Na2-ATP, 5 Na2-phosphocreatine, and 0.5 Na2-GTP. That used in experiments of Figure 7F recording BKCa-mediated currents contained the following (in mm): 155 KCl, 10 HEPES, 10 NaCl, 0.1 EGTA, and 0.2 CaCl2, resulting in 0.1 mm steady-state free Ca2+. For postsynaptic CA3 pyramidal neuron recordings of Figure 1B, a solution containing 135 mm K-gluconate, 5 mm KCl, 2 mm MgCl2, 10 mm HEPES, 10 mm EGTA, and 2 mm Na2-ATP was used. The pH of intracellular solutions was set to 7.2. For MFB voltage-clamp recordings, ZD7288 (4-ethylphenylamino-1,2-dimethyl-6-methylaminopyrimidinium chloride) (10 μm; Tocris Bioscience) and XE991 [10,10-bis(4-pyridinylmethyl)-9(10H)-anthracenone dihydrochloride] (10 μm; Tocris Bioscience) (only experiments including long pulses) were added to the ACSF, XE991 was not present in experiments of Figure 6B–E, and TTX (1 μm; Tocris Bioscience) and 4-AP (varying concentrations, maximally 1 mm; Tocris Bioscience) were present when indicated. For CA3 pyramidal neuron recordings, 50 μm d-AP-5 (Tocris Bioscience) and 3 μm gabazine (Tocris Bioscience) were present in the ACSF. The HEPES-buffered ACSF for local drug application contained the following (in mm): 5 HEPES, 145 NaCl, 1.25 NaH2PO4, 2.5 KCl, 25 glucose, 1.8 CaCl2, and 1 MgCl2, pH adjusted to 7.35 with NaOH. From stocks made of distilled water, blood-depressing substance I (BDS-I) (final concentration in HEPES–ACSF, 3 μm), α-dendrotoxin (DTX) (0.2 or 1 μm), iberiotoxin (IBTX) (3 μm), ω-agatoxin (1 μm), ω-conotoxin (3 μm) (all from Alomone Labs), paxilline (Pax) (10 μm; Tocris Bioscience), and NiCl2 (200 μm) were added to the HEPES–ACSF, and DTX was added to the ACSF in bath-application experiments. The calcium current shown in Figure 6F was recorded according to Li et al. (2007), albeit at 34°C.
Figure 6.
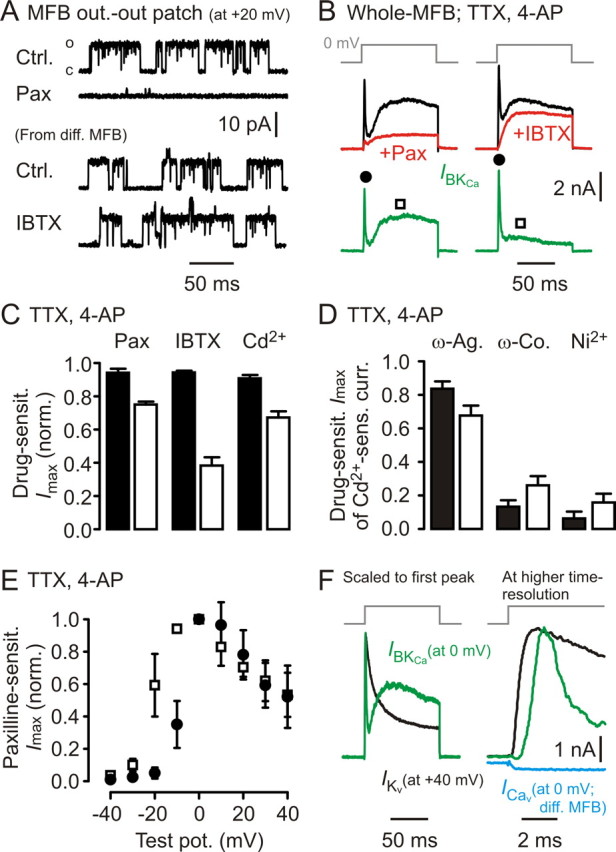
Two populations of presynaptic BKCa channels can be distinguished electrophysiologically at MFBs. A, Outside-out patches drawn from MFBs (steady state at +20 mV) exhibit large single-channel openings that are sensitive to Pax but not to IBTX. Ctrl, Control. B, Long depolarizing voltage steps to 0 mV in the whole-cell recording configuration reveal Pax- and IBTX-sensitive BKCa channel-mediated currents (green) composed of two kinetically distinct components. C, Summary of Pax (n = 4), IBTX (n = 7), and cadmium (Cd2+, n = 7) sensitivity for recordings as shown in B (filled bars, first, fast activating/fast inactivating component; open bars, second, slowly activating/persistent component; see also filled dots and open squares in B). D, ω-Agatoxin, ω-conotoxin, and Ni2+ sensitivity (each n = 6) of currents as recorded in B (bar code as in C). E, Voltage dependence of first, fast activating/fast inactivating component (open squares), and of second, slowly activating/persistent component (filled circles; n = 3). F, Left, Comparison of example Kv-mediated current kinetics (black trace) and BKCa-mediated current kinetics (green trace: Cd2+-sensitive current); traces scaled to the same peak amplitude. Note the extremely fast inactivation of IBKCa. Right, Same traces at higher temporal resolution. Blue trace represents example Cav-mediated current recorded in a separate MFB. Vertical scale bar applies to BKCa- and Cav-mediated currents.
Figure 7.
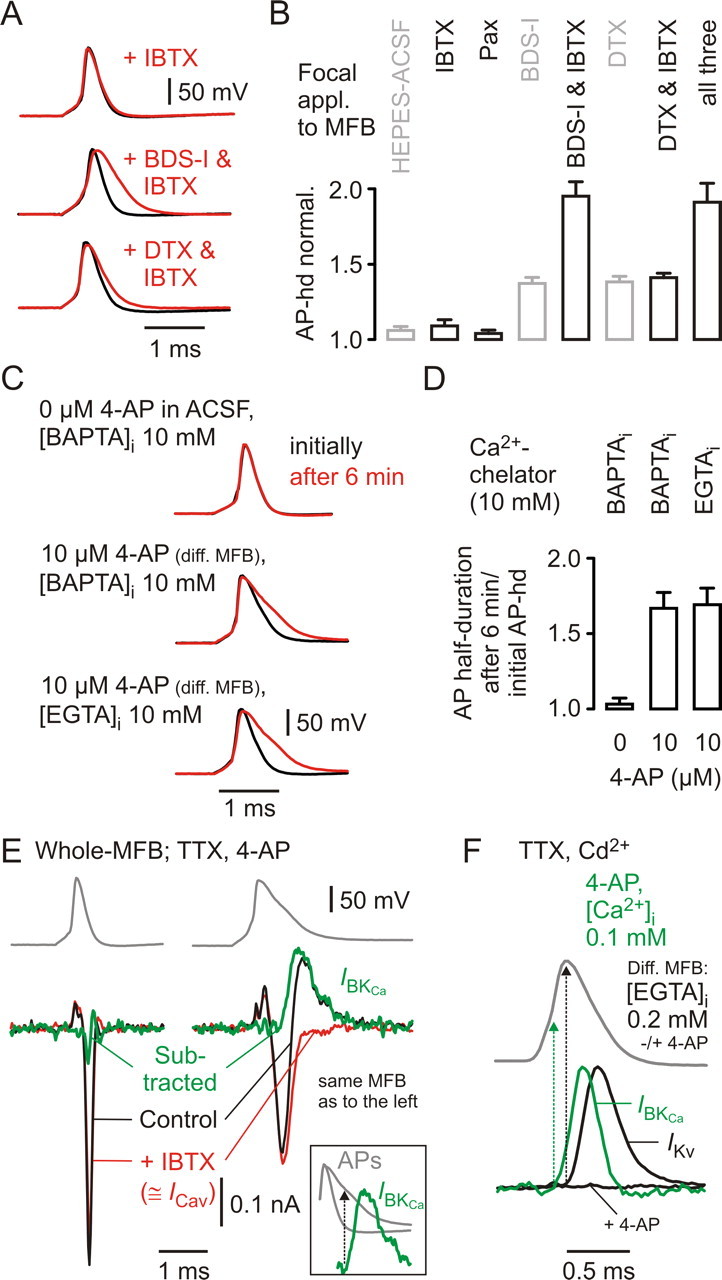
BKCa channels do not activate during basal MFB–APs, and their calcium source is remote. A, Focal application of IBTX (1 μm), BDS-I (3 μm) + IBTX, or DTX (0.2 μm) + IBTX to different (diff.) MFBs while recording APs generated by local current injection. Black traces, Baseline; red traces, during drug application. B, Collected data for changes of MFB–AP half-durations (AP-hd) during focal application of IBTX (n = 4), Pax (n = 4), BDS-I + IBTX (n = 3), DTX + IBTX (n = 4), and all three drugs simultaneously (n = 3) (in black), including data from Figure 1C (in gray) for comparison. C, Recordings of locally elicited MFB–APs in ACSF (top) or in ACSF containing 10 μm 4-AP (middle and bottom) with 10 mm BAPTA (top and middle) or 10 mm EGTA (bottom) in the intracellular solution. Black traces represent APs recorded immediately after establishing the whole-cell configuration; red traces represent APs recorded after 6 min in the whole-cell configuration. D, Changes in MFB–AP half-durations after 6 min recording time relative to those determined initially for experiments in ACSF and 10 mm BAPTA (left; n = 3), in ACSF containing 10 μm 4-AP and intracellularly 10 mm BAPTA (middle; n = 4) or 10 mm EGTA (right; n = 4). E, Top traces, MFB–AP-wave commands with different half-durations (left, basal MFB–AP; right, AP-hd, ∼700 μs), applied in TTX (1 μm), 4-AP (1 mm), and with 0.2 mm EGTA in the intracellular recording solution. Both waveforms were applied to an individual MFB. Bottom, Corresponding current traces in control and after focal application of IBTX (1 μm; red traces). Subtracted traces (control-IBTX) shown in green (IBKCa, BKCa-mediated current). ICav, Voltage-gated calcium channel-mediated current. Inset shows overlay of both AP waveforms and the BKCa-mediated current in response to the broad AP. Arrow indicates membrane potential of broad AP, at which IBKCa sets on. F, Top, Wave command of basal MFB–AP. Bottom, BKCa-mediated current (IBKCa, green) recorded in the presence of TTX, Cd2+, and 1 mm 4-AP, using an intracellular solution containing 0.1 mm free Ca2+. Black traces represent recordings from a different MFB in TTX and Cd2+ using an intracellular solution containing 0.2 mm EGTA, before (IKv, Kv-mediated current) and after bath application of 1 mm 4-AP. Arrows indicate respective membrane potentials, at which currents set on.
Figure 1.
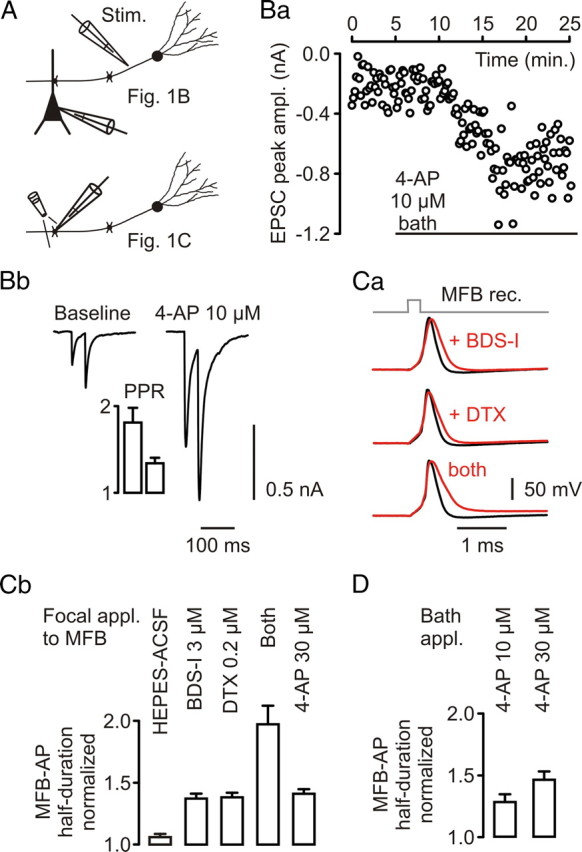
Presynaptic AP repolarization at hippocampal MFBs is performed by both Kv1 and Kv3 channels. A, Experimental configurations for experiments in B and C. Top, Extracellular stimulation (Stim.) of mossy fibers, recording from CA3 pyramidal neuron. Bottom, Recording from MFB, focal application of drug. Ba, CA3 pyramidal neuron EPSC peak amplitudes plotted over time. Bar indicates application of 10 μm 4-AP. Bb, Respective averaged current traces taken from baseline and versus end of drug application. Bar graph, Change in paired-pulse ratio (PPR) for this experiment. Left bar, Baseline; right bar, during drug application. Ca, Focal application of BDS-I (3 μm), DTX (0.2 μm), and both drugs simultaneously to different MFBs while recording APs generated by local current injection (baseline, black traces; during drug application, red traces). Cb, Collected data for changes of MFB–AP half-duration during focal application of the carrier solution alone (HEPES-buffered ACSF; n = 5), BDS-I (n = 4), DTX (n = 4), both drugs simultaneously (n = 3), and 4-AP (30 μm; n = 4). D, Changes in MFB–AP half-duration after bath application of 4-AP (10 and 30 μm; each n = 4).
Electrophysiology.
Patch pipettes for MFB and CA3 pyramidal neuron recordings were pulled from borosilicate glass tubing having an outer diameter of 2 mm and inner diameters of 0.6 and 1 mm, respectively, resulting in open tip resistances of 5–7 and 2–4 MΩ. Recordings were made at either 33–34°C (Figs. 1B–D, 2, 3A, 6, 7) or 36–37°C (Figs. 3B, 4, 5). Voltage-clamp recordings were made using an Axopatch 200 B (Molecular Devices), for experiments at 33–34°C, the recorded signal was filtered at 10 kHz (internal filter) and sampled at 40 kHz. For recordings at 36–37°C, the internal filter was bypassed, and an external eight-pole Bessel low-pass filter was set to 25 kHz and sampled at 100 kHz; the delay introduced by the external filter was 20 μs. For the P/4 protocols recording AP-wave-evoked currents, a previously recorded MFB–AP was used (at respective temperature). For long voltage steps, the respective protocols are indicated in the figures. In outside-out patch recordings from MFBs except that of Figure 6A, a 50 ms prepulse to −120 mV was applied. In whole-MFB recordings, initial uncompensated series resistance ranged from 20 to 30 MΩ, series resistance compensation was set to 95%, and lag was 7–10 μs; no prepulse was applied before the AP waveform. The holding potential in the voltage-clamp mode was set to −80 mV for MFB recordings and to −60 mV for CA3 pyramidal neuron recordings.
Figure 2.
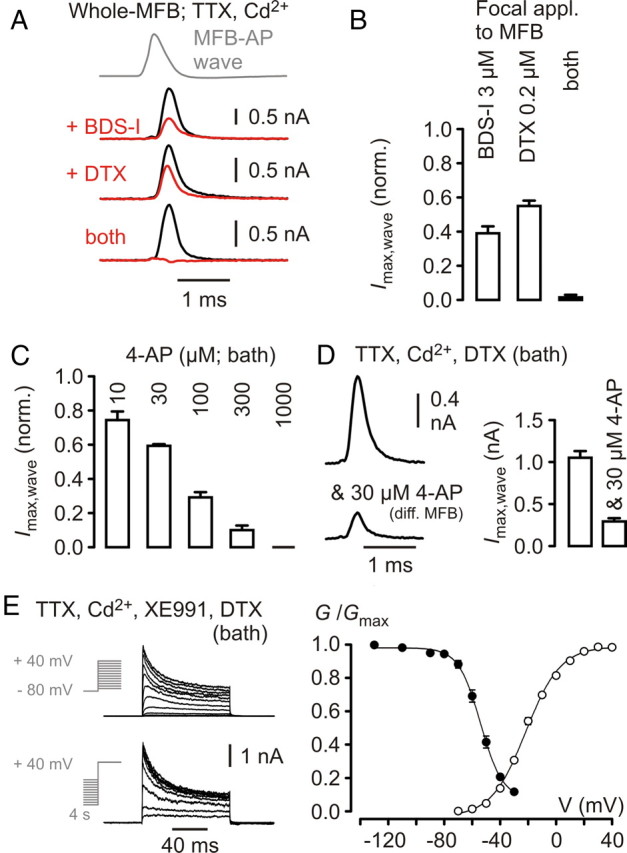
Kv3 channel-mediated currents dominate during the MFB–AP waveform. A, Top, MFB–AP voltage waveform applied to MFBs. Second to last line of traces, K+ currents before (black) and during (red) application of drugs as indicated. Concentrations used as in Figure 1C. B, Collected data for the AP-wave-evoked K+ current peak amplitude during drug application normalized to baseline (each n = 4). C, Collected data for the AP-wave-evoked K+ current peak amplitude during bath application of 4-AP at concentrations as indicated above the bars, normalized to baseline (n = 3–12). D, Left, Top, Representative average trace of AP-wave-evoked K+ currents in the presence of DTX (bath; 0.2 μm); left, bottom, different MFB recording in the presence of DTX and 30 μm 4-AP (bath). Right, Summary of peak current amplitudes in the two conditions (different sets of experiments; n = 16 and 9). E, Left, K+ currents in DTX (bath; 0.2 μm) in response to the voltage step protocols indicated. Right, Relative K+ conductance as function of test potential (open circles; n = 9) and of conditioning prepulse potential (filled circles; n = 5) in DTX.
Figure 3.
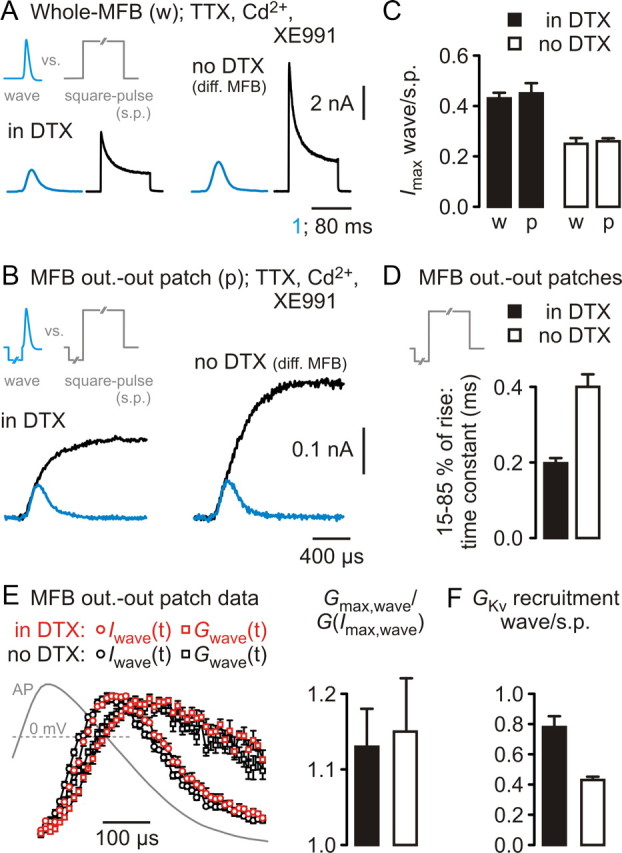
Kv3 are better recruited during MFB–AP waves than Kv1. A, Top, MFB–AP-wave command and square-pulse command applied in the whole-MFB configuration (w). Bottom, Left, K+ current traces from recordings in DTX; right, K+ current traces from recordings without DTX. Responses to the MFB–AP wave on the respective left side of the two drug conditions (blue traces). The 1 ms timescale applies to MFB–AP wave experiments and 80 ms timescale to square-pulse experiments. B, Top, MFB–AP-wave command and square-pulse command applied to outside-out patches (p) from MFBs. Bottom, Left, K+ current traces from recordings in DTX; right, K+ current traces from recordings without DTX. Responses to the MFB–AP wave (blue traces) were overlaid on the responses to the square pulse and aligned to the rising phase. C, Collected data from experiments as in A and B, displaying the ratio of peak current amplitudes obtained in response to the MFB–AP wave and to the square pulse (p, outside-out patch; w, whole-MFB). D, Time constants of a simple exponential function fitted to the rising phase (15–85% of peak amplitude) of current responses to the square pulse as in B from five (in DTX) and four (without DTX) experiments. E, Left, Time course of MFB–AP-wave-evoked K+ currents [Iwave(t), circles] and derived K+ conductances [Gwave(t), squares] from experiments in DTX (red symbols; n = 5) and without DTX (black symbols; n = 8), using the outside-out patch configuration. AP superimposed. Right, Ratio of the maximal K+ conductance during the MFB–AP (Gmax,wave) and the conductance at the peak of the K+ current [G(Imax,wave)] during the MFB–AP. Filled bar, Experiments in DTX; open bar, experiments without DTX. F, Fractions of conductances at resting membrane potential that become activated during an MFB–AP. s.p., Square pulse; filled bar, experiments in DTX; open bar, experiments without DTX.
Figure 4.

Kv3 exhibit a higher single-channel conductance than Kv1 at MFBs. A, Left, Top, Square-pulse protocol to elicit K+ currents in MFB outside-out patches. Middle, Superimposed individual current responses. Average current trace superimposed in white. Small residual capacitance compensation artifacts were blanked. Left, Bottom, Traces obtained by subtracting the average trace from the individual traces. Right, Nonstationary fluctuation analysis performed on K+ currents displayed on the left. N, Number of channels per patch; i, single-channel current; γ, single-channel conductance; Po.m., maximal open probability. Continuous line indicates parabolic fit to data points. B, Collected data for parameters obtained from nonstationary fluctuation analysis (filled bars, experiments in DTX, n = 12; open bars, experiments without DTX, n = 9). C, Approximate ratios of steady-state availability at resting membrane potential, recruitment by the MFB–AP, single-channel conductance γ, and maximal open probability Po.m. for Kv3 and Kv1 channels at MFBs.
Figure 5.
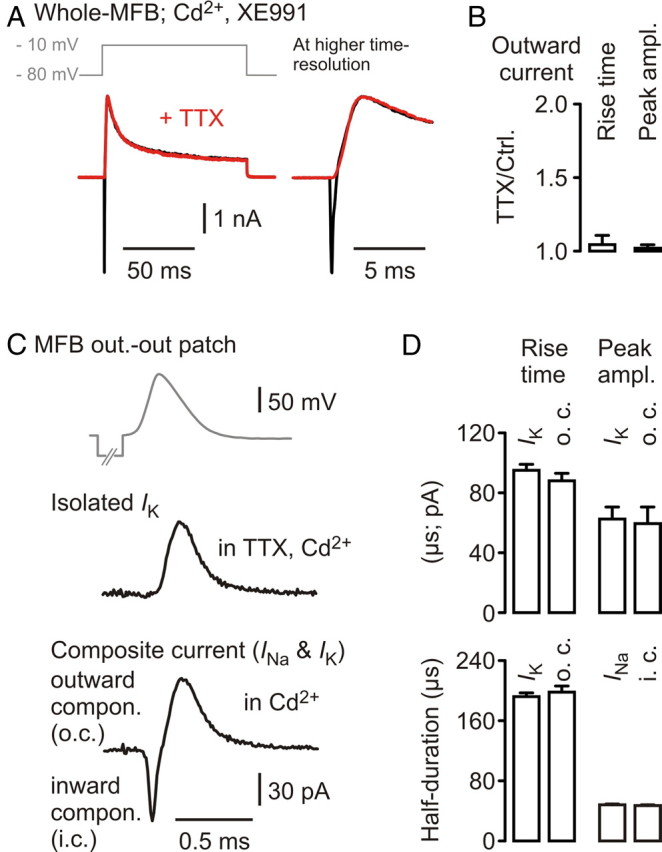
Absence of Na+-activated K+ channel-mediated currents at MFBs. A, Top, Voltage protocol applied to an MFB. Bottom, Current traces before (black) and after (red) wash-in of 1 μm TTX. Right, Same traces at higher temporal resolution. B, Collected data for current rise time and peak amplitude of four experiments of the kind in A, normalized to baseline. C, Top, MFB–AP wave applied to outside-out patches of MFBs. Middle, Averaged compound Kv current, isolated in TTX and Cd2+. Bottom, Composite current consisting of an inwardly directed Na+ and an outwardly directed K+ current component. Different MFB. D, Collected data of each eight recordings of isolated and composite currents as in C displaying rise times, peak current amplitudes, and half-durations.
For current-clamp recordings, a Multiclamp 700A was used, the internal filter was set to 20 kHz (33–34°C) or 30 kHz (36–37°C), and sampling frequency was 40 kHz (33–34°C) or 100 kHz (36–37°C); bridge-balance series resistance compensation was used. Data acquisition was performed using ClampEx 8.2 (Molecular Devices).
MFBs in the stratum lucidum of hippocampal CA3 were identified as reported previously (Geiger and Jonas, 2000; Alle et al., 2006). For extracellular stimulation of mossy fibers in the hilus, a patch pipette containing HEPES-buffered ACSF was used.
In experiments shown in Figure 5C (composite INa and IK currents), the total duration of the recording (going whole-MFB, establishing the outside-out patch configuration and recording currents) was <3 min to preserve possible sodium-activated K+ channel (KNa)-mediated currents in outside-out patches (Egan et al., 1992).
Data analysis.
All analyses of traces were done with ClampFit 10 (Molecular Devices). The paired-pulse ratio (see Fig. 1B) was calculated as ratio of the peak amplitudes of EPSC2 and EPSC1, with the peak amplitude measured from the current level immediately preceding the respective EPSC. The MFB–AP half-duration was determined as the time between rise and decay of the AP at 50% of the AP amplitude from a baseline of −80 mV and amounted to 312 ± 6 μs (n = 32) in control conditions (basal APs) at 33–34°C (at 36–37°C, the AP half-duration is ∼250 μs) (Alle et al., 2009). The baseline peak amplitude of the Kv-mediated currents in experiments bath applying 4-AP (see Fig. 2C) was multiplied by a factor of 0.86 to correct for a decrease over the standardized wash-in time (reduction to 0.86 ± 0.06 of initial amplitude; n = 4).
The data points obtained in activation and steady-state inactivation experiments (see Fig. 2E) were fitted using a Boltzmann sigmoidal function of the form y = bottom + (top − bottom)/(1 + exp((V1/2 − x)/slope)), where y is G/Gmax, x is the test potential or conditioning potential, and V1/2 is the membrane potential at which half of the conductance was activated or inactivated. For inactivation curves, the slope value resulting from a fit to this equation is negative; however, in text the absolute value is given.
The recruitment of the DTX-sensitive current component from whole-MFB data was calculated as (Imax,wave − Imax,wave DTX)/(Imax,s.p. − Imax,s.p. DTX) = 0.41 ± 0.15 nA/3.4 ± 0.54 nA ≈ 0.11 ± 0.01, where s.p. was the square pulse [given: means A, B with errors a, b; to be calculated: C with error c of the difference A − B and of the ratio A/B; C = A − B and c = Sqrt(a2 + b2); and C = A/B and c = C Sqrt((a/A)2 + (b/B)2), where Sqrt is “square root of”)]. To calculate the conductance recruitment MFB–AP wave versus square pulse, the current traces recorded from outside-out patches at 36–37°C in response to the MFB–AP wave were at first shifted 20 μs to the left, correcting the time lag introduced by the external filter. Then, the mean ± SEM of averaged current traces, which were normalized to the maximal amplitude, was determined for each time (i.e., sampling) point across experiments (see Fig. 3E, left). The MFB–AP wave-activated conductance at a time point t was calculated as Gwave(t) = Iwave(t)/(U(t) − Urev), with Urev = −100 mV.
The maximally recruited conductance (i.e., the fraction of available conductance activated or the channels opened by the AP compared with the square pulse) (see Fig. 3F) was calculated as wave/s.p. = f G(Imax,wave)/Gmax,s.p., with f = Gmax,wave/G(Imax,wave) (see Fig. 3E, bars on the right) to correct for the difference of time points of maximal conductance and current (see Fig. 3E, left), and with G(Imax,wave) = Imax,wave/(U(Imax,wave) − Urev). The maximal square-pulse-activated conductance was taken as Gs.p. = Imax,s.p./(U(Imax,s.p.) − Urev), with U(Imax,s.p.) = +40 mV. The value for the Kv1-mediated conductance was estimated as Kv1-mediated current recruitment of ∼0.11, multiplied with 0.43/0.26 (Grecruitment/Irecruitment of mixed Kv) or 0.78/0.45 (Grecruitment/Irecruitment of the Kv3 component) ≈ 0.18 or 0.19, indicating a low recruitment of Kv1 channels during the MFB–AP.
The fit function used to describe the data in Figure 4A–C for the nonstationary fluctuation analysis was σ2(I) = iI − I2/N + σ02. σ represents variance, I the mean current, i the single-channel current, N the number of channels in the patch, and σ02 the variance of the baseline noise (Sigworth, 1980; Li and Jonas, 2007). The analysis was performed for the first millisecond after the onset of the current in response to the square pulse.
For channels composed of Kv1.1 subunits, γ was reported to be 10 pS (Ji et al., 2002) and 5 pS for Kv1.4 (Stühmer et al., 1989). In contrast, for channels composed of Kv3.1, γ was reported to be 27 pS (Grissmer et al., 1992) and 14 pS for Kv3.4 (Schröter et al., 1991; Rettig et al., 1992). These values were determined at room temperature; assuming a Q10 of ∼1.4 for open channel conductances (Hille, 2001) and a ΔT of 14 K, they would amount to 16 and 8 pS for Kv1 and 43 and 22 pS for Kv3 at 37°C, the latter values being consistent with 34 pS obtained from recordings in DTX isolating the Kv3 component. The extrapolated values for γ of Kv1 channels may justify the assumption of 17 pS in our calculations on the relative repolarization efficacy. The considerable difference in single-channel conductances of Kv1 and Kv3 channels might reflect adaptations to their respective membrane potential working ranges.
The number of channels per MFB was estimated from the relationships Gmax,wave = f Imax,wave/(U(Imax,wave) − Urev); thus, the respective AP-wave-activated peak conductances are ∼7 and 11 nS for Kv1 and Kv3, respectively. Furthermore, the number of channels n per MFB amounts to Gmax,wave/(availability recruitment γ Po.m.), where Po.m. is maximal open probability; thus, for n(Kv1)/MFB = 7 nS/(0.75 * 0.2 * 17 pS * 0.7) ∼ 3922/MFB, for n(Kv3)/MFB = 11 nS/(0.94 * 0.79 * 34 pS * 0.7) ∼ 609/MFB, and in case of a single population consisting only of Kv1 channels, n(Kv1 only)/MFB = 17.3 nS/(0.75 * 0.2 * 17 pS * 0.7) ∼ 9692/MFB; 17.3 nS = 1.15 * 1.46 nA/(0.097 V).
The homogeneously distributed, AP-wave-activated peak K+ conductance density was determined from the respective current recorded in the whole-MFB configuration: Gmax,wave = f Iwave,max/((U(Imax,wave) − Urev) * Area) = 1.15 * 1.46 nA/(0.097 V * 180 μm2) = 96 pS/μm2 = 9.6 mS/cm2, assuming the average entire surface of MFBs (including filopodial extensions), which were selected for presynaptic voltage-clamp recordings to be ∼180 μm2 (i.e., large boutons) (Alle and Geiger, 2006; Alle et al., 2009).
In the experiments of Figure 7, C and D, APs were recorded for 6 min starting from break-in and immediate switch to current clamp (AP half-duration stabilized after 3–5 min in the conditions of 10 μm 4-AP and 10 mm calcium chelator). The onset of BKCa- and Kv-mediated currents (IBK and IKv) (see Fig. 7F and text) was determined by visual inspection of the respective average traces.
Membrane potential values for MFB recordings are given without correction for the error introduced by the liquid junction potential of the KCl-based internal solutions (∼3 mV). Statistical tests and fits to data points in Figure 2E were performed using Prism 4 (GraphPad Software). To assess statistical significance, the Mann–Whitney U test was used. Data in the text are given as mean ± SEM, and error bars in the figures also represent SEM.
Results
Kv1 and Kv3 contribute to fast MFB–AP repolarization
The experiment shown in Figure 1B replicates the observation of Rutecki et al. (1987) with respect to the effect of 10 μm 4-AP on CA3 pyramidal neuron EPSCs evoked by mossy fiber stimulation (Fig. 1A). In five experiments, the peak amplitude of EPSCs increased by a factor of 2.16 ± 0.37, whereas the paired-pulse ratio (EPSC2/EPSC1) decreased from 1.86 ± 0.26 to 1.45 ± 0.11, consistent with a presynaptic effect, as it was found for 10 μm 4-AP-induced increases of synaptic transmission at the CA3–CA1 pyramidal neuron synapse (Qian and Saggau, 1999).
To study the potential contribution of Kv3 and Kv1 channels to basal AP repolarization, we applied BDS-I, a Kv3 channel-selective gating modifier (Yeung et al., 2005), and/or DTX, a Kv1-selective channel blocker, focally to the MFB while recording APs evoked by local current injection (Fig. 1A,C). BDS-I (3 μm) increased the MFB–AP half-duration to 1.37 ± 0.04 (n = 4), DTX (0.2 μm) to 1.38 ± 0.03 (n = 4), and BDS-I (3 μm) plus DTX (0.2 μm) to 1.97 ± 0.15 (n = 3) of control (Fig. 1C). BDS-I at 0.5 μm prolonged the AP half-duration to 1.22 ± 0.02 (n = 4) and DTX at a concentration of 1 μm to 1.40 ± 0.07 (n = 4) of control (data not shown). Application of the HEPES-buffered ACSF carrier solution without toxins prolonged the AP half-duration to 1.06 ± 0.02 of control (n = 5) (Fig. 1C). Furthermore, we tested the 4-AP sensitivity of AP repolarization in MFBs. Focal application of 30 μm 4-AP increased the AP half-duration to 1.41 ± 0.03 (n = 4) (Fig. 1C). Bath application of 10 μm 4-AP broadened the MFB–AP to 1.28 ± 0.06 (n = 4) and 30 μm 4-AP to 1.46 ± 0.07 (n = 4) of control (Fig. 1D). In summary, BDS-I, DTX, and 10–30 μm 4-AP prolonged the half-duration of MFB–APs. Consistent with the BDS-I effect on the MFB–AP repolarization, we found that BDS-I (1 μm bath application) increased CA3 pyramidal neuron EPSCs evoked by mossy fiber stimulation to 1.89 ± 0.05 of control (n = 2) (data not shown).
Kv3 dominate the AP-wave-evoked presynaptic K+ current
To evaluate the relative current contributions by these two different K+ channel types during presynaptic APs at MFBs, we applied a previously recorded AP to MFBs in the whole-cell voltage-clamp recording configuration (Fig. 2A) (Alle et al., 2009). Focal application of BDS-I (3 μm) to the recorded MFB reduced the compound K+ current to 0.39 ± 0.04 (n = 4) and DTX (0.2 μm) to 0.55 ± 0.03 (n = 4) of control (Fig. 2A,B). Simultaneous focal application of both toxins at the above concentrations blocked the K+ current to 0.015 ± 0.015 (n = 4) (Fig. 2A,B) of control, indicating that the AP-wave-evoked current consisted of an entirely DTX-sensitive Kv1 and a larger Kv3 current component contributing to AP repolarization. AP-wave-evoked K+ currents in ACSF had peak amplitudes of 1.46 ± 0.13 nA (n = 16) and in separate experiments in ACSF containing 0.2 or 1 μm DTX of 1.05 ± 0.08 nA (n = 16; group comparison DTX vs ACSF: p < 0.001; block by 0.2 μm DTX, n = 7, vs 1 μm DTX, n = 9, was not different: p > 0.1, group comparison).
In contrast, presynaptic Kv3-mediated currents evoked by square-pulse depolarizations (≥30 ms to +40 mV) in DTX (0.2 μm) amounted to only ∼40% of the compound Kv current peak amplitudes in ACSF (2.5 ± 0.2 nA in DTX vs 5.9 ± 0.5 nA in ACSF, each n = 16; group comparison DTX vs ACSF: p < 0.001; block by 0.2 μm DTX, n = 7, vs 1 μm DTX, n = 9, was not different: p > 0.5, group comparison). Together, the contribution of Kv3 channels to the AP-wave-evoked K+ current at MFBs is larger than that of Kv1 channels, in contrast to their respective maximal conductances as indicated by the peak current amplitudes evoked by long depolarizing pulses.
The observed high 4-AP sensitivity of the AP repolarization at MFBs (Fig. 1C,D) raised the question on the 4-AP sensitivity of AP-wave-evoked currents. Bath application of 10 μm 4-AP reduced the peak amplitude of the AP-wave-evoked compound K+ current to 0.74 ± 0.05 (n = 4), 30 μm to 0.59 ± 0.01 (n = 4), and 100 μm to 0.29 ± 0.03 (n = 3) of control (Fig. 2C) (see Materials and Methods). 4-AP at 1 mm completely blocked the AP-wave-evoked compound K+ current (0.0 ± 0.0, n = 12) (Fig. 2C) (Alle et al., 2009). Experiments performed in ACSF containing 0.2 μm DTX and 30 μm 4-AP revealed a mean AP-wave-evoked K+ current peak amplitude of 0.29 ± 0.04 nA (n = 9) (Fig. 2D); thus, additional 30 μm 4-AP reduced the isolated Kv3-mediated current component by >50% compared with currents recorded in ACSF containing only DTX (see above; group comparison: p < 0.001). This indicates that 30 μm 4-AP is an upper boundary for the IC50 value of the Kv3-mediated component.
Isolated Kv3-mediated currents at MFBs inactivated markedly (Fig. 2E, left) (in ACSF containing 1 μm DTX). The respective activation and steady-state inactivation properties of the Kv3 channels are shown in Figure 2E. The midpoint potentials and slope factors were −21.6 ± 0.8 mV and 12.3 ± 0.7 (n = 9) for activation, very similar to data for Kv3.1/3.4 subunit containing channels expressed in HEK293 cells (Baranauskas et al., 2003), and −54 ± 0.5 mV and 8 ± 0.5 (n = 5) for inactivation, respectively.
The percentage of available channels at a membrane potential of −80 mV was 94 ± 2% for Kv3 (Fig. 2E), whereas that for the mixed population of Kv1 and Kv3 amounted to ∼75% in a previous study (Geiger and Jonas, 2000), indicating an even lower fraction of available Kv1 channels. In addition, experiments in ACSF containing DTX (0.2 μm) revealed that the membrane potential of MFBs was found to be between −65 and −70 mV (measured immediately after establishing the whole-cell recording configuration) (our unpublished observations) compared with between −75 and −80 mV in ACSF (Geiger and Jonas, 2000; Alle and Geiger, 2006); in experiments using ACSF that contained 10 μm 4-AP, the resting membrane potential determined immediately after break-in was unaffected, consistent with the steady-state activation properties of Kv3 channels (Fig. 2E).
Highly different Kv1 and Kv3 channel recruitment during the MFB–AP
Having identified Kv1 and Kv3 channels as fast-activating voltage-gated K+ channel types becoming opened during basal presynaptic MFB–APs, we analyzed the fraction of the respective conductances at resting membrane potential that are activated by the AP, i.e., the recruitment of available channels. Recently, a surrogate parameter for this functional property has been determined, the current recruitment, calculated as the ratio of AP-wave-evoked versus square-pulse-evoked K+ current peak amplitude (Baranauskas et al., 2003; Martina et al. 2007). The current recruitment for the Kv3-mediated component amounted to 0.43 ± 0.02 in whole-MFB recordings (n = 16) and to 0.45 ± 0.04 in outside-out patch recordings (n = 4) (Fig. 3A–C), very similar to data for Kv3.1/3.4 heteromeric channels expressed in HEK293 cells (Baranauskas et al., 2003). The Kv1 current component at MFBs cannot be isolated at present, because there is no pharmacological tool available to selectively block Kv3 channels. BDS-I slows gating (Yeung et al., 2005) but in fact is not “blocking” Kv3 channels, thus having negligible effects on the peak amplitude of currents in response to long depolarizing pulses (Martina et al., 2007). Therefore, we compared the results of the isolated Kv3 component with that of the compound K+ channel population (Kv1 and Kv3). The recruitment of the compound K+ current by the MFB–AP amounted to 0.25 ± 0.02 in the whole-MFB configuration (n = 16) and to 0.26 ± 0.01 in the MFB outside-out patch configuration (n = 4; compared with Kv3 whole-MFB: p < 0.0001) (Fig. 3A–C). The current recruitment related specifically to Kv1 channels can be estimated from whole-MFB data by subtracting average peak current amplitudes obtained in DTX and ACSF (different sets of experiments; see Materials and Methods); this revealed a recruitment ratio of 0.11 ± 0.01.
To link the current recruitment to the conductance recruitment, information about the exact K+ current time course as function of the membrane potential during the AP is needed. Therefore, we analyzed K+ currents obtained in response to an MFB–AP waveform in DTX and without DTX in the outside-out patch recording configuration (Fig. 3E, left). In DTX, the membrane potential at the peak of the K+ current was −10 ± 2 mV (n = 5), and the calculated ratio of AP-wave-activated peak conductance and conductance at the peak of the K+ current Gmax,wave/G(Imax,wave) amounted to f = 1.13 ± 0.04 (Fig. 3E, right). Similar experiments without DTX (n = 8) (data from Alle et al., 2009) yielded results of −3 ± 2 mV and f = 1.15 ± 0.07 (Fig. 3E, right). From these data, we calculated the fraction of available channels opened by the MFB–AP (see Materials and Methods). For the Kv3 channels, the recruitment amounted to 0.79 ± 0.07 (n = 5) (Fig. 3F) and for the compound Kv to 0.43 ± 0.02 (n = 4) (Fig. 3F). An estimate performed similarly to the Kv1 current recruitment resulted in conductance recruitment values for Kv1 channels at the MFB of 0.18–0.19, thus being four times less than that for the Kv3 component.
One likely explanation for this very different recruitment behavior of Kv1 and Kv3 channels at hippocampal MFBs is the different activation kinetics of the two channel types as observed, e.g., at the calyx of Held (Nakamura and Takahashi, 2007). Probably as a result of limited resolution at the small current amplitudes in outside-out patch recordings when applying the MFB–AP waveform, there was no appreciable difference in the current or conductance kinetics between the condition in DTX and without DTX (Fig. 3B,E). A clear difference, however, was observed for the rising phase of the currents in response to long depolarizing square pulses (Fig. 3B). The time constant of an exponential function fitted to the rising phase between 15 and 85% of maximal current amplitude was 198 ± 12 μs (n = 5) for the Kv3-mediated current and 400 ± 33 μs (n = 4; p < 0.02) (Fig. 3D) for the compound K+ current. Together, Kv3 channels are recruited four times better than Kv1 channels at hippocampal MFBs in response to an AP-wave-like depolarization.
Single-channel conductance of Kv3 channels keeps total presynaptic Kv density low
To address whether single-channel properties of Kv3 channels at MFBs are adapted to high membrane conductance states during APs in addition to their high availability at negative membrane potentials and good recruitment by the AP, we performed nonstationary fluctuation analysis of Kv3-mediated currents in DTX (Fig. 4A). Again, we compared these results with experiments done without DTX, being aware that this is only a tentative indication of Kv1 channel properties (Fig. 4B). The single-channel conductance γ of the Kv3 component amounted to 34 ± 5 pS and the maximal open probability Po.m. to 0.70 ± 0.04 (n = 12) (Fig. 4A,B). The apparent single-channel conductance γ of the mixed population of Kv3 and Kv1 channels was 20 ± 2 pS, and the apparent maximal open probability Po.m. was 0.70 ± 0.02 (n = 9). Both the single-channel conductance and the number of channels per outside-out patch were significantly different (p < 0.05), whereas the maximal open probability was not different (p > 0.8) (Fig. 4B). The comparatively large number of Kv3 channels per patch in DTX (Fig. 4 B) could have resulted from selection of patches with large peak current amplitudes in these experiments or channel clustering with clusters of different subfamilies having different localizations at and around the MFB (for Kv1.4-subunit-containing channels in mossy fibers, see Cooper et al., 1998). Taking availability, recruitment, single-channel conductance, and maximal open probability into account, we estimate that Kv3 channels at MFBs have an ∼10 times higher AP repolarization efficacy per channel than Kv1 channels (Fig. 4C).
How do these highly different repolarization efficacies translate into physical densities of channels necessary to perform the AP repolarization? Taking the contribution of Kv1 and Kv3 channels to the MFB–AP-wave-evoked peak current amplitude as ∼0.4 and ∼0.6 (Fig. 2A) and the K+ current peak amplitude in MFBs as 1.46 nA, then the absolute contributions are 0.58 and 0.88 nA, respectively. Accordingly, the AP-wave-activated peak conductances GAP are ∼7 and 11 nS. The number of channels per MFB necessary to achieve these AP-wave-activated conductances amounts to ∼3900/MFB or ∼22/μm2 for Kv1 channels, assuming the single-channel conductance to be half of that of Kv3 channels (see Materials and Methods), and for Kv3 to ∼600/MFB or 3.3/μm2 (for densities in channels per square micrometer, a homogeneous channel distribution across the MFB surface was assumed). What if the repolarization of the MFB–AP as observed in control conditions would have to be performed solely by Kv1 channels? Ignoring the slower activation kinetics and longer activation delay of the Kv1 channels at MFBs compared with the Kv3 channels (Fig. 3B), at least ∼9700 Kv1 channels per MFB or 54/μm2 ought to be present, comparable with the number of 41 Nav channels/μm2 at MFBs (Engel and Jonas, 2005). In consequence, the additional expression of Kv3 channels at hippocampal MFBs reduces the number of fast-activating K+ channels necessary to achieve the maximal MFB–AP-wave-activated K+ conductance density for fast repolarization by ∼50%.
Lack of evidence for Na+-activated K+ channels at MFBs
The experimental conditions used to evaluate the contribution of both Kv1 and Kv3 to the AP-wave-evoked compound K+ current (TTX, cadmium) (Fig. 2A,B) might have obscured the contribution of other fast-activating K+ channels, especially KNa or BKCa. This could also explain the modest increase of the MFB–AP half-duration in current-clamp recordings in response to focal application of DTX or BDS-I (Fig. 1C).
To test for the presence of KNa channels, we used a protocol to maximally activate currents mediated by these channels (Hess et al., 2007) in whole-MFB recordings (Fig. 5A). However, the K+ outward current did not differ from that in TTX (Fig. 5 A,B) (n = 4). In addition, we compared K+ currents obtained in TTX and cadmium (data from Alle et al., 2009) with the outward current component of currents obtained in experiments without TTX (Fig. 5C), both recorded in response to the same MFB–AP waveform in outside-out patches drawn from MFBs. The kinetic parameters and the peak current amplitudes did not differ between the two conditions (each condition n = 8; p > 0.15 for each parameter) (Fig. 5D). The isolated sodium current and the inward current component of the combined Na+ and K+ current did not differ, either (p > 0.15 for half-duration, rise time, and peak current amplitude). The lack of electrophysiological evidence for KNa-mediated currents in rat hippocampal MFBs is consistent with immunohistochemical studies on Slick (Slo2.1) and Slack (Slo2.2) (Bhattacharjee et al., 2002, 2005), which did not show positive antibody staining in the mossy fiber tract of rat hippocampus.
MFBs contain at least two populations of presynaptic BKCa channels
In contrast to the absence of anatomical and functional evidences for a KNa in MFBs, there is clear antibody staining against the α-subunit of BKCa (Slo1) in the mossy fiber system (Knaus et al., 1996). When drawing outside-out patches from MFBs, large single-channel openings can readily be seen at steady-state membrane potentials of ∼0 mV (Fig. 6A). They were sensitive to 10 μm Pax (n = 7 patches), a broad-spectrum BKCa channel blocker, but not to 1 μm IBTX (n = 7) (Fig. 6A), which blocks BKCa channels containing β-subunits other than β4 (Meera et al., 2000). The single-channel conductance γ of BKCa channels found in outside-out patches amounted to 83 ± 2 pS (n = 13; reversal potential assumed to be −100 mV). Recordings performed in the whole-MFB configuration in the presence of TTX (1 μm) and 4-AP (1 mm) revealed Pax-sensitive (10 μm; n = 4), IBTX-sensitive (1 μm; n = 7), and cadmium-sensitive (200 μm; n = 7) currents (Fig. 6 B,C) (focal application of blockers). The first current component exhibited fast activation and fast inactivation (mean peak amplitude, 2.7 ± 0.3 nA; n = 18), indicative of BKCa channels containing β2- and/or β3-subunits (Wallner et al., 1999; Xia et al., 2000); the second component was slowly activating, persistent, and only partially IBTX sensitive (mean peak amplitude, 1.8 ± 0.2 nA; n = 18) (Fig. 6B,C,F), indicating the contribution of channels containing β4 subunits, but not β-subunits conferring fast inactivation. The first BKCa-mediated current component represents 30% of the total Kv1 + Kv3 + BKCa-mediated presynaptic K+ current peak amplitude, approximately three times more than at the calyx of Held (Ishikawa et al., 2003).
From the mean peak amplitudes of the two components, the single-channel conductance (assuming a similar γ for the respective channels), and an MFB surface of 180 μm2 (see Materials and Methods), a lower density boundary of homogeneously distributed BKCa channels of ∼3/μm2 can be estimated.
The compound BKCa channel-mediated currents were sensitive to the P/Q-type Cav blocker ω-agatoxin (1 μm), to the N-type Cav blocker ω-conotoxin (3 μm), and to nickel (200 μm; each blocker n = 6; focal application) (Fig. 6D). The sensitivity distribution of the BKCa-mediated currents was shifted to the P/Q-type Cav blocker for the fast activating/fast inactivating component (0.84 ± 0.04) compared with that of Cav-mediated currents found at the MFB (P/Q-type Cav blocker, 0.61 ± 0.03) (Li et al., 2007), in contrast to the slowly activating BKCa current component (P/Q-type, 0.68 ± 0.06). This is likely attributable to the different activation kinetics of the Cav subtypes (Li et al., 2007), with the P/Q-type being the fastest. The fast and slowly activating BKCa channel-mediated current components activated at approximately −20 and −30 mV, respectively (n = 3) (Fig. 6E), and decreased in amplitude above 0 mV, consistent with Cav current–voltage relationships recorded at MFBs (Li et al., 2007). Compared with the compound Kv1- and Kv3-mediated current at the MFB, the fast activating/fast inactivating BKCa channel-mediated current component inactivated faster (Fig. 6F); for a comparison regarding Cav-mediated current amplitude and kinetics, an example average trace (square-pulse depolarization to 0 mV) is indicated in Figure 6F. Together, MFBs contain at least two populations of BKCa channels, one containing β2- and/or β3-subunits, another one containing β4-subunits.
Presynaptic BKCa become activated when Kv3 channels are disabled
Focal application of IBTX (1 μ)m (Fig. 7A) or Pax (10 μm) to MFBs did not increase the half-duration of presynaptic APs (Fig. 7B) (1.09 ± 0.04 of control for IBTX, n = 4; 1.04 ± 0.01 of control for Pax, n = 4; both results were not different from application of the HEPES-buffered ACSF carrier solution alone, p > 0.5). IBTX + BDS-I (3 μm) led to an increase of the MFB–AP half-duration to 1.95 ± 0.09 (n = 3), but IBTX + DTX (0.2 μm) to only 1.41 ± 0.03 (n = 4) of control, and IBTX + DTX + BDS-I to only 1.91 ± 0.12 (n = 3) (Fig. 7B), similar to respective results with DTX and DTX + BDS-I (Fig. 1C), respectively. Because this differential dependence of the IBTX effect on Kv3 versus Kv1 was not expected, we focally applied DTX to MFBs in the presence of 0.2 mm cadmium in the ACSF and 10 mm of the calcium chelator BAPTA in the intracellular recording solution to exclude unspecific inhibition of IBTX action in the presence of DTX; again, the increase of the MFB–AP half-duration amounted to only 1.43 ± 0.03 of basal MFB–AP half-duration (n = 3) (data not shown). In contrast, focal application of IBTX + 10 μm 4-AP to MFBs broadened the AP to 1.59 ± 0.04 (n = 4; data not shown) relative to the AP half-duration in 10 μm (corresponding to an AP half-duration increase by a factor of ∼2 relative to the basal MFB–AP half-duration without drugs), corroborating the results when coapplying the BKCa- and Kv3-specific toxins.
In line with the lack of an IBTX-effect on the MFB–AP half-duration, 10 mm BAPTA in the intracellular solution did not increase the half-duration (1.03 ± 0.04 after 6 min whole-MFB compared with the initial half-duration; n = 3) (Fig. 7C,D). However, 10 μm 4-AP in the ACSF and 10 mm BAPTA in the intracellular recording solution increased the half-duration after 6 min whole-MFB to 1.67 ± 0.11 (n = 4) (Fig. 7C,D) relative to the initial half-duration in 10 μm 4-AP (corresponding to an AP half-duration increase by a factor of ∼2 relative to the basal MFB–AP half-duration without drugs). The calcium chelator EGTA at 10 mm in the intracellular solution increased the half-duration to a similar extent as did BAPTA (to 1.73 ± 0.09 after 6 min whole-MFB relative to the initial half-duration in 10 μm 4-AP; n = 4) (Fig. 7C,D).
In accordance with above results, we found no IBTX-sensitive outward K+ current component in 4-AP (1 mm) and TTX (1 μm) when applying a basal MFB–AP waveform in the voltage-clamp configuration (Fig. 7E, left) (n = 3 for IBTX; n = 3 for Pax; all six experiments gave a mean peak current amplitude of −0.04 ± 0.03 nA) (data not shown). Increasing the half-duration of the AP waveform to ∼700 μs in the respective same MFB recordings revealed a prominent IBTX-sensitive outward current (Fig. 7E, right) (n = 3 for IBTX; n = 3 for Pax; all six experiments gave a mean peak current amplitude of 0.27 ± 0.04 nA) (data not shown). The onset of the BKCa channel-mediated current in response to the broader AP waveform of Figure 7E occurred at considerably depolarized membrane potentials, at a time when the basal AP was already more or less completely repolarized (Fig. 7E, inset). In the continuous presence of a nonphysiologically high intra-MFB free calcium concentration (100 μm), BKCa channels activated already during the rising phase of the basal MFB–AP wave, considerably earlier than delayed-rectifier Kv channels during the same waveform (50 ± 6 μs earlier at 33–34°C, n = 3) (Fig. 7F, traces scaled to the same amplitude), indicating that the activation delay of BKCa in these conditions is shorter than that of presynaptic Kv. In summary, we found no evidence that BKCa become activated during basal MFB–APs, which seem to be too brief for sufficient coincident membrane depolarization and intracellular calcium rise at the BKCa. EGTA was as effective as BAPTA in preventing BKCa activation during broader-than-basal APs, indicating that BKCa and Cav are not organized in nanodomain protein complexes (Fakler and Adelman, 2008) at MFBs.
Discussion
Our results reveal that the properties of presynaptic Kv3 are adapted to perform brief APs at low channel densities, extending the observation of efficiency in MFB–AP generation from the immediate electrical signaling (Alle et al., 2009) to infrastructure. The brevity of MFB–APs and the apparent lack of close spatial Cav–BKCa interactions may explain why presynaptic BKCa are not activated during basal MFB–APs, resulting in minimized interferences of a presumed rescue-type channel with presynaptic calcium signaling and transmitter release.
Kv conductance densities underlying the AP at MFBs
The immediate AP costs close to the theoretical minimum were shown previously to depend on a fast Na+ conductance decay compared with the repolarization kinetics of the MFB–AP, which results from a considerable and precisely matched onset delay of the repolarizing K+ conductance. Simulations using experimentally derived conductance time courses predicted AP-wave-activated peak conductance densities necessary to achieve the experimentally observed MFB–AP repolarization kinetics (Alle et al., 2009). Calculations using the average AP-wave-evoked compound K+ current peak amplitude (see Results) and surface area of MFBs selected for presynaptic voltage-clamp recordings (Alle and Geiger, 2006; Alle et al., 2009) yielded an AP-wave-activated GK,max of 9.6 mS/cm2 (this study; see Materials and Methods), in close agreement with a predicted value of 7.8 mS/cm2 (Alle et al., 2009).
Kv3 at MFBs and other (glutamatergic) presynaptic elements
APs leading to transmitter release at glutamatergic terminals have half-durations in the order of 190–250 μs (Taschenberger and von Gersdorff, 2000; Alle et al., 2009). In the non-myelinated part of layer 5 pyramidal cell axons, half-durations of 250 μs have been recorded (Kole et al., 2007), suggesting comparable presynaptic AP half-durations. Thus, glutamatergic boutons require distinct K+ channel densities and/or expression patterns compared with other cellular compartments, such as somata and dendrites, in which APs decay slower. Studies on the calyx of Held (Ishikawa et al., 2003) and CA3 pyramidal cell axons (Qian and Saggau, 1999; Hu et al., 2001) together with our findings suggest that glutamatergic presynaptic elements contain fast-activating channels of the families Kv1, Kv3, and BKCa. The same constellation of K+ channel families is found at GABAergic synapses of fast-spiking interneurons onto glutamatergic layer II/III neocortical pyramidal cells (Goldberg et al., 2005), but the functional roles of the K+ channel families differ from that at the MFB.
Which Kv3 subunits might constitute the Kv3 channels mediating the BDS-I-sensitive current in response to MFB–AP waveforms? Kv3-mediated currents recorded at MFBs exhibit inactivation in response to long depolarizing voltage steps, which is consistent with the presence of Kv3.3 and Kv3.4 subunits detected immunohistochemically in hippocampal granule cells (Veh et al., 1995; Coetzee et al., 1999; Chang et al., 2007); furthermore, these currents activate at approximately −50 mV, which is consistent with the presence of Kv3.4 subunits, because they lead to a substantial membrane potential left-shift of channel activation in Kv3.1/3.4 heteromers compared with channels lacking Kv3.4 (Baranauskas et al., 2003).
A noteworthy property of Kv3-mediated currents in response to MFB–AP waveform is their high sensitivity to 4-AP, which is consistent with the observation of a high 4-AP sensitivity of transmitter release at the MFB–CA3 pyramidal neuron synapse. Sensitivity of presynaptic K+ currents to 4-AP in the low micromolar concentration range was also found at the calyx of Held for a major current component [IC50 of 17 μm (Ishikawa et al., 2003)] and at cerebellar GABAergic basket cell terminals [IC50 of 8 μm (Southan and Robertson, 2000)].
The properties of native Kv3-mediated currents at MFBs discussed so far are compatible with Kv3.3/Kv3.4 subunits, but the 4-AP sensitivities of currents mediated by Kv3.3 and Kv3.4 homomers expressed in heterologous systems are substantially higher (Gutman et al., 2005). One explanation might be that Kv3.3 and/or Kv3.4 subunits in native Kv3 channels at MFBs are more sensitive to 4-AP than homomeric channels expressed in heterologous expression systems. Alternatively, the high 4-AP sensitivity of K+ currents that are evoked by the MFB–AP waveform might suggest the presence and contribution of Kv3.1 subunits, because Kv3.1 homomeric channels have been reported to exhibit an IC50 of 29 μm for 4-AP (Grissmer et al., 1994). In hippocampal granule cells, in situ hybridization signals for Kv3.1 mRNA are documented (Kues and Wunder, 1992; Weiser et al., 1994). However, Kv3.1 protein has stayed undetected in immunohistological experiments (Sekirnjak et al., 1997; Chang et al., 2007), which might be attributable to either very low levels of protein expression or the inability by the antibody to detect Kv3.1 protein in native heteromeric Kv3 channel complexes.
Candidates of cortical neurons expressing a similar pattern of Kv3 subunits are layer 2/3 glutamatergic cells of the entorhinal cortex giving rise to the perforant path (Veh et al., 1995; Zahn et al., 2008) and neurons in the piriform cortex (Weiser et al., 1994). In contrast, neocortical glutamatergic neurons in rodents seem to lack Kv3 expression (Weiser et al., 1994; Rudy and McBain, 2001). However, our results suggest that the Kv3 channel density at the presynaptic site, which is required to keep APs brief, is very low (three to four Kv3 channels/μm2). Because the surface of single neocortical en passant boutons is only ∼0.5–1 μm2 (Braitenberg and Schüz, 1998) and GABAergic interneurons contain high amounts of Kv3 mRNA and protein (Rudy and McBain, 2001), respective small signals in glutamatergic neurons might have stayed undetected in anatomical studies.
Alternatively, these glutamatergic neurons may have found different solutions for the fast repolarization of their presynaptic APs, e.g., by high densities of Kv1 channels (see axonal recordings in the study by Kole et al., 2007). However, apart from being activated during APs, Kv1 channels also contribute to the resting membrane potential at the axon and presynaptic elements, controlling excitability (Smart et al., 1998; Dodson et al., 2003; Ishikawa et al., 2003) and the steady-state availability of Nav channels. Thus, Kv1 with their comparatively high density act as multipurpose channels, whereas Kv3 and BKCa at considerably lower densities seem to have more restricted functions.
BKCa at MFBs and other (glutamatergic) presynaptic elements
Our observation that presynaptic BKCa do not become activated during MFB–APs under basal conditions is consistent with results in acute brain slices at the hippocampal CA3–CA1 pyramidal neuron synapse (Hu et al., 2001) and at the calyx of Held–medial nucleus of trapezoid body principal cell synapse (Ishikawa et al., 2003) (but for the CA3–CA3 pyramidal neuron synapse in hippocampal slice cultures, see Raffaelli et al., 2004). A minor contribution of BKCa to presynaptic AP repolarization at GABAergic synapses of fast-spiking interneurons onto layer II/III neocortical pyramidal neurons can be inferred from an effect of BKCa blocker on synaptic transmission (Goldberg et al., 2005).
The lack of BKCa activation during basal MFB–APs likely results from the brevity of the AP caused by powerful Kv channels and the lack of nanodomain complexes of Cav and BKCa, concluded from the equally effective action of EGTA and BAPTA (Fakler and Adelman, 2008) on pre-broadened APs. At the hippocampal granule cell soma, a close spatial arrangement was suggested for Cav and BKCa (Müller et al., 2007), possibly ensuring BKCa activation in a cellular compartment with low Cav and/or BKCa densities. At MFBs, BKCa become activated in response to reduced Kv3 channel availability, as could occur during certain modulatory states (Rudy and McBain, 2001) or hypoxia (Patel and Honoré, 2001). In line with this, the compound Kv peak current amplitude at MFBs in response to an MFB–AP wave is reduced to 0.50 ± 0.02 of baseline when transiently exposing the tissue slice to 95% argon/5% CO2 (n = 4) (our unpublished observations). The differential effect of IBTX + BDS-I and IBTX + DTX on AP half-duration increase (Fig. 7) is not understood at present, but it might suggest subtle, unresolved differences in AP shape alteration during Kv3 and Kv1 block or a functional coupling of presynaptic Kv3 and BKCa beyond a simple interplay via an altered voltage waveform; this, however, remains to be studied.
Thus, presynaptic BKCa channels at glutamatergic synapses studied so far may act indeed as “emergency brakes” regarding neurotransmitter release (Hu et al., 2001), in contrast to GABAergic synapses onto neocortical pyramidal neurons (Goldberg et al., 2005), suggesting that basal presynaptic AP half-duration at these synapses might be slightly longer than at the MFB and calyx of Held and/or that there is a spatially close coupling of calcium sources and BKCa channels. The presumed lack of Cav–BKCa nanodomain complexes at the MFB could result from the need of close spatial interactions between Cav and calcium sensors of the vesicle release machinery (although this varies across presynaptic elements of different synapses) (Augustine et al., 2003). Concerning the hippocampal MFB, this interpretation is consistent with the observation that 10 mm EGTA do not prevent glutamate release (Alle and Geiger, 2006).
Together, the results of this study show that specialized voltage-activated K+ channels of the Kv3 family at a low channel density efficiently contribute to the presynaptic AP repolarization at hippocampal MFBs and that the AP repolarization is backed up by BKCa channels also at low densities, which are designed and arranged not to interfere with basal AP repolarization.
Footnotes
This work was supported by the Max Planck Society, the Hertie Foundation, and the Deutsche Forschungsgemeinschaft (Grant AL 1193/2-1; Exc 257).
The authors declare no competing financial interests.
References
- Alle H, Geiger JR. Combined analog and action potential coding in hippocampal mossy fibers. Science. 2006;311:1290–1293. doi: 10.1126/science.1119055. [DOI] [PubMed] [Google Scholar]
- Alle H, Roth A, Geiger JR. Energy-efficient action potentials in hippocampal mossy fibers. Science. 2009;325:1405–1408. doi: 10.1126/science.1174331. [DOI] [PubMed] [Google Scholar]
- Augustine GJ. Regulation of transmitter release at the squid giant synapse by presynaptic delayed rectifier potassium current. J Physiol. 1990;431:343–364. doi: 10.1113/jphysiol.1990.sp018333. [DOI] [PMC free article] [PubMed] [Google Scholar]
- Augustine GJ, Santamaria F, Tanaka K. Local calcium signaling in neurons. Neuron. 2003;40:331–346. doi: 10.1016/s0896-6273(03)00639-1. [DOI] [PubMed] [Google Scholar]
- Baranauskas G, Tkatch T, Nagata K, Yeh JZ, Surmeier DJ. Kv3.4 subunits enhance the repolarizing efficiency of Kv3.1 channels in fast-spiking neurons. Nat Neurosci. 2003;6:258–266. doi: 10.1038/nn1019. [DOI] [PubMed] [Google Scholar]
- Bhattacharjee A, Gan L, Kaczmarek LK. Localization of the slack potassium channel in the rat central nervous system. J Comp Neurol. 2002;454:241–254. doi: 10.1002/cne.10439. [DOI] [PubMed] [Google Scholar]
- Bhattacharjee A, von Hehn CA, Mei X, Kaczmarek LK. Localization of the Na+-activated K+ channel Slick in the rat central nervous system. J Comp Neurol. 2005;484:80–92. doi: 10.1002/cne.20462. [DOI] [PubMed] [Google Scholar]
- Borst JG, Sakmann B. Effect of changes in action potential shape on calcium currents and transmitter release in a calyx-type synapse of the rat auditory brainstem. Philos Trans R Soc Lond B Biol Sci. 1999;354:347–355. doi: 10.1098/rstb.1999.0386. [DOI] [PMC free article] [PubMed] [Google Scholar]
- Braitenberg V, Schüz A. Cortex: statistics and geometry of neuronal connectivity. Ed 2. Berlin: Springer; 1998. [Google Scholar]
- Chang SY, Zagha E, Kwon ES, Ozaita A, Bobik M, Martone ME, Ellisman MH, Heintz N, Rudy B. Distribution of Kv3.3 potassium channel subunits in distinct neuronal populations of mouse brain. J Comp Neurol. 2007;502:953–972. doi: 10.1002/cne.21353. [DOI] [PubMed] [Google Scholar]
- Coetzee WA, Amarillo Y, Chiu J, Chow A, Lau D, McCormack T, Moreno H, Nadal MS, Ozaita A, Pountney D, Saganich M, Vega-Saenz de Miera E, Rudy B. Molecular diversity of K+ channels. Ann N Y Acad Sci. 1999;868:233–285. doi: 10.1111/j.1749-6632.1999.tb11293.x. [DOI] [PubMed] [Google Scholar]
- Cooper EC, Milroy A, Jan YN, Jan LY, Lowenstein DH. Presynaptic localization of Kv1.4-containing A-type potassium channels near excitatory synapses in the hippocampus. J Neurosci. 1998;18:965–974. doi: 10.1523/JNEUROSCI.18-03-00965.1998. [DOI] [PMC free article] [PubMed] [Google Scholar]
- Dodson PD, Forsythe ID. Presynaptic K+ channels: electrifying regulators of synaptic terminal excitability. Trends Neurosci. 2004;27:210–217. doi: 10.1016/j.tins.2004.02.012. [DOI] [PubMed] [Google Scholar]
- Dodson PD, Billups B, Rusznák Z, Szûcs G, Barker MC, Forsythe ID. Presynaptic Kv1.2 channels suppress synaptic terminal hyperexcitability following action potential invasion. J Physiol. 2003;550:27–33. doi: 10.1113/jphysiol.2003.046250. [DOI] [PMC free article] [PubMed] [Google Scholar]
- Egan TM, Dagan D, Kupper J, Levitan IB. Properties and rundown of sodium-activated potassium channels in rat olfactory bulb neurons. J Neurosci. 1992;12:1964–1976. doi: 10.1523/JNEUROSCI.12-05-01964.1992. [DOI] [PMC free article] [PubMed] [Google Scholar]
- Engel D, Jonas P. Presynaptic action potential amplification by voltage-gated Na+ channels in hippocampal mossy fiber boutons. Neuron. 2005;45:405–417. doi: 10.1016/j.neuron.2004.12.048. [DOI] [PubMed] [Google Scholar]
- Fakler B, Adelman JP. Control of KCa channels by calcium nano/microdomains. Neuron. 2008;59:873–881. doi: 10.1016/j.neuron.2008.09.001. [DOI] [PubMed] [Google Scholar]
- Geiger JR, Jonas P. Dynamic control of presynaptic Ca2+ inflow by fast-inactivating K+ channels in hippocampal mossy fiber boutons. Neuron. 2000;28:927–939. doi: 10.1016/s0896-6273(00)00164-1. [DOI] [PubMed] [Google Scholar]
- Goldberg EM, Watanabe S, Chang SY, Joho RH, Huang ZJ, Leonard CS, Rudy B. Specific function of synaptically localized potassium channels in synaptic transmission at the neocortical GABAergic fast-spiking cell synapse. J Neurosci. 2005;25:5230–5235. doi: 10.1523/JNEUROSCI.0722-05.2005. [DOI] [PMC free article] [PubMed] [Google Scholar]
- Grissmer S, Ghanshani S, Dethlefs B, McPherson JD, Wasmuth JJ, Gutman GA, Cahalan MD, Chandy KG. The Shaw-related potassium channel gene, Kv3.1, on human chromosome 11, encodes the type l K+ channel in T cells. J Biol Chem. 1992;267:20971–20979. [PubMed] [Google Scholar]
- Grissmer S, Nguyen AN, Aiyar J, Hanson DC, Mather RJ, Gutman GA, Karmilowicz MJ, Auperin DD, Chandy KG. Pharmacological characterization of five cloned voltage-gated K+ channels, types Kv1.1, 1.2, 1.5, and 3.1, stably expressed in mammalian cell lines. Mol Pharmacol. 1994;45:1227–1234. [PubMed] [Google Scholar]
- Gutman GA, Chandy KG, Grissmer S, Lazdunski M, McKinnon D, Pardo LA, Robertson GA, Rudy B, Sanguinetti MC, Stühmer W, Wang X. International union of pharmacology. LIII. Nomenclature and molecular relationships of voltage-gated potassium channels. Pharmacol Rev. 2005;57:473–508. doi: 10.1124/pr.57.4.10. [DOI] [PubMed] [Google Scholar]
- Hess D, Nanou E, El Manira A. Characterization of Na+-activated K+ currents in larval lamprey spinal cord neurons. J Neurophysiol. 2007;97:3484–3493. doi: 10.1152/jn.00742.2006. [DOI] [PubMed] [Google Scholar]
- Hille B. Ionic channels of excitable membranes. Ed 3. Sunderland, MA: Sinauer; 2001. [Google Scholar]
- Hu H, Shao LR, Chavoshy S, Gu N, Trieb M, Behrens R, Laake P, Pongs O, Knaus HG, Ottersen OP, Storm JF. Presynaptic Ca2+-activated K+ channels in glutamatergic hippocampal terminals and their role in spike repolarization and regulation of transmitter release. J Neurosci. 2001;21:9585–9597. doi: 10.1523/JNEUROSCI.21-24-09585.2001. [DOI] [PMC free article] [PubMed] [Google Scholar]
- Ishikawa T, Nakamura Y, Saitoh N, Li WB, Iwasaki S, Takahashi T. Distinct roles of Kv1 and Kv3 potassium channels at the calyx of Held presynaptic terminal. J Neurosci. 2003;23:10445–10453. doi: 10.1523/JNEUROSCI.23-32-10445.2003. [DOI] [PMC free article] [PubMed] [Google Scholar]
- Ji J, Tsuk S, Salapatek AM, Huang X, Chikvashvili D, Pasyk EA, Kang Y, Sheu L, Tsushima R, Diamant N, Trimble WS, Lotan I, Gaisano HY. The 25-kDa synaptosome-associated protein (SNAP-25) binds and inhibits delayed rectifier potassium channels in secretory cells. J Biol Chem. 2002;277:20195–20204. doi: 10.1074/jbc.M201034200. [DOI] [PubMed] [Google Scholar]
- Judge SI, Monteiro MJ, Yeh JZ, Bever CT. Inactivation gating and 4-AP sensitivity in human brain Kv1.4 potassium channel. Brain Res. 1999;831:43–54. doi: 10.1016/s0006-8993(99)01391-8. [DOI] [PubMed] [Google Scholar]
- Knaus HG, Schwarzer C, Koch RO, Eberhart A, Kaczorowski GJ, Glossmann H, Wunder F, Pongs O, Garcia ML, Sperk G. Distribution of high-conductance Ca2+-activated K+ channels in rat brain: targeting to axons and nerve terminals. J Neurosci. 1996;16:955–963. doi: 10.1523/JNEUROSCI.16-03-00955.1996. [DOI] [PMC free article] [PubMed] [Google Scholar]
- Kole MH, Letzkus JJ, Stuart GJ. Axon initial segment Kv1 channels control axonal action potential waveform and synaptic efficacy. Neuron. 2007;55:633–647. doi: 10.1016/j.neuron.2007.07.031. [DOI] [PubMed] [Google Scholar]
- Kues WA, Wunder F. Heterogeneous expression patterns of mammalian potassium channel genes in developing and adult rat brain. Eur J Neurosci. 1992;4:1296–1308. doi: 10.1111/j.1460-9568.1992.tb00155.x. [DOI] [PubMed] [Google Scholar]
- Li L, Bischofberger J, Jonas P. Differential gating and recruitment of P/Q-, N-, and R-type Ca2+ channels in hippocampal mossy fiber boutons. J Neurosci. 2007;27:13420–13429. doi: 10.1523/JNEUROSCI.1709-07.2007. [DOI] [PMC free article] [PubMed] [Google Scholar]
- Ma M, Koester J. The role of K+ currents in frequency-dependent spike broadening in Aplysia R20 neurons: a dynamic-clamp analysis. J Neurosci. 1996;16:4089–4101. doi: 10.1523/JNEUROSCI.16-13-04089.1996. [DOI] [PMC free article] [PubMed] [Google Scholar]
- Martina M, Metz AE, Bean BP. Voltage-dependent potassium currents during fast spikes of rat cerebellar Purkinje neurons: inhibition by BDS-I toxin. J Neurophysiol. 2007;97:563–571. doi: 10.1152/jn.00269.2006. [DOI] [PubMed] [Google Scholar]
- Meera P, Wallner M, Toro L. A neuronal ß subunit (KCNMB4) makes the large conductance, voltage- and Ca2+-activated K+ channel resistant to charybdotoxin and iberiotoxin. Proc Natl Acad Sci U S A. 2000;97:5562–5567. doi: 10.1073/pnas.100118597. [DOI] [PMC free article] [PubMed] [Google Scholar]
- Müller A, Kukley M, Uebachs M, Beck H, Dietrich D. Nanodomains of single Ca2+ channels contribute to action potential repolarization in cortical neurons. J Neurosci. 2007;27:483–495. doi: 10.1523/JNEUROSCI.3816-06.2007. [DOI] [PMC free article] [PubMed] [Google Scholar]
- Nakamura Y, Takahashi T. Developmental changes in potassium currents at the rat calyx of Held presynaptic terminal. J Physiol. 2007;581:1101–1112. doi: 10.1113/jphysiol.2007.128702. [DOI] [PMC free article] [PubMed] [Google Scholar]
- Patel AJ, Honoré E. Molecular physiology of oxygen-sensitive potassium channels. Eur Respir J. 2001;18:221–227. doi: 10.1183/09031936.01.00204001. [DOI] [PubMed] [Google Scholar]
- Qian J, Saggau P. Modulation of transmitter release by action potential duration at the hippocampal CA3-CA1 synapse. J Neurophysiol. 1999;81:288–298. doi: 10.1152/jn.1999.81.1.288. [DOI] [PubMed] [Google Scholar]
- Raffaelli G, Saviane C, Mohajerani MH, Pedarzani P, Cherubini E. BK potassium channels control transmitter release at CA3-CA3 synapses in the rat hippocampus. J Physiol. 2004;557:147–157. doi: 10.1113/jphysiol.2004.062661. [DOI] [PMC free article] [PubMed] [Google Scholar]
- Rettig J, Wunder F, Stocker M, Lichtinghagen R, Mastiaux F, Beckh S, Kues W, Pedarzani P, Schröter KH, Ruppersberg JP, Veh R, Pongs O. Characterization of a Shaw-related potassium channel family in rat brain. EMBO J. 1992;11:2473–2486. doi: 10.1002/j.1460-2075.1992.tb05312.x. [DOI] [PMC free article] [PubMed] [Google Scholar]
- Riazanski V, Becker A, Chen J, Sochivko D, Lie A, Wiestler OD, Elger CE, Beck H. Functional and molecular analysis of transient voltage-dependent K+ currents in rat hippocampal granule cells. J Physiol. 2001;537:391–406. doi: 10.1111/j.1469-7793.2001.00391.x. [DOI] [PMC free article] [PubMed] [Google Scholar]
- Rudy B, McBain CJ. Kv3 channels: voltage-gated K+ channels designed for high-frequency repetitive firing. Trends Neurosci. 2001;24:517–526. doi: 10.1016/s0166-2236(00)01892-0. [DOI] [PubMed] [Google Scholar]
- Rutecki PA, Lebeda FJ, Johnston D. 4-Aminopyridine produces epileptiform activity in hippocampus and enhances synaptic excitation and inhibition. J Neurophysiol. 1987;57:1911–1924. doi: 10.1152/jn.1987.57.6.1911. [DOI] [PubMed] [Google Scholar]
- Sabatini BL, Regehr WG. Control of neurotransmitter release by presynaptic waveform at the granule cell to Purkinje cell synapse. J Neurosci. 1997;17:3425–3435. doi: 10.1523/JNEUROSCI.17-10-03425.1997. [DOI] [PMC free article] [PubMed] [Google Scholar]
- Schröter KH, Ruppersberg JP, Wunder F, Rettig J, Stocker M, Pongs O. Cloning and functional expression of a TEA-sensitive A-type potassium channel from rat brain. FEBS Lett. 1991;278:211–216. doi: 10.1016/0014-5793(91)80119-n. [DOI] [PubMed] [Google Scholar]
- Sekirnjak C, Martone ME, Weiser M, Deerinck T, Bueno E, Rudy B, Ellisman M. Subcellular localization of the K+ channel subunit Kv3.1b in selected rat CNS neurons. Brain Res. 1997;766:173–187. doi: 10.1016/s0006-8993(97)00527-1. [DOI] [PubMed] [Google Scholar]
- Sigworth FJ. The variance of sodium current fluctuations at the node of Ranvier. J Physiol. 1980;307:97–129. doi: 10.1113/jphysiol.1980.sp013426. [DOI] [PMC free article] [PubMed] [Google Scholar]
- Smart SL, Lopantsev V, Zhang CL, Robbins CA, Wang H, Chiu SY, Schwartzkroin PA, Messing A, Tempel BL. Deletion of the Kv1.1 potassium channel causes epilepsy in mice. Neuron. 1998;20:809–819. doi: 10.1016/s0896-6273(00)81018-1. [DOI] [PubMed] [Google Scholar]
- Southan AP, Robertson B. Electrophysiological characterization of voltage-gated K+ currents in cerebellar basket and Purkinje cells: Kv1 and Kv3 channel subfamilies are present in basket cell nerve terminals. J Neurosci. 2000;20:114–122. doi: 10.1523/JNEUROSCI.20-01-00114.2000. [DOI] [PMC free article] [PubMed] [Google Scholar]
- Stephens GJ, Garratt JC, Robertson B, Owen DG. On the mechanism of 4-aminopyridine action on the cloned mouse brain potassium channel mKv1.1. J Physiol. 1994;477:187–196. doi: 10.1113/jphysiol.1994.sp020183. [DOI] [PMC free article] [PubMed] [Google Scholar]
- Stühmer W, Ruppersberg JP, Schröter KH, Sakmann B, Stocker M, Giese KP, Perschke A, Baumann A, Pongs O. Molecular basis of functional diversity of voltage-gated potassium channels in mammalian brain. EMBO J. 1989;8:3235–3244. doi: 10.1002/j.1460-2075.1989.tb08483.x. [DOI] [PMC free article] [PubMed] [Google Scholar]
- Taschenberger H, von Gersdorff H. Fine-tuning an auditory synapse for speed and fidelity: developmental changes in presynaptic waveform, EPSC kinetics, and synaptic plasticity. J Neurosci. 2000;20:9162–9173. doi: 10.1523/JNEUROSCI.20-24-09162.2000. [DOI] [PMC free article] [PubMed] [Google Scholar]
- Veh RW, Lichtinghagen R, Sewing S, Wunder F, Grumbach IM, Pongs O. Immunohistochemical localization of five members of the Kv1 channel subunits: contrasting subcellular locations and neuron-specific co-localizations in rat brain. Eur J Neurosci. 1995;7:2189–2205. doi: 10.1111/j.1460-9568.1995.tb00641.x. [DOI] [PubMed] [Google Scholar]
- Wallner M, Meera P, Toro L. Molecular basis of fast inactivation in voltage and Ca2+-activated K+ channels: a transmembrane ß-subunit homolog. Proc Natl Acad Sci U S A. 1999;96:4137–4142. doi: 10.1073/pnas.96.7.4137. [DOI] [PMC free article] [PubMed] [Google Scholar]
- Wei AD, Gutman GA, Aldrich R, Chandy KG, Grissmer S, Wulff H. International union of pharmacology. LII. Nomenclature and molecular relationships of calcium-activated potassium channels. Pharmacol Rev. 2005;57:463–472. doi: 10.1124/pr.57.4.9. [DOI] [PubMed] [Google Scholar]
- Weiser M, Vega-Saenz de Miera E, Kentros C, Moreno H, Franzen L, Hillman D, Baker H, Rudy B. Differential expression of Shaw-related K+ channels in the rat central nervous system. J Neurosci. 1994;14:949–972. doi: 10.1523/JNEUROSCI.14-03-00949.1994. [DOI] [PMC free article] [PubMed] [Google Scholar]
- Xia XM, Ding JP, Zeng XH, Duan KL, Lingle CJ. Rectification and rapid activation at low Ca2+ of Ca2+-activated, voltage-dependent BK currents: consequences of rapid inactivation by a novel β-subunit. J Neurosci. 2000;20:4890–4903. doi: 10.1523/JNEUROSCI.20-13-04890.2000. [DOI] [PMC free article] [PubMed] [Google Scholar]
- Yeung SY, Thompson D, Wang Z, Fedida D, Robertson B. Modulation of Kv3 subfamily potassium currents by the sea anemone toxin BDS: significance for CNS and biophysical studies. J Neurosci. 2005;25:8735–8745. doi: 10.1523/JNEUROSCI.2119-05.2005. [DOI] [PMC free article] [PubMed] [Google Scholar]
- Zahn RK, Tolner EA, Derst C, Gruber C, Veh RW, Heinemann U. Reduced ictogenic potential of 4-aminopyridine in the perirhinal and entorhinal cortex of kainate-treated chronic epileptic rats. Neurobiol Dis. 2008;29:186–200. doi: 10.1016/j.nbd.2007.08.013. [DOI] [PubMed] [Google Scholar]