

Abstract
The mammalian olfactory bulb (OB) contains a rich and highly heterogeneous network of local interneurons (INs). These INs undergo continuous turnover in the adult OB in a process known as “adult neurogenesis.” Although the overall magnitude of adult neurogenesis has been estimated, the detailed dynamics of the different subpopulations remains largely unknown. Here we present a novel preparation that enables long-term in vivo time-lapse imaging in the mouse OB through a chronic cranial window in a virtually unlimited number of sessions. Using this preparation, we followed the turnover of a specific neuronal population in the OB, the dopaminergic (DA) neurons, for as long as 9 months. By following the same population over long periods of time, we found clear addition and loss of DA neurons in the glomerular layer. Both cell addition and loss increased over time. The numbers of new DA cells were consistently and significantly higher than lost DA cells, suggesting a net increase in the size of this particular population with age. Over a 9 month period of adult life, the net addition of DA neurons reached ∼13%. Our data argue that the fine composition of the bulbar IN network changes throughout adulthood rather than simply being replenished.
Introduction
The mammalian olfactory bulb (OB) is the first station of olfactory processing in the CNS (Shepherd et al., 2004). Like many other circuits in the CNS, local information processing in the OB is performed by different subsets of interneurons (INs) (Parrish-Aungst et al., 2007). But unlike other circuits, a significant portion of the IN population in the OB is continuously replaced in a process known as “adult neurogenesis” (Lledo et al., 2008; Whitman and Greer, 2009; Adam and Mizrahi, 2010). Adult neurogenesis has been implicated in diverse sets of functions, including circuit maintenance, sensory information processing, and also learning and memory (for review, see Lazarini and Lledo, 2011). The mechanistic nature of this plasticity is thought to be by means of “circuit replenishment.” Specifically, new neurons replace older neurons such that at any given time point in the life of the animal, the local circuit contains a fresh pool of young INs. However, since the network is composed of many diverse types of INs (Kosaka and Kosaka, 2007; Parrish-Aungst et al., 2007), a complimentary or even alternative scenario is possible. The network could be continuously replaced such that its composition of INs varies with time. Current data do not provide clear answers to distinguish between these possibilities.
Dynamic biological processes like neuronal turnover are captured better by time-lapse methods compared with one-shot histological methods. Since histological-based comparisons are made between different animals, interindividual variability is an inseparable part of the measurement. As a result, changes smaller than the interanimal variability might be masked. Additionally, homeostatic processes that cancel out each other, like addition and elimination, cannot be measured simultaneously. Time-lapse imaging has proven invaluable for studies of dynamic biological processes like neuronal development and plasticity (Cline, 2001; Bhatt et al., 2009; Holtmaat and Svoboda, 2009; Hübener and Bonhoeffer, 2010). Unlike transparent animals or large cortical surfaces, in the OB such experiments remained more limited due to anatomical considerations. The small size of the dorsal surface of the OB and the close proximity of the bulb to major blood vessels were barriers that seemed hard to overcome. As a result, only thinned bone preparation or small craniotomies were used for repeated time-lapse imaging experiments or acute experiments (Mizrahi and Katz, 2003; Mizrahi et al., 2006; Mizrahi, 2007). Small craniotomies are limited in repeatability and duration of the experiments since they require repeated surgeries to remove the fresh bone that grows back between imaging sessions (Mizrahi and Katz, 2003; Mizrahi et al., 2006; Mizrahi, 2007). Thinned bone preparations are limited in the quality and depth of imaging that can be achieved due to the additional opacity of the remaining bone (Holtmaat et al., 2009) (but see Drew et al., 2010).
Here, we developed and applied a chronic window preparation for the purpose of imaging in the OB; a variation of a preparation developed earlier for cortical imaging (Lee et al., 2006, 2008). This chronic window preparation allows high-resolution imaging for many months and in virtually unlimited number of sessions, with no need for further surgical interference. Here we used this preparation to study the slow and dynamic processes in the turnover of the dopaminergic (DA) juxtaglomerular neurons (JGNs). Our data reveal a net addition of the DA population, suggesting that the IN composition of the glomerular layer (GL) changes with age.
Materials and Methods
Animals.
We used adult transgenic male and female mice (postnatal day 70 to postnatal day 95 on the day of surgery) that were bred and maintained in a specific pathogen-free animal facility. Two mouse strains were crossed to label dopaminergic neurons. Homozygous TH::IRES-Cre driver mice (Lindeberg et al., 2004) were crossed with heterozygous Z/EG Cre reporter mice (Novak et al., 2000). Genotypes were determined from mouse-tail DNA samples by PCR for GFP (forward primer: CGA CGT AAA CGG CCA CAA GT; reverse primer: TGT TGT AGT TGT ACT CCA GC). We used a total of N = 25 animals in this study. Ten mice were implanted with a chronic window, and of those five animals had good windows and were used for in vivo imaging. Eleven mice were used for histology. Two mice were used for virus injections. One control animal was used for imaging through thinned bone. One C57BL/6 mouse was used for the example of spine imaging shown in Figure 1d. Animal care and experiments were approved by the Hebrew University Animal Care and Use Committee.
Figure 1.
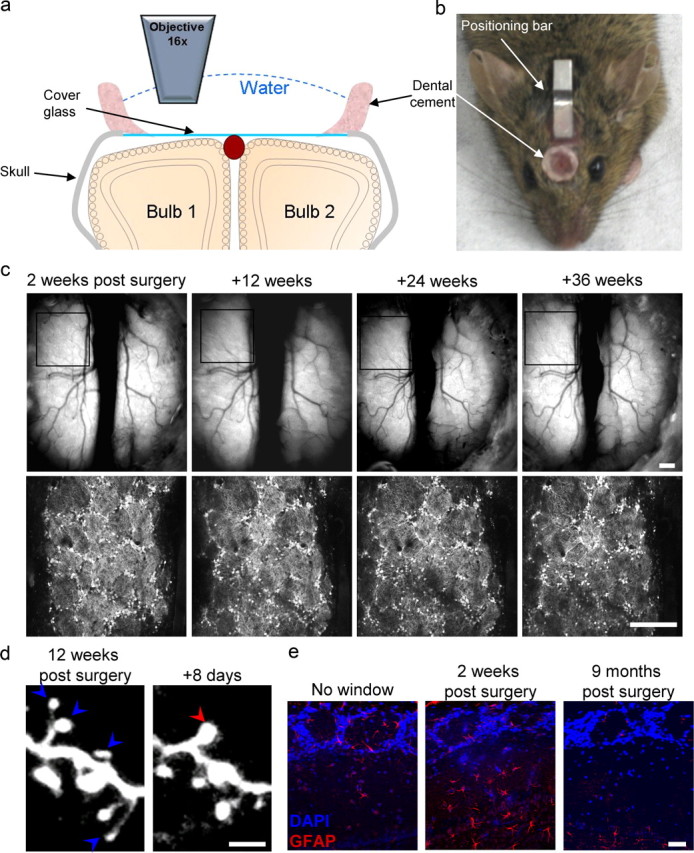
Long-term chronic imaging in the mouse olfactory bulb. a, A schematic diagram of a coronal section of the OBs with a chronic window implant. See text for details. b, A still image of a TH::IRES-Cre × Z/EG mouse 5 months after window implantation. c, Top, Still image of the blood vessels on the surface of the OB from the first imaging session up to 36 weeks. Bottom, Low-magnification two-photon micrographs of GFP+ neurons in the glomerular layer (same region as in the boxed region on the top images). Scale bar, 200 μm. d, High-resolution two-photon micrographs of adult-born granule cell spines at 180 μm below the dura as imaged through the chronic window preparation 85 and 93 d after surgery. Red arrowhead, New spine; blue arrowhead, lost spine. Scale bar, 5 μm. e, Confocal micrographs of OB dorsal surface in coronal sections stained with an antibody against GFAP. Left, Control mouse; middle, 2 weeks after window implantation; right, 9 months after window implantation. Scale bar, 50 μm.
Histology.
Mice were perfused transcardially with 0.9% saline followed by 4% paraformaldehyde, and the brains were prepared for histology by soaking them in 30% sucrose. OBs were sectioned coronally (40 μm) on a sliding microtome. The following primary antibodies were used: rabbit anti-calretinin (CR) (1:2000) and mouse anti-calbindin (CB) (1:1000) from Swant, mouse anti-tyrosine hydroxylase (TH) (1:500) from Immunostar, chicken anti-glial fibrillary acidic protein (GFAP) (1:500), and mouse anti-NeuN from Millipore. The following secondary antibodies were used: biotinylated goat anti-mouse (1:500) and goat anti-rabbit (1:500) from Jackson ImmunoResearch, and biotinylated rabbit anti-chicken (1:200) from Millipore. Amplification was performed using Cy5-conjugated streptavidin (Jackson ImmunoResearch). Slices were imaged at 0.75 μm/pixel resolution in the xy dimension, and 1 μm/image resolution in the z dimension, with an SP50 confocal microscope, via a 40× [1.25 numerical aperture (NA)] oil objective (Leica). Counting of neuronal somata was performed manually from the confocal images by choosing random regions of 253 × 253 μm within the slices (2–3 slices per animal). Each somata was scored as labeled with GFP, Cy5, or both.
Surgery for the chronic window implant over both OBs.
Mice were anesthetized with an intraperitoneal injection of ketamine (100 mg/kg) and medetomidine (0.83 mg/kg). Carprofen (0.004 mg/g) was injected subcutaneously, and lidocaine was applied locally onto the skull. The pinch withdrawal reflex was monitored throughout the surgery, and additional anesthesia was applied if needed. The skull covering both OBs was cleaned and thoroughly dried. A single 3 mm round craniotomy was opened over the OBs of both hemispheres using a 3 mm biopsy punch (Miltex), and the bone was carefully removed. Special care was taken to avoid puncturing the dura matter. The surface of the brain was thoroughly rinsed with sterile saline. The exposed brain was covered directly with a 3-mm-diameter round coverglass (Menzel-Glaser). The margin between the coverglass and the intact bone was gently sealed with Histoacryl glue (B. Braun). Once dried, dental cement was applied around the window to strengthen the seal to the bone and provide support for the water during imaging. For the purpose of repeated imaging in a custom-made stereotaxic stage, a 0.1 g metal bar was glued to the skull as described previously (Mizrahi and Katz, 2003; Mizrahi et al., 2006; Mizrahi, 2007; Livneh et al., 2009). After surgery, mice were treated with carprofen (0.004 mg/g, s.c) until full recovery. All animals were allowed to fully recover before the first imaging session, which started at least 2 weeks after surgery. Two weeks following this procedure, in 50% of the animals (5/10 mice) the brain region under the window was clear for imaging (in either one or both bulbs). The rest of the animals grew new bone under the implanted window, precluding high-quality imaging; these animals were not used further in this study. At the end of each experiment, animals were either perfused for histology or killed with an overdose of pentobarbital.
In vivo two-photon imaging.
Imaging was performed under light anesthesia (ketamine, 66 mg/kg and medetomidine, 0.55 mg/kg, i.p.) with no further surgical intervention. Lightly anesthetized mice were placed under the microscope in a custom-made stereotaxic device via the metal bar glued to the skull in a fixed orientation relative to the objective lens. A single imaging session usually lasted ∼60 min, after which the animal rapidly recovered. The imaging data presented in this work are from six consecutive imaging sessions from four mice that were taken 2–4 weeks after surgery, and then after an additional 4, 8, 12, 24, and 36 weeks. In one additional mouse, imaging was performed only 4 and 8 weeks following the first imaging session. To reidentify the same imaging position, we used the blood vessel map on the surface of the OB, which remained stable. Imaging was performed using an Ultima two-photon microscope from Prairie Technologies, equipped with a 16× objective lens (0.8 NA; CF175, Nikon). Two-photon excitation (900 nm) was delivered with a DeepSee femtosecond laser (Spectraphysics). The laser beam was expanded to fill the large back aperture of the 16× objective. Images of the cell bodies around glomeruli (1024 × 1024 pixels) were acquired at 0.66 μm/pixel resolution in the xy dimension and 1.5–2 μm/frame in the z dimension. In a few cases, to verify cell body positions, images were also acquired at higher resolution (0.132 μm/pixel in the xy dimension and 1 μm/frame in the z dimension). Care was taken to adjust fluorescence levels to partial saturation of the central region of the cell bodies. One TH::IRES-Cre × Z/EG mouse was imaged through thinned bone as described previously (Mizrahi et al., 2006).
Lentiviral vectors and stereotaxic injections.
Adult-born neurons were labeled with lentivirus expressing GFP or TdTomato under the control of the CMV promoter. Virus was produced by transfection of human embryonic kidney cells (HEK293) with third-generation lentivirus plasmids using polyethylenimine. The medium was collected after 36 h and again after an additional 24 h. Virus was concentrated using ultracentrifugation and resuspended in PBS. For virus injections, mice were anesthetized with ketamine (100 mg/kg) and medetomidine (0.83 mg/kg) intraperitoneally. Virus (∼0.5 μl) was injected stereotaxically through a small craniotomy into the rostral migratory stream (RMS). Coordinates relative to bregma: anterior, 3.3 mm; lateral, 0.8 mm; ventral, 2.9 mm. The craniotomy was sealed with bone wax and dental cement. Mice were perfused, sliced, and imaged using a confocal microscope as described above.
Data analysis.
Quantitative analyses of neuronal turnover were performed manually from the original image stacks using ImageJ (http://rsb.info.nih.gov/ij/). From each stack in consecutive imaging sessions, several regions of interest (ROIs) were identified and cropped. Then, the cropped stacks were projected in groups of three to four optical planes using the “grouped ZProjector” plugin (http://rsb.info.nih.gov/ij/plugins/group.html). ROIs were compared with the same ROI in the first session using the “Sync windows” plugin (http://rsb.info.nih.gov/ij/plugins/sync-windows.html). Each cell was manually scored as stable, lost, or new using the “cell counter” plugin (http://rsb.info.nih.gov/ij/plugins/cell-counter.html). We have analyzed overall 23 imaging sessions from five time points relative to the first imaging session. The intervals were 4, 8, 12, 24, and 36 weeks. In a 4 week interval, we analyzed n = 1182 cells from N = 3 animals; in an 8 week interval, we analyzed n = 1237 cells from N = 3 animals; in a 12 week interval, we analyzed n = 597 cells from N = 4 animals; in a 24 week interval, we analyzed n = 646 cells from N = 4 animals; and in a 36 week interval, we analyzed n = 501 cells from N = 4 animals.
Results
Long-term in vivo imaging through a chronic window over both olfactory bulbs
Fixed tissue experiments are limited to single snapshots from single animals and may reveal only large changes at the population level. Snapshot studies are blind to subtle changes in time that could entail significant biological events underlying plasticity and also to any homeostatic processes that cancel out each other. Time-lapse in vivo imaging experiments are successfully used to overcome these disadvantages.
Chronic time-lapse imaging has been particularly successful in studying superficial brain regions like the OB and neocortex. But, compared with the neocortex, each OB is covered by only a small surface of bone (∼2 × ∼3.5 mm), making chronic window implantation technically challenging. As a result, chronic imaging in the OB remained limited to either thinned bone preparations or small craniotomies. In thinned bone preparation, long-term imaging is feasible but imaging depth is limited (Mizrahi et al., 2006). In contrast, small craniotomies normally allowed relatively short imaging durations after which the bone grows back and repeated surgery is needed (Mizrahi, 2007). To overcome these caveats, we developed a new chronic window preparation. Specifically, we used a large craniotomy (3 mm in diameter) that spans both bulbar hemispheres (Fig. 1a,b). The bone overlying both OBs was replaced with a 3 mm coverglass, placed directly on the dura matter and tightly sealed (Fig. 1a,b) (see Materials and Methods for details). Using this procedure, we managed to obtain stable and clear chronic windows in 50% of the animals: of 10 animals, 3 had a continuously clear window over both bulbs and 2 had clear windows over one bulb. In the other five animals, the bone grew back over significant portions of the craniotomy, in which case high-quality imaging was not feasible. A 50% success rate is in line with similar preparations reported for two-photon imaging in the cortex (Holtmaat et al., 2009). The chronic window remained optically clear for two-photon imaging as long as we conducted our experiments (up to 9 months) (Fig. 1c).
The chronic window preparation allows imaging at high resolution throughout the dorsal glomerular layer and external plexiform layer (EPL). For example, Figure 1d shows repeated high-resolution time-lapse imaging of the dendritic spine dynamics of a granule cell. Another advantage of this preparation is the large imaging field covering both OBs (Fig. 1a,c). In the mouse, this imaging field corresponds to ∼75 glomeruli on each bulb, lending itself also to low-resolution imaging techniques like intrinsic signal imaging (data not shown). Perhaps the biggest advantage of the chronic window is its long-term stability, enabling imaging for a virtually unlimited number of sessions for many months. Notably, one criticism associated with chronic windows is the transient activation of astroglia under the craniotomy (Xu et al., 2007). To assess this potential caveat, we immunostained the OB for GFAP 2 weeks and 9 months after surgery. As expected, we detected an increase in the density of GFAP-positive cells in the EPL 2 weeks following surgery, but not later on (Fig. 1e). Again, this result is qualitatively similar to that found in a similar preparation in the neocortex (Lee et al., 2008). Next, we used this preparation to follow specifically the DA population of JGNs over a period of 9 months.
Long-term time-lapse imaging reveals net addition of DA neurons
The GL is composed of a diverse mixture of INs collectively known as JGNs (Kosaka and Kosaka, 2007, 2011; Parrish-Aungst et al., 2007). One subset, the DA neurons, makes up ∼10% of the whole JGN circuit (Parrish-Aungst et al., 2007). To label specifically the DA population, we crossed a knock-in driver mouse strain expressing Cre recombinase from the TH locus (TH::IRES-Cre) (Lindeberg et al., 2004) with a general GFP reporter mouse strain (Z/EG) (Novak et al., 2000) (Fig. 2a). The progeny of this line showed dense GFP expression in the GL (Figs. 1c, 2c). As reported previously for these mice, nonspecific leak is expected (Lindeberg et al., 2004). Specifically, because Cre recombinase acts like a switch, any cell that expresses even low levels of Cre or that expressed Cre during embryonic development is expected to express GFP strongly. Indeed, we found GFP expression in the granule cell layer and around the mitral cell layer; two regions that are not normally associated with TH expression (Fig. 2c). This nonspecific expression was evident in granule cells but not in mitral cells since GFP-positive cells were also positive for NeuN, which does not stain mitral cells (data not shown). However, within the glomerular layer, the majority of the GFP-positive cells also expressed TH (84.3 ± 2.3%, n = 2137 cells from 9 mice), and the majority of TH-positive cells also expressed GFP (95.0 ± 1.8%, n = 1892 cells from 9 mice) (Fig. 2d,e). Nearly none of the GFP-positive JGNs stained positive for the two other main molecular subtypes in the GL, calbindin and calretinin (Fig. 2d,e). To confirm that GFP is expressed also in adult-born DA neurons, we injected lentivirus expressing the red fluorescent protein TdTomato (Shaner et al., 2008) to the RMS of TH::IRES-Cre × Z/EG mice. Forty-five days after injection, many TdTomato-expressing adult-born neurons were observed in the OB. As expected, a small fraction of these cells was also GFP positive (Hack et al., 2005), suggesting that this transgenic strain also labels adult-born DA neurons (Fig. 2b).
Figure 2.
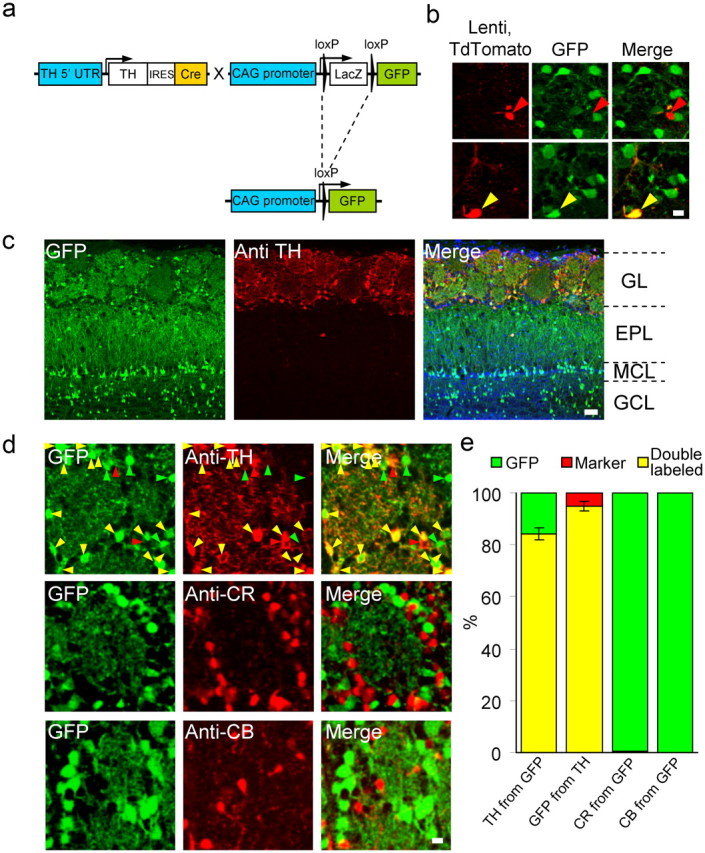
Genetic labeling of dopaminergic neurons in the mouse OB. a, Mice with Cre recombinase knocked in to the TH locus were crossed with the Z/EG GFP Cre reporter strain. In the F1 offspring, GFP is expressed in DA neurons driven by the CAG promoter. b, GFP expression in adult-born neurons. Left, TdTomato expression induced by lentivirus injection to the RMS; middle, GFP expression; right, merge. The GFP-positive cell is marked with a yellow arrowhead, and the negative cell is marked with a red arrowhead. Scale bar, 10 μm. c, GFP and TH expression in the various OB layers of TH::IRES-Cre × Z/EG mice. Left, GFP expression in a coronal section of the OB; middle, same section stained with antibodies against tyrosine hydroxylase. Right, Merged image including DAPI to stain nuclei (blue). MCL, Mitral cell layer; GCL, granule cell layer. Scale bar, 50 μm. d, High-resolution confocal micrographs of olfactory bulb coronal sections. Left, GFP expression; middle, immunostaining for TH, CR, or CB; right, merged image of red and green cell bodies. In the top images, green arrows indicate GFP-expressing cells negative for the anti-TH antibody; red arrows indicate TH-positive cells negative for GFP; yellow arrows indicate double-labeled cells. Scale bar, 10 μm. e, Quantification of single/double-labeled somata in the GL expressing GFP with or without TH, CR, and CB. TH from GFP, 84.3 ± 2.3% of GFP cells expressed TH (N = 2137 cells); GFP from TH, 95 ± 1.8% of the TH cells expressed GFP (N = 1892 cells). Pooled data from N = 9 mice 3, 6, and 13 months old (3 animals per age group); no significant difference was found among these three groups (see text). CR from GFP, 2 of 301 GFP cells expressed calretinin (N = 3 mice, 6 months old); CB from GFP, 0 of 370 GFP cells expressed calbindin (N = 3 mice, 6 months old).
The GFP expression in the DA neurons of this transgenic mouse was strong enough to label both somata and dendrites. However, given the high density of DA neurons in the GL, the dendritic tree ramification in the glomerular neuropile was too dense to reliably track dendrites individually. Somata on the other hand, could be imaged individually, reliably, and with high contrast. Thus, we limited our analyses to turnover rates assessed by tracking the somata positions.
To image the DA JGNs, we implanted a chronic window over the OBs of young adult TH::IRES-Cre × Z/EG mice. We started imaging GFP-positive neurons 2–4 weeks postimplantation when animals were at postnatal day 98 ± 12 (n = 5 mice). We acquired low-magnification two-photon image stacks from a region encompassing ∼25 glomeruli at high enough resolution to resolve somata (Fig. 1c, boxed region). This same region was then imaged repeatedly six consecutive times for a total duration of up to 9 months (Fig. 3a). To assess the turnover rates of the DA neurons, we identified the same GFP-positive neurons according to their relative spatial location in the bulb and scored them as stable, lost, or new relative to the first imaging session (Fig. 3a). In total, we analyzed data from 23 imaging sessions from five mice during a period of up to 36 weeks.
Figure 3.
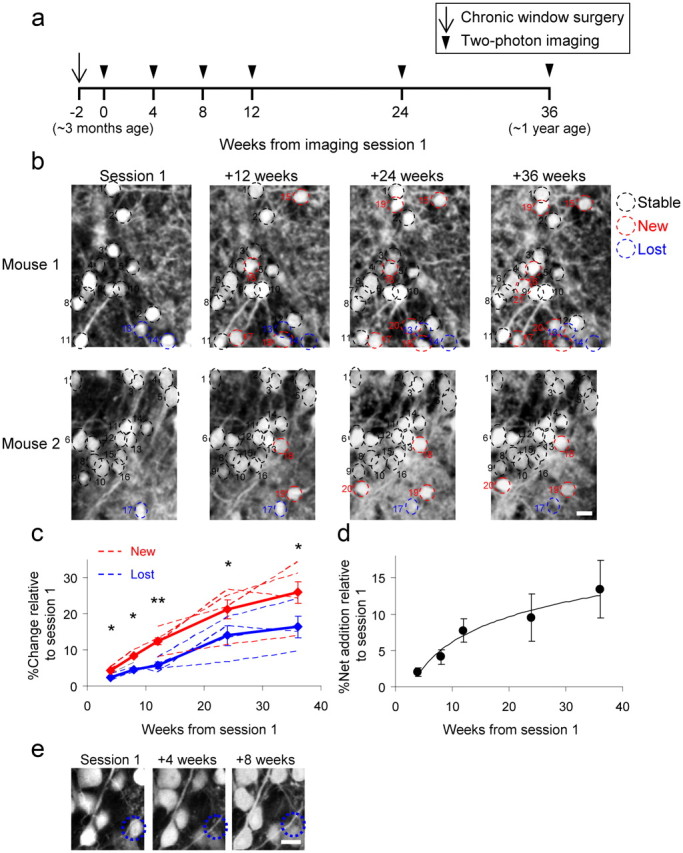
Net increase of dopaminergic neurons with age. a, Time frame of the experiment. Imaging sessions started usually 2 weeks after window implantation and continued at the indicated intervals. Animals were ∼2.5 months old at the time of surgery, and the imaging sessions continued until the animals were ∼1 year old. b, In vivo two-photon micrographs of GFP+ somata at four time points during the experiment. Examples are projection images (composed of 3 optical planes) from two different mice imaged over a 36 week period at 12 week intervals. Stable cells are marked with a black dashed circle, newly appearing cells are marked with red, and lost cells are marked with blue. Scale bar, 10 μm. c, Quantification of the percentage of newly added (red) and lost (blue) cells. Dashed lines represent the individual animals analyzed, and bold lines represent the averages ± SEM. In all time points, the percentage of new cells was significantly higher than that of lost cells. *p < 0.05; **p < 0.01, Student's t test. d, Quantification of the net addition of DA neurons relative to the first session calculated from the data shown in c. e, High-resolution example for a lost cell body that does not reappear in two consecutive imaging sessions. A local dendrite is positioned in the volume of the lost somata. Scale bar, 10 μm.
Repeated imaging allowed us to follow the DA neurons individually and detect even small changes in the composition of the circuit in terms of DA turnover rates. For example, Figure 3b shows representative examples from two TH::IRES-Cre × Z/EG mice where several changes in TH population were observed over the 9 month period (only 4 of 6 sessions are shown). Stable, lost, and new DA neurons were evident in all mice (black, blue, and red circles, respectively) (Fig. 3b). On average, within a period of 4 weeks, 4.3 ± 0.6% of the cells were new, 2.4 ± 0.5% were lost, and 97.6 ± 0.5% were stable (Fig. 3c) (n = 1182 neurons from N = 3 mice). These values continued to increase as we imaged further. Within 8 weeks, 8.3 ± 1.0% of the cells were new and 4.5 ± 0.4% were lost (Fig. 3c) (n = 1237 cells from N = 3 mice). At 12, 24, and 36 weeks, these absolute values continued to increase (Fig. 3c). Surprisingly, the number of new DA neurons (Fig. 3c, red lines) was consistently higher compared with lost DA neurons (Fig. 3c, blue lines) both within animals and across the population (p < 0.05, Student's t test). The higher level of new versus lost cells implies that the absolute number of DA neurons continuously increases with age. In young adults (from ∼3 to ∼6 months of age), the number of DA neurons increased at a rate of 2–4% per month (Fig. 3d), but as animals matured the rate decreased to 1–2% per month (Fig. 3d). These experiments provide direct evidence for an overall net addition of DA neurons throughout young adulthood, reaching ∼13% net addition within a 9 month period, when the animal is 1 year old (Fig. 3d).
As identified by immunohistochemistry, 95% of the TH-positive cells express GFP, but 5% do not (Fig. 2d,e). Thus, it remained possible that part of the net increase could be a result of a sudden (late) expression of Cre and subsequently GFP in the TH+ cells. To assess this possibility, we compared the levels of GFP-negative/TH-positive cells at different ages. The level of GFP-negative/TH-positive neurons remained similar at different ages (3.7 ± 1.7% at 3 months of age, 4.7 ± 1.2% at 6 months of age, and 5.1 ± 1.2% at 13 ± 1.7 months of age; p = 0.92, ANOVA). Similarly, cell loss and addition could be a result of fluctuating GFP levels of the cells. To test this possibility, we followed over time a subset of the neurons that we scored as lost.” These neurons never reappeared in consecutive imaging sessions (N = 30 lost cells from 3 mice). Furthermore, this possibility seems unlikely because GFP expression is driven by the stable control of the CAG promoter (Lobe et al., 1999). In some cases, the “vacant” space seemed to be invaded by neuropile structures like stray dendrites, providing a positive control for the actual disappearance of the cell (Fig. 3e). To further confirm that the net addition is not an artifact of the chronic window (Fig. 1e), we imaged one animal through thinned bone for two consecutive sessions. Although this configuration is restricted only to the superficial GL, these results were similar to those collected through the chronic window (9.2% new cells and 4.8% lost cells in an 8 week period; N = 159 cells).Together, our results support a scenario whereby the relative proportion of DA neurons in the GL increases during the life of the animal.
Discussion
A window to the OB
We present a new chronic window preparation covering both hemispheres overlying the OBs in mice. This preparation is useful for optical imaging techniques and in particular for long-term applications of in vivo fluorescence microscopy. Genetic and optical imaging techniques have already become powerful tools for dissecting neural circuits in numerous animal models and brain regions (Luo et al., 2008). Thus, combining this chronic window preparation with structural and functional imaging experiments will allow better analyses of the dynamic nature of the OB with minimal intervention.
The combination of genetics and live imaging has been particularly useful for noninvasive studies in olfaction because the OB is located superficially and because it also serves as a powerful sensory system for genetic manipulations (Mizrahi and Katz, 2003; Bozza et al., 2004; Kobayakawa et al., 2007; Mizrahi, 2007; Fleischmann et al., 2008; Livneh et al., 2009; Tan et al., 2010). Long-term imaging in the OB has been technically challenging, and the chronic window that we describe here makes it technically easier. In addition, it allows imaging at depths significantly larger than those commonly used in thinned bone preparations, and it allows virtually unlimited number of imaging sessions with minimal interruption to the animal. The window is also well suited for physiological imaging techniques like intrinsic signal imaging or calcium imaging and can be used to study both bulbs simultaneously (Y. Adam, Y. Livneh, and A. Mizrahi, unpublished observations). As novel tools for functional time-lapse imaging at cellular resolution are continuously improving (Tian et al., 2009), our chronic window preparation holds promise for new physiologically and structurally based experiments in the mouse OB. Here we used the chronic window preparation to study a specific biological question: what are the turnover rates of one particular subpopulation (the DA neurons) in the glomerular layer over the first year of the animal's life?
Turnover of dopaminergic JGNs
Using transgenic mice, we imaged the same DA neurons over a period of 9 months, showing their continuous replacement. Notably, addition of JGNs has been observed previously. For example, using genetic fate mapping models, the total JGN population was estimated to receive 1.5–3.5% new neurons per month (Lagace et al., 2007; Ninkovic et al., 2007). In particular, Ninkovic et al. (2007) estimated that over a 9 month period, 24% of the DA neurons were new. Our data also show 3–4% per month of new DA neurons (i.e., ∼26% after 9 months), which is well in agreement with those fate mapping experiments. However, without knowing the number of neurons that are lost in the network the actual turnover rates remain uncertain. Time-lapse imaging is sensitive to both measures directly. In our sample, the level of lost DA neurons was significantly lower than the levels of new DA neurons, resulting in a net addition of ∼13% in 9 months (between the ages of 3 months and 1 year). We have previously estimated that for the general JGN population ∼1% of new cells per month were balanced by ∼1% of lost cells (Mizrahi et al., 2006). Thus, the net addition of DA neurons is probably not a common feature shared by all JGNs.
The turnover rates we present here are likely an underestimation of the actual turnover rates, for two reasons. First, identifying the same cells between sessions is a prerequisite for reliable analysis, and thus we have an inherent bias toward more stable regions. This bias may be larger in the longer time scales where larger changes occur and may explain the relative saturation that we found in net addition with time. Second, cells scored as stable could actually be lost cells that were replaced by new cells in the exact same spatial location. If this were the case, then the total amounts of both new and lost cells are in fact higher. Although we cannot rule out this possibility, it would still not affect the level of net addition that we report.
What is the outcome of adult neurogenesis in terms of population size and composition? Newborn neurons may be replacing older cells in a 1:1 ratio such that population composition is strictly maintained. Alternatively, adult neurogenesis may promote dynamic changes in the composition and/or size of the OB network. These options were also addressed in fixed tissue experiments using either fate mapping or histology. Batista-Brito et al. (2008) suggested that neuronal composition in the GL dramatically changes during early postnatal life. Later on at young adulthood, Bagley et al. (2007) showed that the various GL subpopulations are presented at similar proportions in the resident and the adult-born neurons, implying a stable neuronal composition in the GL. Whitman and Greer (2007) had similar results, with the exception of small over-representation of the DA neurons at this age. At longer time scales, fate mapping experiments showed that although the amount of adult-born neurons increases linearly with time, the fraction of calretinin cells among them increases while that of DA decreases with age (Ninkovic et al., 2007), thus suggesting a dynamic change in the composition of the GL with age. Finally, Mirich et al. (2002) used histology to show both increased GL volume and increased density of DA neurons with age. In contrast, Richard et al. (2010) used similar procedures but suggested that with age there is no significant change in either the neuronal composition or the overall neuronal amounts in the OB.
Although these conflicting results could be explained by the different mouse strains or quantification methods, they could also be a result of the high variability evident in fixed tissue experiments. Our data, collected in vivo and over a long time provides direct evidence in favor of composition changes in the GL with time. It is still unclear whether this net addition of DA cells causes an overall increase in the GL volume (in agreement with Mirich et al., 2002) or whether other subpopulations are diminished from the network (explaining the stable GL volume shown by Richard et al., 2010).
Our data probably do not fully reflect the magnitude of the dynamic changes as even the DA population has been suggested to be further divided into two subtypes. One subtype has large somata and connects many glomeruli within large distances. Neurons of the second subtype have smaller somata and innervate only a few glomeruli (Kosaka and Kosaka, 2007, 2011; Kiyokage et al., 2010). Since adult-born DA neurons belong mainly to the latter group (Kosaka and Kosaka, 2009), changes may be even more robust for this particular subtype.
Dopamine release acts primarily by inhibition of glutamate release from olfactory receptor neurons, directly modulating the input to the OB (Hsia et al., 1999). Functionally, decreased DA levels lead to activation of M/T cells by more odors, and contribute to impaired odor discrimination (Wilson and Sullivan, 1995). On longer time scales, the DA neurons are good candidates to change “on demand” based on experience-dependent plasticity. For example, the amount of dopamine production is activity dependent (Baker et al., 1993) and is also correlated with behavioral plasticity during early pregnancy (Serguera et al., 2008). Nevertheless, the implications of increased numbers of DA neurons with age are still unclear. Future physiological experiments may provide insights as to whether and to what extent the changes in network composition impact bulbar output.
Footnotes
This work was supported by a grant from the Human Frontiers Science Program and by European Research Council Grant 203994 to A.M. We thank Tal Zeidel Malkinson for help in developing the chronic window preparation, and Ronen Eavry for technical advice. We thank Yoav Livneh for assistance with the high-resolution imaging data, and Maya Groysman for help with lentivirus production. We thank Georgy Koentges for his advice on early stages of this project. We thank all the Mizrahi laboratory members for valuable comments on early versions of this manuscript.
The authors declare no competing financial interests.
References
- Adam Y, Mizrahi A. Circuit formation and maintenance–perspectives from the mammalian olfactory bulb. Curr Opin Neurobiol. 2010;20:134–140. doi: 10.1016/j.conb.2009.11.001. [DOI] [PubMed] [Google Scholar]
- Bagley J, LaRocca G, Jimenez DA, Urban NN. Adult neurogenesis and specific replacement of interneuron subtypes in the mouse main olfactory bulb. BMC Neurosci. 2007;8:92. doi: 10.1186/1471-2202-8-92. [DOI] [PMC free article] [PubMed] [Google Scholar]
- Baker H, Morel K, Stone DM, Maruniak JA. Adult naris closure profoundly reduces tyrosine hydroxylase expression in mouse olfactory bulb. Brain Res. 1993;614:109–116. doi: 10.1016/0006-8993(93)91023-l. [DOI] [PubMed] [Google Scholar]
- Batista-Brito R, Close J, Machold R, Fishell G. The distinct temporal origins of olfactory bulb interneuron subtypes. J Neurosci. 2008;28:3966–3975. doi: 10.1523/JNEUROSCI.5625-07.2008. [DOI] [PMC free article] [PubMed] [Google Scholar]
- Bhatt DH, Zhang S, Gan WB. Dendritic spine dynamics. Annu Rev Physiol. 2009;71:261–282. doi: 10.1146/annurev.physiol.010908.163140. [DOI] [PubMed] [Google Scholar]
- Bozza T, McGann JP, Mombaerts P, Wachowiak M. In vivo imaging of neuronal activity by targeted expression of a genetically encoded probe in the mouse. Neuron. 2004;42:9–21. doi: 10.1016/s0896-6273(04)00144-8. [DOI] [PubMed] [Google Scholar]
- Cline HT. Dendritic arbor development and synaptogenesis. Curr Opin Neurobiol. 2001;11:118–126. doi: 10.1016/s0959-4388(00)00182-3. [DOI] [PubMed] [Google Scholar]
- Drew PJ, Shih AY, Driscoll JD, Knutsen PM, Blinder P, Davalos D, Akassoglou K, Tsai PS, Kleinfeld D. Chronic optical access through a polished and reinforced thinned skull. Nat Methods. 2010;7:981–984. doi: 10.1038/nmeth.1530. [DOI] [PMC free article] [PubMed] [Google Scholar]
- Fleischmann A, Shykind BM, Sosulski DL, Franks KM, Glinka ME, Mei DF, Sun Y, Kirkland J, Mendelsohn M, Albers MW, Axel R. Mice with a “monoclonal nose”: perturbations in an olfactory map impair odor discrimination. Neuron. 2008;60:1068–1081. doi: 10.1016/j.neuron.2008.10.046. [DOI] [PMC free article] [PubMed] [Google Scholar]
- Hack MA, Saghatelyan A, de Chevigny A, Pfeifer A, Ashery-Padan R, Lledo PM, Götz M. Neuronal fate determinants of adult olfactory bulb neurogenesis. Nat Neurosci. 2005;8:865–872. doi: 10.1038/nn1479. [DOI] [PubMed] [Google Scholar]
- Holtmaat A, Svoboda K. Experience-dependent structural synaptic plasticity in the mammalian brain. Nat Rev Neurosci. 2009;10:647–658. doi: 10.1038/nrn2699. [DOI] [PubMed] [Google Scholar]
- Holtmaat A, Bonhoeffer T, Chow DK, Chuckowree J, De Paola V, Hofer SB, Hübener M, Keck T, Knott G, Lee WC, Mostany R, Mrsic-Flogel TD, Nedivi E, Portera-Cailliau C, Svoboda K, Trachtenberg JT, Wilbrecht L. Long-term, high-resolution imaging in the mouse neocortex through a chronic cranial window. Nat Protoc. 2009;4:1128–1144. doi: 10.1038/nprot.2009.89. [DOI] [PMC free article] [PubMed] [Google Scholar]
- Hsia AY, Vincent JD, Lledo PM. Dopamine depresses synaptic inputs into the olfactory bulb. J Neurophysiol. 1999;82:1082–1085. doi: 10.1152/jn.1999.82.2.1082. [DOI] [PubMed] [Google Scholar]
- Hübener M, Bonhoeffer T. Searching for engrams. Neuron. 2010;67:363–371. doi: 10.1016/j.neuron.2010.06.033. [DOI] [PubMed] [Google Scholar]
- Kiyokage E, Pan YZ, Shao Z, Kobayashi K, Szabo G, Yanagawa Y, Obata K, Okano H, Toida K, Puche AC, Shipley MT. Molecular identity of periglomerular and short axon cells. J Neurosci. 2010;30:1185–1196. doi: 10.1523/JNEUROSCI.3497-09.2010. [DOI] [PMC free article] [PubMed] [Google Scholar]
- Kobayakawa K, Kobayakawa R, Matsumoto H, Oka Y, Imai T, Ikawa M, Okabe M, Ikeda T, Itohara S, Kikusui T, Mori K, Sakano H. Innate versus learned odour processing in the mouse olfactory bulb. Nature. 2007;450:503–508. doi: 10.1038/nature06281. [DOI] [PubMed] [Google Scholar]
- Kosaka K, Kosaka T. Chemical properties of type 1 and type 2 periglomerular cells in the mouse olfactory bulb are different from those in the rat olfactory bulb. Brain Res. 2007;1167:42–55. doi: 10.1016/j.brainres.2007.04.087. [DOI] [PubMed] [Google Scholar]
- Kosaka T, Kosaka K. Two types of tyrosine hydroxylase positive GABAergic juxtaglomerular neurons in the mouse main olfactory bulb are different in their time of origin. Neurosci Res. 2009;64:436–441. doi: 10.1016/j.neures.2009.04.018. [DOI] [PubMed] [Google Scholar]
- Kosaka T, Kosaka K. “Interneurons” in the olfactory bulb revisited. Neurosci Res. 2011;69:93–99. doi: 10.1016/j.neures.2010.10.002. [DOI] [PubMed] [Google Scholar]
- Lagace DC, Whitman MC, Noonan MA, Ables JL, DeCarolis NA, Arguello AA, Donovan MH, Fischer SJ, Farnbauch LA, Beech RD, DiLeone RJ, Greer CA, Mandyam CD, Eisch AJ. Dynamic contribution of nestin-expressing stem cells to adult neurogenesis. J Neurosci. 2007;27:12623–12629. doi: 10.1523/JNEUROSCI.3812-07.2007. [DOI] [PMC free article] [PubMed] [Google Scholar]
- Lazarini F, Lledo PM. Is adult neurogenesis essential for olfaction? Trends Neurosci. 2011;34:20–30. doi: 10.1016/j.tins.2010.09.006. [DOI] [PubMed] [Google Scholar]
- Lee WC, Huang H, Feng G, Sanes JR, Brown EN, So PT, Nedivi E. Dynamic remodeling of dendritic arbors in GABAergic interneurons of adult visual cortex. PLoS Biol. 2006;4:e29. doi: 10.1371/journal.pbio.0040029. [DOI] [PMC free article] [PubMed] [Google Scholar]
- Lee WC, Chen JL, Huang H, Leslie JH, Amitai Y, So PT, Nedivi E. A dynamic zone defines interneuron remodeling in the adult neocortex. Proc Natl Acad Sci U S A. 2008;105:19968–19973. doi: 10.1073/pnas.0810149105. [DOI] [PMC free article] [PubMed] [Google Scholar]
- Lindeberg J, Usoskin D, Bengtsson H, Gustafsson A, Kylberg A, Söderström S, Ebendal T. Transgenic expression of Cre recombinase from the tyrosine hydroxylase locus. Genesis. 2004;40:67–73. doi: 10.1002/gene.20065. [DOI] [PubMed] [Google Scholar]
- Livneh Y, Feinstein N, Klein M, Mizrahi A. Sensory input enhances synaptogenesis of adult-born neurons. J Neurosci. 2009;29:86–97. doi: 10.1523/JNEUROSCI.4105-08.2009. [DOI] [PMC free article] [PubMed] [Google Scholar]
- Lledo PM, Merkle FT, Alvarez-Buylla A. Origin and function of olfactory bulb interneuron diversity. Trends Neurosci. 2008;31:392–400. doi: 10.1016/j.tins.2008.05.006. [DOI] [PMC free article] [PubMed] [Google Scholar]
- Lobe CG, Koop KE, Kreppner W, Lomeli H, Gertsenstein M, Nagy A. Z/AP, a double reporter for cre-mediated recombination. Dev Biol. 1999;208:281–292. doi: 10.1006/dbio.1999.9209. [DOI] [PubMed] [Google Scholar]
- Luo L, Callaway EM, Svoboda K. Genetic dissection of neural circuits. Neuron. 2008;57:634–660. doi: 10.1016/j.neuron.2008.01.002. [DOI] [PMC free article] [PubMed] [Google Scholar]
- Mirich JM, Williams NC, Berlau DJ, Brunjes PC. Comparative study of aging in the mouse olfactory bulb. J Comp Neurol. 2002;454:361–372. doi: 10.1002/cne.10426. [DOI] [PubMed] [Google Scholar]
- Mizrahi A. Dendritic development and plasticity of adult-born neurons in the mouse olfactory bulb. Nat Neurosci. 2007;10:444–452. doi: 10.1038/nn1875. [DOI] [PubMed] [Google Scholar]
- Mizrahi A, Katz LC. Dendritic stability in the adult olfactory bulb. Nat Neurosci. 2003;6:1201–1207. doi: 10.1038/nn1133. [DOI] [PubMed] [Google Scholar]
- Mizrahi A, Lu J, Irving R, Feng G, Katz LC. In vivo imaging of juxtaglomerular neuron turnover in the mouse olfactory bulb. Proc Natl Acad Sci U S A. 2006;103:1912–1917. doi: 10.1073/pnas.0506297103. [DOI] [PMC free article] [PubMed] [Google Scholar]
- Ninkovic J, Mori T, Götz M. Distinct modes of neuron addition in adult mouse neurogenesis. J Neurosci. 2007;27:10906–10911. doi: 10.1523/JNEUROSCI.2572-07.2007. [DOI] [PMC free article] [PubMed] [Google Scholar]
- Novak A, Guo C, Yang W, Nagy A, Lobe CG. Z/EG, a double reporter mouse line that expresses enhanced green fluorescent protein upon Cre-mediated excision. Genesis. 2000;28:147–155. [PubMed] [Google Scholar]
- Parrish-Aungst S, Shipley MT, Erdelyi F, Szabo G, Puche AC. Quantitative analysis of neuronal diversity in the mouse olfactory bulb. J Comp Neurol. 2007;501:825–836. doi: 10.1002/cne.21205. [DOI] [PubMed] [Google Scholar]
- Richard MB, Taylor SR, Greer CA. Age-induced disruption of selective olfactory bulb synaptic circuits. Proc Natl Acad Sci U S A. 2010;107:15613–15618. doi: 10.1073/pnas.1007931107. [DOI] [PMC free article] [PubMed] [Google Scholar]
- Serguera C, Triaca V, Kelly-Barrett J, Banchaabouchi MA, Minichiello L. Increased dopamine after mating impairs olfaction and prevents odor interference with pregnancy. Nat Neurosci. 2008;11:949–956. doi: 10.1038/nn.2154. [DOI] [PubMed] [Google Scholar]
- Shaner NC, Lin MZ, McKeown MR, Steinbach PA, Hazelwood KL, Davidson MW, Tsien RY. Improving the photostability of bright monomeric orange and red fluorescent proteins. Nat Methods. 2008;5:545–551. doi: 10.1038/nmeth.1209. [DOI] [PMC free article] [PubMed] [Google Scholar]
- Shepherd G, Chen WI, Greer CA. Olfactory bulb. In: Shepherd G, editor. The synaptic organization of the brain. Oxford: Oxford UP; 2004. pp. 165–216. [Google Scholar]
- Tan J, Savigner A, Ma M, Luo M. Odor information processing by the olfactory bulb analyzed in gene-targeted mice. Neuron. 2010;65:912–926. doi: 10.1016/j.neuron.2010.02.011. [DOI] [PMC free article] [PubMed] [Google Scholar]
- Tian L, Hires SA, Mao T, Huber D, Chiappe ME, Chalasani SH, Petreanu L, Akerboom J, McKinney SA, Schreiter ER, Bargmann CI, Jayaraman V, Svoboda K, Looger LL. Imaging neural activity in worms, flies and mice with improved GCaMP calcium indicators. Nat Methods. 2009;6:875–881. doi: 10.1038/nmeth.1398. [DOI] [PMC free article] [PubMed] [Google Scholar]
- Whitman MC, Greer CA. Adult-generated neurons exhibit diverse developmental fates. Dev Neurobiol. 2007;67:1079–1093. doi: 10.1002/dneu.20389. [DOI] [PubMed] [Google Scholar]
- Whitman MC, Greer CA. Adult neurogenesis and the olfactory system. Prog Neurobiol. 2009;89:162–175. doi: 10.1016/j.pneurobio.2009.07.003. [DOI] [PMC free article] [PubMed] [Google Scholar]
- Wilson DA, Sullivan RM. The D2 antagonist spiperone mimics the effects of olfactory deprivation on mitral/tufted cell odor response patterns. J Neurosci. 1995;15:5574–5581. doi: 10.1523/JNEUROSCI.15-08-05574.1995. [DOI] [PMC free article] [PubMed] [Google Scholar]
- Xu HT, Pan F, Yang G, Gan WB. Choice of cranial window type for in vivo imaging affects dendritic spine turnover in the cortex. Nat Neurosci. 2007;10:549–551. doi: 10.1038/nn1883. [DOI] [PubMed] [Google Scholar]