

Abstract
Neurons in the dorsal nucleus of the lateral lemniscus (DNLL) receive excitatory and inhibitory inputs from the superior olivary complex (SOC) and convey GABAergic inhibition to the contralateral DNLL and the inferior colliculi. Unlike the fast glycinergic inhibition in the SOC, this GABAergic inhibition outlasts auditory stimulation by tens of milliseconds. Two mechanisms have been postulated to explain this persistent inhibition. One, an “integration-based” mechanism, suggests that postsynaptic excitatory integration in DNLL neurons generates prolonged activity, and the other favors the synaptic time course of the DNLL output itself. The feasibility of the integration-based mechanism was tested in vitro in DNLL neurons of Mongolian gerbils by quantifying the cellular excitability and synaptic input–output functions (IO-Fs). All neurons were sustained firing and generated a near monotonic IO-F on current injections. From synaptic stimulations, we estimate that activation of approximately five fibers, each on average liberating ∼18 vesicles, is sufficient to trigger a single postsynaptic action potential. A strong single pulse of afferent fiber stimulation triggered multiple postsynaptic action potentials. The steepness of the synaptic IO-F was dependent on the synaptic NMDA component. The synaptic NMDA receptor current defines the slope of the synaptic IO-F by enhancing the temporal and spatial EPSP summation. Blocking this NMDA-dependent amplification during postsynaptic integration of train stimulations resulted into a ∼20% reduction of the decay time course of the GABAergic inhibition. Thus, our data show that the NMDA-dependent amplification of the postsynaptic activity contributes to the GABAergic persistent inhibition generated by DNLL neurons.
Introduction
Direct synaptic inhibition is fast in the lower ascending auditory pathway, with IPSP decay times between 1 and 2 ms. This fast, usually glycine-mediated inhibition is involved in coincidence detection (Brand et al., 2002; Pecka et al., 2008) and the temporally precise suppression of excitation (Tsuchitani and Boudreau, 1966; Boudreau and Tsuchitani, 1968; Moore and Caspary, 1983; Tollin and Yin, 2005). In the ascending pathways on the level of the dorsal nucleus of the lateral lemniscus (DNLL), GABAergic inputs suddenly generate an inhibition of a different time domain. Originating from DNLL neurons (Adams and Mugnaini, 1984; Roberts and Ribak, 1987; Kelly and Kidd, 2000; Burger and Pollak, 2001), this GABAergic inhibition outlasts an auditory stimulus by tens of milliseconds (Yang and Pollak, 1994; Burger and Pollak, 2001; Pecka et al., 2007). Functionally, this persistent inhibition is involved in binaural processing and has been suggested to be a basis for echo suppression (Yang and Pollak, 1994, 1998; Kelly and Kidd, 2000; Burger and Pollak, 2001; Pecka et al., 2007).
Excitation to the DNLL network is mainly supplied by ascending fibers originating from the superior olivary complex (SOC) (Glendenning et al., 1981; Iwahori, 1986; Shneiderman et al., 1988; Oliver and Shneiderman, 1989; Huffman and Covey, 1995; Henkel, 1997; Siveke et al., 2006). The GABAergic output of the DNLL projects to its contralateral counterpart and both hemispheres of the inferior colliculus (Shneiderman et al., 1988; Kelly et al., 2009). Neither the excitatory inputs and their cellular integration mechanisms in DNLL neurons, nor the cellular physiology of the GABAergic output has been quantitatively described. As a result, two mechanisms promoting GABAergic persistent inhibition are still debated.
One, the “output-based” mechanism, relies on a slow time course of the GABAergic inhibitory currents between DNLL neurons and their postsynaptic target (Wu and Kelly, 1996; Pecka et al., 2007). Pecka et al. (2007) reported synaptic GABAergic time constants elicited by a short train of fiber stimulations that may explain the time course of the observed persistent inhibition. This mechanism is further supported by the lack of clear ongoing activity in DNLL neurons for short auditory stimuli in vivo (Siveke et al., 2006; Pecka et al., 2007). Despite the apparent lack of ongoing activity in DNLL neurons, other in vivo (Kelly and Kidd, 2000) and in vitro (Fu et al., 1997) recordings lead to the hypothesis of an “integration-based” mechanism. This second mechanism assumes the generation of multiple action potentials (APs) in a DNLL neuron on a single presynaptic AP in the excitatory input pathways. This postsynaptic mechanism would lead to the maintenance and extension of the GABAergic output of the DNLL in correlation with the elicited APs. Importantly, both mechanisms that try to explain the persistent inhibition are not mutually exclusive, but rather could act in series. The integration-based mechanism supports high firing frequencies and leads to small temporal extensions of activity that are further transformed at the GABAergic output synapse to generate the required time window of the persistent inhibition.
Materials and Methods
Slice preparation.
All experiments complied with national and regional laws. Slices were prepared from male and female Mongolian gerbils (Meriones unguiculatus) of postnatal day 15 (P15) to P17 and P48–P60. Animals were decapitated and brains were removed in dissection solution containing the following (in mm): 50 sucrose, 25 NaCl, 25 NaHCO3, 2.5 KCl, 1.25 NaH2PO4, 3 MgCl2, 0.1 CaCl2, 25 glucose, 0.4 ascorbic acid, 3 myo-inositol, and 2 Na-pyruvate, pH 7.4, when bubbled with 95% O2 and 5% CO2. Subsequent to the removal of the brain, coronal brainstem slices of 200 μm thickness containing the DNLL were taken with a VT1200S vibratome (Leica) in ice-cold solution. Slices were incubated at 36°C for 45 min in extracellular recording solution (same as slice solution but with 125 mm NaCl, 2 mm CaCl2, 1 mm MgCl2, and no sucrose).
Electrophysiology.
After incubation, the slices were transferred to a recording chamber and continuously perfused with extracellular solution. The recording chamber was attached to a microscope (BX50WI; Olympus) equipped with gradient contrast illumination (Luigs & Neumann). If not stated otherwise, recordings were performed at near-physiological temperatures of 34–36°C. Cells were visualized and imaged with a TILL Photonics system composed of a CCD camera and a poly-IV monochromator. Whole-cell voltage-clamp and current-clamp recordings were performed using an EPC10/2 amplifier (HEKA Elektronik) on visually identified DNLL neurons. During voltage-clamp recordings, the access resistance was compensated to a residual of 2.8–3 MΩ. In current-clamp mode, the bridge balance was adjusted to 100%. The data were acquired at 20 kHz and filtered at 3 kHz. Synaptic currents were evoked by stimulating afferent fibers with a glass electrode filled with extracellular solution. Fibers were either stimulated with a 200 μs voltage pulse generated by the EPC10/2 amplifier (HEKA Elektronik) and postamplified 10× by a linear stimulus isolator (A395; World Precision Instruments) or by an Isolated Pulse Stimulator (model 2100; A-M Systems; Science Products) triggered by the EPC10/2 amplifier. To allow for synaptic recovery, the time between single stimulus pulses or paradigms was at least 7 s.
EPSCs were recorded in the presence of strychnine (1 μm) and 6-imino-3-(4-methoxyphenyl)-1(6H)-pyridazine]butanoic acid hydrobromide (SR95531) (10 μm) at −60 mV holding potential. AMPA receptor (AMPAR)-mediated EPSCs were isolated with additional d-AP5 (50 μm) or 3-((R)2-carboxypiperazin-4-yl)propyl-1-phosphonic acid (CPP) (10 μm). The waveforms of simulated EPSPs (simEPSPs) and currents (simEPSCs) were generated from previously recorded EPSPs and EPSCs, respectively, and processed in IGORpro, in which they were offset corrected for resting potential or leak current and finally scaled. The resulting stimulation waveforms were then used as command templates to control the EPC10/2 amplifier. GABAergic IPSPs were recorded in the presence of strychnine (1 μm), d-AP5 (50 μm), and DNQX (20 μm). Ca2+ currents were isolated in the presence of 10 mm tetraethylammonium (TEA), 2 mm 4-AP, 1 μm TTX, 50 μm ZD7288 (4-ethylphenylamino-1,2-dimethyl-6-methylaminopyrimidinium chloride), 10 μm SR95531, 0.5 μm strychnine, 20 μm DNQX, and 50 μm d-AP5. Leak and capacitive current subtraction was performed with a P/x protocol with corresponding −10 mV simEPSP command waveforms. The intracellular solution used to record EPSCs and Ca2+ currents in voltage-clamp mode only was as follows (in mm): 130 Cs-gluconate, 10 Cs-HEPES, 20 TEA-Cl, 3.3 MgCl2, 2 Na2-ATP, 0.3 Na-GTP, 3 Na2-phosphocreatine, 5 EGTA, and 50–70 μm Alexa 488 hydrazide or its 568 analog. To record EPSCs and EPSPs in the same cell by switching the amplifier mode, the standard current-clamp intracellular solution was used (in mm: 145 K-gluconate, 5 KCl, 10 HEPES, 2 K-ATP, 2 Mg-ATP, 0.3 Na-GTP, 10 Na2-phosphocreatine, 5 EGTA, and 50–70 μm Alexa 488 hydrazide or its 568 analog). For blocking the AP generation intracellularly, 5 mm N-(2,6-dimethylphenylcarbamoylmethyl)triethylammonium bromide (QX314 bromide) or extracellularly 1 μm TTX was added. Intracellular solutions were adjusted to pH 7.2 with CsOH or KOH. Dye-loaded cells were routinely reconstructed to confirm the recording location. The data were analyzed and presented without correction for the liquid junction potential (∼15 mV).
Ca2+ imaging.
Cells were loaded with 100 μm fluo-4 during whole-cell recordings, and Ca2+ transients were imaged with a TILL Photonics system. Images were acquired at 50 Hz with an exposure time of 18 ms. The excitation was given by the poly-IV monochromator at 488 nm. The emission was bandpass filtered between 505 and 545 nm. The fluorescence changes were extracted from a region of interest (roi) placed carefully around the somatic borders. To correct for background fluorescence, an area of interest (aoi) was placed in the vicinity of the soma. Care was taken that the background aoi did not overlap with any part of the recorded neuron. In general, the aoi was of a similar size to the somatic roi. Ca2+ transients were off-line corrected for background fluorescence (ΔF). These ΔF values were normalized to the average intensity of five images taken directly before the simulation command and are expressed as change in percentage.
Data analysis.
Currents were analyzed in IGORpro (Wavemetrics). Miniature EPSCs were extracted by a custom-written template matching routine (Taschenberger et al., 2005; Couchman et al., 2010). Imaging data were extracted from TILL Photonics software and analyzed in Excel. Results are presented as mean ± SEM. Significance was tested using Student's t test.
Results
Here, we aimed to test the feasibility of the integration-based mechanism and its impact on the GABAergic output signal by investigating excitatory integration in DNLL neurons and its influence on the time course of GABAergic IPSPs. Therefore, the basic membrane and AP properties and basal excitatory synaptic transmission were characterized. Second, to see whether multiple APs can be generated on a single presynaptic fiber shock, we determined synaptic input–output functions (IO-Fs) at the levels of EPSP and AP generation. Finally, it was probed how temporally extended activity in DNLL neurons affect their GABAergic output.
Basic membrane physiology and action potential behavior of DNLL neurons
Our first aim was to describe the basic firing pattern and membrane properties of neurons in the DNLL of juvenile [postnatal day 15 (P15) to P17] Mongolian gerbils. First, we injected short current steps of 1 ms to elicit single APs (Fig. 1A). Second, 300-ms-long current steps were injected to hyperpolarize and depolarize the cell finally leading to APs (Fig. 1B). To determine the impact of temperature on the basic properties of these cells, the same experiments were conducted both at near-physiological temperature and at room temperature (Fig. 1). The membrane time constant was extracted by fitting an exponential function to the onset of the smallest hyperpolarization evoked by a −50 pA current injection. The same hyperpolarization voltage response was used to calculate the input resistance of the cell. The membrane input resistance and the time constant varied widely, as did the resting potential (Fig. 1). At near-physiological temperature, the time constants ranged from 4.2 to 31.6 ms (average, 14.9 ± 2.3 ms) and input resistances from 60 to 300 MΩ (average, 120 ± 19 MΩ) were observed (Fig. 1C,D). Both correlated well with the resting potential (shown for time constants) (Fig. 1C) and with each other (Fig. 1D). Generally, the variation of the time constant and input resistance was larger at low temperature. Furthermore, significant differences were found between the average time constant and input resistance in recordings at low temperature and those at near-physiological temperature (Fig. 1C,D) (each p < 0.05).
Figure 1.
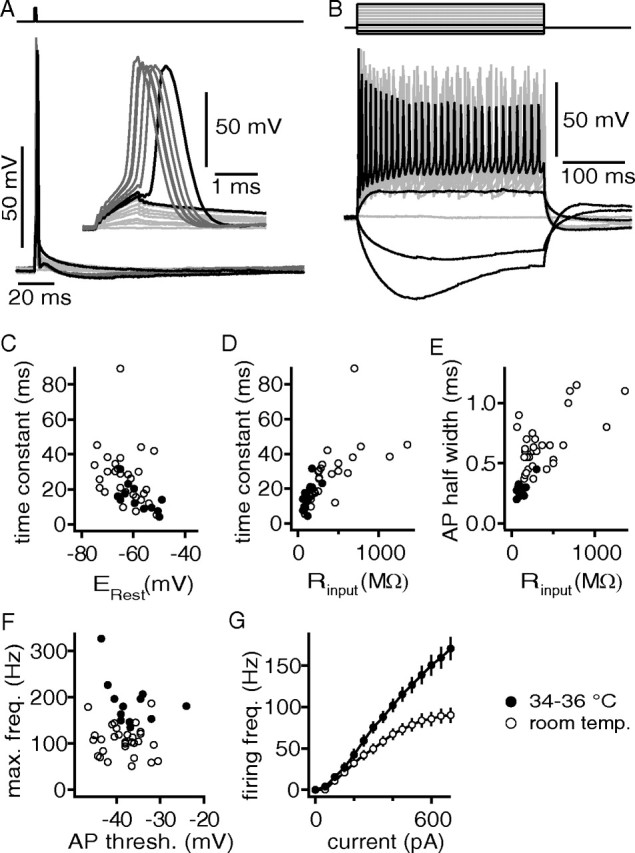
Basic membrane and firing properties of juvenile DNLL neurons. A, APs were induced by 1 ms current injections ranging from 0 to 1500 pA. The inset shows a magnified view of the APs. B, Persistent firing was observed during 300 ms current injections. From the smallest hyperpolarizing current steps, the membrane resistance and membrane time constant were estimated. Depolarizing current steps from 0 to 700 pA were used to estimate the maximal firing frequency (F) and the IO-F (G). C, Membrane time constant as a function of resting potential. D, Membrane time constant as a function of membrane resistance Rinput. E, AP half-widths were determined from the first suprathreshold current injection as shown in A and are plotted as a function of Rinput. F, Maximal firing frequency extracted from the IO-F and plotted as a function of the AP voltage threshold. The voltage threshold was derived from APs elicited by the first suprathreshold current injections. G, IO-Fs at different recording temperatures.
In the following, the generation of APs and their shape were analyzed. APs become more than twice as fast at physiological temperature (0.28 ± 0.02 ms) when compared with room temperature (0.65 ± 0.04 ms) (Fig. 1E). At both temperatures, the AP half-width appeared to depend on the input resistance (Fig. 1E). The AP voltage threshold ranged from −43.5 to −24 mV (average, −36.4 ± 1.4 mV) at ∼35°C and was not significantly different than the values obtained at room temperature (Fig. 1F) (p > 0.05). The maximal firing rate was significantly temperature dependent (p < 0.05), ranging from 134 to 326 Hz at near-physiological temperature (Fig. 1F).
The IO-F of neurons describes their biophysical firing capabilities. In vitro current-clamp recordings of DNLL neurons indicated a near-monotonic rise in AP rate (Wu and Kelly, 1995). In agreement with this, all of our 49 recorded neurons generated sustained AP firing. We did not find any neurons that generated only an onset or phasic response to the injected current steps. However, some neurons showed a small pause after the first AP before steady firing commenced (data not shown). On average, our population shows a clear increase in the number of APs as a function of the injected current amplitude. The average firing rates (Fig. 1G) measured in response to 300-ms-long current injections of 700 pA were 170 ± 14 Hz at near-physiological (n = 20) and 90 ± 9 Hz at room temperature (n = 29).
Stimulation of excitatory inputs to DNLL neurons reliably evoked postsynaptic APs (Fig. 2A). As shown previously (Fu et al., 1997), strong stimulation intensities evoked more than one AP. Moreover, injection of different holding current amplitudes during synaptic simulation altered the number of evoked APs (Fig. 2A). In all cells tested (n = 9), the number of APs increased when a positive current injection decreased the baseline membrane potential (Fig. 2A,B). A hyperpolarizing current injection reduced the number of APs (n = 9). For the function of the DNLL circuit, it is important that addition of APs will prolong the time window of postsynaptic activity. This activity window was determined by measuring the time between the stimulation and the last postsynaptic AP. The activity window of the example in Figure 2C increased from 2 to 10 ms. This phenotype was observed in all cells tested with a maximal average change in the time of the activity window of 16.9 ± 4.6 ms. Overall, trials that elicited a single AP had an activity window of 1.5 ± 0.2 ms, and when four APs were elicited the average activity window was 8.2 ± 1.1 ms (Fig. 2D).
Figure 2.

The number of synaptically evoked action potentials can be modulated by the baseline membrane potential. A, Synaptically evoked APs during the injection of different holding currents ranging from −100 to 250 pA. B, Number of synaptically evoked APs as a function of the baseline membrane potential. C, The time of the postsynaptic activity window as a function of the baseline membrane potential adjusted with different holding currents. B, C, Same cell as in A. D, The time of the postsynaptic activity window as a function of the evoked APs. The different symbols represent a given cell (n = 9). The solid symbols correspond to trials recorded at 0 pA current injections.
In the following, we asked whether the sustained spiking behavior as a response to current injections (Fig. 1) can be also elicited synaptically. In general, the postsynaptic responses to excitatory fiber stimulations of 10 pulses applied at 333 Hz differed substantially between cells. Some neurons responded with a single AP at the onset of the stimulation train, others responded with multiple APs (Fig. 3A,B). As the resting potential in the presented examples is similar, the difference in the postsynaptic voltage response profile must be caused by a mechanism other than the value of the resting potential. Also, onset responses were not caused by the spiking capability of the cells, since in all cells firing rates of 500 Hz could be driven with hair comb current injection protocols (Fig. 3C). To test whether the different postsynaptic voltage response profiles are based on different synaptic current amplitudes, we switched between current- and voltage-clamp conditions. Since DNLL neurons have a relatively high input resistance (Fig. 1), it is possible to use current-clamp internal solutions and yet impose well controlled voltage-clamp conditions. Therefore, it is feasible to record both the synaptic currents and potentials evoked by the same fiber stimulation site and strength in a given cell (Fig. 3A,B). In general, excitatory synaptic inputs recorded at a holding potential of −60 mV depressed in a frequency-dependent manner (Fig. 3D). Furthermore, in neurons that responded only with a single AP, the EPSCs depressed strongly with no buildup of a background current (Fig. 3A). In neurons that responded with multiple APs, we found also strong depression of EPSC amplitudes, but these input sites appeared to generate a strong background current (Fig. 3B). However, both neurons were excited by similar initial EPSC amplitudes. Thus, it seems that the number of APs generated in response to synaptic input depended mainly on the synaptically transferred charge.
Figure 3.

The number of synaptically activated APs appears to depend on the size of EPSC, not on postsynaptic spiking properties. A, B, Examples of different AP numbers evoked by the same stimulation paradigm (10 pulses, 333 Hz). Stimulation times are shown as dots. The synaptic current in A did not produce a background current and elicited only one AP. When synaptic currents induced a strong background current, multiple APs were elicited (B). In any case, depression of EPSC amplitudes was severe (D). C, All cells, similar to the depicted example, followed with APs to 1 ms current injections up to 500 Hz. The inset shows last AP of the train. D, EPSCs depress during a 10 pulse stimulation paradigm in a frequency-dependent manner.
For the following experiments, it was decided not to adjust the resting membrane potential between cells to a defined value. This decision was based on the following reasons. First, neurons in the DNLL show a large variation in the resting membrane potential (Fig. 1C), and thus an average resting potential of the neuronal population might only be ambiguously defined. Second, and likely a consequence of the first point, it was difficult to current clamp DNLL neurons steadily to a defined resting potential over the required recording period. Furthermore, as described above (Fig. 3A,B), cells respond at the same resting potential differently to similar synaptic inputs; therefore, the resting potential only partially determines the postsynaptic AP response profile.
Excitatory synaptic transmission to DNLL neurons
So far, we found that DNLL cells generate monotonic IO-Fs during injections of long current steps and that the synaptic charge transfer appears to be a crucial determinant of the AP number synaptically elicited. In the following, we focused on the synaptic impact on AP generation and therefore analyzed the synaptically evoked AP number and the EPSP shape with respect to the synaptically transferred charge. As the EPSC is the basis of the generated EPSP, we first characterized the basal excitatory synaptic transmission (Fig. 4).
Figure 4.
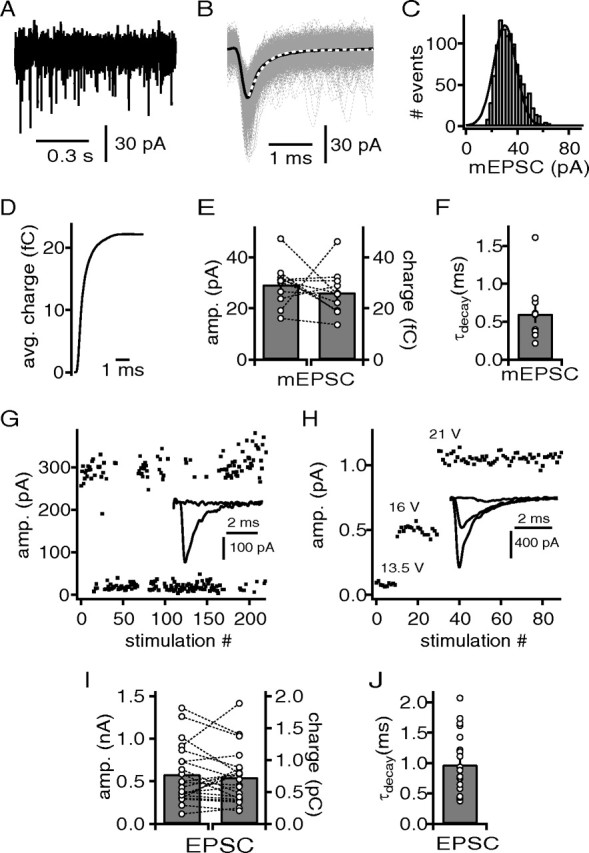
Quantal content of excitatory input fibers to DNLL neurons. A, Example recording of mEPSCs. B, Extracted and aligned mEPSCs from the recording of the cell shown in A. Average mEPSC (black line) was used to determine the decay time constant with an exponential fit (white dotted line), and the 20–80% rise time. C, Frequency histogram of the peak amplitudes of mEPSCs from the recordings in A. A Gaussian fit (black line) was used to determine the median and the coefficient of variation of the mEPSC distribution. D, Integrated average mEPSC from B. E, mEPSC amplitude derived from the Gaussian fits and the corresponding charge of the average mEPSC. F, The decay time of the average mEPSCs. G, Minimal stimulation paradigm with a stimulation strength close to threshold inducing EPSC events and failures. The inset shows overlaid failure and EPSC event response. H, Minimal stimulation paradigm with increasing stimulation strength to obtain step-like EPSC responses. The inset shows EPSCs at different stimulation intensities. I, Peak amplitude and the corresponding charge of the average minimal evoked EPSCs. J, The decay time of the average minimal evoked EPSCs.
Miniature EPSCs (mEPSCs) were recorded with exogenously applied potassium and sodium channel blockers and extracted off-line with a threshold template matching routine (Taschenberger et al., 2005; Couchman et al., 2010). Under these recording conditions, the frequency of mEPSCs appeared enhanced possibly via the depolarization of presynaptic terminals because of the blockade of low-voltage-activated potassium channels (Scott et al., 2005). For each cell, an average mEPSC was generated (Fig. 4B), which was used to extract the decay time constant and the quantal charge transferred at −60 mV (Fig. 4D). In the presented example, the median of a Gaussian fit to the frequency histogram differed ∼20% from the peak amplitude of the average mEPSC (Fig. 4, compare B, C). This difference is not unusual for the right skew of mEPSC distributions. The population average of the mEPSC amplitude was 29.3 ± 3 pA determined through Gaussian fits (Fig. 4E) (n = 11). This average mEPSC amplitude corresponded to an average transferred charge of 26.3 ± 2.6 fC (Fig. 4E). Furthermore, the mEPSCs decayed with an average time constant of 0.60 ± 0.12 ms (Fig. 4F).
The next aim was to determine the average quantal content of single excitatory fibers synapsing on DNLL neurons. Minimal stimulation paradigms were used to estimate the EPSC size of a single excitatory fiber and inferred from these recordings the quantal content by dividing it with the described average mEPSC size. In 20 cells, 21 independent fiber inputs were recorded using two different minimal stimulation protocols. First, we used stimulation intensities close to threshold, generating both failures and EPSCs (Fig. 4G) (n = 13 fibers). Second, the stimulation intensities were raised in subvoltage increments so that clear step-like increases in EPSC size were observed (Fig. 4H) (n = 14 fibers). Since no differences were apparent between the results of both approaches, the data were pooled. The average excitatory fiber generated an EPSC of 0.59 ± 0.07 nA (Fig. 4I) and decayed with time constants between 0.37 and 2.06 ms (0.97 ± 0.1 ms) (Fig. 4J). To reduce the potential effect of dendritic filtering on the size of the EPSCs, their charge was analyzed. The average single fiber generated EPSC charges of 0.73 ± 0.08 pC (Fig. 4I). Thus, it follows that the average quantal content of an excitatory fiber to DNLL neurons was ∼16 vesicles estimated on the basis of current amplitudes, and ∼20 vesicles on the basis of the EPSC and mEPSC charges.
So far, we have quantified the basal excitatory synaptic transmission to DNLL neurons at a holding potential of −60 mV. At this holding potential, the synaptic currents are dominated by AMPARs (Mayer et al., 1984; Nowak et al., 1984; Forsythe and Westbrook, 1988). Earlier in vitro (Wu and Kelly, 1996; Fu et al., 1997) and in vivo (Kelly and Kidd, 2000) results showed that NMDA receptor (NMDAR) responses are also present in DNLL neurons. Therefore, in the following, the presence and time course of synaptic NMDAR currents was assessed.
Neurons were clamped to holding potentials of −60 and +40 mV and strong stimulations activating multiple afferent fibers were used to elicit EPSCs (Fig. 5A). At −60 mV, fast AMPAR-mediated EPSCs were present with decay time constants of between 0.6 and 4.3 ms (Fig. 5B). At +40 mV, the EPSCs decayed with time constants of between 11.1 and 31.3 ms (Fig. 5A,B), indicating a synaptic NMDA component. It was pharmacologically verified that these slow EPSCs recorded at +40 mV were mediated by NMDARs (d-AP5, n = 7; CPP, n = 4). NMDAR antagonists reduced the EPSC decay time constants recorded at +40 mV to values nearly matching the decays of EPSCs measured at −60 mV (Fig. 5C) (n = 11). An alternative way to demonstrate the existence of synaptic NMDAR currents and quantify their contribution is to exploit the voltage dependency of the Mg2+ block of the NMDARs as shown in Figure 5D (Mayer et al., 1984; Nowak et al., 1984; Forsythe and Westbrook, 1988). Extracting the peak of the NMDA component at +45 mV before and after pharmacological blockade revealed that it is more than two times larger than the AMPA component at this holding potential (Fig. 5E). To estimate the relationship between the NMDA component recorded at +45 mV and the AMPA component obtained at −60 mV, peak currents were plotted against each other as absolute values (Fig. 5F). This analysis showed that the peak sizes of the synaptic NMDA and AMPAR currents were linearly correlated.
Figure 5.

Excitation is mediated by AMPAR and NMDAR currents in DNLL neurons from juvenile gerbils. A, Synaptically evoked EPSCs recorded at −60 and +40 mV holding potential. The white dotted lines indicate an exponential fit to the decay of the EPSCs. B, Decay time constants recorded at −60 and +40 mV. Shown are black squares and diamonds from cells in which d-AP5 or CPP, respectively, was subsequently applied. The black dotted line equals unity. C, Effect of blocking NMDAR currents with either d-AP5 or CPP on the decay time constants at different holding potentials. D, Synaptically evoked EPSC at different holding potentials before (top) and after (bottom) the application of d-AP5. The small lines indicate the region that was used to estimate the AMPAR and NMDAR currents. E, Synaptically evoked EPSC size as a function of holding potential. The circles indicate AMPAR, and the squares indicate NMDAR currents before (black) and after (open) application of d-AP5. F, Correlation of the absolute size of the NMDAR (holding potential, +45 mV) and AMPAR (holding potential, −60 mV) peak currents. The symbol code is as in B. The solid line represents a linear regression.
NMDA receptors amplify EPSP summation and generation of action potentials
We have shown that DNLL neurons generate a near monotonic IO-F and that the number of synaptically evoked APs is probably determined by the transferred charge. To test the feasibility of the integration-based mechanism as a cellular basis of persistent inhibition, the direct relationship between synaptic charge and number and timing of generated APs was quantified.
Increasing the fiber stimulation intensity of single shocks from 0 to 80 V in 10 V steps led to a step-like increase in the EPSC amplitude (Fig. 6A). The same increase in stimulation intensity increased the number of evoked APs (Fig. 6A) in 10 of 18 recordings. To further assess whether the number of APs was correlated with the synaptically transferred charge, the amount of synaptically transferred charge was increased by stimulating the afferent fibers at high frequencies (10 pulses at 333 Hz) (Fig. 6B). As for the single fiber shock stimulation, the number of APs increased with increased synaptic charge induced by the train stimulation (Fig. 6D,E). These data were used to analyze the relationship between the numbers of elicited APs and the transferred synaptic charge at a given stimulation intensity (Fig. 6D). The initial slope of the correlation between AP frequency and synaptic charge was 2.4 APs/10 pC (Fig. 6D, black symbols) (n = 16). Including the 333 Hz stimulations, the overall correlation between AP number and synaptic charge (Fig. 6E, black symbols) (n = 16) increased at a rate of 2 APs/10 pC of AMPAR-mediated charge (fits fixed at 0 y-intercept). Together, the synaptic IO-F shows that a single pulse of fiber stimulation can induce multiple postsynaptic APs, depending on the synaptically transferred charge.
Figure 6.

The NMDAR currents enhance the synaptically IO-F. A, Synaptically evoked EPSCs recorded at −60 mV (top), and synaptic evoked voltage response of the same neuron in current clamp (bottom). For both recording modes, the stimulus intensity was varied between 80 and 0 V, applied to the same stimulation site. B, Synaptically evoked EPSCs from a 10 pulse, 333 Hz stimulus train (top). The same stimulus was applied in current clamp (bottom). The cell is the same as in A. C, Injection of a simulated and scaled EPSC (simEPSC) waveform as a current-clamp command (top). Bottom shows the corresponding evoked voltage response to the simEPSC. The black traces in the top and the bottom graph depict the subthreshold and suprathreshold current injections. D, Synaptic IO-Fs of cells from experiments in A and C. The solid circles represent data from the control population (n = 16), open circles represent data from cells recorded with bath-applied d-AP5 (n = 19), and the gray circles represent data obtained with simEPSC current injections (n = 5). The black solid and dotted lines represent linear regression fits. The gray dotted lines indicate the amount of EPSC charge needed to trigger one AP. E, Same graph as in D, additionally including data from experiments in B. Regressions were fit with a fixed zero x–y crossing. F, Occurrence of AP in time in response to a single afferent fiber stimulation event plotted as a function of EPSC charge. The circles represent first; squares, second; triangles, third; and diamonds, fourth evoked AP. The solid symbols show control data, and the open symbols show cells recorded in the presence of d-AP5.
We next asked whether the described synaptic IO-F is solely based on AMPAR currents or whether additionally a synaptic NMDA component contributes. The experiment described above was therefore repeated in the presence of d-AP5 (Fig. 6D,E). In these cells, the resting membrane potential was not significantly different (p > 0.05) from the control group. Under these conditions, a single EPSC, regardless of size, only evoked in 4 of 19 recordings more than one AP (Fig. 6D, open symbols) (n = 19). This is illustrated by the shallower relationship between AP number and synaptic charge (1.7 AP/10 pC). When the inputs to these cells were stimulated with 10 pulses at 333 Hz the number of APs barely reached 10 (Fig. 6E, open symbols) (n = 19). The overall relationship between EPSC charge and AP number decreased (1.2 AP/10 pC; fit fixed at 0 y-intercept) compared with the control group. This indicates that the underlying NMDAR current increases the number of APs generated during synaptic stimulation. To verify that a single AMPA-mediated EPSC, regardless of size elicits only a single AP, we used a recorded EPSC as a current-clamp template and scaled it to various sizes (Fig. 6C) ranging from 0.82 to 13.2 pC. Injecting such simEPSC current waveforms never induced more than one AP (Fig. 6D, gray closed symbols) (n = 6). Together, this shows that a single AMPA-mediated EPSC or EPSC-waveform, regardless of its size, is mainly capable of evoking one AP. However, multiple high-frequency AMPAR-mediated inputs might induce as many APs as pulses applied. Thus, for AMPAR-mediated EPSCs alone, the AP rate is limited and might depend on the amount of short-term depression.
Next, the timing of the generated postsynaptic APs was analyzed (Fig. 6F). The first AP occurred within the first 2 ms after the fiber was stimulated (Fig. 6F, circles). There was no significant difference in the temporal pattern of the first AP between control cells and cells recorded in the presence of d-AP5. In 10 of 18 control cells and in only 4 of 19 cells recorded in the presence of d-AP5, a second AP was elicited. If a second AP was generated, it occurred within the first 5 ms after fiber stimulation; again there was no significant difference between both cell groups (Fig. 6F, squares). This shows so far that the generation of a second AP prolongs the postsynaptic activity ∼3 ms. In no case was a third AP elicited when NMDA currents were blocked. Under control conditions, 7 of 18 cells generated a third AP (Fig. 6F, triangles). The average time of the latest spikes (80 V stimulation intensity) was 8.5 ± 2.1 ms. This compares with the first AP as a ∼6 ms extended postsynaptic activity period. In two of these 18 cells, a fourth AP was generated ∼13 ms after the fiber stimulation (Fig. 6F, diamonds), meaning that an extra time window of 11 ms of postsynaptic activity is added. Together, the synaptic NMDA component elicited by a single presynaptic fiber stimulation event allows for the generation of additional spikes that can prolong the postsynaptic activity for up to ∼10 ms.
From the data presented so far, the average number of fibers and released vesicles necessary to elicit an AP in DNLL neurons can be estimated, under the assumption of no inhibitory background activity. The average fiber terminating on a DNLL neuron released ∼18 vesicles transferring an AMPAR-mediated charge of 0.74 pC (Fig. 4). Under control conditions, 3.25 pC of AMPAR-mediated charge was necessary to elicit an AP (Fig. 6D, black symbols, dotted lines). Therefore, an average of 4.4 simultaneously activated fibers was necessary to elicit an AP in juvenile DNLL neurons. Thus, these four to five fibers will liberate between 72 and 90 quanta to drive a postsynaptic AP. The number of converging fibers required to elicit an AP was larger when the NMDA component was blocked. Under these conditions, 5.45 pC of AMPAR-mediated charge were required to elicit a single AP (Fig. 6D, open symbols, dotted lines). Thus, between seven and eight simultaneously activated fibers were needed to induce an AP in juvenile DNLL neurons without the activation of NMDARs. From this, it follows that 126–144 quanta are required to trigger a postsynaptic AP when NMDARs are blocked. A similar number of converging fibers was estimated by stimulating neurons with an artificial AMPAR-like current waveform (Fig. 6D, gray symbols). In addition, from the maximally evoked currents, we estimated the lower boundary of the number of fibers that converge on a single DNLL neuron. The average maximal evoked synaptic charge through AMPARs was ∼7.1 pC indicating a convergence of at least 9–10 excitatory fibers to a given DNLL neuron.
In the following, we examined whether NMDAR currents directly contribute to the time course of EPSPs, and thereby enhance the synaptic IO-Fs. We repeated the same experimental paradigm as described above (Fig. 6) with a pipette solution containing QX314 to prevent AP generation by blocking sodium channels (Fig. 7A). In both the control condition (n = 15) and in neurons recorded during bath application of d-AP5 (n = 15), the EPSP size increased with stimulation intensity. Under both conditions, the EPSP sizes correlated with the EPSC charge elicited by the same fiber stimulations (Fig. 7B). This suggested that the peak of the EPSP is primarily determined by the AMPAR currents. By plotting the half-width of each EPSP as a function of its peak voltage, a voltage-dependent speeding of the EPSP became apparent (Fig. 7C, gray symbols). The population shows that the EPSP peaks were not significantly different (p > 0.05), but yet the half-width of both populations were (p < 0.05). To illustrate this difference as a function of EPSP peak, both populations were fitted with a linear regression. Under control conditions, the linear regression indicated a relative voltage-dependent speeding of −1.7 ms/10 mV. We observed that this voltage-dependent speeding was increased under conditions of d-AP5 application (Fig. 7C, gray symbols), indicated by a steeper linear regression (−2.8 ms/10 mV). This indicates that the NMDAR currents counteract the speeding of the EPSP. Thus, spatial summation of the EPSP is influenced by synaptically activated NMDAR currents.
Figure 7.

NMDAR currents promote spatial and temporal EPSP summation. A, Synaptically evoked EPSCs recorded at −60 mV (top) and synaptically evoked voltage responses from the same neuron in current clamp (bottom). For both recording modes, the stimulus intensity was varied between 80 and 0 V and applied to the same stimulation site. The inset shows a magnified view of the EPSCs (gray). B, EPSC charge (top) and EPSP delta voltage deflection (bottom) as a function of stimulation strength. The black symbols represent control data (n = 15), and the gray symbols correspond to the population data obtained with bath-applied d-AP5 (n = 15). The color code is the same throughout. C, EPSP half-width as a function of the absolute EPSP peak amplitude. D, Synaptically evoked paired-pulse responses with varying ISIs. The top panel shows EPSCs recorded at −60 mV, and the bottom shows EPSPs from the same neuron, stimulation site, and stimulus intensity. E, PPR as a function of ISI of EPSCs and EPSPs under control conditions (n = 16) and during the bath application of d-AP5 (n = 11). F, PPR of EPSPs plotted against the PPR of EPSCs. Each obtained at different ISIs as shown in E. Unity is indicated by a dashed black line; solid lines represent regression fits to the control (black) and d-AP5-treated cell groups. In all experiments shown, AP generation was blocked by internal application of QX314.
Because of the slow kinetics of NMDAR currents, their influence on temporal summation should also be apparent. That is, widening of the EPSP by the synaptic NMDA component might influence the temporal summation of synaptic inputs. To test for such a NMDA-dependent influence, a paired-pulse fiber stimulation paradigm with different interstimulus intervals (ISIs) was used. The temporal summation of EPSPs and EPSCs was analyzed as paired-pulse ratio (PPR) (Fig. 7D–F). Again, AP generation was suppressed by applying QX314 internally (Fig. 7D). The PPR of EPSCs at an ISI of 10 ms was 0.48 ± 0.06 in control cells (n = 16) and 0.43 ± 0.06 when NMDAR currents were blocked by d-AP5 (Fig. 7E) (n = 11). The recovery from EPSC depression was fitted with a monoexponential function yielding recovery time constants for control and d-AP-5-treated cells of 8 and 7 ms, respectively. Thus, the underlying short-term plasticity of the AMPAR-mediated EPSCs was similar for both conditions. The initial PPR at an ISI of 10 ms of the evoked EPSPs was slightly, but not significantly, larger in control conditions compared with recordings obtained under NMDAR blockade (Fig. 7E) (0.28 ± 0.07 for control and 0.19 ± 0.04 for d-AP5; p > 0.05). Thus, there appears slightly less EPSP depression in control conditions compared with cells recorded in the presence of d-AP5. Moreover, the EPSP recovery was suppressed for neurons recorded in the presence of d-AP5. This difference between the two conditions was more evident when pooling the data of the last three recovery intervals (0.82 ± 0.06 for control and 0.76 ± 0.04 for d-AP5; p < 0.05). Plotting the PPRs of EPSPs and EPSCs against each other illustrates their relationship (Fig. 7F, solid symbols). In addition, both conditions were fit with a linear regression (Fig. 7F, solid lines). When NMDAR channels were blocked, the linear regression was right shifted and its slope reduced. These differences indicated that, to reach the same level of EPSP recovery, a larger recovery from EPSCs depression was necessary when NMDA currents were blocked. In other words, the second EPSC of the pair of stimulations requires more current to recover the EPSP from synaptic depression when the NMDARs were antagonized. Thus, the synaptic NMDA component of EPSCs enhanced the temporal summation of EPSPs.
Functional implications of the NMDA-dependent amplification of postsynaptic responses for the DNLL circuit
To demonstrate the functional relevance of the NMDA-dependent postsynaptic amplification as a cellular source of the integration-based mechanism (Fu et al., 1997; Kelly and Kidd, 2000), it is crucial to show that a similar NMDA effect is present in adult animals. Therefore, nine cells were recorded from animals ranging between P48 and P60. A single pulse of fiber stimulation elicited in five of these nine cells more than one AP. Bath application of NMDAR antagonists (CPP or d-AP5) reduced the number of elicited AP in four of these five cells (data not shown). Thus, as in juvenile animals, synaptic activated NMDARs amplify the excitatory input to these cells. In these cells also the postsynaptic voltage responses to fiber stimulations of 15 pulses at frequencies of 50, 100, 200, and 333 Hz were challenged with CPP (n = 5) or d-AP5 (n = 4) (Fig. 8A–D). For each stimulation frequency, at least three trials were recorded before and after the application of NMDAR antagonists (Fig. 8A). As exemplified in Figure 8A, antagonizing NMDARs reduced the number of APs elicited during 333 Hz train stimulations. Also, in some cases, a slow, subthreshold depolarization was abolished by the NMDAR antagonists (Fig. 8A, arrow), indicating that these receptors generated a relevant electrogenic signal. In average, approximately five APs were lost during train stimulations in the presence of NMDAR antagonists (Fig. 8B). This corresponded to a reduction between 17.8 ± 5.6 and 94.5 ± 29.6 Hz in postsynaptic firing frequency, dependent on the presynaptic input frequency (Fig. 8C). In relative terms, the application of NMDAR antagonists reduced the postsynaptic firing rates during the train stimulation of afferent fibers between ∼20% at 100 Hz input frequency and ∼25% at 333 Hz input frequency (Fig. 8D). Together, this demonstrates that a NMDAR-dependent amplification of synaptic inputs allows DNLL cells of mature gerbils to maintain high firing frequencies.
Figure 8.
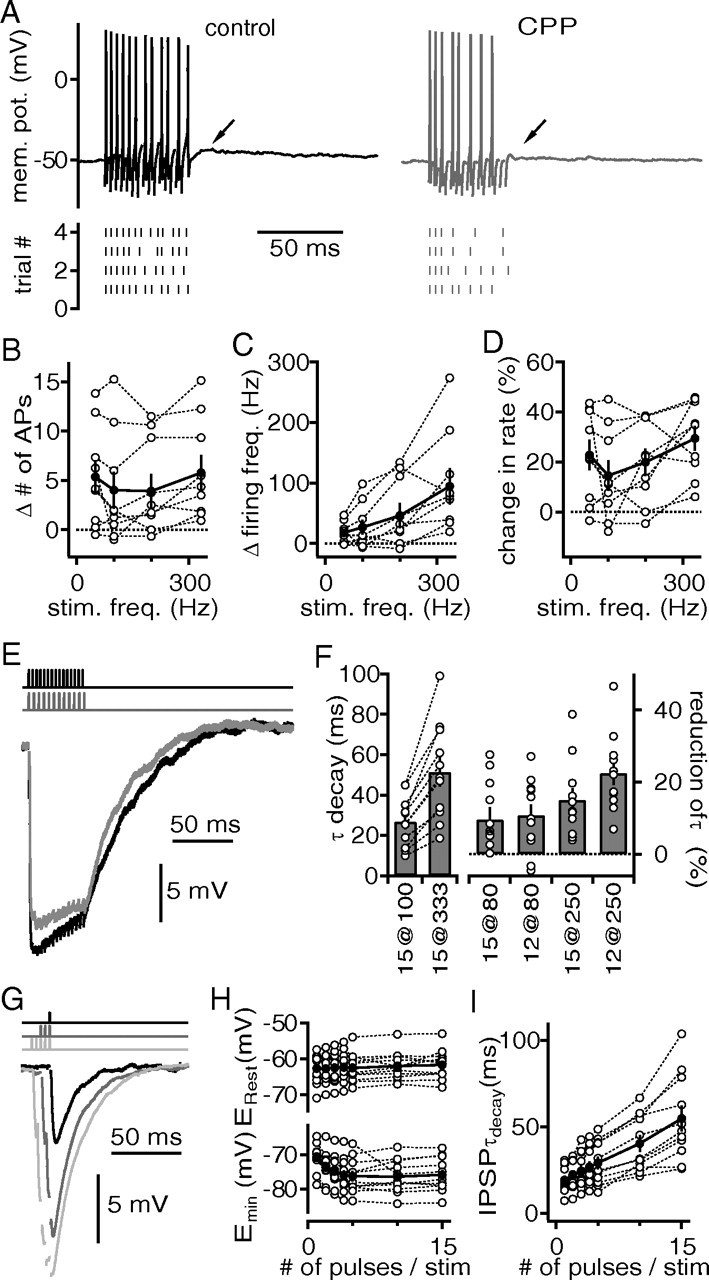
Functional relevance of NMDA-dependent amplification of postsynaptic responses for the DNLL circuit. A, Voltage responses of an adult DNLL neuron before (left) and after (right) the application of the NMDAR antagonist CPP to a 15 pulse train of afferent fiber stimulations applied at 333 Hz. In some cells, a slow subthreshold depolarization was abolished by application of CPP (arrows). The bottom panels display the time of APs in four successive trials. B, The difference in the number of APs before and after NMDA blockage as a function of stimulation frequency of the afferent fibers. The open symbols represent single cells, and the solid symbols, the average from nine cells. C, The difference in postsynaptic firing frequency during the time of the stimulation paradigm is plotted versus the stimulation frequency. The symbols are as in B. D, Percentage change of postsynaptic firing rate during the stimulation paradigm as a function of stimulation frequency. The symbols are as in B. E, GABAergic IPSPs in DNLL neurons from a P16 gerbil were evoked by two different fiber stimulation paradigms [15 pulses at 333 Hz fiber (black) and 12 pulses at 250 Hz (gray)]. Stimulation times are displayed on top and artifacts have been removed for clarity. F, The left panel displays the absolute decay time constant of the summed GABAergic IPSPs after 100 and 333 Hz stimulation trains of 15 pulses (control condition). The right panel shows the relative reduction of decay time constant of the GABAergic IPSPs when stimulation frequencies and pulse numbers were reduced to mimic the block of NMDA-mediated currents (15 and 12 pulses at 80 Hz vs 15 pulses at 100 Hz; 15 and 12 pulses at 250 Hz vs 15 pulses at 333 Hz). The open symbols represent single cells, and the bars display the average values. G, GABAergic IPSPs in response to a single fiber shock (black) and to three and five pulses applied at 333 Hz (gray and light gray, respectively). H, Resting membrane potential (top) and minimal potential (bottom) reached during fiber stimulations (333 Hz) of different pulse numbers. I, IPSP decay time constants of the last fiber stimulation pulse as a function of the applied pulse number.
After showing that, in adult DNLL neurons, NMDA amplifies postsynaptic integration, it is now to be determined to what extent this effect is transformed into prolonged GABAergic inhibition. Since the DNLL projects to its contralateral counterpart, we recorded GABAergic IPSPs in these neurons of P16 gerbils. GABAergic IPSPs were elicited with fiber stimulation of different train frequencies mimicking the observed NMDAR-dependent reduction in postsynaptic AP frequencies in adult animals (Fig. 8). Figure 8E shows an example in which a train of 15 stimulation pulses applied at 333 Hz led to a summed IPSP that finally decayed with a time constant of 41 ms. In the same cell, a 25% reduced input frequency (250 Hz stimulation frequency) of the similar time period (12 pulses) led to the summation of GABAergic IPSPs that finally decayed with 36 ms. Thus, stimulation frequencies that mimic the NMDAR-dependent loss of postsynaptic firing frequencies result in a 12% reduction of IPSP time course. The control IPSPs evoked with 15 pulses at 100 Hz decayed with an average time constant of 26.7 ± 3.7 ms and were always faster than IPSPs evoked at 333 Hz (51.4 ± 7.3 ms; n = 9) (Fig. 8F). When comparing the control values obtained with the 100 Hz stimulation paradigm with decay time constants obtained with 80 Hz stimulations of 15 pulses, an average reduction of 9.6 ± 3.4% was evident (Fig. 8F). The reduction was slightly larger when the control stimulation was compared with 12 pulses applied at 80 Hz (10.8 ± 3%) (Fig. 8F). Even larger reductions in the GABAergic IPSP decay time constants were obtained comparing 15 pulses applied at 333 Hz with 15 pulses (15 ± 3.2%) and with 12 pulses (22.5 ± 3.3) given at 250 Hz (Fig. 8F).
As shown above, NMDA-dependent amplification allowed a single presynaptic stimulation pulse to evoke up to four action potentials of ∼350 Hz in a DNLL neuron (Fig. 6). In the following, the influence of the multiple action potentials generated by this integration-based mechanism on the GABAergic output signal was tested. To do so, GABAergic IPSPs were recorded in response to different number of pulses of fiber stimulations all applied at 333 Hz (Fig. 8G). The GABAergic IPSP size increased with the number of applied pulses. A single pulse changed the membrane potential in average from 62.7 ± 1.25 to 70.6 ± 0.7 mV (n = 11) (Fig. 8H). With increased number of pulses, the membrane deflection increased to an average difference of ∼14 mV. This increase in hyperpolarization level saturated already after four pulses (Fig. 8H). The summed IPSPs decayed dependent on the number of stimulation pulses applied (Fig. 8I). A single pulse elicited a GABAergic IPSP that decayed with an average time constant of 19.2 ± 2.4 ms. The IPSPs evoked with three pulses decayed ∼5 ms slower (24.5 ± 3 ms) and with five pulses, ∼10 ms slower (29.1 ± 3.8 ms) (Fig. 8I). Thus, the NMDA-dependent amplification of DNLL action potential number led to a larger hyperpolarization and to a slowing of the GABAergic decay time constant. Together, these experiments showed, first, that higher stimulation frequencies produced a longer-lasting GABAergic inhibition. Second, more incoming pulses added together to generate a longer-lasting GABAergic inhibition. Third, and here most relevant, the excitatory postsynaptic amplification by NMDARs in the DNLL contributed to the prolongation and strength of GABAergic inhibition.
Ca2+ channels opening during large EPSPs do not contribute to the EPSP time course
So far, we have shown that synaptic NMDAR currents enhance EPSP summation and thereby facilitate AP generation in DNLL neurons. Other depolarizing conductances, such as sodium or calcium currents, could also be activated during the EPSP, enhancing the excitatory drive. Because sodium channels are directly involved in AP generation and hence cannot be unambiguously dissected from the EPSP formation, we focused here on a potential contribution of Ca2+ channels in shaping the EPSP.
First, the presence of somatic Ca2+ currents was confirmed. Ca2+ currents in DNLL neurons were pharmacologically isolated and off-line corrected for leak and capacitive currents using a P/x protocol. Initially, a protocol using 10 mV increments from −70 to +40 mV for 250 ms was used to evoke somatic voltage-dependent Ca2+ currents. These somatic Ca2+ currents activated between −50 and −40 mV. The activation time constant was 6.6 ± 0.3 ms for currents elicited by a voltage step from −70 to −10 mV. The Ca2+ currents showed little inactivation (7.5 ± 2.9%) during 250 ms when activated from −70 to 0 mV (data not shown).
To mimic the physiologically relevant signals that gate Ca2+ channels, simulated EPSP-like voltage commands (simEPSPs) were applied from a holding potential of −60 mV (Fig. 9A, top trace). To account for the voltage-dependent sharpening (Fig. 7), simEPSPs were selected for appropriate half-widths and amplitudes from the recorded EPSPs (Fig. 9A, top graph) (EPSP amplitudes, in mV: 15, 30, 55). To generate the P/x protocols, these simEPSPs were scaled and inverted to a final amplitude of −10 mV. Assuming that simEPSP activate Ca2+ currents, a corresponding fluorescence increase should be detectable with fluo-4. In general, the smallest simEPSP voltage commands of 15 mV did not evoke a detectable Ca2+ current (Fig. 9B) or fluorescence increase (Fig. 9C). The activation of Ca2+ currents and the corresponding increase in fluo-4 intensity was seen with the intermediate simEPSP waveform (Fig. 9B,C). The largest simEPSP evoked the largest Ca2+ currents and increases in fluo-4 intensity (Fig. 9B,C). The peak of Ca2+ currents and the increase in fluo-4 fluorescence appeared correlated (Fig. 9C). This is corroborated by the close relationship of Ca2+ current amplitude and charge (Fig. 9B). The evoked Ca2+ current could be blocked by the application of 0.2 mm Cd2+ and 1 mm Ni2+ (n = 3) (data not shown). The time between the peaks of the simEPSP and the Ca2+ current ranged between −1.6 and 4.2 ms for 30 mV and 0.9 and 5.0 ms for 55 mV (Fig. 9D). Therefore, simEPSPs gate Ca2+ currents with a short time lag.
Figure 9.
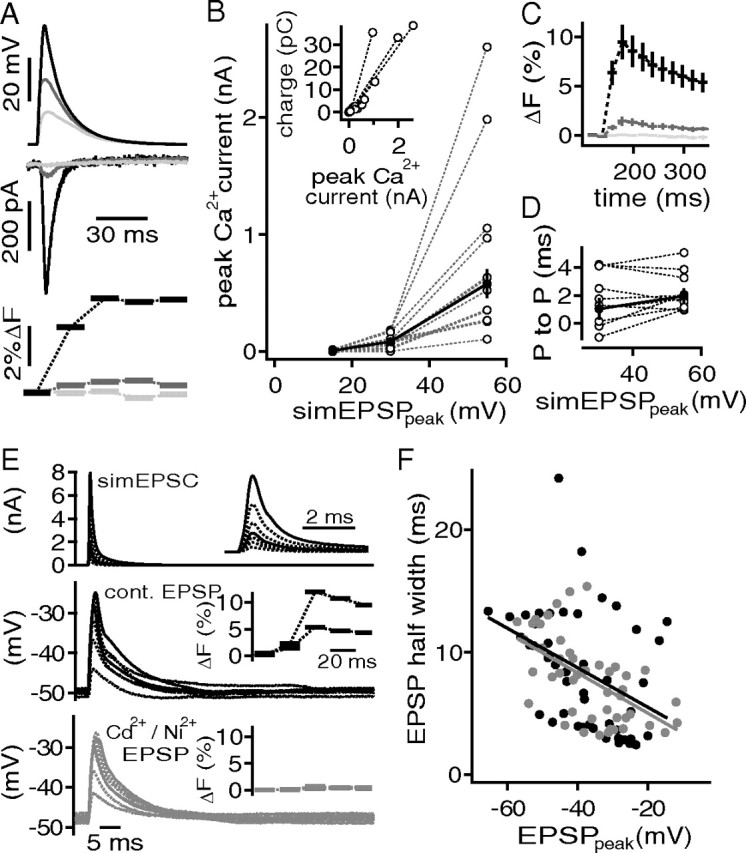
Ca2+ currents do not enhance spatial EPSP amplification. A, simEPSP waveforms (top) elicited pharmacologically isolated, and P/x corrected Ca2+ currents (middle) that were accompanied by a transient increase of flou-4 fluorescence (bottom). B, Ca2+ current as a function of the simEPSP peak. The inset shows charge of the Ca2+ current against peak amplitude of the Ca2+ current. C, Average fluorescence transient evoked with simEPSPs of 55 mV (black), 30 mV (gray), and 15 mV (light gray) amplitude. D, Time between the peak of the simEPSP and the Ca2+ current (P to P) for simEPSP amplitudes of 30 and 55 mV. E, Injection of different scaled simEPSCs (top) to evoke EPSP like deflections in control conditions (middle) and during blockade of Ca2+ channels (bottom). The insets show the magnified simEPSCs (top) and the fluo-4 transients (middle, bottom) that correspond to the EPSP traces shown in solid lines. F, EPSP half-width as a function of the absolute EPSP amplitude. The black symbols represent control conditions, and the gray symbols, during the application of Ni2+ and Cd2+. The solid lines are regression fits shown in corresponding colors.
Having established that simEPSPs were capable of activating Ca2+ currents, we reversed the experiment and used simEPSCs to mimic synaptic currents that evoke EPSP-like voltage deflections. To generate the simEPSCs, we used the time course of an actual measured AMPAR-mediated EPSC and rescaled the reversed current waveform of between 0.5 and 8 nA (Fig. 9E, top graph). In addition, the somatic Ca2+ changes were again monitored with fluo-4. After recording control EPSPs, the evoked Ca2+ currents were blocked with 0.2 mm Cd2+ and 1 mm Ni2+. The efficacy of Ca2+ current block was monitored through the accompanying changes in fluo-4 fluorescence (Fig. 9E). These data were then used to analyze the effects of Ca2+ currents on the shape of EPSP-like deflections. As before, the shape of an EPSP-like deflection was defined by its half-width and peak (Fig. 9F). Under control conditions, the half-width of the EPSP-like deflections decreased at −1.6 ms/10 mV as a function of their amplitude (Fig. 9F). Blocking the Ca2+ currents did not change the relationship between the half-width and size of these EPSP-like deflections (−1.6 ms/10 mV) (Fig. 9F). Together, these results show that blocking Ca2+ currents did not affect the voltage-dependent speeding of EPSP-like events.
Discussion
This study describes the passive membrane properties, the AP generation, and the integration of the excitatory synaptic transmission in DNLL neurons of postnatal days 15–17 and 48–60 Mongolian gerbils. Minimal fiber stimulation together with quantal analysis showed that the average quantal content of excitatory fibers was ∼18 vesicles and that at least 10 excitatory fibers converge on a DNLL neuron. To generate a single postsynaptic AP, four to five excitatory fibers have to be simultaneously activated. The slope of the synaptic IO-F depended on NMDAR currents, consistent with the finding that these currents amplify EPSP summation. Furthermore, regardless of their charge, AMPAR currents elicited by a single fiber shock were alone insufficient to generate more than one postsynaptic AP. Thus, the strength of the integrated synaptic inputs depends on the underlying NMDAR conductance. Most relevant, for the physiological function of the DNLL circuit is that this NMDA-mediated amplification exists also in adult animals and contributes up to at least 25% to the time course of the GABAergic output signal. Other depolarization conductances, such as Ca2+ currents, were ineffective in enhancing the spatial summation of EPSPs.
Implications of the basic cellular and synaptic properties
In P17 rats, DNLL neurons have a fourfold faster membrane time constant and a lower input resistance than our data obtained from P15–P17 Mongolian gerbils (Ahuja and Wu, 2000). Therefore, DNLL neurons of gerbils appear to have less leak conductances and might integrate synaptic inputs over a longer time window. A similarity, however, between DNLL neurons of P15–P17 gerbil and P17 rats was the rate of evoked APs obtained by the same range of current injections (Ahuja and Wu, 2000).
We extended the quantification of basic properties of DNLL neurons to their excitatory synaptic inputs. From mEPSC recordings and minimal fiber stimulations, we estimated that an excitatory fiber conveys ∼18 quanta. So far, the number of contact sites required to harbor this quantal content are not known. Anatomical evidence, however, suggests that the size of synaptic boutons originating from ascending SOC fibers is large and several contacts are made onto a given neuron by a single fiber (Iwahori, 1986; Henkel, 1997). Fibers of the medial superior olive (MSO) were shown to make up to four large contacts onto a single DNLL neuron (Henkel, 1997). Furthermore, in single ultrastructural sections, boutons were often shown to have two active zones (Oliver and Shneiderman, 1989). This indicates that the whole bouton is likely to carry more than two active zones. It is also possible that each of these active zones contains several release sites. Assuming that a bouton in total contains ∼5 release sites and that ∼4 contacts are made between an ascending MSO fiber and DNLL neurons, ∼20 docked vesicles are present. This estimate is close to the described quantal content of 16–20 vesicles per fiber. This is also consistent with the suggestion that the release probability of these vesicles is high, judged by the depression curves. Together, the large quantal content and the short-term plasticity of excitatory fibers reported here is coherent with anatomical evidence.
Here, we find that four to five fibers, together releasing 72–90 quanta, have to be simultaneously activated to elicit a postsynaptic AP in juvenile DNLL neurons. In general, these numbers represent the lower estimate of converging fibers. If the release probability is indeed high and the synaptic depression severe, additional fibers have to converge onto a single DNLL neuron to explain the sustained firing at high rates during ongoing activity (Yang and Pollak, 1994; Siveke et al., 2006). Indeed, from the maximal evoked currents, it is indicated that at least 10 excitatory fibers converge onto a DNLL neuron. Thus, AP generation in the DNLL is based on a substantial convergence of excitatory inputs, originating in the lateral superior olive and MSO (Iwahori, 1986; Shneiderman et al., 1988; Oliver and Shneiderman, 1989; Huffman and Covey, 1995; Henkel, 1997; Siveke et al., 2006). The difference between the minimal number of fibers required for triggering an AP in vitro and the overall convergence estimated in our slice preparation might be important for the physiological function of the DNLL circuit. First, during ongoing activity, this difference has to compensate for the synaptic depression that leads to a reduced charge per afferent fiber. Second, if in vivo inhibitory background activity is substantial, additional excitatory inputs have to be present for compensation. Furthermore, such a substantial convergence of excitatory inputs might partially explain the increase in information content from the MSO to the DNLL (Pecka et al., 2010).
Influence and implications of the synaptic NMDA component on AP generation
In DNLL neurons, the number of elicited APs correlated with the synaptic charge, but not necessarily with the number of stimulation pulses. At high stimulation intensities, more postsynaptic APs were generated than presynaptically applied stimuli. Thus, the isolated excitatory inputs are capable of enhancing the synaptic IO-F and thereby extend the postsynaptic activity window. This form of synaptic IO-F depended on the synaptic NMDA component and was consistent with the finding that spatial and temporal summation of the EPSP was increased by NMDAR currents. Inversely, while blocking NMDAR currents, the number of postsynaptic APs did not exceed the number of stimulation pulses. A similar IO-F was obtained when simulated AMPAR currents were used for current injection. Without the NMDA component, more excitatory fibers have to be activated simultaneously to generate a postsynaptic AP. We estimate that approximately seven to eight fibers releasing 126–144 vesicles simultaneously would be required to generate an AP if only AMPARs are activated.
Functional implication for the DNLL network
The feasibility of the hypothesized integration-based mechanism (Fu et al., 1997; Kelly and Kidd, 2000) is given by the NMDA-dependent amplification of EPSPs. This amplification is based on the electrogenic signal, generated by synaptically activated NMDARs, which contributes to the spatial and temporal summation of EPSCs at the soma. Here, we show that an NMDA-dependent amplification exists in adult and juvenile animals. This mechanism is relevant for persistent inhibition, as it leads to the generation of multiple APs in response to a single presynaptic stimulation event. This prolongs the time of the postsynaptic activity window. Therefore, the GABAergic output of these neurons will be at least prolonged for this time period. In adult animals, the NMDA-dependent amplification also allows the neuron to maintain firing rates in response to high input frequencies. The capability of the faithful generation of APs to each stimulation event is a prerequisite for any synaptic mechanism contributing to the extension of the GABAergic output of this circuit.
In addition to the presented evidence for the integration-based mechanism (Fu et al., 1997; Kelly and Kidd, 2000), our data indicate also a contribution to the generation of persistent inhibition by the second hypothesized output-based mechanism (Wu and Kelly, 1996; Pecka et al., 2007). This indication is based on a substantial prolongation of GABAergic inhibition when more stimulation pulses were applied. The time course of the GABAergic inhibition was also prolonged as a response to different stimulation frequencies given in the same time window. This pulse number and frequency-dependent increase in GABAergic inhibition is consistent with in vivo recordings that show a prolongation of the persistent inhibition as a function of stimulus intensity and to some extent stimulus length (Yang and Pollak, 1998; Burger and Pollak, 2001; Pecka et al., 2007). The synaptic mechanisms that could explain these features are a strong asynchronous release component and a substantial GABAergic spillover. It remains to be seen to which extent these hypothesized synaptic mechanisms account for the time course of persistent inhibition.
The integration-based mechanism adds a temporal extension to the GABAergic inhibition and sets the underlying activity for the output-based mechanism. Thus, these two mechanisms are not mutually exclusive but represent a required sequence of synergistic events to adjust the appropriate time course of the persistent inhibition generated by DNLL neurons.
Footnotes
This work was supported by Deutsche Forschungsgemeinschaft Grant FE789/2-1. C.P.P. was supported by Deutsche Forschungsgemeinschaft Grant GRK1091. We thank Dr. Ida Siveke and Kiri Couchman for helpful discussions on this manuscript.
References
- Adams JC, Mugnaini E. Dorsal nucleus of the lateral lemniscus: a nucleus of GABAergic projection neurons. Brain Res Bull. 1984;13:585–590. doi: 10.1016/0361-9230(84)90041-8. [DOI] [PubMed] [Google Scholar]
- Ahuja TK, Wu SH. Developmental changes in physiological properties in the rat's dorsal nucleus of the lateral lemniscus. Hear Res. 2000;149:33–45. doi: 10.1016/s0378-5955(00)00159-3. [DOI] [PubMed] [Google Scholar]
- Boudreau JC, Tsuchitani C. Binaural interaction in the cat superior olive S segment. J Neurophysiol. 1968;31:442–454. doi: 10.1152/jn.1968.31.3.442. [DOI] [PubMed] [Google Scholar]
- Brand A, Behrend O, Marquardt T, McAlpine D, Grothe B. Precise inhibition is essential for microsecond interaural time difference coding. Nature. 2002;417:543–547. doi: 10.1038/417543a. [DOI] [PubMed] [Google Scholar]
- Burger RM, Pollak GD. Reversible inactivation of the dorsal nucleus of the lateral lemniscus reveals its role in the processing of multiple sound sources in the inferior colliculus of bats. J Neurosci. 2001;21:4830–4843. doi: 10.1523/JNEUROSCI.21-13-04830.2001. [DOI] [PMC free article] [PubMed] [Google Scholar]
- Couchman K, Grothe B, Felmy F. Medial superior olivary neurons receive surprisingly few excitatory and inhibitory inputs with balanced strength and short-term dynamics. J Neurosci. 2010;30:17111–17121. doi: 10.1523/JNEUROSCI.1760-10.2010. [DOI] [PMC free article] [PubMed] [Google Scholar]
- Forsythe ID, Westbrook GL. Slow excitatory postsynaptic currents mediated by N-methyl-d-aspartate receptors on cultured mouse central neurones. J Physiol. 1988;396:515–533. doi: 10.1113/jphysiol.1988.sp016975. [DOI] [PMC free article] [PubMed] [Google Scholar]
- Fu XW, Brezden BL, Kelly JB, Wu SH. Synaptic excitation in the dorsal nucleus of the lateral lemniscus: whole-cell patch-clamp recordings from rat brain slice. Neuroscience. 1997;78:815–827. doi: 10.1016/s0306-4522(96)00580-5. [DOI] [PubMed] [Google Scholar]
- Glendenning KK, Brunso-Bechtold JK, Thompson GC, Masterton RB. Ascending auditory afferents to the nuclei of the lateral lemniscus. J Comp Neurol. 1981;197:673–703. doi: 10.1002/cne.901970409. [DOI] [PubMed] [Google Scholar]
- Henkel CK. Axonal morphology in fibrodendritic laminae of the dorsal nucleus of the lateral lemniscus: afferent projections from the medial superior olivary nucleus. J Comp Neurol. 1997;380:136–144. [PubMed] [Google Scholar]
- Huffman RF, Covey E. Origin of ascending projections to the nuclei of the lateral lemniscus in the big brown bat, Eptesicus fuscus. J Comp Neurol. 1995;357:532–545. doi: 10.1002/cne.903570405. [DOI] [PubMed] [Google Scholar]
- Iwahori N. A Golgi study on the dorsal nucleus of the lateral lemniscus in the mouse. Neurosci Res. 1986;3:196–212. doi: 10.1016/0168-0102(86)90002-7. [DOI] [PubMed] [Google Scholar]
- Kelly JB, Kidd SA. NMDA and AMPA receptors in the dorsal nucleus of the lateral lemniscus shape binaural responses in rat inferior colliculus. J Neurophysiol. 2000;83:1403–1414. doi: 10.1152/jn.2000.83.3.1403. [DOI] [PubMed] [Google Scholar]
- Kelly JB, van Adel BA, Ito M. Anatomical projections of the nuclei of the lateral lemniscus in the albino rat (Rattus norvegicus) J Comp Neurol. 2009;512:573–593. doi: 10.1002/cne.21929. [DOI] [PubMed] [Google Scholar]
- Mayer ML, Westbrook GL, Guthrie PB. Voltage-dependent block by Mg2+ of NMDA responses in spinal cord neurones. Nature. 1984;309:261–263. doi: 10.1038/309261a0. [DOI] [PubMed] [Google Scholar]
- Moore MJ, Caspary DM. Strychnine blocks binaural inhibition in lateral superior olivary neurons. J Neurosci. 1983;3:237–242. doi: 10.1523/JNEUROSCI.03-01-00237.1983. [DOI] [PMC free article] [PubMed] [Google Scholar]
- Nowak L, Bregestovski P, Ascher P, Herbet A, Prochiantz A. Magnesium gates glutamate-activated channels in mouse central neurones. Nature. 1984;307:462–465. doi: 10.1038/307462a0. [DOI] [PubMed] [Google Scholar]
- Oliver DL, Shneiderman A. An EM study of the dorsal nucleus of the lateral lemniscus: inhibitory, commissural, synaptic connections between ascending auditory pathways. J Neurosci. 1989;9:967–982. doi: 10.1523/JNEUROSCI.09-03-00967.1989. [DOI] [PMC free article] [PubMed] [Google Scholar]
- Pecka M, Zahn TP, Saunier-Rebori B, Siveke I, Felmy F, Wiegrebe L, Klug A, Pollak GD, Grothe B. Inhibiting the inhibition: a neuronal network for sound localization in reverberant environments. J Neurosci. 2007;27:1782–1790. doi: 10.1523/JNEUROSCI.5335-06.2007. [DOI] [PMC free article] [PubMed] [Google Scholar]
- Pecka M, Brand A, Behrend O, Grothe B. Interaural time difference processing in the mammalian medial superior olive: the role of glycinergic inhibition. J Neurosci. 2008;28:6914–6925. doi: 10.1523/JNEUROSCI.1660-08.2008. [DOI] [PMC free article] [PubMed] [Google Scholar]
- Pecka M, Siveke I, Grothe B, Lesica NA. Enhancement of ITD coding within the initial stages of the auditory pathway. J Neurophysiol. 2010;103:38–46. doi: 10.1152/jn.00628.2009. [DOI] [PubMed] [Google Scholar]
- Roberts RC, Ribak CE. GABAergic neurons and axon terminals in the brainstem auditory nuclei of the gerbil. J Comp Neurol. 1987;258:267–280. doi: 10.1002/cne.902580207. [DOI] [PubMed] [Google Scholar]
- Scott LL, Mathews PJ, Golding NL. Posthearing developmental refinement of temporal processing in principal neurons of the medial superior olive. J Neurosci. 2005;25:7887–7895. doi: 10.1523/JNEUROSCI.1016-05.2005. [DOI] [PMC free article] [PubMed] [Google Scholar]
- Shneiderman A, Oliver DL, Henkel CK. Connections of the dorsal nucleus of the lateral lemniscus: an inhibitory parallel pathway in the ascending auditory system? J Comp Neurol. 1988;276:188–208. doi: 10.1002/cne.902760204. [DOI] [PubMed] [Google Scholar]
- Siveke I, Pecka M, Seidl AH, Baudoux S, Grothe B. Binaural response properties of low-frequency neurons in the gerbil dorsal nucleus of the lateral lemniscus. J Neurophysiol. 2006;96:1425–1440. doi: 10.1152/jn.00713.2005. [DOI] [PubMed] [Google Scholar]
- Taschenberger H, Scheuss V, Neher E. Release kinetics, quantal parameters and their modulation during short-term depression at a developing synapse in the rat CNS. J Physiol. 2005;568:513–537. doi: 10.1113/jphysiol.2005.093468. [DOI] [PMC free article] [PubMed] [Google Scholar]
- Tollin DJ, Yin TC. Interaural phase and level difference sensitivity in low-frequency neurons in the lateral superior olive. J Neurosci. 2005;25:10648–10657. doi: 10.1523/JNEUROSCI.1609-05.2005. [DOI] [PMC free article] [PubMed] [Google Scholar]
- Tsuchitani C, Boudreau JC. Single unit analysis of cat superior olive S segment with tonal stimuli. J Neurophysiol. 1966;29:684–697. doi: 10.1152/jn.1966.29.4.684. [DOI] [PubMed] [Google Scholar]
- Wu SH, Kelly JB. In vitro brain slice studies of the rat's dorsal nucleus of the lateral lemniscus. II. Physiological properties of biocytin-labeled neurons. J Neurophysiol. 1995;73:794–809. doi: 10.1152/jn.1995.73.2.794. [DOI] [PubMed] [Google Scholar]
- Wu SH, Kelly JB. In vitro brain slice studies of the rat's dorsal nucleus of the lateral lemniscus. III. Synaptic pharmacology. J Neurophysiol. 1996;75:1271–1282. doi: 10.1152/jn.1996.75.3.1271. [DOI] [PubMed] [Google Scholar]
- Yang L, Pollak GD. The roles of GABAergic and glycinergic inhibition on binaural processing in the dorsal nucleus of the lateral lemniscus of the mustache bat. J Neurophysiol. 1994;71:1999–2013. doi: 10.1152/jn.1994.71.6.1999. [DOI] [PubMed] [Google Scholar]
- Yang L, Pollak GD. Features of ipsilaterally evoked inhibition in the dorsal nucleus of the lateral lemniscus. Hear Res. 1998;122:125–141. doi: 10.1016/s0378-5955(98)00088-4. [DOI] [PubMed] [Google Scholar]