

Abstract
Visuospatial abilities are preferentially mediated by the right hemisphere. Although this asymmetry of function is thought to be due to an unbalanced interaction between cerebral hemispheres, the underlying neurophysiological substrate is still largely unknown. Here, using a method of trifocal transcranial magnetic stimulation, we show that the right, but not left, human posterior parietal cortex exerts a strong inhibitory activity over the contralateral homologous area by a short-latency connection. We also clarify, using diffusion-tensor magnetic resonance imaging, that such an interaction is mediated by direct transcallosal projections located in the posterior corpus callosum. We argue that this anatomo-functional network may represent a possible neurophysiological basis for the ongoing functional asymmetry between parietal cortices, and that its damage could contribute to the clinical manifestations of neglect.
Introduction
The human brain is characterized by a unique lateralization of cognitive functions between homologous areas of the two hemispheres. These areas are reciprocally connected by direct transcallosal fibers, which are supposed to be crucially involved in controlling the functioning of the contralateral areas, thus contributing to lateralization processes. For instance, it is known that cortical networks of the right hemisphere (RH) involving the posterior parietal cortex (PPC) play a predominant role in visuospatial attention, so that RH lesions often induce visuospatial neglect, a severe neurological disorder characterized by failures to acknowledge or explore stimuli toward the contralesional side of space (for review, see Bisiach et al., 1986; Heilman et al., 2000; Karnath et al., 2002; Vallar et al., 2003; Driver et al., 2004). However, there is still a lack of evidence about the neurophysiological substrate underlying this hemispheric specialization. One leading model has proposed that the RH directs attention to both visual hemifields, whereas the left hemisphere (LH) directs attention to the right hemispace only (Mesulam, 1981). Thus, although the RH can compensate for LH damage, such compensation is not possible with RH damage, thereby resulting in neglect of the left hemispace. To account for this brain asymmetry, another influential model has been proposed, invoking a mechanism of hemispheric rivalry or competition (Kinsbourne, 1977, 1993). This model is based on an asymmetric dynamic balance between parietofrontal circuits in the two hemispheres, with an activation of LH structures that tend to shift attention and spatial behavior rightwards, and an opposite activation of RH structures that counteracts and prevails over the former effect. Neglect occurs as a consequence of an unbalanced system following damage to one of the processors, resulting in a bias toward the ipsilesional hemispace (Kinsbourne, 1977, 1993). Here, we used a trifocal transcranial magnetic stimulation (TMS) method to directly test the hypothesis that the asymmetry of visuospatial functions may be due to an imbalance of interhemispheric interactions between the two parietal cortices (Silvanto et al., 2009). We chose to stimulate a region of the PPC that lies close to the posterior part of the intraparietal sulcus (cIPS) within the inferior parietal lobule (IPL), given that this area is a crucial node of the frontoparietal networks involved in visuospatial attention and neglect (Bisiach et al., 1986; Bowen et al., 1999; Karnath et al., 2002; Mort et al., 2003; Shulman et al., 2010). By applying this method to healthy subjects, we outwitted the problem that stimulation of the parietal cortex, in contrast with that of the motor cortex, yields no measurable physiological output. In fact, the activation state of the PPC can be determined indirectly by recording its physiological short-latency interaction (5 ms) with the primary motor cortex (M1) in one hemisphere (Koch et al., 2007). In the current study, by applying a third TMS pulse over the contralateral PPC, we aimed to discover the asymmetric neurophysiological influence of the interhemispheric connections between the PPC of the RH and LH.
Materials and Methods
Subjects.
In total, 22 healthy volunteers (12 males, 10 females; age, 21–36 years) took part in this study. All subjects were right-handed according to the Edinburgh handedness inventory (Oldfield, 1971). The experimental procedures were approved by the local Ethics Committee and were performed in accordance with the Declaration of Helsinki. Written informed consent was obtained from all recruited subjects before study initiation.
TMS: experiment 1.
This experiment was performed in 15 subjects. We used a novel trifocal stimulation technique based on three high-power Magstim 200 machines (Magstim) (Fig. 1A). The magnetic stimuli had a nearly monophasic pulse configuration with a rise time of ∼100 μs, decaying back to zero over ∼0.8 ms.
Figure 1.
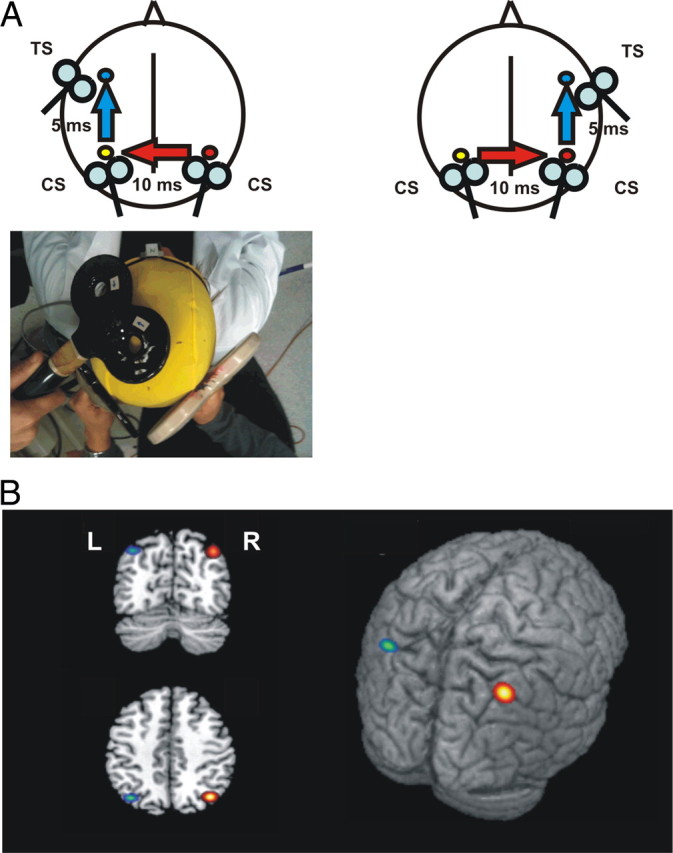
A, Schematic representation of the experimental procedure. TMS of the primary motor cortex (M1) evokes a small twitch in contralateral hand muscles that can be measured with surface electromyography. At rest, this response is enhanced following ipsilateral PPC stimulation, implying the activation of a corticocortical pathway that originates in PPC (Koch et al., 2007) and thus indicating the activation state of PPC (blue arrows). To investigate the interhemispheric interactions between the right and left PPC (red arrows), we developed a trifocal stimulation method. TMS of right PPC preceded TMS of left PPC by 10 ms. A third stimulus was applied 5 ms later on the ipsilateral left M1. The same experimental scheme was reversed to test the effects of left PPC over the right PPC (bottom). B, Anatomical location of right (R, red/yellow) and left (L, green/blue) PPC TMS sites in MNI coordinates. The colored spots represent the mean group coordinates (brighter color) ± SD (darker outline).
A first test stimulus (TS) was applied over the hand motor areas of left and right M1 and defined the points where stimulation evoked the largest motor-evoked potentials (MEPs) from the contralateral first dorsal interosseous (FDI) muscle. Electromyographic traces were recorded bilaterally from the FDI muscles using 9 mm diameter, Ag–AgCl surface cup electrodes. The active electrode was placed over the belly muscle and the reference electrode was placed over the metacarpophalangeal joint of the index finger. Responses were amplified using a Digitimer D360 amplifier (Digitimer) through filters set at 20 Hz and 2 kHz with a sampling rate of 5 kHz, then recorded by a computer using SIGNAL software (Cambridge Electronic Devices).
The test stimulator for M1 was connected to a small, custom-made, figure-of-eight-shaped coil (external diameter, 50 mm). For each hemisphere, the intensity of the TS was adjusted to evoke an MEP of ∼1 mV peak-to-peak in the relaxed contralateral FDI muscles.
To best activate the ipsilateral PPC–M1 connection, a conditioning stimulus (CS)1 applied over the PPC preceded the M1 TS by 5 ms, at an intensity of 90% of the ipsilateral resting motor threshold (RMT) (Koch et al., 2007, 2008a). RMT was defined as the lowest intensity that evoked five small responses (∼50 μV) in the contralateral FDI muscle in a series of 10 stimuli where the subject kept the FDI muscles relaxed in both hands (Rossini et al., 1994). The CS1 for PPC was applied using a second small, custom-made, figure-of-eight-shaped coil (external diameter, 50 mm).
It is important to notice that in a previous study (Koch et al., 2010), we demonstrated that the connections between PPC and M1 likely involve a polysynaptic circuit that engages the ipsilateral ventral premotor cortex (PMv). Inactivation of the PMv by continuous theta burst stimulation interfered with these interactions, and anatomical diffusion tensor imaging (DTI) tractography revealed that PPC is more strongly connected with PMv than with M1 by bundles of the superior longitudinal fasciculus (SLF) (Koch et al., 2010). Although it could be argued that the interval that we used to test PPC–M1 interactions [interstimulus interval (ISI), 5 ms] may be too short for an interposed synaptic connection in PMv, it should be noted that the true latency of the interaction is complicated by the fact that a single suprathreshold TMS pulse to M1 evokes a series of I wave volleys in corticospinal neurones that can last 5 ms or more. Since all of these contribute to the final amplitude of the MEP, inputs arriving as late as 9 ms after stimulation of PPC can affect the PPC–M1 interaction we measured. Thus, we concluded that an ISI of 5 ms may be sufficiently long to activate both direct and indirect (via PMv) circuits linking PPC with M1 (Koch et al., 2010).
A third TMS pulse (CS2) was applied over the contralateral PPC (PPCCONTRA) 10 ms before the PPC pulse ipsilateral to M1 (PPCIPSI), and therefore 15 ms before the M1 TS (Fig. 1A). The CS2 over the contralateral PPC was delivered using a standard figure-of-eight-shaped coil with an external diameter of 70 mm.
We used a neuronavigation system (Softaxic) to precisely position the coil over the PPC sites, using individual T1-weighted magnetic resonance imaging volumes as anatomical reference; this technique has been previously described in detail (Koch et al., 2007, 2008a, 2010). The stimulation points were determined before the experiment and were marked on the adherent plastic cap worn by the subject. The individual coordinates of each stimulation site were normalized a posteriori into the Montreal Neurological Institute (MNI) coordinate system and averaged (Fig. 1B). To target IPL, the coil was positioned close to a posterior part of the adjoining cIPS (Koch et al., 2007, 2008a, 2010). The center of the coils was positioned tangentially to the skull with the handle pointing downward and rotated medially 15° (Fig. 1A).
In this experiment, we varied the intensity of stimulation from 30% to 130% of ipsilateral RMT in steps of 20% (30%, 50%, 70%, 90%, 110%, 130% RMT). We administered two blocks of stimulation. In each block, we tested the effects of left or right PPC stimulation. The order of presentation of the blocks was randomized across subjects. Each experimental block consisted of 120 trials. Eight conditions were randomly intermingled: TS alone (MEP), PPCIPSI plus TS, and PPCCONTRA plus PPCIPSI plus TS for six different PPCCONTRA intensities. Fifteen responses were collected for each condition. Measurements were made for each individual trial. The mean peak-to-peak amplitude of the PPCIPSI-plus-TS-conditioned MEP was expressed as a percentage of the mean peak-to-peak amplitude size of the MEP obtained by TS of M1 in isolation. The mean peak-to-peak amplitude of the PPCCONTRA-plus-PPCIPSI-plus-TS-conditioned MEP was then expressed as a percentage of the mean peak-to-peak amplitude size of the unconditioned PPCIPSI plus TS MEP.
TMS: experiment 2.
In this control experiment, in the same subjects that took part in experiment 1 (N = 15), we tested for the direct effects of left and right PPC stimulation on the excitability of contralateral M1 by applying pulses at various intensities (30%, 50%, 70%, 90%, 110%, 130% RMT) over the left or right PPC with the same parameters of stimulation. PPC pulses preceded the M1 TS by 15 ms, as in the main experiment, but no other stimulus was applied in between. In each run, we tested the effects of left or right PPCCONTRA stimulation. The order of presentation of the blocks was randomized across subjects, so each block consisted of 105 trials. Seven conditions were randomly intermingled: TS alone (MEP) and PPCCONTRA plus TS for six different PPCCONTRA intensities. Fifteen responses were collected for each condition. Measurements were made on each individual trial and the mean peak-to-peak amplitude of the conditioned PPCCONTRA plus TS MEP was expressed as a percentage of the mean peak-to-peak amplitude size of the unconditioned TS MEP.
TMS: experiment 3.
In this experiment, performed in a sample of 10 subjects, three of whom took part in experiment 1, we varied the ISI between the left and right PPC and the contralateral PPC TMS pulses. As in experiment 1, to best activate the PPCIPSI–M1 connection, PPC TMS preceded the M1 TS by 5 ms at an intensity of 90% of the ipsilateral RMT. Then a third TMS pulse was applied over the left and right contralateral PPC, preceding the left PPCIPSI pulse by different ISIs (4, 6, 8, 10, 15, 20, or 30 ms). The intensity of the right PPCCONTRA was fixed at 70% RMT on the basis of the results obtained in experiment 1. We investigated the time course of the effects of right PPCCONTRA over the left PPCIPSI–M1 connection and of left PPCCONTRA over the right PPCIPSI–M1 connection. Each experimental block consisted of 135 trials. Eight conditions were randomly intermingled: TS alone (MEP), PPCIPSI plus TS, and PPCCONTRA plus PPCIPSI plus TS for seven different ISIs between PPCCONTRA and PPCIPSI. Fifteen responses were collected for each condition. Measurements were made for each individual trial. The mean peak-to-peak amplitude of the PPCCONTRA-plus-PPCIPSI-plus-TS-conditioned MEP was expressed as a percentage of the mean peak-to-peak amplitude size of the unconditioned PPCIPSI plus TS MEP.
Line bisection task: experiment 4.
This experiment was performed with the 15 subjects who took part in experiment 1, in a separate session separated by at least 1 d from experiment 1. Visuospatial performance was assessed using a computerized task requiring length judgment of pre-bisected lines (Fierro et al., 2000). Five lines, differing in the position of the transector (midpoint, rightward, or leftward), overall length of the line, and length of right and left segments, were randomly presented. Visual stimuli consisted of 1 mm thick black horizontal lines bisected by a 1 mm thick and 1 cm long vertical bar, presented on a white background with the transector exactly coincident with the center of the screen. Tachistoscopic stimulus presentation of 50 ms duration was used to prevent eye scanning. Before stimulus presentation, the subject was required to fixate a central target (an arrow pointing upward), that disappeared as soon as the visual stimulus was flashed. After stimulus presentation, the subject made a forced-choice decision about the respective length of the two segments with three response possibilities: equal, longer right, or longer left.
The task consisted of 60 trials, 12 for each line type: line 1 (exactly bisected): right segment = 75 mm; left segment = 75 mm; line 2 (left elongated): right segment = 70 mm; left segment = 75 mm; line 3 (left elongated): right segment = 75 mm; left segment = 80 mm; line 4 (right elongated): right segment = 75 mm; left segment = 70 mm; line 5 (right elongated): right segment = 80 mm, left segment = 75 mm. Performance of the subjects was scored with a value of zero for correct responses, positive values for rightward errors, and negative values for leftward errors. Number of errors and reaction times (RT) were also calculated. Trials in which RTs were longer than 1000 ms were excluded from the analysis.
DTI acquisition: experiment 5.
To obtain detailed anatomical information about the white matter pathways that mediate these neurophysiological interactions, in 18 (eight females, 10 males; mean age, 25.7 years; SD, 3.9 years) of the 22 subjects who participated in the study, we used DTI, an MRI technique that allows in vivo reconstruction of white matter fiber bundles based on the assumption that the principal direction of tissue water diffusion is parallel to the main fiber direction in every voxel (Basser et al., 1994). The orientation dependence of diffusion can then be quantified by fractional anisotropy (FA) at each voxel (Johansen-Berg and Behrens, 2006). DTI was not available for all the subjects, as three who took part in the neurophysiological experiments refused to perform MRI and one subject did not tolerate the scan. Subjects had an MRI scan at 3.0 T (Siemens Magnetom Allegra; Siemens Medical Solutions). The MRI session included, for every subject, a dual-echo turbo spin echo sequence [echo times (TEs), 12/112 ms; repetition time (TR), 4500 ms; echo train length, 7; matrix, 256 × 192; field of view (FOV), 230 × 172.5 mm2; slice thickness, 5 mm; total number of slices, 24] to exclude the presence of any brain abnormality and a DTI scan obtained using pulsed-gradient twice-refocused (Reese et al., 2003) spin-echo EPI (TE/TR, 90/8500 ms; bmax, 1000 smm−2; voxel size, 2.3 mm3) with diffusion gradients applied in 81 non-collinear directions. Nine images with no diffusion weighting (b0) were also acquired. In addition, a magnetization-prepared rapid gradient echo sequence (TE, 2.74 ms; TR, 2500 ms; inversion time, 900; flip angle, 8°; matrix, 256 × 208 × 176; FOV, 256 × 208 × 176 mm3) was collected for every subject.
Image analysis.
DTI data were processed using tools from the FMRIB software library (FSL, www.fmrib.ox.ac.uk/fsl/) and in-house-developed software. The preprocessing pipeline included the following steps. First, the nine b0 images were realigned to the first b0 volume with a rigid body transformation computed using the FMRIB's linear image registration tool (Jenkinson and Smith, 2001; Jenkinson et al., 2002) and then averaged. Second, the 81 diffusion-weighted (DW) volumes were averaged and coregistered to the scalp-stripped mean b0 image to yield an average transformation (Tlinear1) matching the mean DW image to the mean b0. Third, each DW volume was realigned to the mean DW image (with a rigid body transformation, described by Tlinear2), and the transformation matching each DW volume with the b0 image was obtained by combining Tlinear2 with Tlinear1. The B matrices were rotated accordingly (Leemans and Jones, 2009). The diffusion tensor was estimated in every voxel and FA maps were calculated using the FSL diffusion tool. FA maps were then processed using tract-based spatial statistics (TBSS) (Smith et al., 2006). TBSS is a processing tool designed to analyze whole-brain DTI data in a spatially unbiased fashion, i.e., without any specific a priori hypothesis about the anatomical location, structural changes, or associations with external variables. For TBSS, FA images are scalp stripped and then aligned to a common target using nonlinear registration (using the tool FNIRT from the FSL library). The aligned images are averaged to produce a mean image, which is then thinned by nonmaximum suppression perpendicular to the local tract structure, to create an alignment-invariant tract representation: the “skeleton”. Each subject's FA is then projected onto the skeleton by searching perpendicular to the local skeleton structure for the maximum value in the subject's FA image. In this work, TBSS was used to localize areas of significant association between FA and both the mean percentage change of MEP obtained for the left PPCIPSI–M1 after right PPC TMS and the mean percentage change of MEP obtained for the right PPCIPSI–M1 after left PPC TMS.
Data analysis.
In experiments 1 and 2, repeated-measures ANOVA were performed on the mean percentage change of MEP size obtained for the PPCIPSI–M1 (experiment 1) and M1 (experiment 2) stimulation after PPCCONTRA TMS, with side (left vs right) and intensity (30%, 50%, 70%, 90%, 110%, 130% RMT) as within-subject main factors. In experiment 3, a repeated-measures mixed ANOVA was performed on mean percentage change of MEP size obtained for the PPCIPSI–M1 after PPCCONTRA TMS with ISI (4, 6, 8, 10, 15, 20, or 30 ms) and side (left vs right) as within-subject main factors.
The statistical analysis of TBSS data was performed using the FSL tool randomize. Voxelwise statistics were performed using linear regression across all voxels in the skeleton to identify areas of significant association between FA and neurophysiological measures. The statistical significance was computed using permutation tests. Following the procedure of Neubert et al. (2010), effects were reported as being significant at a one-tailed statistical threshold of p < 0.001 (uncorrected for multiple comparisons) and a cluster size of >10 voxels. We tested for both direct and inverse associations.
Results
Experiment 1
Mean normalized MNI coordinates of PPC sites (x, y, z, mean ± SD) were −37.8 ± 5.2, −68.3 ± 3.4, and 47.2 ± 3.2 mm in the left hemisphere and 38.4 ± 6.1, −67.2 ± 4.4, and 46.3 ± 5.8 mm in the right hemisphere, corresponding to the left and right caudal IPL (BA39) (Caspers et al., 2008) (Fig. 1B). The mean coil-to-cortex distance did not differ between left and right PPC (21.06 ± 3.57 vs 22.1 ± 3.3 mm; t = 0.89; p = not significant) and the RMT did not differ between the two hemispheres (41.75 ± 6.2 vs 40.66 ± 4.3 of maximal stimulator output; t = 0.51; p = not significant). We found that magnetic stimulation of PPC provokes different effects on the excitability of the contralateral homologous area, depending on the side and intensity of stimulation. The strength of PPC–M1 connection is comparable between the hemispheres (left PPC–M1, 116.2 ± 3.4%; right PPC–M1, 119.4 ± 5.1%; t = 0.54; p = not significant), thus indicating that interhemispheric interactions cannot be ascribed to a different state of excitability in intrahemispheric connections. We found that only the right PPC exerts a strong inhibition over the contralateral PPC–M1 connection (ANOVA interaction side × intensity; F(5,70) = 3.25; p = 0.01), an effect that is remarkably evident when TMS is delivered at low intensity (70% RMT; t = 3.98; p = 0.002) (Fig. 2), providing evidence for the existence of a parietal interhemispheric inhibition (pIHI).
Figure 2.

Effects of PPC TMS on the strength of the contralateral PPC–M1 connection when delivered at different intensities in the left and right hemisphere. *p < 0.05.
Experiment 2
In this experiment, we demonstrated that pIHI is specific for the interactions between the two homologues PPCs. In fact, when we tested the effects of PPC stimulation on the excitability of contralateral M1 in isolation, using the same interval between the two pulses as in the triple coil experiment (15 ms), we were unable to detect any side-specific change (interaction side × intensity; F(5,70) = 0.77; p = not significant) (Fig. 3), as expected from our previous work in which we systematically explored the interactions between PPC and the contralateral M1 (Koch et al., 2009). Notably, IHI from the right-to-left and left-to-right motor cortices is also reported to be symmetric in depth and time course (Nelson et al., 2009). Thus, our findings are not to be ascribed to general asymmetries in the strength of interhemispheric interactions between the two hemispheres.
Figure 3.

Effects of PPC TMS on the excitability of contralateral M1 when delivered at different intensities in the left and right hemisphere.
Experiment 3
In this experiment, we investigated the time course of excitability of pIHI by varying the ISI from 4 to 30 ms between the left or right PPC (intensity of stimulation, 70% RMT) and the contralateral PPC–M1 connection. There was a significant effect of both ISI (F(1,9) = 7.33; p = 0.02) and side (F(6,54) = 3.87; p = 0.003) main factors. The interaction ISI × side was not significant (F(6,54) = 1.46; p = 0.21). Post hoc t test showed that right PPC stimulation induced a more pronounced inhibition of the contralateral PPC–M1 in comparison with left PPC stimulation that was evident at ISIs ranging from 6 to 15 ms (all p < 0.05). Such latencies are comparable to the time course of activation previously observed for IHI between the primary motor cortices (Ferbert et al., 1992; Ni et al., 2009) (Fig. 4). Therefore, we argue that pIHI likely reflects the activation of transcallosal direct projections between homologous parietal regions.
Figure 4.

Time course of the effects of left and right PPC TMS at 70% RMT on the strength of the contralateral PPC–M1 connection. The ISI between TMS of right PPC and left PPC–M1 connection varied between 4 and 30 ms. *p < 0.05.
Experiment 4
In the line bisection task, the mean (±SD) RT was 571.4 ± 111.7 ms and mean accuracy, calculated on the total number of errors, was 17.42 ± 5.9. We found that the pIHI was also associated with subjects' performance in the visuospatial line bisection task (Fierro et al., 2000). The individual amount of pIHI induced by right PPC TMS at 70% RMT correlates with subjects' accuracy in performing the line bisection task (r = 0.62; p = 0.013). This finding indicates that interhemispheric inhibition is stronger in those subjects who present with a more pronounced leftward bias. Moreover, this measure did not correlate with RT (r = −0.25; p = not significant) or the total amount of errors (r = 0.12; p = not significant), showing that pIHI is not related to motor readiness states or general attention to the task (Fig. 5).
Figure 5.
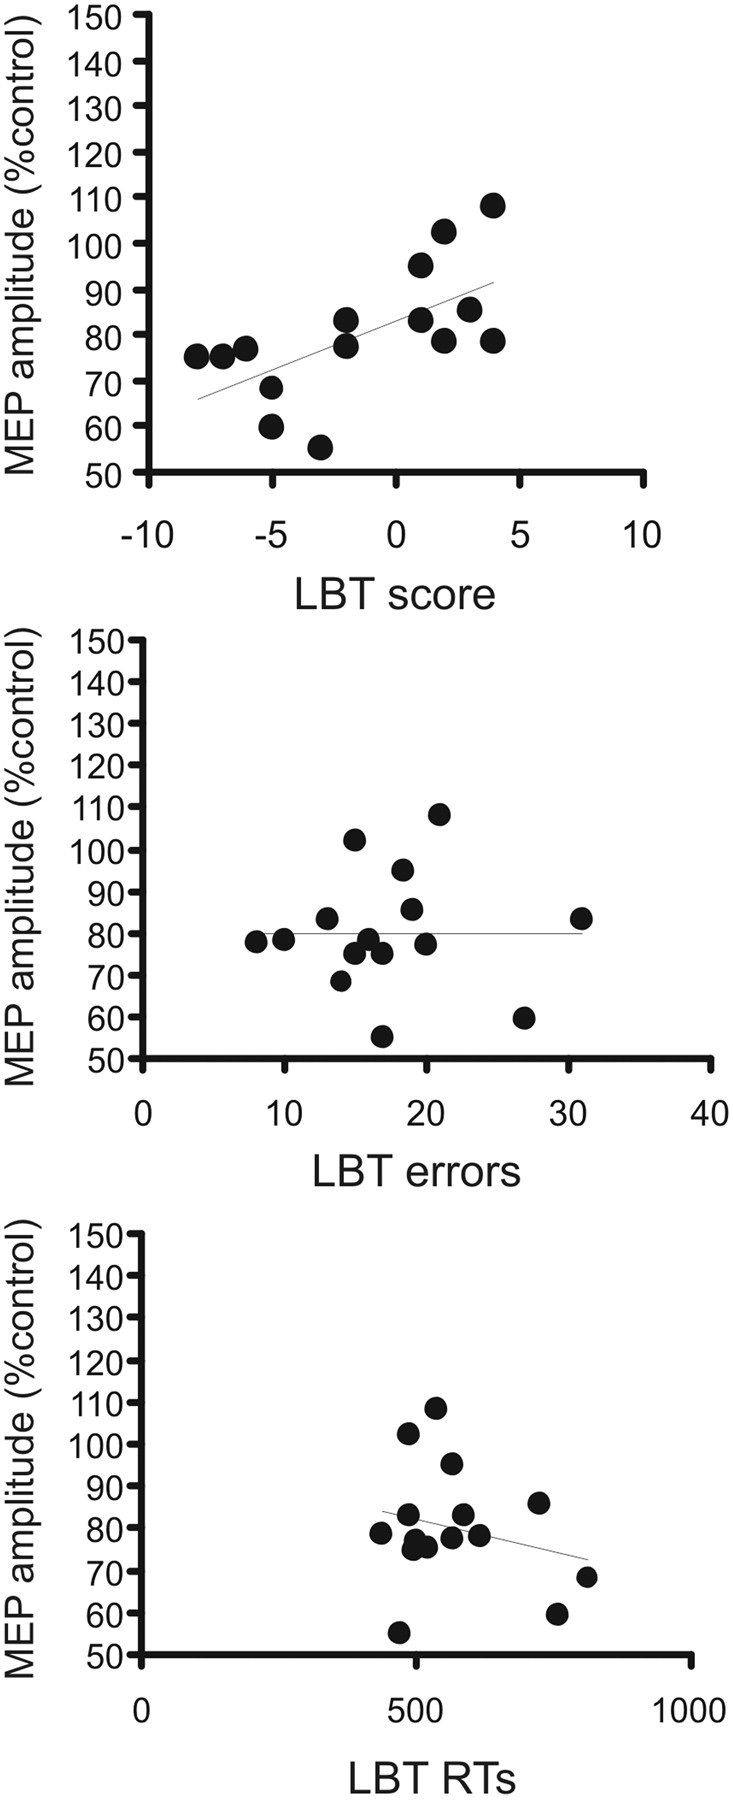
Correlation between individual mean values of pIHI and behavioral outcomes. Top, Mean pIHI versus total score obtained in the line bisection task (LBT). Middle, Mean pIHI versus total number of errors. Bottom, Mean pIHI versus reaction times. *p < 0.05.
Experiment 5
As FA has been shown to reflect functionally relevant microstructural properties of white matter (Boorman et al., 2007; Wahl et al., 2007; Mars et al., 2009), we used TBSS to analyze local correlations between individual estimates of FA and the amount of interhemispheric inhibition. TBSS provided support for the anatomical basis of the neurophysiological interactions, showing that the degree of interindividual inhibition of left PPC–M1 connection induced by right PPC TMS at 70% RMT was associated with a network of white matter tracts, including the posterior fourth portion of the corpus callosum (CC; regions IV and V), the SLF, and the corticospinal tract (Fig. 6).
Figure 6.

Areas of significant association between the individual amount of interhemispheric inhibition induced by right PPC stimulation on the PPC–M1 connection in the left hemisphere and the local individual estimates of FA. The areas of significant association are shown with a red/yellow color scale, where brighter colors indicate a more significant association. CST, Corticospinal tract; L, left; R, right; L-M, left-medial.
A list of all the areas of significant association between FA and percentage change in MEP induced by right PPC stimulation is reported in Table 1. Note that no significant association was found with FA of the genu and the callosal motor fibers.
Table 1.
Areas of significant association between fractional anisotropy and interhemispheric inhibition induced by right posterior parietal cortex stimulation
| Anatomical region | Side | Cluster size (voxels) | MNI coordinates of the MAX |
||
|---|---|---|---|---|---|
| x | y | z | |||
| Anterior thalamic radiation | L | 117 | −10 | −1 | 0 |
| Anterior thalamic radiation | R | 64 | 13 | −4 | −5 |
| Corpus callosum (body) | R | 20 | −7 | −27 | 24 |
| Corpus callosum (forceps major) | L | 29 | −9 | −38 | 10 |
| Corpus callosum (splenium) | R | 29 | 18 | −43 | 25 |
| CST (peduncles) | R | 36 | 7 | −19 | −27 |
| CST (internal capsule) | L | 28 | −22 | −21 | 2 |
| CST (internal capsule) | R | 79 | 27 | −25 | 19 |
| CST (internal capsule) | R | 24 | 26 | −19 | 13 |
| CST (next to precentral gyrus) | R | 25 | 36 | −27 | 46 |
| CST (next to precentral gyrus) | R | 21 | 40 | −28 | 57 |
| CST (pons) | R | 20 | 6 | −30 | −27 |
| SLF (external capsule) | L | 20 | −30 | −5 | 15 |
| SLF (next to angular gyrus) | R | 24 | 43 | −64 | 22 |
| SLF (next to inferior frontal gyrus) | L | 20 | −27 | 18 | 24 |
| SLF (next to insular cortex) | L | 433 | −27 | −30 | 12 |
| SLF (next to superior frontal gyrus) | L | 30 | −11 | 35 | 42 |
| SLF (next to supramarginal gyrus) | R | 26 | 45 | −38 | 15 |
| SLF (next to supramarginal gyrus) | R | 22 | 61 | −36 | 15 |
| Uncinate fasciculus | L | 156 | −23 | 19 | −8 |
| Uncinate fasciculus | L | 30 | −30 | 8 | −10 |
| Uncinate fasciculus | R | 34 | 26 | 17 | −7 |
| WM next to angular gyrus | L | 26 | −44 | −57 | 7 |
| WM next to middle frontal gyrus | R | 34 | 33 | 30 | 25 |
CST, Corticospinal tract; WM, white matter; R, right; L, left.
To visualize the relationship between FA and neurophysiological measures, the mean FA of the CC and left SLF clusters were extracted and plotted against the percentage change in MEP induced by right PPC stimulation over the contralateral PPC–M1 connection (Fig. 7B,D) and, as a control, the percentage change in MEP induced by left PPC stimulation over the contralateral PPC–M1 connection (Fig. 7C,E).
Figure 7.

Associations between FA and TMS measures. A, Areas within the SLF (yellow) and the CC (red) where we found a significant association between the individual amount of interhemispheric inhibition induced by right PPC stimulation on the PPC–M1 connection in the left hemisphere and the local individual estimates of FA. B, Scatter plots showing the relationship between the individual change of the left PPC–M1 connection following TMS of the right PPC at 70% RMT, with the mean FA of the clusters located within the posterior portion of the CC. C), Scatter plot of the same FA values versus the individual change of the right PPC–M1 connection following TMS of the left PPC at 70% RMT. D, Scatter plot of the individual change of the left PPC–M1 connection following TMS of the right PPC at 70% RMT with the mean FA of the clusters located in left SLF. E, Scatter plot of the same FA values versus the individual change of the right PPC–M1 connection following TMS of the left PPC at 70% RMT. Note that the values of two pairs of subjects overlap. CST, Corticospinal tract.
To confirm that the CC clusters of significant association between FA and inhibition induced by right PPC stimulation were part of the white matter pathways connecting the left and right PPC areas, we performed additional tractography analysis. First, we checked that the CC clusters were located along fibers crossing regions IV and V of the midsagittal slice of the CC. To this aim, the diffusion tensor data of all subjects were normalized and rotated using the preservation of principal direction algorithm (Alexander et al., 2001). Then they were averaged to yield a mean diffusion tensor. The CC regions III, IV, and V were manually outlined on the midsagittal slice and the probabilistic index of connectivity was used to reconstruct, using the mean tensor dataset, the tracts crossing these regions (Fig. 8A,B). As shown in Figure 8, of the three CC clusters, one was located at the boundary between region IV and V fibers and the other two clusters were within the region V fibers. Next, using the same algorithm, we reconstructed the white matter pathways originating from the same clusters. The results are shown in Figure 8C.
Figure 8.
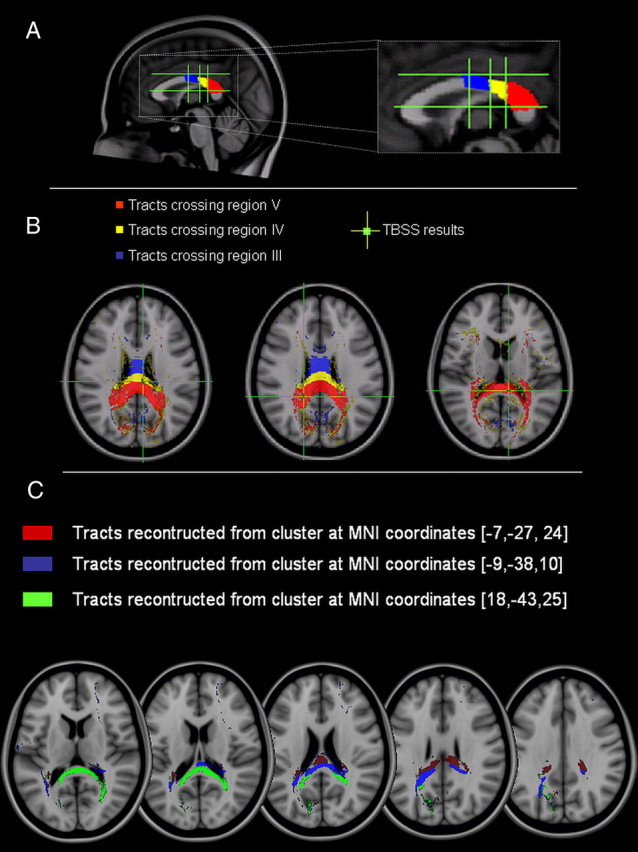
Tractography of the posterior portion of the CC. A, Segmentation of the midsagittal slice according to the topography of the CC proposed by Hofer and Frahm (2006). B, Reconstruction of CC fibers crossing regions III (blue), IV (yellow), and V (red). The green crosses localize the areas of significant correlation obtained with the TBSS analysis between the individual changes of the left PPC–M1 connection following TMS of the right PPC at 70% RMT and FA. These areas are localized in either region IV or V. C, Pathways reconstructed using the three CC clusters obtained with the TBSS analysis.
Discussion
The current results demonstrate that the right PPC inhibits the activation state of the contralateral parietofrontal connection more strongly than the left PPC does. This effect is mediated by a transcallosal pathway that is located in the posterior portion of the CC. We propose that this peculiar interhemispheric inhibition may represent an important neurophysiological mechanism at the basis of the well known asymmetry of visuospatial functions. Previous in vivo and postmortem anatomical studies (Pandya et al., 1971; Witelson, 1989; Zarei et al., 2006) showed that different subregions of the IPL are strongly interconnected with the contralateral hemisphere via transcallosal projections. Since there are no known long-range inhibitory neurones crossing the CC (Kukaswadia et al., 2005), and facilitatory transcallosal corticocortical fibers reach a population of different classes of GABAergic inhibitory neurones in the cortex (Xiang et al., 2002), it is plausible that the effect described here may involve differential activation of local inhibitory interneurones in the left PPC.
The location of fibers in the CC follows the anteroposterior location of their cortical connections. A recent DTI-based tractography classification of CC determined that fibers connecting the parietal, temporal, and occipital brain regions cross the CC through its region V, which is anatomically defined as the posterior fourth portion of the CC (Hofer and Frahm, 2006). We found a remarkable correlation between TMS and FA measures in this portion of the CC (region V) (Fig. 8), thus indicating that the transcallosal projections responsible for the pIHI are likely mediated by these fibers. Notably, the TBSS statistical analysis was applied to the whole brain to localize any area of significant association between the mean percentage change of interhemispheric inhibition without any a priori hypothesis. Nevertheless, the analysis did not reveal any significant correlation with other more anterior or posterior portions of the CC, thus indicating that the neurophysiological interactions described here between the left and right IPL are mediated by a specific neuroanatomical substrate and are dependent on the integrity of a set of callosal fibers that connect homologous cortical areas. However, it should be noted that pIHI was calculated indirectly as a ratio of MEP amplitude induced by right PPC stimulation on left PPC–M1 connection, and it was not possible to completely isolate the contribution of these neural components of the circuit. Therefore, since the output measure from M1 is the result of the activation of a polysynaptic pathway involving the SLF, it is not surprising that we also found a correlation of the neurophysiological interactions with the FA of the left SLF. This was expected since we already demonstrated that intrahemipsheric PPC–M1 connections are mediated by bundles of the SLF (Koch et al., 2010). In this regard, it has to be considered that the SLF itself is also a crucial node of the frontoparietal network involved in visuospatial attention (Doricchi and Tomaiuolo, 2003; Bartolomeo et al., 2007; He et al., 2007).
Previous TMS studies have described several interhemispheric inputs to M1 that originate from the homologous M1 (Ferbert et al., 1992), from the dorsal premotor cortex (Mochizuki et al., 2004; Koch et al., 2006), from the somatosensory cortex, and from the dorsolateral prefrontal cortex (Ni et al., 2009). The most robust effect observed is inhibitory with an early phase at latency of 8–10 ms, consistent with our current findings (Fig. 5). Notably, interhemispheric inhibition from the right-to-left and left-to-right motor cortices is reported to be symmetric in depth and time course, both at rest and during tasks requiring sustained unimanual contraction (Nelson et al., 2009). Thus, our findings are not to be ascribed to general asymmetries in the strength of IHI between the two hemispheres. Indeed, in the current study, transcallosal inhibition between right and left IPL was evident only at subthreshold intensities of stimulation. Although the reason for this is not clear, similar interactions have been described in other transcallosal pathways, such as those connecting the premotor cortex with contralateral M1 (Bäumer et al., 2006; Koch et al., 2006). It is thought that this profile of excitability may relate to the relative electrical thresholds of the systems in each cortical area, or it may be a function of the excitability of any interneurones in the connection pathway (Koch et al., 2009).
Alternately, it is possible that other excitatory circuits could be recruited at higher intensities, thereby cancelling the effects of the inhibitory projections. Moreover, given that the inhibitory circuit is activated with the current TMS protocol with only a narrow range of stimulation intensities, its physiological role may be limited and its relevance for pathological conditions such as neglect needs further confirmation.
Furthermore, it should be noted that we only tested pIHI latencies varying between 4 and 30 ms, whereas previous studies have shown that another phase of interhemispheric inhibition occurs between the primary motor cortices at longer intervals as well (40 to 50 ms) (Ni et al., 2009). In addition, to account for the right hemisphere dominance in attention tasks, it has been proposed that the interhemispheric interactions may be faster from right-to-left than left-to-right PPC (Marzi et al., 1991; Weber et al., 2005). Thus, it may be that other long-latency interhemispheric interactions exist between the homologous PPC regions, which may not have been covered in the present study, and that could contribute to the global unbalance of PPC interhemispheric interactions.
Here, the activation of right-to-left interhemispheric inhibition was obtained stimulating a region of the right IPL that is known to be involved in orienting contralateral spatial attention (Corbetta et al., 1993; Nobre et al., 1997; Szczepanski et al., 2010). Crucially, this area has been recently found to be active during tasks in which attention was directed toward ipsilateral stimuli, with a clear right hemispheric dominance (Shulman et al., 2010). Moreover, neglect is associated with hemorrhagic or ischemic stroke to right perisylvian regions, often including the right IPL and/or the nearby temporoparietal junction (Bisiach et al., 1986; Bowen et al., 1999; Karnath et al., 2002; Mort et al., 2003; Driver et al., 2004). Therefore, it is possible that the right IPL may play an important role in modulating visuospatial attention and contribute to neglect through the unidirectional inhibitory control over the contralateral homologous area. The putative role of the described interhemispheric pathway in visuospatial attention is partially supported by the high correlation found between the degree of pIHI and the leftward shift of attention observed in a visuospatial task. In contrast, pIHI did not correlate with reaction times or the total amount of errors, suggesting that this measure is not related to motor readiness states or general attention to the task. In line with the current findings, previous investigations showed that a virtual lesion of the right PPC by means of repetitive TMS induces a significant rightward bias in symmetry judgments using the same line bisection task (Fierro et al., 2000). It is plausible that the latter effect may have emerged through interference with the transcallosal inhibitory mechanism described here. However, further studies are needed to investigate how the inhibitory drive observed at rest may be modulated when subjects are performing different visuospatial tasks.
We speculate that this mechanism may also be involved in the pathophysiological changes that occur in patients with a neglect syndrome following an RH lesion. To this purpose, our study potentially provides a neural basis for the Kinsbourne model of interhemispheric competition of spatial attentional control (Kinsbourne, 1977). The current data offer one possible neurophysiological mechanism at the basis of the putative asymmetric attentional weight by which each of the LH and RH areas contributes to the control of spatial attention of the contralateral hemifield, with an RH advantage. Although the normal balance across the hemispheres may be achieved through reciprocal interhemispheric inhibition of corresponding areas, our data reveal that these interactions may be asymmetric between crucial nodes of the cortical networks involved in visuospatial attention, as in the case of the IPL areas described here. This top-down inhibitory and asymmetric mechanism could, at least partially, explain why the attentional vector of the RH likely prevails on a more tonically inhibited LH (Kinsbourne, 1977; Oliveri et al., 2001). Using this model, we recently described that, even at rest, the functional connection between left PPC–M1 is pathologically overexcitable in patients with an RH lesion who present with neglect (Koch et al., 2008b; O'Shea, 2009). In this perspective, the current set of experiments provides additional evidence that circuits in the LH may become disinhibited in patients with RH neglect because of a release from unidirectional inhibition as a consequence of the RH lesion. However, it has yet to be demonstrated that the circuit studied here is actually affected in patients with neglect. In fact, it has to be considered that the current use of PPC–M1 interaction as a measure of the PPC activation state may still be too indirect for the purpose of the current study. For instance, a recent study adopted a similar trifocal condition in which TMS was applied concurrently over the left PPC, right PPC, and either left or right visual cortex (V1/V2). The results showed that the increased visual cortical excitability (measured by the percentage of phosphenes induced by TMS) that was observed with unilateral parietal TMS was abolished when TMS was applied over the PPC bilaterally, implying the activation of an inhibitory transcallosal pathway (Silvanto et al., 2009). Interestingly, no hemispheric asymmetry was found. However, different latencies between TMS of the two PPCs and different intensities for contralateral PPC TMS were not systematically investigated. Therefore, further studies are needed to verify whether PPC–visual cortex interactions (which are likely to play a central role in visuospatial neglect) behave in a qualitatively different manner from the PPC–M1 interactions tested here.
In conclusion, to the best of our knowledge, this is the first study to provide the anatomo-functional demonstration of the right parietal advantage in controlling the contralateral homologous area through a short-latency transcallosal inhibitory mechanism. These findings may be relevant for their potential impact on the development of novel approaches for treating patients with deficits of visuospatial abilities, such as those suffering from poststroke neglect. Moreover, if applied to other cortical systems, this novel approach could be useful to further characterize the neural bases of brain lateralization processes.
Footnotes
This work was supported by grants from the Italian Ministry of Health (RF 08.18 to G.K., C.C., and M.B.). We thank Emiliano Macaluso and Massimiliano Oliveri for useful discussion on the early draft of the manuscript.
The authors declare no competing financial interests.
References
- Alexander DC, Pierpaoli C, Basser PJ, Gee JC. Spatial transformations of diffusion tensor magnetic resonance images. IEEE Trans Med Imaging. 2001;20:1131–1139. doi: 10.1109/42.963816. [DOI] [PubMed] [Google Scholar]
- Bartolomeo P, Thiebaut de Schotten M, Doricchi F. Left unilateral neglect as a disconnection syndrome. Cereb Cortex. 2007;17:2479–2490. doi: 10.1093/cercor/bhl181. [DOI] [PubMed] [Google Scholar]
- Basser PJ, Mattiello J, LeBihan D. MR diffusion tensor spectroscopy and imaging. Biophys J. 1994;66:259–267. doi: 10.1016/S0006-3495(94)80775-1. [DOI] [PMC free article] [PubMed] [Google Scholar]
- Bäumer T, Bock F, Koch G, Lange R, Rothwell JC, Siebner HR, Münchau A. Magnetic stimulation of human premotor or motor cortex produces interhemispheric facilitation through distinct pathways. J Physiol. 2006;572:857–868. doi: 10.1113/jphysiol.2006.104901. [DOI] [PMC free article] [PubMed] [Google Scholar]
- Bisiach E, Perani D, Vallar G, Berti A. Unilateral neglect: personal and extra-personal. Neuropsychologia. 1986;24:759–767. doi: 10.1016/0028-3932(86)90075-8. [DOI] [PubMed] [Google Scholar]
- Boorman ED, O'Shea J, Sebastian C, Rushworth MF, Johansen-Berg H. Individual differences in white-matter microstructure reflect variation in functional connectivity during choice. Curr Biol. 2007;17:1426–1431. doi: 10.1016/j.cub.2007.07.040. [DOI] [PubMed] [Google Scholar]
- Bowen A, McKenna K, Tallis RC. Reasons for variability in the reported rate of occurrence of unilateral spatial neglect after stroke. Stroke. 1999;30:1196–1202. doi: 10.1161/01.str.30.6.1196. [DOI] [PubMed] [Google Scholar]
- Caspers S, Eickhoff SB, Geyer S, Scheperjans F, Mohlberg H, Zilles K, Amunts K. The human inferior parietal lobule in stereotaxic space. Brain Struct Funct. 2008;212:481–495. doi: 10.1007/s00429-008-0195-z. [DOI] [PubMed] [Google Scholar]
- Corbetta M, Miezin FM, Shulman GL, Petersen SE. A PET study of visuospatial attention. J Neurosci. 1993;13:1202–1226. doi: 10.1523/JNEUROSCI.13-03-01202.1993. [DOI] [PMC free article] [PubMed] [Google Scholar]
- Doricchi F, Tomaiuolo F. The anatomy of neglect without hemianopia: a key role for parietal-frontal disconnection? Neuroreport. 2003;14:2239–2243. doi: 10.1097/00001756-200312020-00021. [DOI] [PubMed] [Google Scholar]
- Driver J, Vuilleumier P, Husain M. Spatial neglect and extinction. In: Gazzaniga M, editor. The new cognitive neurosciences III. Cambridge: MIT; 2004. pp. 589–606. [Google Scholar]
- Ferbert A, Priori A, Rothwell JC, Day BL, Colebatch JG, Marsden CD. Interhemispheric inhibition of the human motor cortex. J Physiol. 1992;453:525–546. doi: 10.1113/jphysiol.1992.sp019243. [DOI] [PMC free article] [PubMed] [Google Scholar]
- Fierro B, Brighina F, Oliveri M, Piazza A, La Bua V, Buffa D, Bisiach E. Contralateral neglect induced by right posterior parietal rTMS in healthy subjects. Neuroreport. 2000;11:1519–1521. [PubMed] [Google Scholar]
- He BJ, Snyder AZ, Vincent JL, Epstein A, Shulman GL, Corbetta M. Breakdown of functional connectivity in frontoparietal networks underlies behavioral deficits in spatial neglect. Neuron. 2007;53:905–918. doi: 10.1016/j.neuron.2007.02.013. [DOI] [PubMed] [Google Scholar]
- Heilman KM, Valenstein E, Watson RT. Neglect and related disorders. Semin Neurol. 2000;20:463–470. doi: 10.1055/s-2000-13179. [DOI] [PubMed] [Google Scholar]
- Hofer S, Frahm J. Topography of the human corpus callosum revisited: comprehensive fiber tractography using diffusion tensor magnetic resonance imaging. Neuroimage. 2006;32:989–994. doi: 10.1016/j.neuroimage.2006.05.044. [DOI] [PubMed] [Google Scholar]
- Jenkinson M, Smith S. A global optimisation method for robust affine registration of brain images. Med Image Anal. 2001;5:143–156. doi: 10.1016/s1361-8415(01)00036-6. [DOI] [PubMed] [Google Scholar]
- Jenkinson M, Bannister P, Brady M, Smith S. Improved optimization for the robust and accurate linear registration and motion correction of brain images. Neuroimage. 2002;17:825–841. doi: 10.1016/s1053-8119(02)91132-8. [DOI] [PubMed] [Google Scholar]
- Johansen-Berg H, Behrens TE. Just pretty pictures? What diffusion tractography can add in clinical neuroscience. Curr Opin Neurol. 2006;19:379–385. doi: 10.1097/01.wco.0000236618.82086.01. [DOI] [PMC free article] [PubMed] [Google Scholar]
- Karnath HO, Milner AD, Vallar G. The cognitive and neural bases of spatial neglect. Oxford: Oxford UP; 2002. [Google Scholar]
- Kinsbourne M. Hemi-neglect and hemisphere rivalry. Adv Neurol. 1977;18:41–49. [PubMed] [Google Scholar]
- Kinsbourne M. Orientational bias model of unilateral neglect: evidence from attentional gradients within hemispace. In: Robertson IH, Marshall JC, editors. Unilateral neglect: clinical and experimental studies. Hove, UK: Lawrence Erlbaum; 1993. pp. 63–86. [Google Scholar]
- Koch G, Franca M, Fernandez Del Olmo MF, Cheeran B, Milton R, Alvarez Sauco M, Rothwell JC. Time course of functional connectivity between dorsal premotor and contralateral motor cortex during movement selection. J Neurosci. 2006;26:7452–7459. doi: 10.1523/JNEUROSCI.1158-06.2006. [DOI] [PMC free article] [PubMed] [Google Scholar]
- Koch G, Fernandez Del Olmo M, Cheeran B, Ruge D, Schippling S, Caltagirone C, Rothwell JC. Focal stimulation of the posterior parietal cortex increases the excitability of the ipsilateral motor cortex. J Neurosci. 2007;27:6815–6822. doi: 10.1523/JNEUROSCI.0598-07.2007. [DOI] [PMC free article] [PubMed] [Google Scholar]
- Koch G, Fernandez Del Olmo M, Cheeran B, Schippling S, Caltagirone C, Driver J, Rothwell JC. Functional interplay between posterior parietal and ipsilateral motor cortex revealed by twin-coil transcranial magnetic stimulation during reach planning toward contralateral space. J Neurosci. 2008a;28:5944–5953. doi: 10.1523/JNEUROSCI.0957-08.2008. [DOI] [PMC free article] [PubMed] [Google Scholar]
- Koch G, Oliveri M, Cheeran B, Ruge D, Lo Gerfo E, Salerno S, Torriero S, Marconi B, Mori F, Driver J, Rothwell JC, Caltagirone C. Hyperexcitability of parietal-motor functional connections in the intact left-hemisphere of patients with neglect. Brain. 2008b;131:3147–3155. doi: 10.1093/brain/awn273. [DOI] [PMC free article] [PubMed] [Google Scholar]
- Koch G, Ruge D, Cheeran B, Fernandez Del Olmo M, Pecchioli C, Marconi B, Versace V, Lo Gerfo E, Torriero S, Oliveri M, Caltagirone C, Rothwell JC. TMS activation of interhemispheric pathways between the posterior parietal cortex and the contralateral motor cortex. J Physiol. 2009;587:4281–4292. doi: 10.1113/jphysiol.2009.174086. [DOI] [PMC free article] [PubMed] [Google Scholar]
- Koch G, Cercignani M, Pecchioli C, Versace V, Oliveri M, Caltagirone C, Rothwell J, Bozzali M. In vivo definition of parieto-motor connections involved in planning of grasping movements. Neuroimage. 2010;51:300–312. doi: 10.1016/j.neuroimage.2010.02.022. [DOI] [PubMed] [Google Scholar]
- Kukaswadia S, Wagle-Shukla A, Morgante F, Gunraj C, Chen R. Interactions between long latency afferent inhibition and interhemispheric inhibitions in the human motor cortex. J Physiol. 2005;563:915–924. doi: 10.1113/jphysiol.2004.080010. [DOI] [PMC free article] [PubMed] [Google Scholar]
- Leemans A, Jones DK. The B-matrix must be rotated when correcting for subject motion in DTI data. Magn Reson Med. 2009;61:1336–1349. doi: 10.1002/mrm.21890. [DOI] [PubMed] [Google Scholar]
- Mars RB, Klein MC, Neubert FX, Olivier E, Buch ER, Boorman ED, Rushworth MF. Short-latency influence of medial frontal cortex on primary motor cortex during action selection under conflict. J Neurosci. 2009;29:6926–6931. doi: 10.1523/JNEUROSCI.1396-09.2009. [DOI] [PMC free article] [PubMed] [Google Scholar]
- Marzi CA, Bisiacchi P, Nicoletti R. Is interhemispheric transfer of visuomotor information asymmetric? Evidence from a meta-analysis. Neuropsychologia. 1991;29:1163–1177. doi: 10.1016/0028-3932(91)90031-3. [DOI] [PubMed] [Google Scholar]
- Mesulam MM. A cortical network for directed attention and unilateral neglect. Ann Neurol. 1981;10:309–325. doi: 10.1002/ana.410100402. [DOI] [PubMed] [Google Scholar]
- Mochizuki H, Huang YZ, Rothwell JC. Interhemispheric interaction between human dorsal premotor and contralateral primary motor cortex. J Physiol. 2004;561:331–338. doi: 10.1113/jphysiol.2004.072843. [DOI] [PMC free article] [PubMed] [Google Scholar]
- Mort DJ, Malhotra P, Mannan SK, Rorden C, Pambakian A, Kennard C, Husain M. The anatomy of visual neglect. Brain. 2003;126:1986–1997. doi: 10.1093/brain/awg200. [DOI] [PubMed] [Google Scholar]
- Nelson AJ, Hoque T, Gunraj C, Ni Z, Chen R. Bi-directional interhemispheric inhibition during unimanual sustained contractions. BMC Neurosci. 2009;10:31. doi: 10.1186/1471-2202-10-31. [DOI] [PMC free article] [PubMed] [Google Scholar]
- Neubert FX, Mars RB, Buch ER, Olivier E, Rushworth MF. Cortical and subcortical interactions during action reprogramming and their related white matter pathways. Proc Natl Acad Sci U S A. 2010;107:13240–13245. doi: 10.1073/pnas.1000674107. [DOI] [PMC free article] [PubMed] [Google Scholar]
- Ni Z, Gunraj C, Nelson AJ, Yeh IJ, Castillo G, Hoque T, Chen R. Two phases of interhemispheric inhibition between motor related cortical areas and the primary motor cortex in human. Cereb Cortex. 2009;19:1654–1665. doi: 10.1093/cercor/bhn201. [DOI] [PubMed] [Google Scholar]
- Nobre AC, Sebestyen GN, Gitelman DR, Mesulam MM, Frackowiak RS, Frith CD. Functional localization of the system for visuospatial attention using positron emission tomography. Brain. 1997;120:515–533. doi: 10.1093/brain/120.3.515. [DOI] [PubMed] [Google Scholar]
- Oldfield RC. The assessment and analysis of handedness: the Edinburgh inventory. Neuropsychologia. 1971;9:97–113. doi: 10.1016/0028-3932(71)90067-4. [DOI] [PubMed] [Google Scholar]
- Oliveri M, Bisiach E, Brighina F, Piazza A, La Bua V, Buffa D, Fierro B. rTMS of the unaffected hemisphere transiently reduces contralesional visuospatial hemineglect. Neurology. 2001;57:1338–1340. doi: 10.1212/wnl.57.7.1338. [DOI] [PubMed] [Google Scholar]
- O'Shea J. Cognitive neurology: stimulating research on neglect. Curr Biol. 2009;19:R76–R78. doi: 10.1016/j.cub.2008.11.038. [DOI] [PubMed] [Google Scholar]
- Pandya DN, Karol EA, Heilbronn D. The topographical distribution of interhemispheric projections in the corpus callosum of the rhesus monkey. Brain Res. 1971;32:31–43. doi: 10.1016/0006-8993(71)90153-3. [DOI] [PubMed] [Google Scholar]
- Reese TG, Heid O, Weisskoff RM, Wedeen VJ. Reduction of eddy-current-induced distortion in diffusion MRI using a twice-refocused spin echo. Magn Reson Med. 2003;49:177–182. doi: 10.1002/mrm.10308. [DOI] [PubMed] [Google Scholar]
- Rossini PM, Barker AT, Berardelli A, Caramia MD, Caruso G, Cracco RQ, Dimitrijević MR, Hallett M, Katayama Y, Lücking CH. Non-invasive electrical and magnetic stimulation of the brain, spinal cord and roots: basic principles and procedures for routine clinical application: report of an IFCN committee. Electroencephalogr Clin Neurophysiol. 1994;91:79–92. doi: 10.1016/0013-4694(94)90029-9. [DOI] [PubMed] [Google Scholar]
- Shulman GL, Pope DL, Astafiev SV, McAvoy MP, Snyder AZ, Corbetta M. Right hemisphere dominance during spatial selective attention and target detection occurs outside the dorsal frontoparietal network. J Neurosci. 2010;30:3640–3651. doi: 10.1523/JNEUROSCI.4085-09.2010. [DOI] [PMC free article] [PubMed] [Google Scholar]
- Silvanto J, Muggleton N, Lavie N, Walsh V. The perceptual and functional consequences of parietal top-down modulation on the visual cortex. Cereb Cortex. 2009;19:327–330. doi: 10.1093/cercor/bhn091. [DOI] [PMC free article] [PubMed] [Google Scholar]
- Smith SM, Jenkinson M, Johansen-Berg H, Rueckert D, Nichols TE, Mackay CE, Watkins KE, Ciccarelli O, Cader MZ, Matthews PM, Behrens TE. Tract-based spatial statistics: voxelwise analysis of multi-subject diffusion data. Neuroimage. 2006;31:1487–1505. doi: 10.1016/j.neuroimage.2006.02.024. [DOI] [PubMed] [Google Scholar]
- Szczepanski SM, Konen CS, Kastner S. Mechanisms of spatial attention control in frontal and parietal cortex. J Neurosci. 2010;30:148–160. doi: 10.1523/JNEUROSCI.3862-09.2010. [DOI] [PMC free article] [PubMed] [Google Scholar]
- Vallar G, Bottini G, Paulesu E. Neglect syndromes: the role of the parietal cortex. Adv Neurol. 2003;93:293–319. [PubMed] [Google Scholar]
- Wahl M, Lauterbach-Soon B, Hattingen E, Jung P, Singer O, Volz S, Klein JC, Steinmetz H, Ziemann U. Human motor corpus callosum: topography, somatotopy, and link between microstructure and function. J Neurosci. 2007;27:12132–12138. doi: 10.1523/JNEUROSCI.2320-07.2007. [DOI] [PMC free article] [PubMed] [Google Scholar]
- Weber B, Treyer V, Oberholzer N, Jaermann T, Boesiger P, Brugger P, Regard M, Buck A, Savazzi S, Marzi CA. Attention and interhemispheric transfer: a behavioral and fMRI study. J Cogn Neurosci. 2005;17:113–123. doi: 10.1162/0898929052880002. [DOI] [PubMed] [Google Scholar]
- Witelson SF. Hand and sex differences in the isthmus and genu of the human corpus callosum: a postmortem morphological study. Brain. 1989;112:799–835. doi: 10.1093/brain/112.3.799. [DOI] [PubMed] [Google Scholar]
- Xiang Z, Huguenard JR, Prince DA. Synaptic inhibition of pyramidal cells evoked by different interneuronal subtypes in layer v of rat visual cortex. J Neurophysiol. 2002;88:740–750. doi: 10.1152/jn.2002.88.2.740. [DOI] [PubMed] [Google Scholar]
- Zarei M, Johansen-Berg H, Smith S, Ciccarelli O, Thompson AJ, Matthews PM. Functional anatomy of interhemispheric cortical connections in the human brain. J Anat. 2006;209:311–320. doi: 10.1111/j.1469-7580.2006.00615.x. [DOI] [PMC free article] [PubMed] [Google Scholar]