

Abstract
Motor tics are involuntary brief muscle contractions that interfere with ongoing behavior and appear as a symptom in several human disorders. While the pathophysiology of tics is still largely unknown, multiple lines of evidence suggest the involvement of the corticobasal ganglia loop in tic disorders. We administered local microinjections of bicuculline into the putamen of Macaca fascicularis monkeys to induce motor tics, while simultaneously recording neuronal activity from the primary motor cortex, putamen, and globus pallidus. These data were used to explore the spatial and temporal properties of tic-related neuronal activity within the cortico-basal ganglia system. In the putamen, tics were associated with brief bursts of activity of phasically active neurons (presumably the projection neurons) and complex excitation–inhibition patterns of tonically active neurons. Tic-related activity within the putamen was spatially focused and somatotopically organized. In the globus pallidus, tic-related activity was diffusely distributed throughout the motor territory. Tic-related activity in the putamen usually preceded the tic-related activations in the cortex, but in the globus pallidus, tic-related activity was mostly later than the cortex. These findings shed new light on the role of the different basal ganglia nuclei in the generation of motor tics. Despite the early and somatotopically focused nature of tic-related activity in the input stage of the basal ganglia, tic-related activity in the output nucleus is temporally late and diffusely distributed, making it incompatible with a role in tic initiation. Instead, abnormal basal ganglia activity may serve to modulate motor patterns or activate learning mechanisms, thus augmenting further tic expression.
Introduction
Motor tics are repetitive, involuntary brief muscle contractions that interfere with ongoing behavior and appear as a symptom in multiple disorders (de la Tourette, 1885; Caviness and Brown, 2004). While the pathophysiology leading to tic expression is still largely unknown, multiple lines of evidence suggest the involvement of the cortico-basal ganglia (CBG) loop in tic disorders (Singer and Minzer, 2003; Abelson et al., 2005; Kalanithi et al., 2005; Baym et al., 2008). Specifically, structural and functional imaging studies have found abnormalities in the striatum (Singer and Minzer, 2003), which is the main input structure of the basal ganglia (BG). The direct involvement of the striatum in tics is further supported by findings that disruption of striatal information transmission by localized application of a GABAA antagonist induces motor tics (Tarsy et al., 1978; Crossman et al., 1988; McCairn et al., 2009; Worbe et al., 2009).
The striatum receives most of its input from cortical and thalamic excitatory glutamatergic projections (Kemp and Powell, 1971; Wilson et al., 1983). The principal type of neuron in the striatum is the GABAergic projection neuron (Kemp and Powell, 1971; Graveland et al., 1985). These neurons, dubbed medium spiny neurons (MSNs), present a characteristic low-frequency bursting (phasic) firing pattern (Wilson and Groves, 1981). The striatum also includes tonically active neurons (TANs), a type of cholinergic interneurons firing at a low-frequency Poissonian rate (Bolam et al., 1984; Wilson et al., 1990), and several types of GABAergic interneurons that modulate MSN activity (Tepper et al., 2004). The putamen is the part of the striatum that primarily receives somatotopically organized inputs from motor cortical areas (Alexander and DeLong, 1985; Parent, 1990; Hoover and Strick, 1999; Haber et al., 2000). The putamen projects mainly to the globus pallidus external and internal segments (GPe and GPi, respectively), while generally preserving the somatotopic organization (DeLong et al., 1985; Alexander and Crutcher, 1990).
Theoretical models have viewed motor tics as a disruption of the CBG action selection process (Mink, 1996, 2001). The hypothesis is that tics are generated by an abnormal focal disinhibition of striatal neurons, causing the inhibition of a subset of neurons in the BG output nucleus (the GPi), which in turn disinhibits a group of thalamic neurons and their cortical targets, thus releasing an undesirable motor pattern—a tic. Thus, abnormal tic-related activity in the BG nuclei should occur well before the onset of the tic itself and the cortical tic-related activation.
We used local microinjections of the GABAA antagonist bicuculline in the dorsolateral putamen to induce motor tics in nonhuman primates. We previously reported that tics were associated with marked phasic firing rate excitations in the motor cortex and the GPe and with phasic inhibitions in the GPi (McCairn et al., 2009). In this study, we sought to explore the properties of tic-related activity along the CBG to understand its role in tics generation and expression. We characterize the spatial distribution of tic-related activity in the different CBG nuclei and the temporal relations of tic-related activity among them.
Materials and Methods
Animals.
Two Macaca fascicularis monkeys (monkeys I and G; males; weight, 5–7 kg) were used in this study. The monkeys' health was monitored by a veterinarian, and their fluid consumption, diet, and weight were monitored daily. All procedures were in accordance with the National Institutes of Health Guide for the Care and Use of Laboratory Animals (1996) and Bar-Ilan University guidelines for the Use and Care of Laboratory Animals in Research. The experiments were approved and supervised by the Institutional Animal Care and Use Committee.
Surgical procedure.
The surgical procedures for cranial implantation are described in detail in previous work from our lab (McCairn et al., 2009). Briefly, two square cilux chambers (27 × 27 mm; Alpha-Omega Engineering) were implanted stereotaxically to allow bilateral access to the motor cortex and all the BG nuclei using a coronal approach. The recording chambers were tilted at 35° in the coronal plane with their centers targeted to the center of the GPi (stereotactic coordinates: A13, L8, and H3) (Szabo and Cowan, 1984).
Experimental setup, electrophysiological recordings, and microinjections.
The experimental design was the same as previously described (McCairn et al., 2009). Briefly, animals were trained to sit in a primate chair with their head and the hand ipsilateral to the injected hemisphere immobilized. The animal's behavior was continuously monitored by multichannel high-speed video cameras (25 frames/s for monkey I; 50 frames/s for monkey G) and electromyogram (EMG) recordings. EMG wires (60 μm Teflon-coated silver wire) were inserted percutaneously immediately before each experimental session into the biceps, triceps, and ventral orbicularis oris in monkey I, and the zygomaticus major in monkeys I and G. Exact timing of tic onset was identified offline using rectification of the EMG signal and a threshold-crossing detection method. Frame-by-frame video analysis was used to characterize the motor tics and overall behavior of the animals, and was aligned to the EMG tic-detection to exclude nonrelevant muscular activity.
Before recording sessions, each animal underwent microelectrode-guided mapping of the motor cortex, putamen, GPe, and GPi. The GABAA antagonist bicuculline was dissolved in physiological saline (15 μg/μl) and injected via a stainless steel cannula into the dorsolateral putamen. During each experimental session, up to 11 independently moveable glass-coated tungsten microelectrodes (impedance, 250–750 KΩ at 1 kHz) were used to simultaneously record neuronal activity from the primary motor cortex (M1), GPe, GPi (both monkeys), and putamen (monkey G). Throughout each recording session, the animal's behavior was carefully monitored for at least 20 min before injection and 80–170 min (mean, 117 min) after injection.
Analysis of neuronal activity.
Action potentials of individual neurons were sorted offline (OfflineSorter V2.8.7; Plexon), enabling high-fidelity neuronal identification. All further analyses were performed using the offline sorted spike trains with custom-written MATLAB code (MATLAB 2007B; MathWorks). All measures in the Results section, below, are described as mean ± SEM unless stated otherwise.
Time stamps of tic onset obtained from the EMG activity were used to construct peri-tic time histograms (PTTH) of the recorded neurons. For each neuron, the peri-tic raster was constructed, taking the spikes that occurred within ±1 s of tic-onset time, and the PTTH was calculated in 1 ms bins and smoothed with a Gaussian window with a SD of 2 ms. Significance testing of the PTTH was determined by constructing confidence limits (p < 0.01) based on the mean and SD of the tail of the PTTH (the PTTH segment starting at 1 s and ending at 0.2 s before tic-onset time). A change in the PTTH was considered significant if it crossed this confidence limit for at least three consecutive bins; the time of the first significant bin was considered as the onset time of the tic-related rate modulation. A potential bias of this method and other change-point detection methods is their dependence on the SD of the baseline neuronal activity, which is dependent on the baseline firing rate. Thus, neurons with higher baseline firing rates might be biased toward later detections of onset times of significant rate modulations compared with neurons with lower baseline firing rates. We used simulated PTTHs to estimate the potential error in detection of rate modulation onset time related to the baseline firing rate and found that it did not significantly influence the results in our dataset (for details about additional detection methods and these simulations and analyses, see Notes).
Histology.
Following completion of the experimental sessions, animals were anesthetized using 10 mg/kg ketamine and stereotactic marking microlesions (DC current, 60 μA for 30 s) were made. The lesions were targeted to dorsal white matter areas at the anatomical plane that was derived from electrophysiological mapping to be consistent with the position of the anterior commissure (AC) (McCairn et al., 2009). The animals were then deeply anesthetized using 50 mg/kg sodium pentobarbital and transcardially perfused with 1 L of physiological saline, followed by 1 L of 4% paraformaldehyde. The whole brain was removed and buffered in graded 10–30% sucrose solution over 7 d. The brain was then frozen at −25°C and cut in the coronal plane using a cryostat (Leica Microsystems). Each section was digitized using a 10 MPixel digital camera. Sections of interest were mounted onto glass slides and Nissl stained. Contours of brain structures were traced using the digitized images and the position of each injection site was plotted on coronal planes, taking AC0 as the origin of the anterior–posterior axis.
Results
A total of 14 bicuculline microinjections (Table 1) were administered, targeting the dorsal putamen in two monkeys. The majority of injections (10 of 14, 71%) resulted in the appearance of motor tics (5 of 7 injections in each monkey). The injection sites were localized using microlesion markings and electrophysiological mapping, and were overlaid on the postmortem anatomical reconstruction of the left hemisphere of monkey G (Fig. 1). The injection sites were all within the dorsal half of the putamen, spanning the anterior–posterior planes AC−1 to AC−4 (Fig. 1). The tic-inducing injections did not differ in their localization from the non-tic-inducting injections.
Table 1.
Microinjections: anatomical and behavioral details
| Animal | Injection number | AC plane | Volume (μl) | Effect | Latency (min) |
|---|---|---|---|---|---|
| I | 1 | −3 | 5 | Facial/shoulder tics | 2 |
| 2 | −2 | 2.5 | Facial/shoulder tics | 5 | |
| 3 | −3 | 5 | No effect | — | |
| 4 | −2 | 5 | No effect | — | |
| 5 | −4 | 2.5 | Facial/shoulder tics | 5 | |
| 6 | −4 | 2.5 | Facial tics | 3 | |
| 7 | −1 | 2.5 | Facial tics | 5 | |
| G | 8 | −3 | 3 | Facial tics | 3 |
| 9 | −4 | 2.5 | Facial/hand tics | 2 | |
| 10 | −2 | 2 | Facial tics | 1 | |
| 11 | −2 | 4.5 | Facial/hand tics | 6 | |
| 12 | −4 | 4 | No effect | — | |
| 13 | −3 | 3.5 | Facial tics | 1 | |
| 14 | −4 | 3 | No effect | — |
Each animal received seven injections.
Figure 1.
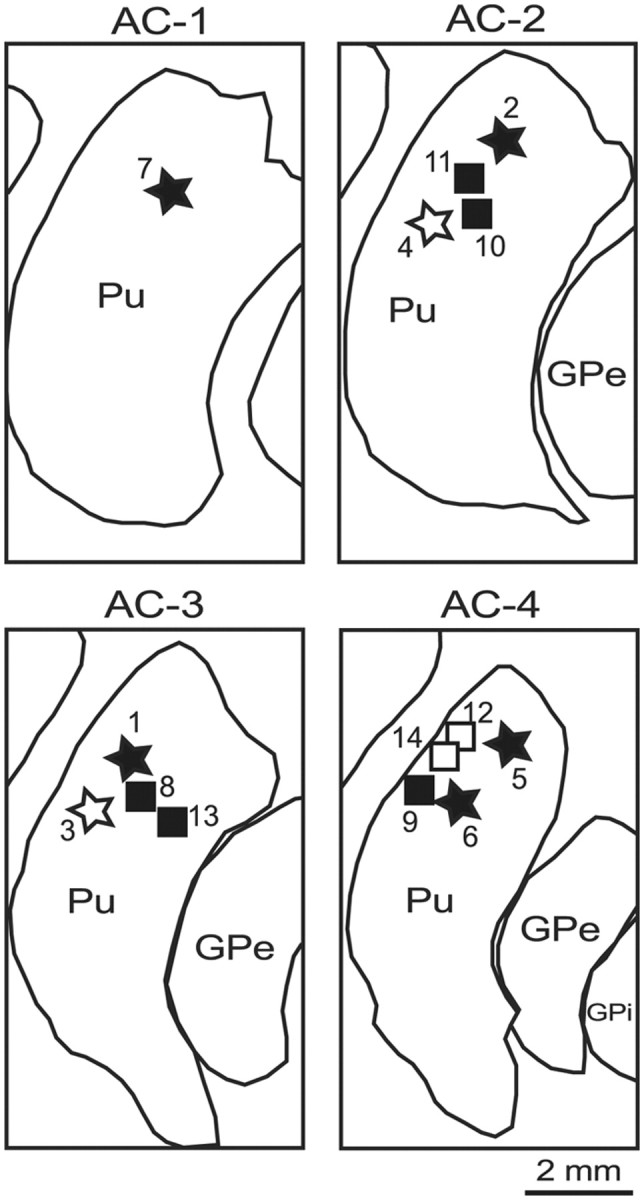
Anatomical reconstruction of injection site locations. Location of the bicuculline microinjection sites (stars, monkey I; squares, monkey G), marked by the postinjection behavioral effects (black, motor tics; white, no effect). Outline drawings are reconstructed from the coronal sections of the right hemisphere of monkey G, and the injection sites from both animals are overlaid on the same outlines. The anterior–posterior levels of the sections are presented as distances (millimeters) from the AC. Pu, Putamen.
Behavioral effects
Behavioral effects were similar to those previously described by our group (McCairn et al., 2009). Motor tics typically presented as focal, sudden, brief jerk-like movements, which were easily detectable both in video recordings and EMG activity. All tic-inducing microinjections led to prominent tics in orofacial areas, manifesting as brief retractions of the upper or lower lip (or both) and involving only the side of the face contralateral to the injection (Table 1). In some cases (5 of 10 injections) orofacial tics appeared simultaneously with tics in the upper limb, presenting either as a small jerk of the shoulder, a small retraction of the wrist/palm, or, in one case, a rotation of the wrist (Table 1).
Tic-related neuronal activity
The neurons recorded from the putamen were classified into phasically active neurons (PANs, which are putatively the projection neurons) and TANs (which are putatively the cholinergic interneurons) (Inokawa et al., 2010) based on their firing patterns and shapes of the extracellular action potential (Fig. 2A,D). Seventy PANs and 12 TANs were recorded during the expression of bicuculline-induced motor tics in monkey G. Twenty-six of 70 PANs (37%) displayed significant phasic firing rate modulations around tic -onset time. The PANs tic-related activity was always a brief burst of activity around tic onset with little or no activity between tics (Fig. 2A–C). Six of 12 TANs (50%) displayed significant phasic firing rate modulations around tic onset. TANs tic-related activity was complex, including both an increase and an inhibition of firing around tic onset (Fig. 2D–F).
Figure 2.

Peri-tic neuronal activity. A, D, G, Representative examples of raw traces and peri-tic neuronal activity of a PAN (A), TAN (D), and GPe LFB (G). Traces of recorded activity are shown together with the simultaneously recorded EMG activity (zygomaticus major muscle) in two time scales: 14 s (bottom traces) and insets of 300 ms (top traces). B, E, H, Neuronal activities aligned to tic-onset time of the same PAN (B), TAN (E), and LFB (H) are presented as peri-tic rasters (top; red triangles, tic-onset time as detected from the EMG activation; black dots, neuronal action potentials) and peri-tic time histograms (bottom). Dashed lines in the histograms are the upper and lower 99% confidence limits. C, F, I, Population peri-tic histogram matrices of all responding PAN (C), TAN (F), and LFB (I) neurons. Only periods of significant (p < 0.01) changes in firing rate are presented for each neuron (red, rate increase; blue, rate decrease).
A total of 105 high-frequency pausing (HFP) GPe neurons (monkey I, 69; monkey G, 36), 19 low-frequency bursting (LFB) GPe neurons (monkey I, 14; monkey G, 5) and 112 GPi neurons (monkey I, 82; monkey G, 30) were recorded during the expression of motor tics. The vast majority of pallidal neurons displayed significant phasic firing rate modulations around tic-onset time [71 of 105 (67%) HFP GPe, 14 of 19 (74%) LFB GPe, and 79 of 112 (70%) GPi neurons]. Tic-related GPe LFB neurons displayed bursting activity around tic time, with little or no bursts between tics (Fig. 2G–I). The different types of observed tic-related activities of high-frequency GPe and GPi neurons were described in detail in our previous work (McCairn et al., 2009) and were consistent for both monkeys used in the current study. Both GPe and GPi high-frequency neurons exhibited phasic tic-related increases and decreases in firing rate, either alone or as part of a multiphasic response (McCairn et al., 2009). Overall, tic-related rate increases were detected in 56 of 71 (78%) of the GPe neurons and 51 of 79 (64%) of the GPi neurons, and tic-related rate decreases were detected in 36 of 71 (50%) of the GPe neurons and 66 of 79 (84%) of the GPi neurons. Thus, tic-related excitations were the more common GPe response (χ2 goodness of fit test, χ2(1) = 12.04, p < 0.01), whereas tic-related inhibitions were more common within the GPi (χ2 goodness of fit test, χ2(1) = 7. 41, p < 0.01).
Spatial properties of tic-related activity
Analysis of the location of neurons recorded from the putamen during the expression of motor tics revealed a clear spatial organization of tic-related activity. Neurons expressing tic-related activity were found in more ventromedial parts of the putamen along the recording electrode trajectories, while neurons recorded in dorsolateral areas showed no tic-related activity (Fig. 3A). This spatial organization was consistent for both PANs (mean distance from putamen dorsolateral border: tic-related, 2.96 ± 0.09 mm; tic-unrelated, 1.15 ± 0.15 mm; Student's t test, p < 0.001) and TANs (mean distance from putamen dorsolateral border: tic-related, 2.6 ± 0.34 mm; tic-unrelated, 1.3 ± 0.29 mm; Student's t test, p < 0.05) (Fig. 3B). There was no significant difference in the spatial distribution of tic-related relative to -unrelated PANs and TANs along the anterior–posterior axis of the putamen at the recorded AC levels (Mann–Whitney U test, p > 0.05).
Figure 3.

Spatial distribution of tic-related activity in the putamen. A, Location of neurons recorded from the putamen (Pu) during the expression of motor tics (circles, PANs; triangles, TANs), presented on reconstructed coronal sections of monkey G. Black and white icons indicate neurons with and without significant tic-related activity modulations, respectively. B, Mean distance from the dorsolateral border of each nucleus along the electrode trajectory of tic-related (black bars) and unrelated (white bars) PANs and TANs. Error bars represent SEM. *p < 0.05, **p < 0.01.
Tic-related activity in both the GPe and GPi was diffusely distributed throughout each nucleus (Fig. 4A,B). There was no difference along the dorsolateral–ventromedial trajectory between the distribution of tic-related relative to -unrelated GPe neurons (mean distance from GPe dorsolateral border: tic-related, 0.8 ± 0.05 mm; tic-unrelatedm 0.69 ± 0.09 mm; Student's t test, p > 0.05) or GPi neurons (mean distance from GPi dorsolateral border: tic-related, 1.58 ± 0.11 mm; tic-unrelated, 1.59 ± 0.14 mm; Student's t test, p > 0.05) (Fig. 4C). However, there was an uneven spatial distribution of tic-related relative to -unrelated GPi neurons along the anterior–posterior axis, with tic-related activity more common in posterior parts of the GPi (Mann–Whitney U test, p < 0.001). The difference for the anterior–posterior distribution in the GPe only approached significance, which can probably be attributed to the small number of neurons recorded from anterior parts (Mann–Whitney U test, p = 0.058).
Figure 4.

Spatial distribution of tic-related activity in the globus pallidus. A, B, Distance from the dorsolateral border of each nucleus along the electrode trajectory of GPe (A) and GPi (B) neurons recorded from different anterior–posterior levels during the expression of motor tics. Black and white circles indicate neurons with and without significant tic-related activity modulation, respectively. C, Mean distance from GPe/GPi dorsolateral border of tic-related (black bar) compared with unrelated (white bars) GPe and GPi neurons, respectively. Error bars represent SEM.
Temporal properties of tic-related activity
To estimate the temporal dynamics of tic-related activity throughout the CBG system, we compared the earliest significant tic-related firing rate modulation in pairs of neurons recorded simultaneously from the different CBG nuclei. This type of analysis helped overcome between-session variations in the EMG-derived identification of tic-onset time, since it was based on the temporal difference in response time between different nuclei and not on the absolute timing of the response (which is susceptible to tic-identification errors). In all subsequent pairwise temporal analyses (see below), the timing of the earliest tic-related activity was estimated from the PTTH of each neuron calculated only for tics that occurred during the overlap period between the two neurons.
Twenty-two pairs of simultaneously recorded PAN and M1 neurons were used in this analysis. In 16 of 22 (73%) pairs, the tic-related activation in the PAN was earlier than the tic-related activation in the cortical neuron (Fig. 5, circles). The average time difference between the timing of tic-related cortical and PAN activations (calculated as timeM1 − timePAN) was 16.05 ± 6.3 ms. The dominance of early striatal tic-related activation was maintained after we divided the pairs based on the timing of the cortical activation. For all pairs in which the tic-related activation of the cortical neuron was after tic-onset time (6 of 6 pairs), the tic-related activation in the PAN was earlier than the activation in the M1 neuron (Fig. 5, open circles). In the majority of pairs in which the cortical activity was before tic onset time (10 of 16, 62%), the PAN tic-related activity was earlier than the M1 neuron (Fig. 5, filled circles).
Figure 5.

Temporal relations between tic-related activity in the putamen and M1. Timing of the earliest tic-related activity in pairs of simultaneously recorded neurons from M1 and the putamen. The x- and y-axes are the timing of the earliest tic-related activity in the neurons recorded from M1 and the putamen in each pair, respectively. The timing is given as the offset (s) from tic-onset time. The dashed line is the equality line: equal offsets for neurons in M1 and the putamen. The area above the equality line includes pairs in which tic-related activity of the M1 neuron preceded the activity in the putamen, and the area below the line includes pairs in which M1 tic-related activity was later than the putamen. Circles and triangles indicate pairs in which the putamen neuron was a PAN or TAN, respectively. Filled and open icons indicate pairs in which the tic-related activity of the cortical neuron was before or after tic-onset time, respectively.
The TAN–M1 pairs revealed the opposite temporal pattern: for all nine TAN–M1 pairs, the tic-related activity of the TAN was later than the tic-related activation of the cortical neuron (Fig. 5, triangles). The average time difference between the timing of tic-related cortical and TAN activations (calculated as timeM1 − timeTAN) was −38.6 ± 4.9 ms.
Sixty-one pairs of simultaneously recorded M1 and GPe HFP neurons were used in this analysis. Overall, for 43 of 61 (70%) of the pairs, the tic-related neuronal activity in M1 was earlier than the tic-related activity in the GPe (Fig. 6A). However, this temporal pattern was dependent on the timing of the cortical activity. When the cortical activation was before tic-onset time, it almost always (39 of 40 pairs, 97.5%) preceded the GPe tic-related activity (Fig. 6A, filled circles). In contrast, when the cortical activation was later than tic-onset time, it was mostly (17 of 21 pairs, 81%) later than the GPe tic-related activity (Fig. 6A, open circles). The average time difference between the timing of tic-related cortical and GPe activities (calculated as timeM1 - timeGPe) was −35.5 ± 3 ms for pairs with pre-tic cortical activation, compared with 27.4 ± 9.1 ms for pairs with post-tic cortical activation (Student's t test, p < 0.001) (Fig. 6B).
Figure 6.
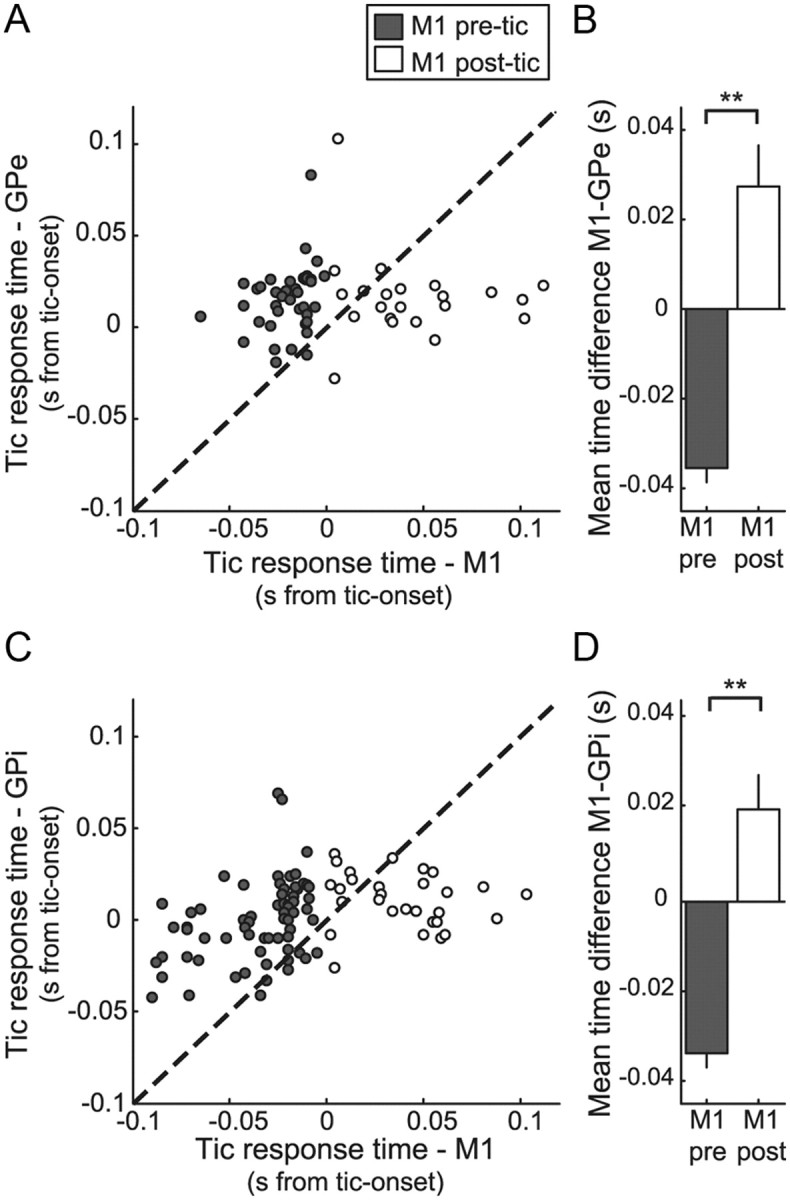
Temporal relations between tic-related activity in the pallidum and M1. A, C, Timing of the earliest tic-related activity in pairs of simultaneously recorded M1 and GPe (A) or GPi (C) neurons. B, D, Comparison of mean time differences between tic-related activity of cortical relative to GPe (B) or GPi (D) simultaneously recorded neurons, for pairs in which activation in the cortical neuron was before or after tic-onset time (filled and open bars, respectively). **p < 0.01.
Ninety-eight pairs of simultaneously recorded M1 and GPi neurons were used in this analysis and showed a similar temporal distribution to that of the GPe. In 59 of 67 (88%) of the GPi–M1 pairs in which the cortical activation preceded the tics, the cortex also preceded the GPi tic-related activity (Fig. 6C, filled circles). Notably, even for the few pairs in this group with early GPi tic-related activity (8 of 67 pairs, 12%), the GPi neurons preceded the cortex only by a few milliseconds (6.5 ± 1.4 ms). For the 22 of 31 M1–GPi pairs (71%) in which the cortical activation was later than tic-onset time, the cortex was also later than the GPi tic-related activity (Fig. 6C, open circles). The average difference between the timing of M1 and GPi tic-related activities (calculated as timeM1 − timeGPi) was −33.9 ± 3.1 ms for pairs with pre-tic cortical activation, compared with 20.5 ± 7.7 ms for pairs with post-tic cortical activation (Student's t test, p < 0.001) (Fig. 6D). There was no significant difference between the time differences of tic-related activity for GPe–M1 pairs compared with GPi–M1 pairs, regardless of the timing of the cortical activation.
Ninety-two pairs of tic-related high-frequency GPe and GPi neurons were used in this analysis. The tic-related activity for most of individual pallidal neurons comprising these pairs was later than the tic-onset time [37 of 42 (88%) GPe neurons, 34 of 41 (83%) GPi neurons]. The average time difference between the timing of tic-related GPe and GPi activities (calculated as timeGPe − timeGPi) was significantly larger than zero (mean time difference, 8 ± 3.4 ms; Student's t test, p < 0.05), which implies that, overall, the GPi tic-related activity tended to be earlier than the GPe (Fig. 7A). Although some GPe neurons responded to the tics before the GPi, an early GPi response was more common in our population of GPe–GPi pairs: the GPi response was earlier than the GPe in 60 of 92 (65%) of the pairs (χ2 goodness of fit test, χ2(1) = 8.5; p < 0.01) (Fig. 7B).
Figure 7.

Temporal relations between tic-related activity in the GPe and GPi. A, Timing of earliest tic-related activity in pairs of simultaneously recorded GPe and GPi neurons. B, Distribution of time differences between tic-related activities of GPe relative to GPi simultaneously recorded neurons. Filled and open icons indicate pairs in which the tic-related activity of the GPe neuron was before or after tic-related activity in the GPi neuron, respectively.
Discussion
In this study, we explored the spatial and temporal dynamics of tic-related neuronal activity along the CBG in the nonhuman primate model of motor tics. Phasic tic-related activity modulations were found in all recorded nuclei, with each area displaying unique spatial and temporal distributions of the tic-related signal. Tic-related activity was spatially confined in the ventromedial part of the putamen, but was widely distributed within the GPe and GPi. In the temporal domain, we found that while tic-related activity in the putamen PANs preceded M1 tic-related activity, the onset of tic-related activity in the GPe and GPi was later than the cortex.
Tic-related neuronal activity patterns
Tic-related PANs activity was generally similar to the characteristic movement-related bursts of MSNs observed in normal animals (Liles, 1985). However, MSNs in the normal primate are highly selective to different movement parameters such as direction, load, and velocity (Crutcher and DeLong, 1984b; Liles, 1985), whereas in our study, all tic-related PANs showed a similar response to the same brief stereotypic tic movements. This suggests that tics may be associated with altered specificity of the MSNs. Similar alteration of neuronal specificity appears in other CBG-related disorders such as Parkinson's disease and dystonia (Filion et al., 1988; Macia et al., 2002). The tic-related activity patterns observed in TANs were also similar to the response patterns of these neurons to preferred events in the normal primate (Kimura et al., 1984). TANs activity was previously shown to be related primarily to cues and outcomes of behaviors, making them a part of the learning and reward system (Kimura et al., 1984; Graybiel et al., 1994; Joshua et al., 2008). The TANs tic-related activity implies the involvement of learning mechanisms and suggests that some of the tic-related activity in the BG may serve to reinforce further tic expression.
MSNs from the putamen send inhibitory projections to both segments of the globus pallidus (Szabo, 1967). Thus, tic-related MSN excitation would be expected to induce phasic inhibitions in these structures. However, the pallidal tic-related activity was composed of both increases and decreases in firing rate, with excitation as the predominant tic response in the GPe and inhibition in the GPi (McCairn et al., 2009). Previous studies in the normal primate have reported that movement-related excitations are more common than inhibitions in both GPe and GPi (Mitchell et al., 1987; Mink and Thach, 1991b; Turner and Anderson, 1997). The shifted excitation–inhibitions balance in the BG output (GPi) during tics may imply an abnormal change in the flow of information through the BG. Future studies should explore tic-related activity in the subthalamic nucleus, which is the only direct source of excitatory input to the pallidum (Nambu et al., 2000), to uncover the source and the behavioral significance of this neurophysiological imbalance.
Spatial distribution of tic-related activity
Information flows through the CBG in multiple motor, limbic, and associative loops defined by the cortical origins of the BG input (Alexander et al., 1986; Haber et al., 2000). The motor territory encompasses the putamen and large posterior ventrolateral portions of the GPe and GPi (Smith and Parent, 1986; Hedreen and DeLong, 1991; Inase et al., 1996). The motor territory is further subdivided somatotopically to regions specifically related to movements either of the legs, arms, or face (Crutcher and DeLong, 1984a; DeLong et al., 1985; Flaherty and Graybiel, 1991).
We targeted our recordings to the motor territory of the CBG system, which may explain the relatively high prevalence of tic-related neurons. Within the putamen, we observed a discrepancy between the location of the bicuculline microinjections (dorsolateral putamen) and the location of neurons displaying phasic tic-related activity (ventromedial putamen). The localization of putamen tic-related activity may be attributed to the fact that tics always appeared in orofacial muscles, which are somatotopically represented at its ventromedial parts (DeLong, 1971; Crutcher and DeLong, 1984a; Flaherty and Graybiel, 1991). However, the lack of phasic tic-related activations in neurons recorded closer to the bicuculline injection sites does not rule out the possibility that bicuculline induced other changes in the activity of these neurons. Tonic changes may be hard to reliably detect in behaving animals since MSNs are only briefly active in response to a preferred motor pattern and mostly quiescent the rest of the time (Crutcher and DeLong, 1984b; Liles, 1985). However, some studies suggest that bicuculline microinjections may exert changes on the tonic activity and excitability of striatal neurons (Nisenbaum and Berger, 1992; Worbe et al., 2009). This implies that the focal striatal tic-related signal may actually appear in the background of more global changes in the activity of the striatal network (Tepper et al., 2004; Kalanithi et al., 2005; Aliane et al., 2011). It also suggests that the tic-inducing process is more complex than a simple local striatal disinhibition leading to a motor tic (Mink, 2001), as the neurons affected directly by the bicuculline were not the neurons displaying tic-related disinhibition. Rather, many of the affected neurons are located further from the injection site, potentially reflecting a form of intrastriatal network-level activation. The form and function of the internal striatal inhibitory network propagating this activity are still a matter of ongoing research (Tepper et al., 2004; Wilson, 2007; Humphries et al., 2010).
In contrast to the putamen, neurons whose activity was related to the orofacial motor tics were diffusely located within GPe and GPi, including areas that were previously shown to encode movements of the limbs (DeLong et al., 1985; Mink and Thach, 1991a; Turner and Anderson, 1997). However, pallidal tic-related activity showed an anterior to posterior gradient that reflects the segregation to functional territories. The posterior parts of the GPe and GPi, in which we found a high prevalence of tic-related neurons, are part of the motor loop and receive massive innervations from the motor putamen. The more anterior pallidal sections, in which tic-related activity was less common, are preferentially innervated by projections from associative areas (François et al., 1994, 2004). The somatotopically diffused organization of pallidal tic-related activity suggests that the pallidal signal is not directly related to activation or selection of the particular muscle in which the tics appear. Rather, studies on pallidal responses to normal movements indicate they may serve two other roles: either kinematic modulation of performed movements and/or facilitation of learning and shaping of new behaviors (for review, see Turner and Desmurget, 2010). Thus, the role of the pallidal tic-related signal may be interpreted as either an abnormal gain signal of the movement (the tic) or a maladaptive learning mechanism that further augments the expression of these aberrant movements. Recent reports of amelioration of tics in patients suffering from Tourette syndrome following implementation of deep brain stimulating electrodes in the GPi (Diederich et al., 2005; Houeto et al., 2005) further point to the importance of the pallidal signal in the pathological tic-inducing mechanism.
Temporal distribution of tic-related activity
The BG's reciprocal connections with the cortex are sometimes depicted as performing an action selection process by which they instruct the cortex which action to initiate while inhibiting competing actions (Mink, 1996; Redgrave et al., 1999). One implication of this theory is that movement-initiating BG signals should occur well before the activation of the muscles related to the initiated movement. While some studies have previously found evidence for movement-related BG activity several hundred milliseconds before movement onset and even before the earliest EMG activity (Georgopoulos et al., 1983; Jaeger et al., 1995), the majority report that BG premovement activity is scarce and too late to be consistent with movement selection or initiation (Anderson and Horak, 1985; Mink and Thach, 1991b; Turner and Anderson, 1997).
In the current study, our ability to accurately measure movement onset time was sometimes confounded by the unpredictable location of the tics. Tics often appeared in several closely located muscles (for example, the lower and the upper lips), or sometimes even distant areas (such as the upper lip and the shoulder). If by chance the EMG wires were not placed at the muscle initiating the tics, but rather on a muscle that was sequentially activated, our EMG detection signal was temporally shifted. We overcame this limitation by analyzing only the difference in timing of tic-related activations between different areas within the CBG loop. M1 was taken as the temporal reference point, since pre-tic M1 activation is likely to be directly related to movement initiation. This analysis revealed no evidence for tic-related activity in the BG motor output structure, the GPi, which preceded the M1 activation and might thus serve as a movement initiation signal. We found evidence for early tic-related activation of PANs in the putamen, but these findings might be confounded by the relatively small number of recorded neurons. Given that the striatum is classically considered to have no direct output projections to the thalamus or cortex (Szabo, 1967), and the GPi is the main target of the motor territories of the putamen (Parent et al., 1984), the nature and functional significance of early striatal activity is a matter for further study.
Conclusions
The primate bicuculline-induced model of motor tics establishes a direct link between focal disruption of GABAergic transmission in the striatum and the appearance of de novo motor tics, and is a valuable tool for studying the pathological neural mechanisms underlying tics. The current study suggests that the main BG output signal does not directly initiate the tics, but rather plays a key role in the regulation or maintenance of tics. Understanding the role of the CBG in motor tics has the potential to uncover novel intervention sites for the management of refractory tic disorders.
Notes
Supplemental material for this article is available at http://neurint.ls.biu.ac.il/software/Tics2011. This material has not been peer reviewed.
Footnotes
This work was supported by Israel Science Foundation Grant 327/09 and a Tourette Syndrome Association grant. We thank Dr. K.W. McCairn for help with equipment and recordings, and Dr. M. Dror and P. Malmud for help with the animals.
References
- Abelson JF, Kwan KY, O'Roak BJ, Baek DY, Stillman AA, Morgan TM, Mathews CA, Pauls DL, Rasin MR, Gunel M, Davis NR, Ercan-Sencicek AG, Guez DH, Spertus JA, Leckman JF, Dure LS, 4th, Kurlan R, Singer HS, Gilbert DL, Farhi A, et al. Sequence variants in SLITRK1 are associated with Tourette's syndrome. Science. 2005;310:317–320. doi: 10.1126/science.1116502. [DOI] [PubMed] [Google Scholar]
- Alexander GE, Crutcher MD. Functional architecture of basal ganglia circuits: neural substrates of parallel processing. Trends Neurosci. 1990;13:266–271. doi: 10.1016/0166-2236(90)90107-l. [DOI] [PubMed] [Google Scholar]
- Alexander GE, DeLong MR. Microstimulation of the primate neostriatum. II. Somatotopic organization of striatal microexcitable zones and their relation to neuronal response properties. J Neurophysiol. 1985;53:1417–1430. doi: 10.1152/jn.1985.53.6.1417. [DOI] [PubMed] [Google Scholar]
- Alexander GE, DeLong MR, Strick PL. Parallel organization of functionally segregated circuits linking basal ganglia and cortex. Annu Rev Neurosci. 1986;9:357–381. doi: 10.1146/annurev.ne.09.030186.002041. [DOI] [PubMed] [Google Scholar]
- Aliane V, Pérez S, Bohren Y, Deniau JM, Kemel ML. Key role of striatal cholinergic interneurons in processes leading to arrest of motor stereotypies. Brain. 2011;134:110–118. doi: 10.1093/brain/awq285. [DOI] [PubMed] [Google Scholar]
- Anderson ME, Horak FB. Influence of the globus pallidus on arm movements in monkeys. III. Timing of movement-related information. J Neurophysiol. 1985;54:433–448. doi: 10.1152/jn.1985.54.2.433. [DOI] [PubMed] [Google Scholar]
- Baym CL, Corbett BA, Wright SB, Bunge SA. Neural correlates of tic severity and cognitive control in children with Tourette syndrome. Brain. 2008;131:165–179. doi: 10.1093/brain/awm278. [DOI] [PubMed] [Google Scholar]
- Bolam JP, Wainer BH, Smith AD. Characterization of cholinergic neurons in the rat neostriatum: a combination of choline acetyltransferase immunocytochemistry, Golgi-impregnation and electron microscopy. Neuroscience. 1984;12:711–718. doi: 10.1016/0306-4522(84)90165-9. [DOI] [PubMed] [Google Scholar]
- Caviness JN, Brown P. Myoclonus: current concepts and recent advances. Lancet Neurol. 2004;3:598–607. doi: 10.1016/S1474-4422(04)00880-4. [DOI] [PubMed] [Google Scholar]
- Crossman AR, Mitchell IJ, Sambrook MA, Jackson A. Chorea and myoclonus in the monkey induced by gamma-aminobutyric acid antagonism in the lentiform complex: the site of drug action and a hypothesis for the neural mechanisms of chorea. Brain. 1988;111:1211–1233. doi: 10.1093/brain/111.5.1211. [DOI] [PubMed] [Google Scholar]
- Crutcher MD, DeLong MR. Single cell studies of the primate putamen. I. Functional organization. Exp Brain Res. 1984a;53:233–243. doi: 10.1007/BF00238153. [DOI] [PubMed] [Google Scholar]
- Crutcher MD, DeLong MR. Single cell studies of the primate putamen. II. Relations to direction of movement and pattern of muscular activity. Exp Brain Res. 1984b;53:244–258. doi: 10.1007/BF00238154. [DOI] [PubMed] [Google Scholar]
- de la Tourette G. Étude sur une affection nerveuse caractérisée par de l'incoordination motrice accompagnée d'écholalie et de coprolalie. Archives de Neurologie. 1885;9:19–42. [Google Scholar]
- DeLong MR. Activity of pallidal neurons during movement. J Neurophysiol. 1971;34:414–427. doi: 10.1152/jn.1971.34.3.414. [DOI] [PubMed] [Google Scholar]
- DeLong MR, Crutcher MD, Georgopoulos AP. Primate globus pallidus and subthalamic nucleus: functional organization. J Neurophysiol. 1985;53:530–543. doi: 10.1152/jn.1985.53.2.530. [DOI] [PubMed] [Google Scholar]
- Diederich NJ, Kalteis K, Stamenkovic M, Pieri V, Alesch F. Efficient internal pallidal stimulation in Gilles de la Tourette syndrome: a case report. Mov Disord. 2005;20:1496–1499. doi: 10.1002/mds.20551. [DOI] [PubMed] [Google Scholar]
- Filion M, Tremblay L, Bédard PJ. Abnormal influences of passive limb movement on the activity of globus pallidus neurons in parkinsonian monkeys. Brain Res. 1988;444:165–176. doi: 10.1016/0006-8993(88)90924-9. [DOI] [PubMed] [Google Scholar]
- Flaherty AW, Graybiel AM. Corticostriatal transformations in the primate somatosensory system: projections from physiologically mapped body-part representations. J Neurophysiol. 1991;66:1249–1263. doi: 10.1152/jn.1991.66.4.1249. [DOI] [PubMed] [Google Scholar]
- François C, Yelnik J, Percheron G, Fénelon G. Topographic distribution of the axonal endings from the sensorimotor and associative striatum in the macaque pallidum and substantia nigra. Exp Brain Res. 1994;102:305–318. doi: 10.1007/BF00227517. [DOI] [PubMed] [Google Scholar]
- François C, Grabli D, McCairn K, Jan C, Karachi C, Hirsch EC, Féger J, Tremblay L. Behavioural disorders induced by external globus pallidus dysfunction in primates. II. Anatomical study. Brain. 2004;127:2055–2070. doi: 10.1093/brain/awh239. [DOI] [PubMed] [Google Scholar]
- Georgopoulos AP, DeLong MR, Crutcher MD. Relations between parameters of step-tracking movements and single cell discharge in the globus pallidus and subthalamic nucleus of the behaving monkey. J Neurosci. 1983;3:1586–1598. doi: 10.1523/JNEUROSCI.03-08-01586.1983. [DOI] [PMC free article] [PubMed] [Google Scholar]
- Graveland GA, Williams RS, DiFiglia M. A Golgi study of the human neostriatum: neurons and afferent fibers. J Comp Neurol. 1985;234:317–333. doi: 10.1002/cne.902340304. [DOI] [PubMed] [Google Scholar]
- Graybiel AM, Aosaki T, Flaherty AW, Kimura M. The basal ganglia and adaptive motor control. Science. 1994;265:1826–1831. doi: 10.1126/science.8091209. [DOI] [PubMed] [Google Scholar]
- Haber SN, Fudge JL, McFarland NR. Striatonigrostriatal pathways in primates form an ascending spiral from the shell to the dorsolateral striatum. J Neurosci. 2000;20:2369–2382. doi: 10.1523/JNEUROSCI.20-06-02369.2000. [DOI] [PMC free article] [PubMed] [Google Scholar]
- Hedreen JC, DeLong MR. Organization of striatopallidal, striatonigral, and nigrostriatal projections in the macaque. J Comp Neurol. 1991;304:569–595. doi: 10.1002/cne.903040406. [DOI] [PubMed] [Google Scholar]
- Hoover JE, Strick PL. The organization of cerebellar and basal ganglia outputs to primary motor cortex as revealed by retrograde transneuronal transport of herpes simplex virus type 1. J Neurosci. 1999;19:1446–1463. doi: 10.1523/JNEUROSCI.19-04-01446.1999. [DOI] [PMC free article] [PubMed] [Google Scholar]
- Houeto JL, Karachi C, Mallet L, Pillon B, Yelnik J, Mesnage V, Welter ML, Navarro S, Pelissolo A, Damier P, Pidoux B, Dormont D, Cornu P, Agid Y. Tourette's syndrome and deep brain stimulation. J Neurol Neurosurg Psychiatry. 2005;76:992–995. doi: 10.1136/jnnp.2004.043273. [DOI] [PMC free article] [PubMed] [Google Scholar]
- Humphries MD, Wood R, Gurney K. Reconstructing the three-dimensional GABAergic microcircuit of the striatum. PLoS Comput Biol. 2010;6:e1001011. doi: 10.1371/journal.pcbi.1001011. [DOI] [PMC free article] [PubMed] [Google Scholar]
- Inase M, Sakai ST, Tanji J. Overlapping corticostriatal projections from the supplementary motor area and the primary motor cortex in the macaque monkey: an anterograde double labeling study. J Comp Neurol. 1996;373:283–296. doi: 10.1002/(SICI)1096-9861(19960916)373:2<283::AID-CNE10>3.0.CO;2-M. [DOI] [PubMed] [Google Scholar]
- Inokawa H, Yamada H, Matsumoto N, Muranishi M, Kimura M. Juxtacellular labeling of tonically active neurons and phasically active neurons in the rat striatum. Neuroscience. 2010;168:395–404. doi: 10.1016/j.neuroscience.2010.03.062. [DOI] [PubMed] [Google Scholar]
- Jaeger D, Gilman S, Aldridge JW. Neuronal-activity in the striatum and pallidum of primates related to the execution of externally cued reaching movements. Brain Res. 1995;694:111–127. doi: 10.1016/0006-8993(95)00780-t. [DOI] [PubMed] [Google Scholar]
- Joshua M, Adler A, Mitelman R, Vaadia E, Bergman H. Midbrain dopaminergic neurons and striatal cholinergic interneurons encode the difference between reward and aversive events at different epochs of probabilistic classical conditioning trials. J Neurosci. 2008;28:11673–11684. doi: 10.1523/JNEUROSCI.3839-08.2008. [DOI] [PMC free article] [PubMed] [Google Scholar]
- Kalanithi PS, Zheng W, Kataoka Y, DiFiglia M, Grantz H, Saper CB, Schwartz ML, Leckman JF, Vaccarino FM. Altered parvalbumin-positive neuron distribution in basal ganglia of individuals with Tourette syndrome. Proc Natl Acad Sci U S A. 2005;102:13307–13312. doi: 10.1073/pnas.0502624102. [DOI] [PMC free article] [PubMed] [Google Scholar]
- Kemp JM, Powell TP. The synaptic organization of the caudate nucleus. Philos Trans R Soc Lond B Biol Sci. 1971;262:403–412. doi: 10.1098/rstb.1971.0103. [DOI] [PubMed] [Google Scholar]
- Kimura M, Rajkowski J, Evarts E. Tonically discharging putamen neurons exhibit set-dependent responses. Proc Natl Acad Sci U S A. 1984;81:4998–5001. doi: 10.1073/pnas.81.15.4998. [DOI] [PMC free article] [PubMed] [Google Scholar]
- Liles SL. Activity of neurons in putamen during active and passive movements of wrist. J Neurophysiol. 1985;53:217–236. doi: 10.1152/jn.1985.53.1.217. [DOI] [PubMed] [Google Scholar]
- Macia F, Escola L, Guehl D, Michelet T, Bioulac B, Burbaud P. Neuronal activity in the monkey motor thalamus during bicuculline-induced dystonia. Eur J Neurosci. 2002;15:1353–1362. doi: 10.1046/j.1460-9568.2002.01964.x. [DOI] [PubMed] [Google Scholar]
- McCairn KW, Bronfeld M, Belelovsky K, Bar-Gad I. The neurophysiological correlates of motor tics following focal striatal disinhibition. Brain. 2009;132:2125–2138. doi: 10.1093/brain/awp142. [DOI] [PubMed] [Google Scholar]
- Mink JW. The basal ganglia: focused selection and inhibition of competing motor programs. Prog Neurobiol. 1996;50:381–425. doi: 10.1016/s0301-0082(96)00042-1. [DOI] [PubMed] [Google Scholar]
- Mink JW. Basal ganglia dysfunction in Tourette's syndrome: a new hypothesis. Pediatr Neurol. 2001;25:190–198. doi: 10.1016/s0887-8994(01)00262-4. [DOI] [PubMed] [Google Scholar]
- Mink JW, Thach WT. Basal ganglia motor control. I. Nonexclusive relation of pallidal discharge to five movement modes. J Neurophysiol. 1991a;65:273–300. doi: 10.1152/jn.1991.65.2.273. [DOI] [PubMed] [Google Scholar]
- Mink JW, Thach WT. Basal ganglia motor control. II. Late pallidal timing relative to movement onset and inconsistent pallidal coding of movement parameters. J Neurophysiol. 1991b;65:301–329. doi: 10.1152/jn.1991.65.2.301. [DOI] [PubMed] [Google Scholar]
- Mitchell SJ, Richardson RT, Baker FH, DeLong MR. The primate globus pallidus: neuronal activity related to direction of movement. Exp Brain Res. 1987;68:491–505. doi: 10.1007/BF00249793. [DOI] [PubMed] [Google Scholar]
- Nambu A, Tokuno H, Hamada I, Kita H, Imanishi M, Akazawa T, Ikeuchi Y, Hasegawa N. Excitatory cortical inputs to pallidal neurons via the subthalamic nucleus in the monkey. J Neurophysiol. 2000;84:289–300. doi: 10.1152/jn.2000.84.1.289. [DOI] [PubMed] [Google Scholar]
- Nisenbaum ES, Berger TW. Functionally distinct subpopulations of striatal neurons are differentially regulated by GABAergic and dopaminergic inputs. I. In vivo analysis. Neuroscience. 1992;48:561–578. doi: 10.1016/0306-4522(92)90402-n. [DOI] [PubMed] [Google Scholar]
- Parent A. Extrinsic connections of the basal ganglia. Trends Neurosci. 1990;13:254–258. doi: 10.1016/0166-2236(90)90105-j. [DOI] [PubMed] [Google Scholar]
- Parent A, Bouchard C, Smith Y. The striatopallidal and striatonigral projections: two distinct fiber systems in primate. Brain Res. 1984;303:385–390. doi: 10.1016/0006-8993(84)91224-1. [DOI] [PubMed] [Google Scholar]
- Redgrave P, Prescott TJ, Gurney K. The basal ganglia: a vertebrate solution to the selection problem? Neuroscience. 1999;89:1009–1023. doi: 10.1016/s0306-4522(98)00319-4. [DOI] [PubMed] [Google Scholar]
- Singer HS, Minzer K. Neurobiology of Tourette's syndrome: concepts of neuroanatomic localization and neurochemical abnormalities. Brain Dev. 2003;25(Suppl 1):S70–S84. doi: 10.1016/s0387-7604(03)90012-x. [DOI] [PubMed] [Google Scholar]
- Smith Y, Parent A. Differential connections of caudate nucleus and putamen in the squirrel monkey (Saimiri sciureus) Neuroscience. 1986;18:347–371. doi: 10.1016/0306-4522(86)90159-4. [DOI] [PubMed] [Google Scholar]
- Szabo J. The efferent projections of the putamen in the monkey. Exp Neurol. 1967;19:463–476. doi: 10.1016/0014-4886(67)90166-5. [DOI] [PubMed] [Google Scholar]
- Szabo J, Cowan WM. A stereotaxic atlas of the brain of the cynomolgus monkey (Macaca fascicularis) J Comp Neurol. 1984;222:265–300. doi: 10.1002/cne.902220208. [DOI] [PubMed] [Google Scholar]
- Tarsy D, Pycock CJ, Meldrum BS, Marsden CD. Focal contralateral myoclonus produced by inhibition of GABA action in the caudate nucleus of rats. Brain. 1978;101:143–162. doi: 10.1093/brain/101.1.143. [DOI] [PubMed] [Google Scholar]
- Tepper JM, Koós T, Wilson CJ. GABAergic microcircuits in the neostriatum. Trends Neurosci. 2004;27:662–669. doi: 10.1016/j.tins.2004.08.007. [DOI] [PubMed] [Google Scholar]
- Turner RS, Anderson ME. Pallidal discharge related to the kinematics of reaching movements in two dimensions. J Neurophysiol. 1997;77:1051–1074. doi: 10.1152/jn.1997.77.3.1051. [DOI] [PubMed] [Google Scholar]
- Turner RS, Desmurget M. Basal ganglia contributions to motor control: a vigorous tutor. Curr Opin Neurobiol. 2010;20:704–716. doi: 10.1016/j.conb.2010.08.022. [DOI] [PMC free article] [PubMed] [Google Scholar]
- Wilson CJ. GABAergic inhibition in the neostriatum. In: Tepper JM, editor. Progress in brain research GABA and the basal ganglia: from molecules to systems. New York: Elsevier; 2007. pp. 91–110. [DOI] [PubMed] [Google Scholar]
- Wilson CJ, Groves PM. Spontaneous firing patterns of identified spiny neurons in the rat neostriatum. Brain Res. 1981;220:67–80. doi: 10.1016/0006-8993(81)90211-0. [DOI] [PubMed] [Google Scholar]
- Wilson CJ, Chang HT, Kitai ST. Origins of post synaptic potentials evoked in spiny neostriatal projection neurons by thalamic stimulation in the rat. Exp Brain Res. 1983;51:217–226. doi: 10.1007/BF00237197. [DOI] [PubMed] [Google Scholar]
- Wilson CJ, Chang HT, Kitai ST. Firing patterns and synaptic potentials of identified giant aspiny interneurons in the rat neostriatum. J Neurosci. 1990;10:508–519. doi: 10.1523/JNEUROSCI.10-02-00508.1990. [DOI] [PMC free article] [PubMed] [Google Scholar]
- Worbe Y, Baup N, Grabli D, Chaigneau M, Mounayar S, McCairn K, Féger J, Tremblay L. Behavioral and movement disorders induced by local inhibitory dysfunction in primate striatum. Cereb Cortex. 2009;19:1844–1856. doi: 10.1093/cercor/bhn214. [DOI] [PubMed] [Google Scholar]