

Abstract
The visuomotor medial posterior parietal area V6A has been recently subdivided into two cytoarchitectonic sectors called V6Ad and V6Av (Luppino et al., 2005). The aim of the present study was to recognize whether these two cortical sectors show different functional profiles. Fourteen hemispheres from eight animals (Macaca fascicularis) were included in this study, for a total of 3828 extracellularly recorded neurons assigned to areas V6Ad or V6Av on cytoarchitectural basis. The sensitivity of recorded neurons to sensory- and motor-related activities was checked with a series of functional tests performed on behaving animals. We found that cells sensitive to visual stimuli were more represented in V6Av and cells sensitive to somatosensory stimuli were more represented in V6Ad. Visual cells directly encoding spatial locations (real-position cells) were present only in V6Av. Cells encoding basic visual and somatic properties as well as different aspects of reaching and grasping activities were present in both sectors of V6A, although with different incidence. Cells that had reach-related activity enhanced by visual feedback and grasping neurons activated by whole-hand prehension were more concentrated in V6Av. Conversely, reaching neurons inhibited by visual feedback and grasping neurons activated by precision grip were more represented in V6Ad. Although V6Av and V6Ad show partly different functional profiles, our data support the idea that V6A is a single functional area involved in the control of reach-to-grasp movements, with the dorsal sector (V6Ad) more involved in the somatomotor control and the ventral sector (V6Av) in the visual control of reaching and grasping actions.
Introduction
Many studies in the last decades have shown that the caudal part of the macaque superior parietal lobule (SPL) includes a number of different areas, some of them described on the basis of their architectural pattern, others on the basis of anatomical connectivity or the functional properties of their neurons. Recent studies performed in awake macaque monkeys have reported that the cortex of the caudal-most part of SPL, i.e., the anterior bank and fundus of the parieto-occipital sulcus, can be functionally divided in two areas: V6 ventrally and V6A dorsally (Galletti et al., 1996, 1999a,b, 2005). Area V6 is a classic extrastriate, retinotopically organized, visual area (Galletti et al., 1999b) that shows a uniform cytoarchitectural and hodological profile (Galletti et al., 2001; Luppino et al., 2005). In contrast, V6A is a parietal visuomotor area containing visual and somatic neurons as well as neurons related to the execution of arm and eye movements (Galletti et al., 1995, 1996, 1997, 1999a; Fattori et al., 2001; Kutz et al., 2003; for review, see Galletti et al., 2003). According to a recent study (Luppino et al., 2005), area V6A can be subdivided in two sectors: one, ventrally, called V6Av; and another, dorsally, called V6Ad. These two cortical sectors show different cytoarchitectural patterns, which are more similar to the occipital pattern in V6Av and to the parietal pattern in V6Ad. The anatomical connectivity of these two sectors mirrors their architectural organization in that V6Av is strongly connected with the occipital extrastriate visual areas, including V6, whereas V6Ad shows strong connections with areas of the parietal and frontal cortex (Gamberini et al., 2009; Passarelli et al., 2011).
The aim of this study was to check whether V6Av and V6Ad show different functional properties in line with architectural and hodological data, and therefore whether they could play different functional roles. To this aim, we analyzed the functional properties of neurons located in the anterior bank of the parieto-occipital sulcus and compared the properties of neurons located in V6Av with those of neurons located in V6Ad. We studied both sensory (visual and somatic) and motor (reaching and grasping) behaviors of ∼4000 neurons collected from eight animals over several years. The results show that V6Av and V6Ad share several basic functional properties, involving both of them in the control of reach-to-grasp actions. The V6Av, however, appears to be more involved in the visual control of the motor act and V6Ad in the somatic control of it.
A preliminary account of the present results has been presented in abstract form (Gamberini et al., 2010).
Materials and Methods
Fourteen hemispheres from eight macaque monkeys (Macaca fascicularis, males, 3–7 kg) were used in this study (Table 1). Experimental protocols were approved by the Bioethical Committee of the University of Bologna and complied with the National and European laws on the care and use of laboratory animals in agreement with the European Communities Council Directive of 24th November 1986 (86/609/EEC), recently revised by the European Parliament and by the Council with the Directive of the 22th September 2010 (2010/63/EU).
Table 1.
General information on cases included in the study
| Case | Cutting plane | Recording site | Number of pen | Number of cells in V6A | Cytoarchitecture/myeloarchitecture |
|---|---|---|---|---|---|
| M14L | Sagittal | V6A | 22 | 146 | Yes/no |
| M15R | Sagittal | V6A | 21 | 153 | Yes/no |
| M15L | Sagittal | V6A | 34 | 555 | Yes/no |
| M16R | Sagittal | V6A/V6 | 23 | 231 | Yes/no |
| M16L | Sagittal | V6A/V6 | 6 | 78 | Yes/no |
| M17R | Sagittal | V6A/V6 | 13 | 123 | Yes/no |
| M17L | Sagittal | PEc/V6A/V6 | 10 | 91 | Yes/no |
| M18L | Sagittal | PEc/V6A/V6 | 10 | 112 | Yes/yes |
| M19R | Sagittal | PEc/V6A/V6 | 26 | 285 | Yes/no |
| M19L | Coronal | PEc/V6A/V6 | 21 | 246 | Yes/no |
| M20R | Sagittal | V6A/V6 | 62 | 677 | Yes/yes |
| M20L | Sagittal | V6A/V6 | 33 | 427 | Yes/yes |
| M21R | Sagittal | V6A/V6 | 89 | 429 | Yes/yes |
| M21L | Sagittal | V6A/V6 | 53 | 275 | Yes/yes |
| Total | 281 | 3828 |
Experimental procedures
The monkeys sat in a primate chair and were trained to perform a visual fixation task, a reaching task, and/or a grasping task under controlled conditions. They were also trained to interact with experimenters and to quietly accept somatosensory stimulations.
Training took several months. After training completion, the head-restraint system and the recording chamber were surgically implanted in asepsis and under general anesthesia (sodium thiopental, 8 mg/kg/h, i.v.) following the procedures reported in Galletti et al. (1995). Adequate measures were taken to minimize pain or discomfort. A full program of postoperative analgesia (ketorolac trometazyn, 1 mg/kg, i.m., immediately after surgery, and 1.6 mg/kg, i.m., on the following days) and antibiotic care [Ritardomicina (benzatinic benzylpenicillin plus dihydrostreptomycin plus streptomycin), 1–1.5 ml/10 kg every 5–6 d] followed the surgery.
The recording chamber, positioned on the midsagittal plane and centered 13–15 mm posterior to the interaural line, provided access to the cortex hidden in the parieto-occipital sulcus of both hemispheres. The microelectrode entered the cortex through the occipital lobe with an angle between 26° and 45° with respect to the stereotaxic vertical, and reached the anterior bank and fundus of the parieto-occipital sulcus in the depth.
Single-cell activity was extracellularly recorded using either home-made glass-coated Elgiloy microelectrodes (Suzuki and Azuma, 1976) with a tip impedance of 0.8–2 MΩ at 1 kHz, or type ESI2ec microelectrodes (Thomas Recording) with a tip impedance of 1–2 MΩ mounted on a five-channel multielectrode recording minimatrix (Thomas Recording). Signals from the electrode were amplified (gain, 10,000) and filtered (bandpass between 0.5 and 5 kHz). Action potentials were isolated with a dual time–amplitude window discriminator (DDIS-1; Bak Electronics) or with a waveform discriminator (Multi Spike Detector; Alpha Omega Engineering). Spikes were sampled at 1 kHz in six animals and at 100 kHz in two animals; eye position was simultaneously recorded, using an infrared oculometer (Dr. D. Bouis, Karlsruhe, Germany), at 100 Hz in six animals and at 500 Hz in the other two. Behavioral events, like button press or release, were recorded with a resolution of 1 ms.
At the end of the electrophysiological recordings, each animal was anesthetized with ketamine hydrochloride (15 mg/kg, i.m.) followed by an intravenous lethal injection of sodium thiopental. They were perfused through the left cardiac ventricle with the following solutions: 0.9% sodium chloride, 3.5–4% paraformaldehyde in 0.1 m phosphate buffer, pH 7.4, and 5% glycerol in the same buffer. The brains were then removed from the skull, photographed, and placed in 10% buffered glycerol for 3 d and in 20% glycerol for 4 d. Finally, they were cut on a freezing microtome at 60 μm in parasagittal plane, except for one hemisphere that was cut in coronal plane (Table 1). In all cases, each second section of a series of five was stained with the Nissl method (thionin, 0.1% in 0.1 m acetate buffer, pH 3.7) for the cytoarchitectonic analysis, and in three cases the fourth section was stained for myelin (Gallyas, 1979).
Procedures to reconstruct microelectrode penetrations and to assign neurons recorded in the anterior bank of the parieto-occipital sulcus to areas V6, V6A, and caudal PE (PEc) were as those previously described by our group (Galletti et al., 1996, 1999a,b; Breveglieri et al., 2006). Briefly, electrode tracks and the approximate location of each recording site were reconstructed on histological sections of the brain on the basis of marking lesions and several other cues, such as the coordinates of penetrations within recording chamber, the kind of cortical areas passed through before reaching the region of interest, the depths of passage points between gray and white matter, and the distance of recording site from the surface of the hemisphere. Straight and sturdy electrodes were used to minimize electrode bending during penetrations. More details on electrode track reconstructions and cell assignments were reported previously (Galletti et al., 1996).
In the present work, all neurons originally assigned to area V6A were reassigned to either V6Av or V6Ad on the basis of their location in one of the two cytoarchitectonic sectors of V6A following the criteria defined by Luppino and coworkers (2005). Because the architectonic features do not change abruptly from one area to another, but transition is typically casual, usually in the range of <1 mm, the cytoarchitectural border V6Av/V6Ad has been indicated at the center of that transition region. Consequently, the assignment of cells to V6Ad and V6Av had a margin of error of ∼500 μm. The location of each recorded cell and the cytoarchitectonic borders of V6Av and V6Ad were reported on two-dimensional maps of the cortex of the medial parieto-occipital region, similarly to our previous report (Galletti et al., 1999a) (Fig. 1). The maps of left hemispheres were flipped so that all the data were represented as right hemispheres. By superimposing the maps of the two hemispheres we obtained a single map for each animal. We used as reference marker the line where the dorsal exposed surface of the caudal part of SPL bends into the medial surface of the hemisphere, the anterior bank of the parieto-occipital sulcus, and the medial wall of the intraparietal sulcus. We also used the line where the anterior bank of the parieto-occipital sulcus bends into the medial surface of the hemisphere.
Figure 1.
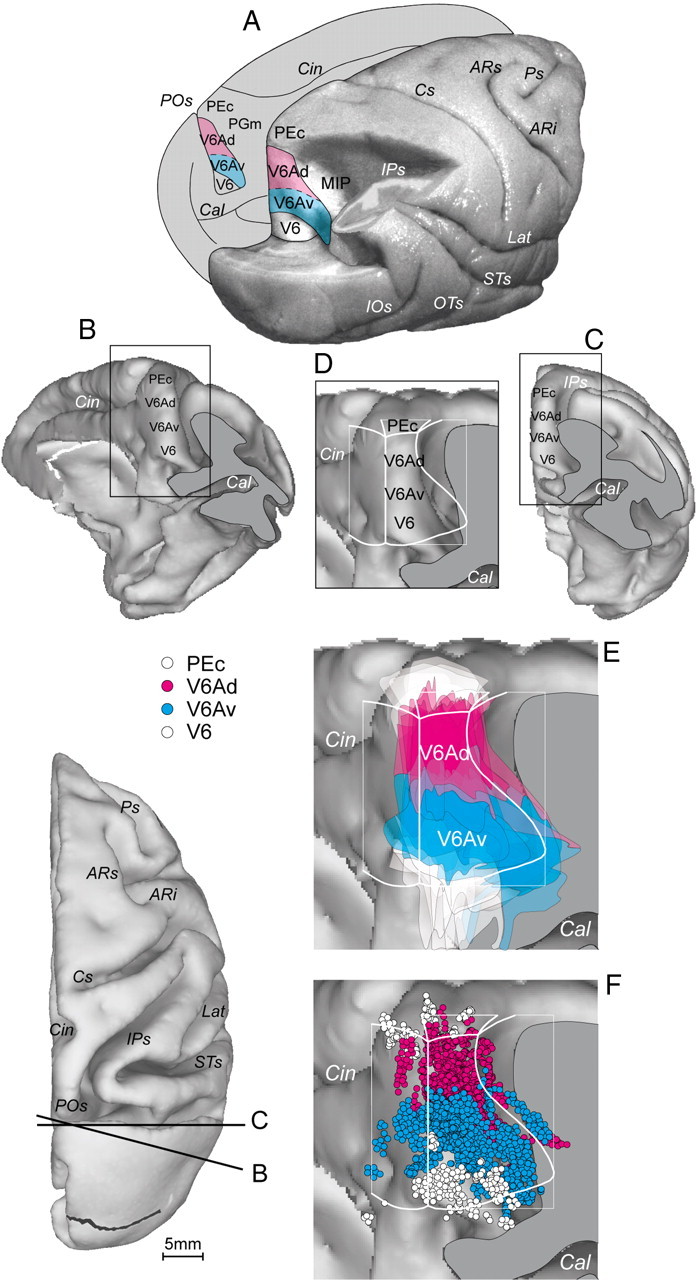
Recording site. A, Posterolateral view of a partially dissected macaque brain (modified from Galletti et al., 1996). The inferior parietal lobule of the right hemisphere has been cut away at the level of the fundus of the intraparietal sulcus to show the cortex of the medial bank of this sulcus. The occipital lobe of the same hemisphere has been cut away at the level of the fundus of the parieto-occipital and lunate sulci to show the cortex of the anterior bank of the parieto-occipital sulcus. The medial surface of the left hemisphere is drawn to show the location on it of V6Ad and V6Av. V6Ad is colored in pink and V6Av in blue. B–D, Posteromedial (B) and posterior (C) views of the surface-based 3D reconstructions of the ATLAS brain with the posterior part of the occipital lobe cut away to visualize the entire extent of the anterior bank of parieto-occipital sulcus. The levels of the cut are shown on the bottom left. D, Anterior bank of the parieto-occipital sulcus and, superimposed, the flattened map of the part of the SPL. E, F, As in D, with the boundaries and extents of the cytoarchitectonically defined area V6Ad and V6Av (E), and the locations of cells recorded in areas PEc, V6Ad, V6Av, and V6 (F). POs, Parieto-occipital sulcus; Cal, calcarine sulcus; Cin, cingulate sulcus; IPs, intraparietal sulcus; IOs, inferior-occipital sulcus; OTs, occipitotemporal sulcus; STs, superior temporal sulcus; Lat, lateral sulcus; Cs, central sulcus; ARs, superior arcuate sulcus; ARi, inferior arcuate sulcus; Ps, principal sulcus.
An example of this process is shown in Figure 2. The recognition, on each brain section, of the cytoarchitectural borders of the areas present in the anterior bank of the parieto-occipital sulcus, and the reconstruction on the same sections of single microelectrode penetrations (Fig. 2A–F), allowed us to assign recorded cells to one of the areas present in the caudal pole of SPL. The lower part of Figure 2 shows the flattened maps of the caudal SPL of two hemispheres of one case, together with the locations of cells recorded in different areas (shown with different colors). In the bottom, middle part of Figure 2, the maps of the two hemispheres have been superimposed and the left hemisphere flipped to obtain the case map that also contains the averaged areal borders. Note that, because of the averaging process of border position, single cells assigned to an area in one hemisphere could be located a bit outside the limits of this area in the case map.
Figure 2.
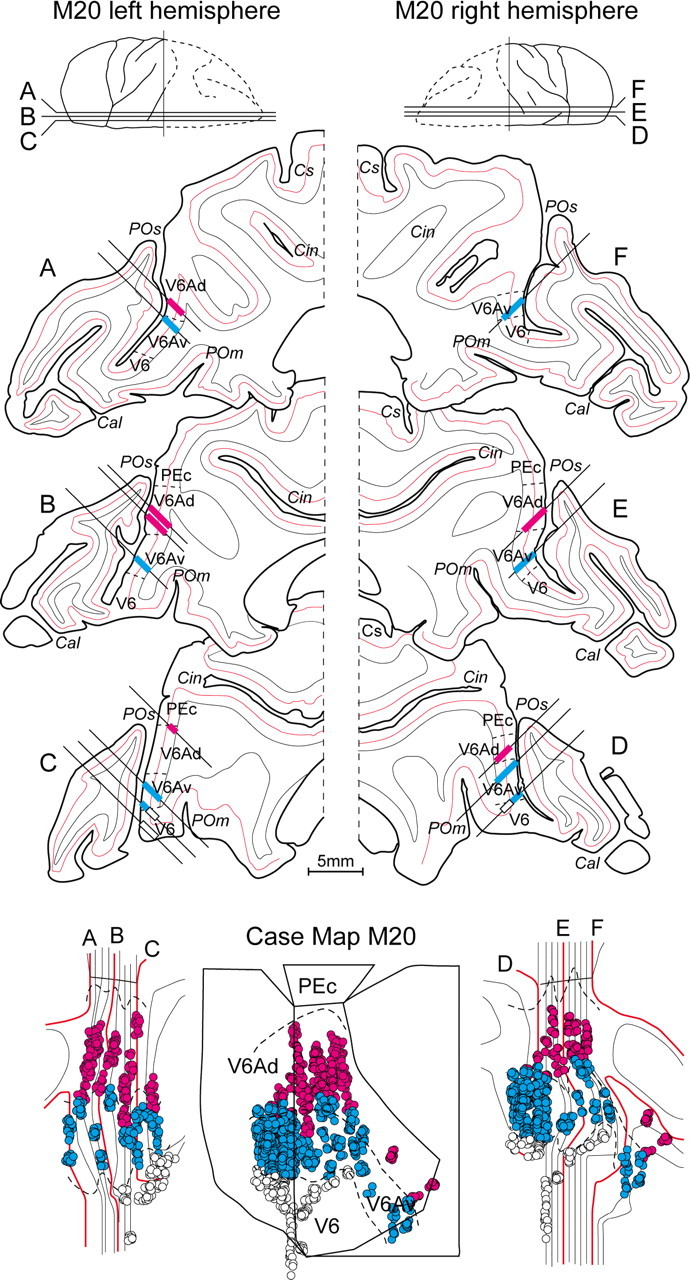
Reconstruction of recording site in a single case. Top, Six parasagittal sections (A–F) of the posterior part of the two hemispheres of case M20, taken at the levels shown on the top of the figure. Straight lines on sections indicate the reconstructions of microelectrode penetrations reaching the anterior bank of parieto-occipital sulcus in the depth. Pink indicates recording sites in V6Ad; blue in V6Av; white in V6. Dashed lines on the gray matter mark the limits between different cytoarchitectonic sectors. Red lines on sections represent layer IV. Bottom, Two-dimensional reconstructions of each hemisphere (left and right) and the two-dimensional average map of the case (center). The locations of single cells recorded in V6Ad (pink circles), V6Av (blue circles), and V6 (white circles) are reported. The red lines represent layer IV of the six sections shown on the upper part of the figure. Thin, black lines represent layer IV of the sections not shown in the upper part of the figure. The dashed lines represent the location of cytoarchitectonic borders that divide single cortical areas. Other details and abbreviations as in Figure 1.
Figure 1, E and F, shows the average map obtained by the superimposition of the maps of all the animals studied in this work. The average map is, in this case, superimposed on a three-dimensional (3D) reconstruction of the atlas brain (Fig. 1B–D) obtained by CARET (Computerized Anatomical Reconstruction and Editing Toolkit, http://www.nitc.org/projects/caret) (Van Essen et al., 2001). Despite the misalignments caused by individual differences among single hemispheres, the locations of V6Av and V6Ad in the averaged map of the atlas brain results quite clear.
Checking of neuronal functional properties
A brief description of the tasks used to assess sensory- and motor-related properties of V6A neurons is reported below. Full details on these tasks were described previously (Galletti et al., 1996, 1999a; Breveglieri et al., 2002; Fattori et al., 2005, 2009, 2010). A schematic view of the tasks used in this work is shown in Figure 3.
Figure 3.

Sensory and motor tasks. Animals were trained to perform two sensory tasks, focused on mapping the receptive field (RF) of somatosensory (far left) or visual (top, left) neurons. Animals were also trained to perform motor tasks (right) requiring reaching (top, right) or reach-to-grasp (middle and bottom, right) arm movements. In all cases, animals were trained to maintain fixation of a constant location in front of them. In grasping tasks, animals were trained to reach and grasp a handle, ball, or other object. Arm movements were performed in the dark, with the objects to be grasped visible only at the beginning of the trial. FP, fixation point; S, visual stimulus.
Visual stimulation
Individual cells' visual sensitivity was first tested with elementary visual stimuli, like light/dark borders, light/dark spots, and bars. The stimuli, rear-projected on the screen facing the animal, were moved across the neuronal receptive field (RF) with different orientations, directions, and speed of movement. When a neuron responded to this visual stimulation, it was classified as low-level visual cell. If the neuron being recorded was unresponsive to elementary visual stimuli, testing was continued using more complex stimuli (light/dark gratings and corners of different orientation, direction, and speed of movement). In some cases, neurons rapidly adapted to the same visual stimulation repeatedly swept across the visual RF and discharged only to complex shadows continuously changing in form, direction, and speed of movement. When a neuron responded to a complex visual stimulation but not to a simple one it was classified as high-level visual cell.
Cells unresponsive to either elementary or complex stimuli were classified as nonvisual cells. We are aware that such cells could actually be responsive to visual stimuli that we did not use, such as real 3D stimuli, or could be visually activated if the animal were properly motivated, or if the stimulation was performed near to the animal instead of being delivered on a tangent screen 57 cm from the animal's eyes. In other words, we are aware that we could have underestimated the number of cells sensitive to visual stimulation.
A detailed description of the methodologies used to map visual RFs is reported in Galletti and coworkers (1996, 1999a).
To test whether the visual RF of a cell was organized in retinotopic coordinates or was stable in space despite the eye movements, the RF was mapped while the animal was looking at different positions on the screen. In a first series of stimulations, the same retinotopic location was stimulated while the animal looked at different screen positions; in a second series, the same spatial location was stimulated while the animal looked at different positions on the screen. We found that, in a minority of cells, the RF remained stable in the same spatial location: these cells were classified as real-position cells (Galletti et al., 1993).
Somatosensory stimulation
Passive somatosensory stimulations were applied on the whole body of the monkeys. The animals were trained to be manipulated by the experimenters and did not react to touch or passive manipulation of the limbs. The first somatosensory stimuli we applied during somatosensory check consisted of light touching of hair and skin. If no response was elicited, we attempted the deep pressure of skin to stimulate subcutaneous tissues, and then the passive rotations of limb joints. Stimuli were delivered on both sides of the body. To exclude visual influences, somatosensory stimulations were performed from behind the animal and in complete darkness. Eye positions and movements were monitored to exclude the possibility that observed neuronal modulations were due to oculomotor activity. When a neuron responded to somatosensory stimulation, it was classified as skin, deep, or joint, according to the type of stimulation that evoked neuronal response; and as arm, leg, or trunk, according to the location of somatosensory RF. When somatosensory stimulations were not effective, the neuron was classified as somatically unresponsive.
A detailed description of the methodologies used to study somatic activities was reported by Breveglieri and coworkers (2002). Bimodal responses in single V6A cells were assessed by testing a cell with both somatosensory and visual stimulations. To avoid biases, the two types of stimulation were performed across cells in a randomized order (Breveglieri et al., 2008).
Motor-related activity
All motor-related tasks (reaching and grasping tasks) were instructed-delay tasks. They were performed in darkness (unless otherwise specified), with the arm contralateral with respect to the recording side. During the tasks, animals maintained steady fixation on a light-emitting diode (LED), which was also the target of reaching. To minimize the role of vision during arm movement in darkness, the brightness of the fixation LED was reduced so that it was barely visible. Indeed, if the experimenter stood next to the animal during the task, she/he could not see the monkey hand approaching the target, even in dark-adapted conditions.
All tasks were body-out reaching tasks in which the hand moved from a home button near the body to a target in the peripersonal space. Animals were required to press (reaching task) or grasp (grasping task) the target. In all tasks, the home button was located outside the monkey's visual field. The tasks we used did not allow for disentangling the proprioceptive or motor nature of the neural discharges. Therefore, we will refer to them as motor or movement-related discharges.
Reaching task.
The reaching task is shown in detail in Figure 3. The task began with the hand pressing a button positioned close to the monkey's chest, followed by a reach movement directed outward from the body, similar to natural reaches. After target touching, the animal was required to maintain the hand on the target for a variable time (hold), then to return the hand back toward the button near the chest, and to press it to receive the reward. When a neuron was significantly modulated during the execution of reaching or during the holding time, or both, it was classified as a reach cell (as assessed by a t test between a baseline activity epoch and either the movement, hold, or return epochs; p < 0.05).
On a subset of neurons, we performed the reaching task toward different spatial locations to check whether the direction of arm movement, or the location of arm in space, influenced cell activity. Spatially tuned neurons were those reach cells that showed a statistically significant difference in firing rate in the same movement epoch among different spatial locations (one-way ANOVA, F test, significant level, p < 0.05).
When possible, we also compared the cell activity obtained in dark with that obtained in the light environment (open and closed loop conditions, respectively). To assess the strength of visual modulation on reaching activity, we calculated the visual index (VI) as VI = (best light − best dark)/(best light + best dark), where best light and best dark are the mean average rates of neural discharge in light and dark conditions, respectively, for the direction of arm movement that evoked the best response in dark. The index ranges from −1 to 1. A neuron whose reaching activity is elicited only in the presence of visual feedback (i.e., in light) will have a value of 1, whereas a value of −1 denotes a neuron active only in dark. Values close to 0 indicate that the neuron is similarly modulated by reaching in light and in dark. Neurons were grouped into three classes according to their VIs: motor (−0.1 ≤ VI ≤ 0.1), visuomotor − (VI < −0.1), and visuomotor + (VI > 0.1).
Spike density functions were calculated (Gaussian kernel; half-width, 40 ms) for each neuron included in the analysis and averaged across all trials for each tested condition. A detailed description of the methodologies used to study reaching activity is reported in recent works by Fattori and coworkers (Fattori et al., 2001, 2005; Bosco et al., 2010).
Grasping task.
In the grasping task, we studied the effect on cell activity of changing wrist orientation and grip type. To test the effect of wrist orientation, the monkeys performed a reach-to-grasp task with the contralateral arm, the head restrained, while maintaining steady fixation of a visual target in darkness. As shown in Figure 3, the animal reached and grasped a handle placed on a panel in front of its eyes. The handle could have four different orientations, so the monkey approached and grasped it with different orientations of the hand. Wrist-sensitive cells were defined as those cells that discharged significantly differently during reach-to-grasp time, among the different orientations tested (from two to four orientations; one-way ANOVA; F test; significant level, p < 0.05).
To test the effect of grip type on cell activity, the animals were required to reach and grasp objects of different shape and size, which needed the use of different hand shaping (Fig. 3). Grip-sensitive neurons were those that displayed activity during reach-to-grasp time significantly different depending on the types of grip used [two-way ANOVA, F test, grip (5 levels) × epoch (2 levels), p < 0.05].
Spike density functions were calculated (Gaussian kernel; half-width, 40–60 ms) for each neuron included in the analysis and averaged across all trials for each tested condition. A detailed description of the methodologies used to study grasping activity was reported by Fattori and coworkers (2009; 2010).
The number of cells significantly modulated (t test with respect to baseline; p < 0.05) by a specific sensory stimulation or motor act was expressed as the percentage of cells sensitive to that stimulation or motor act of the total cells tested for that property. The frequency of cells sensitive to a specific stimulation in V6Av and V6Ad were then compared with one another using the χ2 test (p < 0.05). All analyses for quantifying neural activity in the different tasks were performed using custom scripts written in MATLAB (Mathworks). All statistical analyses were performed using STATISTICA (StatSoft) and Microsoft Excel software.
Results
Single-cell activity was extracellularly recorded from the anterior bank of the parieto-occipital sulcus in 14 hemispheres of eight macaque monkeys (Macaca fascicularis). A total of 3828 neurons were studied while the animals performed several types of behavioral tasks (Table 1). Recorded cells were assigned to V6Av or V6Ad on the basis of the cytoarchitectural pattern of recording sites (Luppino et al., 2005). The functional properties of many neurons have been described in our previous studies (Galletti et al., 1996, 1999a; Fattori et al., 2001, 2005, 2009, 2010; Breveglieri et al., 2002; Bosco et al., 2010).
We checked the sensory-related (visual and somatic) and the motor-related (reaching and grasping) properties of recorded neurons. Each neuron was tested with as many paradigms as possible in so far as recording time allowed. We did not apply any implicit qualitative criteria to select a particular paradigm for the cell in record. The results are summarized in Table 2.
Table 2.
Total number of V6Ad and V6Av cells tested with different tasks
| V6Ad | V6Av | Total | |
|---|---|---|---|
| Cytoarchitectonically assigned | 1628 | 2200 | 3828 |
| Visually tested | 836 | 1227 | 2063 |
| Somatically tested | 397 | 227 | 624 |
| Tested for reaching | 151 | 101 | 252 |
| Tested for wrist orientation | 70 | 59 | 129 |
| Tested for grip type | 139 | 152 | 291 |
Visual properties
Previous works from our laboratory have demonstrated that ∼65% of V6A neurons are sensitive to visual stimulation (Galletti et al., 1996, 1999a). Here we investigated whether visual neurons, as well as neurons with different visual properties, are or are not uniformly distributed in the two cytoarchitectonic sectors of V6A. A total of ∼2000 neurons were visually tested (Table 2) in six animals. As summarized in Table 3 and Figure 4A, the neurons sensitive to visual stimulation were significantly more represented in V6Av (69%) than in V6Ad (59%; p < 0.01). The flattened map of the caudal SPL (Fig. 4A, bottom) shows that visual/nonvisual cells are evenly distributed within each of the two sectors of V6A.
Table 3.
Distribution of sensory and motor types in the cortical fields V6Ad and V6Av
| V6Ad | V6Av | |
|---|---|---|
| Sensory types | ||
| Visual cells | 496/836 (59%) | 852/1227 (69%) |
| Low-level visual | 175/496 (35%) | 531/852 (62%) |
| High-level visual | 321/496 (65%) | 321/852 (38%) |
| Somatic cells | 163/397 (41%) | 39/227 (17%) |
| Somatotopy | ||
| Arm | 126/163 (77%) | 23/39 (59%) |
| Trunk | 10/163 (7%) | 4/39 (10%) |
| Leg | 1/163 (1%) | 1/39 (3%) |
| Mixed | 26/163 (15%) | 11/39 (28%) |
| Submodality | ||
| Joint | 128/137 (93%) | 20/28 (71%) |
| Deep | 11/82 (13%) | 6/21 (29%) |
| Skin | 31/104 (30%) | 12/33 (36%) |
| Motor types | ||
| Reach cells | 133/151 (88%) | 91/101 (90%) |
| Spatial tuning | ||
| Movement | 54/75 (72%) | 37/50 (74%) |
| Hold | 46/75 (61%) | 28/50 (56%) |
| Both | 28/75 (37%) | 15/50 (30%) |
| Visual effect | ||
| Visuomotor − | 37/65 (57%) | 19/51 (37%) |
| Motor | 16/65 (25%) | 14/51 (27%) |
| Visuomotor + | 12/65 (18%) | 18/51 (35%) |
| Grasp cells | 126/209 (60%) | 108/211 (51%) |
| Sensitive to wrist orientation | 42/70 (60%) | 30/59 (51%) |
| Sensitive to grip types | 84/139 (60%) | 78/152 (51%) |
Figure 4.

Incidence and distribution of visual responses. A, Incidence (top) and distribution on the flattened map of the caudal SPL (bottom) of visual and nonvisual cells. B, Incidence (top) and distribution (bottom) of low-level and high-level visual cells. C, Incidence (top) and distribution (bottom) of real-position cells. The outcome of the χ2 test is indicated by asterisks, **p < 0.01. Details on two-dimensional maps as in Figure 1.
Table 3 and Figure 4B show that low-level visual cells (see Materials and Methods, above) were significantly more represented in V6Av (62%) than in V6Ad (35%; p < 0.01). The opposite distribution was observed for high-level visual cells, which were more represented in V6Ad (65%) than in V6Av (38%). The distribution of low-level/high-level visual cells on a flattened map of the caudal SPL (Fig. 4B, bottom) shows that the two types of cells are evenly distributed within each of the two sectors of V6A.
A particular type of visual cells were the real-position cells. They showed a visual receptive field that remained constant in space regardless of eye movements (Galletti et al., 1993, 1995). This type of cells represents ∼10% of V6A neurons and, as shown in Figure 4C, were found only in area V6Av.
In a population of visual cells where it was possible to map the entire extent of each RF (in some cases, the RF was so large that part of it dropped outside the 80° × 80° tangent screen), we analyzed the visual field representation in V6Av and V6Ad. A total of 585 neurons for area V6Av and 324 for area V6Ad were included in this analysis. All the RFs of each population were plotted together and a density map of visual field representation for each cortical sector was then elaborated (Fig. 5A).
Figure 5.

Basic visual properties. A, Density maps of receptive-field distribution in areas V6Ad and V6Av. A total of 909 RFs were used in this analysis. Color scale indicates the relative density of receptive fields covering that specific part of the visual field. In the dark red region, ∼120 (V6Ad) or 140 (V6Av) RFs are superimposed in the same grid square. The size of the grid square was set to 5 × 5°. B, Same data as in A, but with the data from V6Ad and V6Av superimposed. Dashed and continuous lines are iso-density lines of V6Ad and V6Av, respectively. C, Histograms representing the percentages of V6Ad and V6Av visual cells selective for peculiar features of visual stimulus (orientation, direction, and speed of movement). The flattened map shows the distribution of cells tested for speed recorded from six hemispheres. Slow (white dots) indicates cells responding to stationary stimuli and/or to stimuli moving at speeds <10°/s. Fast (black dots) indicates cells responding better to stimuli moving at speeds ≥10°/s. A total of 315 cells were used in the orientation study, 302 cells in direction study, and 292 cells in velocity study. The outcome of the χ2 test is indicated by asterisks: *p < 0.05 and **p < 0.01. Ipsi, Ipsilateral; Contra, contralateral; NOR, nonorientation sensitive; NDS, nondirection sensitive. Other details as in Figure 1.
As shown in Figure 5B, both sectors of V6A represent largely the contralateral lower part of the visual field, and partially the ipsilateral and upper part of it. The focus of major cortical representation (the higher density of RFs overlapping) is different for V6Ad and V6Av. The central part of the visual field is more represented in V6Ad, particularly the central 20°, whereas in V6Av the more represented part of the visual field is the peripheral, contralateral lower quadrant, in particular the medial region (near the vertical meridian) at eccentricities from 20° to 40° (Fig. 5A,B).
Figure 5C summarizes the distribution in V6Av and V6Ad of other visual properties, such as the sensitivity to orientation, direction, and speed of stimulus movement. We defined a cell that strongly discriminated the orientation of the visual stimulus, showing no response when the stimulus orientation differed by no more than 40° from the preferred one, as orientation-selective (OSL); a cell that ceased responding at stimulus orientations differing by 41–90° from the preferred orientation was defined as orientation-sensitive (OSN); and a cell responsive at all stimulus orientations was defined as nonoriented. OSL and OSN cells together represented ∼90% of cell populations in both V6Av and V6Ad, and were uniformly distributed in the two sectors of V6A (p > 0.05).
Direction-selective (DSL) cells were defined as those cells with a firing rate in response to a correctly oriented stimulus moving in the direction opposite to the preferred one that was <20% of the firing rate evoked during optimal stimulation; direction-sensitive (DSN) cells were those cells with a response between 20 and 80%; and nondirection-sensitive cells were those with a response in the opposite direction that was >80% of that in the preferred one. DSL cells represented the large majority in both sectors of V6A, being ∼70% of cell population. Concerning the cell distribution frequency, there was a similar incidence of DSL and DSN cells in V6Ad and V6Av (p > 0.05).
We also analyzed whether there was a difference between the two cytosectors of V6A in the relationships between RF size and eccentricity. This analysis indicated no significant differences between V6Ad and V6Av (χ2 test, not significant), and confirmed for both cytosectors the very small increase of RF size with eccentricity already reported for V6A (Galletti et al., 1999a).
Visual cells were also classified according to their tuning for stimulus speed. We divided the cells into two classes: slow cells, responding only to stationary stimuli and/or to stimuli moving at speeds <10°/s; and fast cells, responding better to stimuli moving at speeds >10°/s. As Figure 5C shows, slow cells were preferentially located in V6Ad (p < 0.01), whereas fast cells were in V6Av (p < 0.05). It is interesting to note that in classic visual areas, cells preferring slow speed of movement are more represented in the cortical region of central field representation, and cells preferring fast movements in the region of peripheral representation (Galletti et al., 1982; Lui et al., 2007; Yu et al., 2010).
Somatic properties
The somatosensory modulation of neuronal activity was tested in five animals. This analysis includes >600 neurons (Table 2). Forty-one percent of cells tested in V6Ad and 17% of those tested in V6Av were responsive to the somatic stimulation. As summarized in Table 3, the large majority of somatic-sensitive cells in both V6Ad and V6Av were modulated by stimulation of the arm/hand. Only a small number of cells responded to the somatic stimulation of the leg and trunk. Most of the somatic-sensitive cells were modulated by joint stimulations and approximately one-third of them by tactile stimulations. Several cells showed sensitivity to both joint and tactile stimulation. A detailed description of stimulations and of somatotopy representation was reported previously (Breveglieri et al., 2002). Here we describe the distribution of different cell types in the two cortical fields V6Av and V6Ad.
Figure 6A shows the frequency and distribution of cells tested with somatic stimulations in V6Ad and V6Av. Cells sensitive to somatic stimulations were clearly more represented in V6Ad than in V6Av (p < 0.01). However, there is not a significant segregation in the distribution of cells representing different parts of the body (Fig. 6B,D) and different types of somatic stimulations (χ2 test, not significant) (Fig. 6C).
Figure 6.
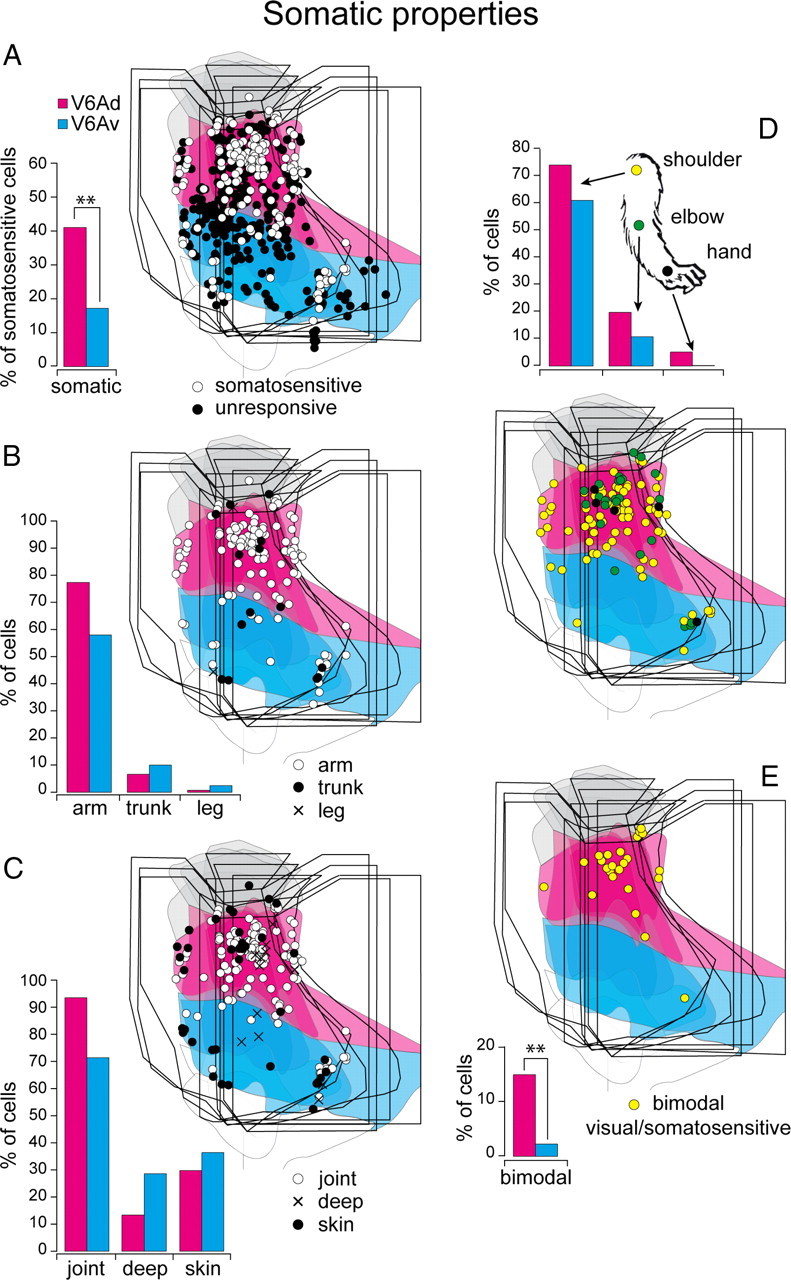
Incidence and distribution of somatosensory responses. A, Incidence (bar graph, left) and distribution on the flattened map of the caudal SPL (right) of somatosensitive cells. B, Somatotopy across V6Ad and V6Av. C, Incidence and distribution of somatic properties. D, Incidence and distribution of proximal and distal arm representation. E, Incidence and distribution of bimodal visual/somatosensory neurons. The two-dimensional maps of the caudal pole of SPL have been obtained superimposing four cases. The outcome of the χ2 test is indicated by asterisks: **p < 0.01. Other details as in Figure 1.
A subset of neurons (N = 311) was tested for both visual and somatosensory responses to check the distribution of multisensory neurons across V6A. As shown in Figure 6E, almost all the bimodal cells were confined within V6Ad (χ2 test, p < 0.05).
Motor-related properties
Reaching
Many V6A neurons are modulated by reach-to-point movements, even when performed in complete darkness, and are spatially tuned by the direction of reaching movement (Fattori et al., 2001, 2005). Here we investigate whether these reach-related neurons are confined within one of the two cytosectors of V6A or if they are present in both and with which incidence. A total of 252 neurons recorded from area V6A of three animals were tested with the reaching task (Fig. 3, Table 2). Figure 7A shows an example of a cell spatially modulated during reaching action. The cell was silent for reaches toward the left, discharged weakly when the monkey executed reaches toward the central target, and displayed a vigorous response when reaching movements were directed toward the right target. The frequency and distribution of this type of cells in V6Av and V6Ad are shown in Figure 7B. Reach-related neurons represented the vast majority (∼90%) of tested cells in both sectors, and were uniformly distributed in V6Av and V6Ad (χ2 test, not significant).
Figure 7.
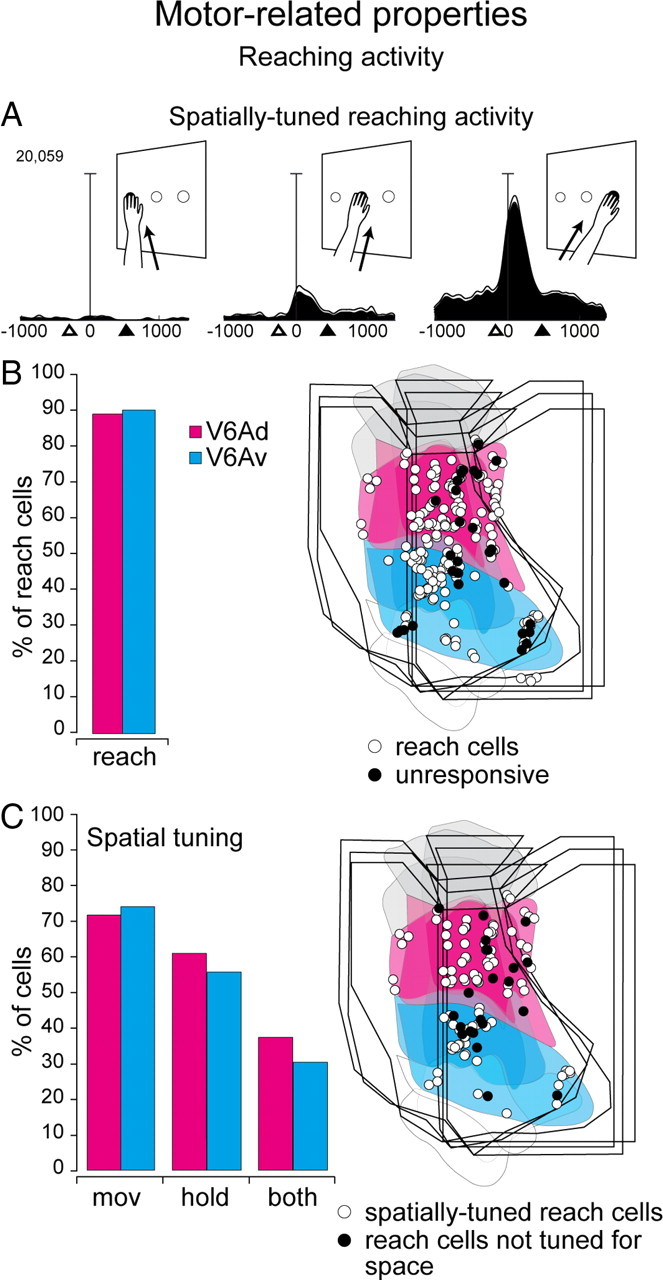
Incidence and distribution of reaching activity. A, Example of a spatially tuned neuron preferring rightward movements. Each inset contains the neuronal activity expressed as spike density functions (black shadow) with variability band (SEM, light lines) and the sketch of the arm movement and its direction. Activity is aligned with the onset of arm movement. White triangles, Approximate time of home button release; black triangles, approximate time of target point touching. Scale, Vertical bar on spike density functions, 70 spikes/s. B, C, Incidence (left) and distribution on the flattened map of the caudal SPL (right; three cases) of reach-related and spatially tuned cells. mov, Movement of the arm toward the target or backward away from it; hold, holding phase of reaching movement; both, movement and hold. Other details as in Figure 1.
As shown in Figure 7A, the reaching task allowed us to assess whether V6A neurons were spatially tuned for arm movements performed in different directions, or for holding the hand in different spatial locations. As shown in Figure 7C and Table 3, the distribution of spatially tuned reach-related cells did not show any significant bias between the two cytosectors of V6A (χ2 test, not significant).
The reaching activity of V6A neurons could be modulated by the visual feedback [vision of the environment and of the monkey arm (Bosco et al., 2010)]. The influence of visual feedback on arm-reaching activity was studied in 116 V6A neurons (Table 3) from three animals.
On the basis of the value of VI (see Materials and Methods, above), neurons tested in light and dark backgrounds were subdivided into three groups. Motor cells were those cells where the firing rates in light and dark were not significantly different (−0.1 ≤ VI ≤ 0.1), indicating a lack of influence of visual feedback on the motor-related activity; visuomotor − cells were those cells with a motor-related response that was higher in the dark (VI < −0.1), indicating that visual feedback inhibited the motor response; and visuomotor + cells were those cells with motor-related response that was higher in the light (VI > 0.1), indicating that visual input was added to the motor-related response. Figure 8A shows examples of cells belonging to these three categories.
Figure 8.

Visual modulation of reaching activity. A, Examples of neurons representative of the three types of cells found in V6Ad and V6Av. Each inset contains the neuronal activity expressed as spike density functions (black shadow for activity in dark, gray shadow for activity in light). The target is always positioned in the straight ahead position, as sketched on the left of the figure. Activity is aligned with the onset of arm movement. Scale, Vertical bar on spike density functions, 50 spikes/s (visuomotor −), 57 spikes/s (motor), and 180 spikes/s (visuomotor +). B, Incidence (left) and distribution on the flattened map of the caudal SPL (right; three cases) of motor, visuomotor − (vis mot −), and visuomotor + (vis mot +) cells. The outcome of the χ2 test is indicated by asterisks, *p < 0.05. Other details as in Figure 1.
The frequency and distribution of these three types of cells in V6Av and V6Ad are shown in Figure 8B. The distribution was significantly different between the two sectors of V6A (p < 0.05). In particular, although the motor cells were evenly distributed between the two sectors of V6A, visuomotor − cells were preferentially located in V6Ad (p < 0.05) and visuomotor + cells in V6Av (p < 0.05).
Grasping
An involvement of V6A neurons in distal aspects of prehension (grasping) has been recently reported by our laboratory (Fattori et al., 2009, 2010). Here we report data on 420 neurons that underwent two different grasping tasks, one testing the sensitivity to wrist orientation and the other the sensitivity to grip posture (Fig. 3). Of the 420 neurons tested in two animals, 209 cells were recorded from V6Ad and 211 from V6Av (Table 2).
In the task used to test the sensitivity to wrist orientation, cells were studied while the monkey executed reach-to-grasp movements to grasp an object (always a handle), located in a constant position in space (straight ahead), but having different orientation (Fig. 9A). In other words, we compared the cell activity while the animal performed reach-to-grasp movements with constant direction but with different wrist orientations (Fattori et al., 2009). As shown in Figure 9A, the cells' activity was strongly modulated by wrist orientation. Neurons sensitive to wrist orientation were found in both V6Av and V6Ad with a comparable frequency (χ2 test, not significant) and a uniform distribution (Fig. 9A, right).
Figure 9.
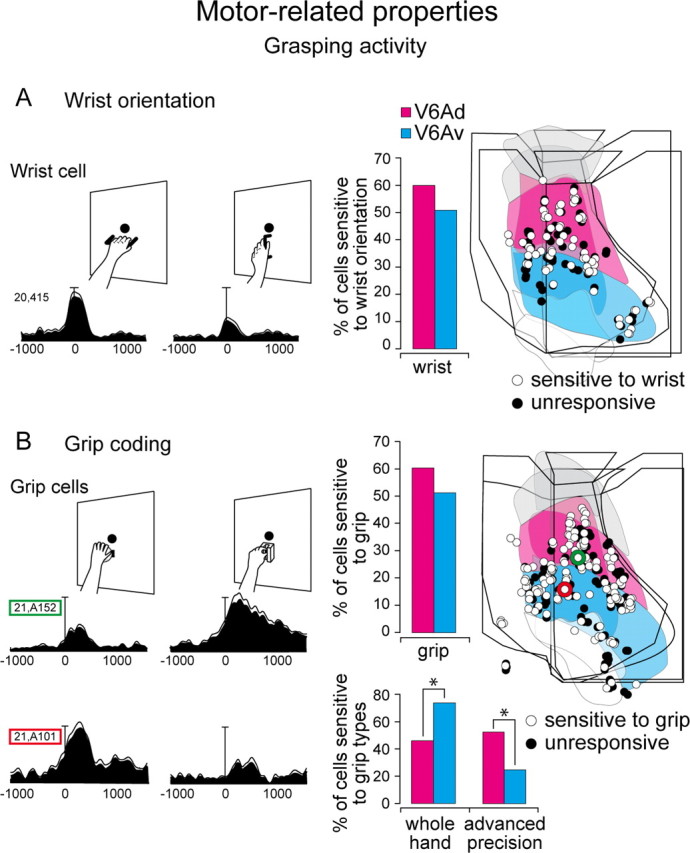
Incidence and distribution of grasping activity. A, Left, Example of a cell sensitive to wrist orientation. B, Left, Example of cells sensitive to grip type. Each inset contains the neuronal activity expressed as spike density functions (black shadow) with variability band (SEM, light lines) and a sketch of the task requirements. Activity is aligned with the onset of arm movement. Scale, Vertical bar on spike density functions, 104 spikes/s (A), 125 spikes/s (B, top), 70 spikes/s (B, bottom). Right, Incidence (bar grafts) and distribution on the flattened map of the caudal SPL (two cases) of grasp-related cells. The location of cell 21.A152, preferring precision grip (B), is marked in green on the flattened map. The location of cell 21.A101, preferring whole hand prehension (B), is marked in red on the flattened map. Note that the first cell is located in V6Ad and the second one in V6Av. The outcome of the χ2 test is indicated by asterisks, *p < 0.05. Other details as in Figure 1.
In the task used to test the sensitivity to grip posture, cells were recorded while the monkey executed reach-to-grasp movements for grasping different objects located in a constant position in space (Fig. 9B). The orientation of objects was such as to require the same wrist orientation. Thus, we compared cells' activity while the animal performed reach-to-grasp movements with constant direction and wrist orientation, but with different grip postures. As shown in the two examples of Figure 9B, cells' discharges were strongly modulated by grip posture. The columns and the data in Figure 9B (right) show the frequency and distribution of grip-sensitive cells in V6Ad and V6Av. These cells were not segregated in one cytosector of V6A (χ2 test, not significant) and were evenly distributed within the entire V6A.
The two cells shown in Figure 9B have opposite grip preferences, one preferring the most skillful grip (advanced precision grip) and the other the most rudimentary grip (whole-hand prehension). Their location in V6A is emphasized in Figure 9B (green and red rings, respectively). The histogram in Figure 9B shows that grip neurons preferring skillful grips are more abundant in V6Ad (p < 0.05), whereas neurons preferring rudimentary grips are significantly more concentrated in V6Av (p < 0.05).
In a small sample of neurons (N = 45), we were able to check whether single cells were modulated by both reaching and grasping activities (Fattori et al., 2009). Each cell of the sample underwent both tests, for spatial tuning in the reach-to-point task and for wrist sensitivity in the grasping task.
In ∼50% of cases (24 of 45), we found a coexistence in single V6A neurons of modulations for reach direction and hand orientation. Approximately 20% of neurons (9 of 45) were sensitive to reach direction only, and ∼20% (8 of 45) to hand orientation only. In other words, approximately half of V6A neurons were involved in both proximal and distal aspects of prehension and a minority in one component only. All these types of cells were not segregated in V6Ad or V6Av (χ2, not significant), in agreement with the lack of a proximal-to-distal topography of arm representation in the two cytosectors, as shown in Figure 6D. It appears, as in the whole V6A, that several cells may multiplex different signals to code for an integrated behavior whereas other cells may encode the individual components of prehension.
Discussion
We analyzed the functional properties of neurons in the anterior bank of the parieto-occipital sulcus of the macaque to test whether the two cytoarchitectonic sectors of V6A (V6Av and V6Ad) correspond to functionally different cortical areas. The present study is based on a large amount of data collected in the same laboratory (14 hemispheres from eight animals, including ∼4000 recorded cells). Therefore, the reconstruction of recording sites, the cytoarchitectural criteria, and the functional classification of neurons were all done in a consistent manner, thus increasing the reliability of the results.
Both V6Av and V6Ad show a parietal-type cytoarchitectural pattern, although V6Av has characteristics that are reminiscent of occipital (visual) cortex, whereas V6Ad resembles somatosensory cortex (Luppino et al., 2005). Accordingly, the present results show that visual cells are more common in V6Av than in V6Ad, whereas somatosensory cells are more common in V6Ad. Neurons in V6Av are easily activated by elementary visual stimuli, such as light/dark borders and bars, whereas neurons in the dorsal sector of V6A typically require more complex visual stimulations.
In addition, real-position cells [cells with receptive fields that remain stable in space regardless of eye movements (Galletti et al., 1993)] are present in V6Av but not in V6Ad. Real-position cells have been suggested to be able to directly encode the spatial location of an object in the visual space and to be useful in the quick spatial transformations required for on-line control of arm actions (Galletti et al., 1993, 2003). The presence of real-position cells in V6Av suggest an involvement of this cytosector in the encoding of space for action through direct spatial transformations. Since real-position cells are absent in V6Ad and are not reported to be present in area V6, which borders ventrally V6Av, the presence of real-position cells can be used as functional marker of V6Av when recordings are obtained in the anterior bank of the parieto-occipital sulcus.
The segregation of sensory properties between ventral and dorsal sectors of V6A is in line with recent available data on cortical connections (Gamberini et al., 2009), which show that V6Ad has strong connections with the parietal areas medial intraparietal (MIP), PEc, and medial PG, all of which are characterized by somatosensory-related activity, as well as with the dorsal premotor cortex. V6Av, conversely, receives strong afferents from the extrastriate visual areas V2, V3, V4, and V6, and has less widespread connections with the frontal cortex (Passarelli et al., 2011).
A similar visual/somatosensory organization was described for area MIP, which borders V6A laterally and anteriorly. In fact, describing the results of recordings along the medial wall of the intraparietal sulcus, Colby and Duhamel (1991) reported a large proportion of arm reaching cells in the dorsal region, which gradually gave way to an increasing number of cells sensitive to visual stimulation as the electrode was moved ventrally. Another similarity between MIP and V6A refers to the pattern of visual field representation. The present results show that the central part of the visual field is mainly represented in V6Ad whereas the periphery is inV6Av. Similarly, the dorsal part of MIP receives visual information from the central part of the visual field and the ventral part of MIP receives visual information from the periphery (Galletti et al., 2001). A further support to the similarity in functional organization between V6A and MIP comes from the anatomical connections. The dorsal part of MIP is strongly connected with the somatically dominated area PEc (Bakola et al., 2010) whereas the ventral part of MIP is connected with the extrastriate visual area V6 (Galletti et al., 2001). Despite all these similarities, MIP and V6A are described as different functional areas, sharing a number of functional properties but also showing a number of functional specificities (Colby and Duhamel, 1991; Galletti et al., 1999a; for review, see Galletti et al., 2003).
A visual-to-somatosensory trend similar to that observed in MIP and V6A has also been reported for the cytoarchitectonically defined areas PG/PFG/PF of the inferior parietal lobule (Rozzi et al., 2008). The most posterior area PG, located near the occipital visual areas, shows the highest percentage of visual cells and the most rostral area PF, located near the somatic cortical areas, shows the highest number of somatic cells, with PFG showing intermediate characteristics (Rozzi et al., 2008). As for V6A, the functional segregation well agrees with the hodological data (Rozzi et al., 2006).
Another posterior parietal area showing some similarities in the functional organization with V6A is the lateral intraparietal area (LIP). Area LIP, like V6A, is subdivided into two cytoarchitectonic sectors, LIPd and LIPv (Blatt et al., 1990; Lewis and Van Essen, 2000), which are connected with different cortical areas (Blatt et al., 1990; Schall et al., 1995; Bullier et al., 1996). Both sectors have an almost complete representation of the visual field (Patel et al., 2010), but the periphery is more represented in LIPv and the central part of the visual field in LIPd (Blatt et al., 1990), as it is the case for V6Av and V6Ad.
In summary, there are intriguing similarities in the anatomical and functional organization of several areas of the posterior parietal cortex. Despite this, there are so many functional differences among these areas that the view of a different functional role for each of them is generally well accepted.
Is area V6A a single functional area?
Despite the uneven distribution of visual and somatic neurons, there are a number of other functional properties that are uniformly distributed within area V6A, such as the sensitivity to the orientation and direction of the motion of visual stimuli, and the types of somatic stimuli that are effective in activating the cells. Similar distributions were also found for cells coding reach direction, wrist orientation, and grip formation, suggesting an involvement of both sectors of V6A in the control of prehension.
Evidence of functional segregation in the two cytosectors of V6A is the effect of visual feedback on arm reaching activity: reach neurons in which the visual feedback inhibits the motor related activity are significantly more common in V6Ad than in V6Av. These cells (visuomotor −) rely on somatosensory/motor-related signals to encode reaching movements, given that their discharge is higher in the dark and that visual feedback has an inhibitory effect. It is not surprising that these cells are more concentrated in V6Ad, where somatosensory responses are more abundant and where direct projections from dorsal premotor cortex terminate (Gamberini et al., 2009). Conversely, in V6Av, which hosts the majority of visual neurons and receives direct projections from extrastriate areas (Passarelli et al., 2011), there are many neurons in which reach-related activity is enhanced by visual feedback (visuomotor + cells).
On the whole, these data suggest that both V6Ad and V6Av are involved in analyzing the basic features of the visual world and in monitoring reach-to-grasp actions. The somatosensory information is more powerful in driving arm-related responses in V6Ad, and visual information is more powerful in driving arm-related responses in V6Av. Accordingly, V6Ad is richer in neurons with enhanced reaching activity in the dark and V6Av in neurons with enhanced reaching activity in the light. These data are in agreement with the current Bayesian models of flexible sensory integration for movement guidance (van Beers et al., 2002; Knill and Pouget, 2004), suggesting that this could be a mechanism serving to prioritize the most reliable sensory cues in a given situation: to switch off somatosensory activity when acting in the light because vision is more reliable than proprioception, and to switch off visual activity when in the dark because proprioception is more reliable than vision. The existence in both V6A sectors of neurons relying differently on the available sensory inputs (Fig. 8) suggests that these two cortical sectors are able to encode reaching by flexibly weighting the motor goal of action according to the available sensory inputs, as modeled by Sabes and coworkers (Sober and Sabes, 2005; McGuire and Sabes, 2009) and as also suggested by brain imaging studies on the putative human homolog of V6A (Bernier and Grafton, 2010). The whole V6A can participate as a state estimator in the circuits involved in planning and executing reaching movements, by comparing the expected state of the movement with the actual visual/somatosensory feedback evoked by the moving arm (Bosco et al., 2010).
Both sectors of V6A have the basic machinery necessary to analyze stationary and moving visual stimuli. V6Ad is particularly well equipped to analyze stimuli projecting their images onto the central part of the retina, that is, regions near the fixation point. This suggests that V6Ad is involved in the control of the final part of hand movement, when the hand approaches the object of interest and interacts with it. Conversely, the overrepresentation of the periphery in V6Av, particularly the medial lower visual field (Fig. 5), agrees with the view that this sector of V6A is involved in the visual analysis of the transport phase of reach-to-grasp action. In fact, the medial lower visual field is the part of the visual field traversed by the arm on the way to reach an object to be grasped. The preference for low-speed movement (<10°/s) in V6Ad and for higher speeds in V6Av is in line with this view, since the speed of arm movement varies according to the distance of the hand from the object to be grasped. The presence of neurons sensitive to grip formation in both central and peripheral field representations (V6Ad and V6Av, respectively) is in line with the fact that, in a reach-to-grasp movement, the preshaping of the hand starts while the hand is approaching the object to be grasped (Jeannerod, 1981), that is, when the hand is sweeping across the peripheral part of the visual field. The significant higher concentration of visual neurons responding only to complex stimuli in V6Ad, and the higher incidence of visual cells responsive to elementary stimuli in V6Av, is reflected in the motor domain by the distribution of preferred grip types. Grip neurons more activated by reach-to-grasp of complex objects, which require an accurate precision grip, are more concentrated in V6Ad, whereas V6Av contains more cells that prefer a rudimentary grip (the whole-hand prehension).
Are V6Ad and V6Av two different areas, or is V6A a single functional area? The answer depends on the criteria taken into account to define an area. On the basis of the above considerations, we are inclined to interpret that V6A is a single functional area, involved in the control of reach-to-grasp movements. V6A, like other areas of the posterior parietal cortex, contains different cortical fields with specific architectural patterns, anatomical connections, and functional properties, but these fields appear to work together in the online control of reach-to-grasp actions.
Footnotes
This work was supported by European Union Grant FP7-IST-217077-EYESHOTS, and by Ministero dell'Università e della Ricerca and Fondazione del Monte di Bologna e Ravenna, Italy. We thank L. Sabattini and R. Mambelli for the technical assistance, and P. Cavana and G. Placenti for helping in the statistical analysis and for developing MatLab scripts useful in the data analysis and representation.
References
- Bakola S, Gamberini M, Passarelli L, Fattori P, Galletti C. Cortical connections of parietal field PEc in the macaque: linking vision and somatic sensation for the control of limb action. Cereb Cortex. 2010;20:2592–2604. doi: 10.1093/cercor/bhq007. [DOI] [PubMed] [Google Scholar]
- Bernier PM, Grafton ST. Human posterior parietal cortex flexibly determines reference frames for reaching based on sensory context. Neuron. 2010;68:776–788. doi: 10.1016/j.neuron.2010.11.002. [DOI] [PubMed] [Google Scholar]
- Blatt GJ, Andersen RA, Stoner GR. Visual receptive field organization and cortico-cortical connections of the lateral intraparietal area (area LIP) in the macaque. J Comp Neurol. 1990;299:421–445. doi: 10.1002/cne.902990404. [DOI] [PubMed] [Google Scholar]
- Bosco A, Breveglieri R, Chinellato E, Galletti C, Fattori P. Reaching activity in the medial posterior parietal cortex of monkeys is modulated by visual feedback. J Neurosci. 2010;30:14773–14785. doi: 10.1523/JNEUROSCI.2313-10.2010. [DOI] [PMC free article] [PubMed] [Google Scholar]
- Breveglieri R, Kutz DF, Fattori P, Gamberini M, Galletti C. Somatosensory cells in the parieto-occipital area V6A of the macaque. Neuroreport. 2002;13:2113–2116. doi: 10.1097/00001756-200211150-00024. [DOI] [PubMed] [Google Scholar]
- Breveglieri R, Galletti C, Gamberini M, Passarelli L, Fattori P. Somatosensory cells in area PEc of macaque posterior parietal cortex. J Neurosci. 2006;26:3679–3684. doi: 10.1523/JNEUROSCI.4637-05.2006. Erratum (2006) 26:4452. [DOI] [PMC free article] [PubMed] [Google Scholar]
- Breveglieri R, Galletti C, Monaco S, Fattori P. Visual, somatosensory, and bimodal activities in the macaque parietal area PEc. Cereb Cortex. 2008;18:806–816. doi: 10.1093/cercor/bhm127. [DOI] [PubMed] [Google Scholar]
- Bullier J, Schall JD, Morel A. Functional streams in occipito-frontal connections in the monkey. Behav Brain Res. 1996;76:89–97. doi: 10.1016/0166-4328(95)00182-4. [DOI] [PubMed] [Google Scholar]
- Colby CL, Duhamel JR. Heterogeneity of extrastriate visual areas and multiple parietal areas in the macaque monkey. Neuropsychologia. 1991;29:517–537. doi: 10.1016/0028-3932(91)90008-v. [DOI] [PubMed] [Google Scholar]
- Fattori P, Gamberini M, Kutz DF, Galletti C. ‘Arm-reaching’ neurons in the parietal area V6A of the macaque monkey. Eur J Neurosci. 2001;13:2309–2313. doi: 10.1046/j.0953-816x.2001.01618.x. [DOI] [PubMed] [Google Scholar]
- Fattori P, Kutz DF, Breveglieri R, Marzocchi N, Galletti C. Spatial tuning of reaching activity in the medial parieto-occipital cortex (area V6A) of macaque monkey. Eur J Neurosci. 2005;22:956–972. doi: 10.1111/j.1460-9568.2005.04288.x. [DOI] [PubMed] [Google Scholar]
- Fattori P, Breveglieri R, Marzocchi N, Filippini D, Bosco A, Galletti C. Hand orientation during reach-to-grasp movements modulates neuronal activity in the medial posterior parietal area V6A. J Neurosci. 2009;29:1928–1936. doi: 10.1523/JNEUROSCI.4998-08.2009. [DOI] [PMC free article] [PubMed] [Google Scholar]
- Fattori P, Raos V, Breveglieri R, Bosco A, Marzocchi N, Galletti C. The dorsomedial pathway is not just for reaching: grasping neurons in the medial parieto-occipital cortex of the macaque monkey. J Neurosci. 2010;30:342–349. doi: 10.1523/JNEUROSCI.3800-09.2010. [DOI] [PMC free article] [PubMed] [Google Scholar]
- Galletti C, Squatrito S, Battaglini PP, Maioli MG. Activation of striate cortex cells in the monkey during visual tracking and steady fixation. Boll Soc Ital Biol Sper. 1982;58:49–50. [Google Scholar]
- Galletti C, Battaglini PP, Fattori P. Parietal neurons encoding spatial locations in craniotopic coordinates. Exp Brain Res. 1993;96:221–229. doi: 10.1007/BF00227102. [DOI] [PubMed] [Google Scholar]
- Galletti C, Battaglini PP, Fattori P. Eye position influence on the parieto-occipital area PO (V6) of the macaque monkey. Eur J Neurosci. 1995;7:2486–2501. doi: 10.1111/j.1460-9568.1995.tb01047.x. [DOI] [PubMed] [Google Scholar]
- Galletti C, Fattori P, Battaglini PP, Shipp S, Zeki S. Functional demarcation of a border between areas V6 and V6A in the superior parietal gyrus of the macaque monkey. Eur J Neurosci. 1996;8:30–52. doi: 10.1111/j.1460-9568.1996.tb01165.x. [DOI] [PubMed] [Google Scholar]
- Galletti C, Fattori P, Kutz DF, Battaglini PP. Arm movement-related neurons in the visual area V6A of the macaque superior parietal lobule. Eur J Neurosci. 1997;9:410–413. doi: 10.1111/j.1460-9568.1997.tb01410.x. [DOI] [PubMed] [Google Scholar]
- Galletti C, Fattori P, Kutz DF, Gamberini M. Brain location and visual topography of cortical area V6A in the macaque monkey. Eur J Neurosci. 1999a;11:575–582. doi: 10.1046/j.1460-9568.1999.00467.x. [DOI] [PubMed] [Google Scholar]
- Galletti C, Fattori P, Gamberini M, Kutz DF. The cortical visual area V6: brain location and visual topography. Eur J Neurosci. 1999b;11:3922–3936. doi: 10.1046/j.1460-9568.1999.00817.x. [DOI] [PubMed] [Google Scholar]
- Galletti C, Gamberini M, Kutz DF, Fattori P, Luppino G, Matelli M. The cortical connections of area V6: an occipito-parietal network processing visual information. Eur J Neurosci. 2001;13:1572–1588. doi: 10.1046/j.0953-816x.2001.01538.x. [DOI] [PubMed] [Google Scholar]
- Galletti C, Kutz DF, Gamberini M, Breveglieri R, Fattori P. Role of the medial parieto-occipital cortex in the control of reaching and grasping movements. Exp Brain Res. 2003;153:158–170. doi: 10.1007/s00221-003-1589-z. [DOI] [PubMed] [Google Scholar]
- Galletti C, Gamberini M, Kutz DF, Baldinotti I, Fattori P. The relationship between V6 and PO in macaque extrastriate cortex. Eur J Neurosci. 2005;21:959–970. doi: 10.1111/j.1460-9568.2005.03911.x. [DOI] [PubMed] [Google Scholar]
- Gallyas F. Silver staining of myelin by means of physical development. Neurol Res. 1979;1:203–209. doi: 10.1080/01616412.1979.11739553. [DOI] [PubMed] [Google Scholar]
- Gamberini M, Passarelli L, Fattori P, Zucchelli M, Bakola S, Luppino G, Galletti C. Cortical connections of the visuomotor parietooccipital area V6Ad of the macaque monkey. J Comp Neurol. 2009;513:622–642. doi: 10.1002/cne.21980. [DOI] [PubMed] [Google Scholar]
- Gamberini M, Breveglieri R, Bosco A, Fattori P, Galletti C. Functional profiles within the medial posterior parietal area V6A. Soc Neurosci Abstr. 2010;36:75–6. [Google Scholar]
- Jeannerod M. Intersegmental coordination during reaching at natural visual objects. In: Long J, Baddeley A, editors. Attention and performance. Hillsdale: Erlbaum; 1981. pp. 153–168. [Google Scholar]
- Knill DC, Pouget A. The Bayesian brain: the role of uncertainty in neural coding and computation. Trends Neurosci. 2004;27:712–719. doi: 10.1016/j.tins.2004.10.007. [DOI] [PubMed] [Google Scholar]
- Kutz DF, Fattori P, Gamberini M, Breveglieri R, Galletti C. Early- and late-responding cells to saccadic eye movements in the cortical area V6A of macaque monkey. Exp Brain Res. 2003;149:83–95. doi: 10.1007/s00221-002-1337-9. [DOI] [PubMed] [Google Scholar]
- Lewis JW, Van Essen DC. Corticocortical connections of visual, sensorimotor, and multimodal processing areas in the parietal lobe of the macaque monkey. J Comp Neurol. 2000;428:112–137. doi: 10.1002/1096-9861(20001204)428:1<112::aid-cne8>3.0.co;2-9. [DOI] [PubMed] [Google Scholar]
- Lui LL, Bourne JA, Rosa MG. Spatial and temporal frequency selectivity of neurons in the middle temporal visual area of new world monkeys (Callthrix jacchus) Eur J Neurosci. 2007;25:1780–1792. doi: 10.1111/j.1460-9568.2007.05453.x. [DOI] [PubMed] [Google Scholar]
- Luppino G, Hamed SB, Gamberini M, Matelli M, Galletti C. Occipital (V6) and parietal (V6A) areas in the anterior wall of the parieto-occipital sulcus of the macaque: a cytoarchitectonic study. Eur J Neurosci. 2005;21:3056–3076. doi: 10.1111/j.1460-9568.2005.04149.x. [DOI] [PubMed] [Google Scholar]
- McGuire LM, Sabes PN. Sensory transformations and the use of multiple reference frames for reach planning. Nat Neurosci. 2009;12:1056–1061. doi: 10.1038/nn.2357. [DOI] [PMC free article] [PubMed] [Google Scholar]
- Passarelli L, Rosa MG, Gamberini M, Bakola S, Burman KJ, Fattori P, Galletti C. Cortical connections of area V6Av in the macaque: a visual-input node to the eye/hand coordination system. J Neurosci. 2011;31:1790–1801. doi: 10.1523/JNEUROSCI.4784-10.2011. [DOI] [PMC free article] [PubMed] [Google Scholar]
- Patel GH, Shulman GL, Baker JT, Akbudak E, Snyder AZ, Snyder LH, Corbetta M. Topographic organization of macaque area LIP. Proc Natl Acad Sci U S A. 2010;107:4728–4733. doi: 10.1073/pnas.0908092107. [DOI] [PMC free article] [PubMed] [Google Scholar]
- Rozzi S, Calzavara R, Belmalih A, Borra E, Gregoriou GG, Matelli M, Luppino G. Cortical connections of the inferior parietal cortical convexity of the macaque monkey. Cereb Cortex. 2006;16:1389–1417. doi: 10.1093/cercor/bhj076. [DOI] [PubMed] [Google Scholar]
- Rozzi S, Ferrari PF, Bonini L, Rizzolatti G, Fogassi L. Functional organization of inferior parietal lobule convexity in the macaque monkey: electrophysiological characterization of motor, sensory and mirror responses and their correlation with cytoarchitectonic areas. Eur J Neurosci. 2008;28:1569–1588. doi: 10.1111/j.1460-9568.2008.06395.x. [DOI] [PubMed] [Google Scholar]
- Schall JD, Morel A, King DJ, Bullier J. Topography of visual cortex connections with frontal eye field in macaque: convergence and segregation of processing streams. J Neurosci. 1995;15:4464–4487. doi: 10.1523/JNEUROSCI.15-06-04464.1995. [DOI] [PMC free article] [PubMed] [Google Scholar]
- Sober SJ, Sabes PN. Flexible strategies for sensory integration during motor planning. Nat Neurosci. 2005;8:490–497. doi: 10.1038/nn1427. [DOI] [PMC free article] [PubMed] [Google Scholar]
- Suzuki H, Azuma M. A glass-insulated “Elgiloy” microelectrode for recording unit activity in chronic monkey experiments. Electroencephalogr Clin Neurophysiol. 1976;41:93–95. doi: 10.1016/0013-4694(76)90218-2. [DOI] [PubMed] [Google Scholar]
- van Beers RJ, Wolpert DM, Haggard P. When feeling is more important than seeing in sensorimotor adaptation. Curr Biol. 2002;12:834–837. doi: 10.1016/s0960-9822(02)00836-9. [DOI] [PubMed] [Google Scholar]
- Van Essen DC, Drury HA, Dickson J, Harwell J, Hanlon D, Anderson CH. An integrated software suite for surface-based analyses of cerebral cortex. J Am Med Inform Assoc. 2001;8:443–459. doi: 10.1136/jamia.2001.0080443. [DOI] [PMC free article] [PubMed] [Google Scholar]
- Yu HH, Verma R, Yang Y, Tibballs HA, Lui LL, Reser DH, Rosa MG. Spatial and temporal frequency tuning in striate cortex: functional uniformity and specializations related to receptive field eccentricity. Eur J Neurosci. 2010;31:1043–1062. doi: 10.1111/j.1460-9568.2010.07118.x. [DOI] [PubMed] [Google Scholar]