

Abstract
Hyperpolarization-activated cyclic nucleotide-gated (HCN) channels generate a pacemaking current, Ih, which regulates neuronal excitability and oscillatory activity in the brain. Although all four HCN isoforms are expressed in the brain, the functional contribution of HCN3 is unknown. Using immunohistochemistry, confocal microscopy, and whole-cell patch-clamp recording techniques, we investigated HCN3 function in thalamic intergeniculate leaflet (IGL) neurons, as HCN3 is reportedly preferentially expressed in these cells. We observed that Ih recorded from IGL, but not ventral geniculate nucleus, neurons in HCN2+/+ mice and rats activated slowly and were cAMP insensitive, which are hallmarks of HCN3 channels. We also observed strong immunolabeling for HCN3, with no labeling for HCN1 and HCN4, and only very weak labeling for HCN2. Deletion of HCN2 did not alter Ih characteristics in mouse IGL neurons. These data together indicate that the HCN3 channel isoform generated Ih in IGL neurons. Intracellular phosphatidylinositol-4,5-bisphosphate (PIP2) shifted Ih activation to more depolarized potentials and accelerated activation kinetics. Upregulation of HCN3 function by PIP2 augmented low-threshold burst firing and spontaneous oscillations; conversely, depletion of PIP2 or pharmacologic block of Ih resulted in a profound inhibition of excitability. The results indicate that functional expression of HCN3 channels in IGL neurons is crucial for intrinsic excitability and rhythmic burst firing, and PIP2 serves as a powerful modulator of Ih-dependent properties via an effect on HCN3 channel gating. Since the IGL is a major input to the suprachiasmatic nucleus, regulation of pacemaking function by PIP2 in the IGL may influence sleep and circadian rhythms.
Introduction
Hyperpolarization-activated cyclic nucleotide-gated (HCN) channels generate a pacemaking current, Ih, which regulates neuronal excitability and oscillatory activity in the brain (Robinson and Siegelbaum, 2003; Biel et al., 2009). Examination of HCN expression patterns, and the effects of gene deletion, reveals significant roles for some subunits expressed in the brain. For example, HCN1 regulates motor learning and spatial memory (Nolan et al., 2003, 2004), while HCN2 regulates thalamic excitability associated with absence seizures (Ludwig et al., 2003; Ying et al., 2007b). The function of brain HCN3, however, has remained elusive (Herrmann et al., 2007).
HCN channel gating is controlled by both ligand and voltage (Frère et al., 2004; Biel et al., 2009). Ligand-mediated gating constitutes a major pathway for native channels, as evidenced by a large hyperpolarizing shift (−40 to −60 mV) in voltage dependence due to loss of intracellular regulatory factors, including cAMP and phosphatidylinositol-4,5-bisphosphate (PIP2) (Pian et al., 2006; Zolles et al., 2006); cAMP and PIP2 facilitate gating for three HCN (1, 2, and 4) subunits. Gating of recombinant HCN3 channels, however, is not enhanced by cyclic nucleotides (Mistrík et al., 2005; Stieber et al., 2005), and their sensitivity to PIP2 is unknown. Although native “HCN3 currents” are reported for the rat entopeduncular nucleus (Meurers et al., 2009), strong expression of HCN2 in this nucleus (Notomi and Shigemoto, 2004) makes it difficult to identify properties of natively expressed HCN3 channels. Thus, the behavior or function of native HCN3 channels remains unknown.
The thalamic IGL is a nucleus interposed between the thalamic dorsal and ventral lateral geniculate nuclei (Moore and Card, 1994), which acts to regulate circadian rhythms generated by the suprachiasmatic nucleus (Morin and Allen, 2006). In the rat IGL, expression of HCN3 is so strong as to nearly exclude the other HCN isoforms (Notomi and Shigemoto, 2004). Despite more than two decades of intensive study, a clear description of the ion channels underlying the regulation of firing activity in this region is surprisingly lacking (Szkudlarek and Raastad, 2007). Consequently, study of Ih in IGL neurons could offer the first description of the biophysical properties and physiological functions of neuronal HCN3 channels.
We first examined HCN expression in the mouse and rat IGL using immunohistochemistry and confocal microscopy, as detailed information is lacking on cellular distributions of HCN isoforms in IGL neurons. We observed strong immunolabeling for HCN3, and there was no labeling for HCN1 or HCN4, and only very weak HCN2 labeling, in either species. We then focused on characterization of the presumptive HCN3 channel-mediated Ih current in IGL neurons. To better identify the biophysical properties and regulation of native HCN3 channels, we examined Ih in both wild-type and HCN2−/− (knock-out) mice. Ih recorded in all IGL neurons exhibited biophysical properties that closely resembled those of recombinant HCN3 channels. Importantly, PIP2 enhanced function of natively expressed HCN3 channels, and this regulation exerted profound control over IGL excitability. Preliminary data have previously been published (Ying et al., 2007a).
Materials and Methods
Animals.
Sprague Dawley rats were obtained from Charles River; HCN2−/− mice were rederived at Weill Medical College (New York) from an established line (Ludwig et al., 2003), and mice were genotyped by Transnetyx as previously described (Ying et al., 2007b). Rats and mice were housed under a 12:12 light/dark cycle (light on at 8:00 A.M.); animals were killed after anesthesia between 10:00 and 11:00 A.M. for all experiments, and electrophysiological recordings were made between 1:00 and 7:00 P.M. Experiments were performed in accordance with institutional and federal guidelines.
Brain slice electrophysiology.
Brain slice preparation was previously described in detail (Ying and Goldstein, 2005), with the method slightly modified for this study. Briefly, mice or rats (P40–P70) of either sex were anesthetized with isoflurane and decapitated. Coronal slices containing the IGL were cut on a microslicer (VT 1000S; Leica) using ice-cold slicing solution saturated with 95% O2–5% CO2. The slicing solution contained (in mm) 2 KCl, 26 NaHCO3, 1.25 NaH2PO4, 240 sucrose, 12 glucose, 2 MgSO4, 1 MgCl2, and 1 CaCl2. Two-hundred-micrometer sections were used for intracellular biocytin filling, while 300 μm sections were used for all other recordings. The sections were cut into two halves along the midline, incubated at 34°C for 1 h, and kept at room temperature for at least another 1 h before use. Slices were perfused with carbogenated ACSF, which contained (in mm) 126 NaCl, 26 NaHCO3, 3.6 KCl, 1.2 NaH2PO4, 1.2 MgCl2, 2 CaCl2, and 17 glucose. To isolate Ih currents, we used an “Ih isolation solution” with the following added to ACSF (in mm): 0.001 tetrodotoxin (TTX), 1 BaCl2, 0.1 NiCl2, 0.04 d-(−)-2-amino-5-phosphonopentanoic acid (d-AP5), and 0.02 6-cyano-7-nitroquinoxaline-2,3-dione (CNQX). Normal pipette solution contained (in mm) 135 K+-gluconate, 5 NaCl, 10 HEPES, 0.5 EGTA, 3 K2-ATP, 0.2 Na-GTP, and 10 Na2-phosphocreatine, pH adjusted to 7.3 with KOH.
Whole-cell voltage- and current-clamp recordings were performed as described previously (Ying and Goldstein, 2005; Ying et al., 2006, 2007b). Briefly, brain slices were visualized using a Nikon microscope equipped with a 4× objective and a 40× water-immersion objective. The IGL structure and recording sites for IGL neurons were identified using standard mouse (Franklin and Paxinos, 2007) or rat (Paxinos and Watson, 1998) brain atlases. Recordings were made at 23–24°C for experiments in Figures 2–7 or 30°C for data presented in Figure 8. Electrical signals were obtained using a Multiclamp 700B amplifier connected to an interface using Clampex 10.2 (Molecular Devices). Access resistance (Ra) and capacitance were compensated after a whole-cell configuration was established, and were monitored throughout recordings; data were discarded if either of the two parameters changed by >20% of the original values. Liquid junction potentials were calculated and corrected offline (Ying and Goldstein, 2005). For recordings of Ih, neurons were voltage clamped at −50 mV, and voltage steps were applied from −50 to −130 mV (10 s, 10 mV/step).
Figure 2.

Deletion of HCN2 does not alter properties of Ih recorded from IGL neurons. A (mouse), B (rat), Representative images for the IGL in live brain slices, as marked by white dotted lines; images for IGL neurons that were intracellularly biocytin-filled and fluorescently labeled (green). Scale: horizontal bars, 0.5 mm; vertical bars, 10 μm. C–E, Exemplar Ih current traces were recorded from regions as indicated, and were blocked by ZD7288 (50 μm). The same voltage protocol (−130 mV, 10 s, VH = −50 mV) was used for recordings in all neurons here. F, Bar graph for current density. *p < 0.001, HCN2−/− versus HCN2+/+ for vLGN neurons. G, Bar graph for activation time constant (Tauactivation). *p < 0.001, one-way ANOVA with pairwise comparisons, n = 10/each.
Figure 3.
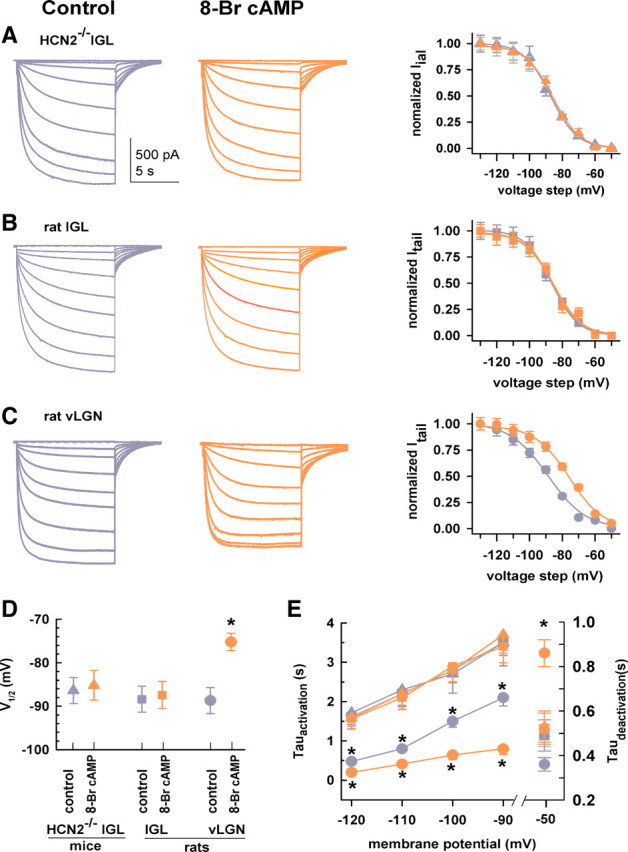
Ih in IGL neurons exhibits the hallmark of HCN3 channels. A–C, Families of current traces from an HCN2−/− mouse IGL neuron (A), rat IGL neuron (B), and a rat vLGN neuron (C). The same protocol was used for all recordings (−50 to −130 mV, −10 mV/step, 10 s, VH = −50 mV). 8-Br cAMP (200 μm) was applied by superfusion in this and following figures. Color for all panels: Dark gray for control; orange for 8-Br cAMP. Normalized tail currents (Itail) are plotted as a function of voltage steps and are fit with the Boltzmann equation (right). Symbols for all panels: triangles, HCN2−/− IGL; squares, rat IGL; circles, rat vLGN. D, Group data showing effects of 8-Br cAMP on V1/2 (mV). *p < 0 0.05, 8-Br cAMP vs control for rat vLGN neurons. E, Time constants of activation (Tauactivation) and deactivation (Taudeactivation) in the absence and presence of 8-Br cAMP. *p < 0 0.05, cAMP versus control in rat vLGN neurons; one-way ANOVA, n = 15/each.
Figure 4.
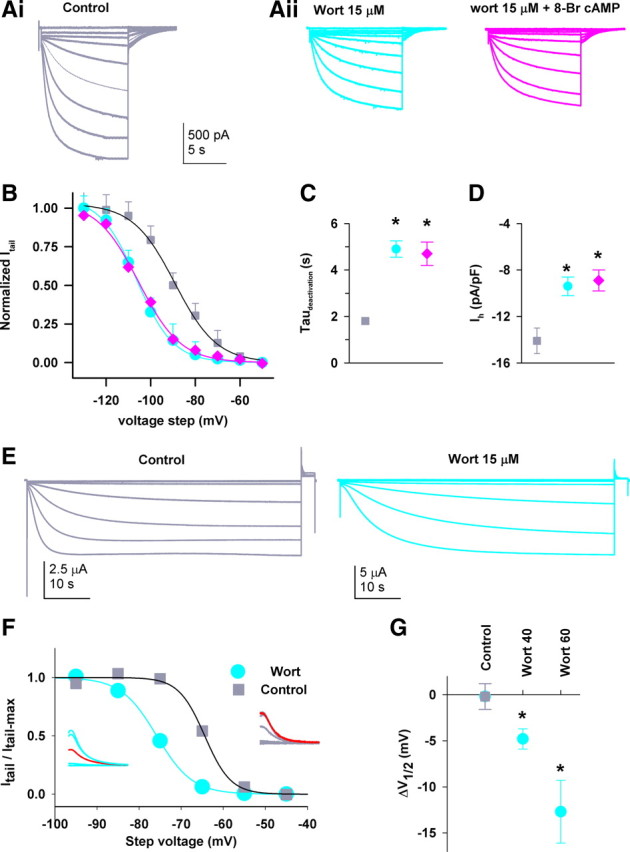
Depletion of endogenous PIP2 produces a hyperpolarizing shift in activation of native and recombinant HCN3 channels. A, Exemplar Ih traces recorded from IGL neurons preincubated for 40–50 min in (Ai, control) or wortmannin (Aii, wort) before or after superfusion with 200 μm 8-Br cAMP. B, Group data showing steady-state activation curves. Lines are fit using a Boltzmann function to normalized tail currents, yielding the V1/2 and slope factor (both in mV) of −89.2 ± 2.4 and 9.4 ± 1.1 for control (squares); −106.3 ± 3.5 and 8.2 ± 1.1 for wortmannin alone (circles); −105.6 ± 2.6 and 9.4 ± 0.9 for wortmannin + 8-Br cAMP (diamonds). Colored symbols used here represent the same conditions in subsequent panels for IGL neurons. There is a significant difference in V1/2 values between control and wortmannin groups, p < 0.001, t test, n = 22. C, D, Effect of the drugs on the activation time constant (at −110 mV (C) and the current density at −130 mV (D). Almost identical effects are observed in IGL neurons from rats (n = 8) and HCN2−/− mice (n = 10), and the two datasets were pooled. *p < 0.05, compared to control. E, HCN3 current traces recorded from intact oocytes following incubation in either control solution (which contains DMSO) (left) or wortmannin (right). F, Effects of wortmannin on steady-state activation curves; inset shows representative tail currents (left, wortmannin and right, control); red traces at −75 mV are for comparison. G, Negative shift in the V1/2 of HCN3 channel activation following incubation with vehicle DMSO (control, n = 10) or wortmannin for 40 (n = 10) or 60 (n = 4) min. Vehicle controls were indistinguishable from the controls in the absence of DMSO (data not shown) in all experiments. The wortmannin-treated populations were significantly different from vehicle control and each other (*p < 0.05, vs control, one-way ANOVA with a Holm–Sidak post hoc test).
Figure 5.
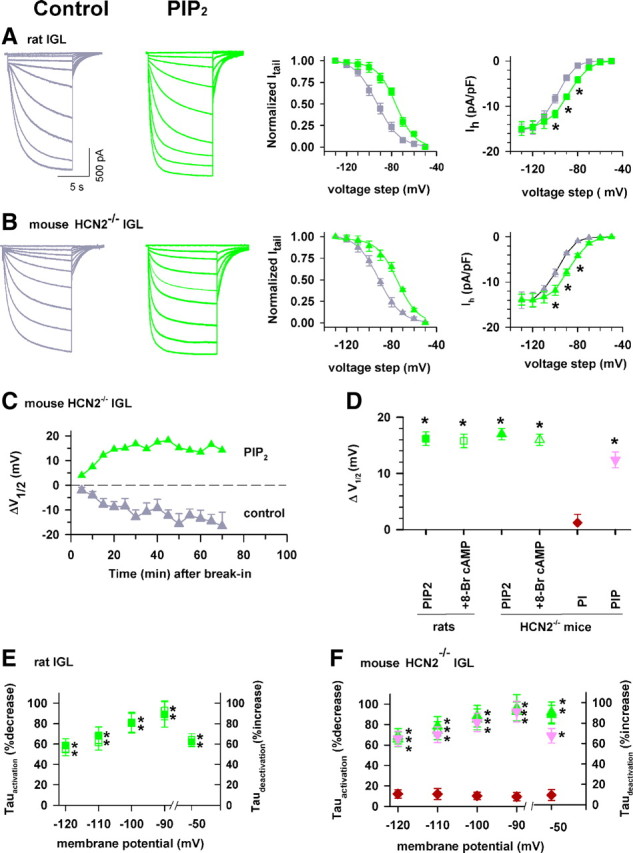
PIP2 enhances opening of Ih channels in IGL neurons. A, B, Current traces recorded from rat (A) and HCN2−/− mouse (B) IGL neurons in normal (control, dark gray) and PIP2 (10 μm, green)-containing intracellular solution. Activation curves for each neuron type are shown to the right. PIP2 shifts the V1/2 to a more depolarized potential and increases current density at physiological relevant membrane potentials (*p < 0.05). Symbols: squares for rat IGL and triangles for HCN2−/− IGL in the absence (gray) and presence of PIP2 (green) here and in subsequent panels. C, Time course for changes in V1/2 values in control and PIP2. Time 0 represents time immediately after break-in, and the dash line indicates 0 mV shift; n = 4/each point. D, Group data summarizing drug-induced changes in V1/2 values. 8-Br cAMP (200 μm) was added by superfusion ∼15 min after PIP2 dialysis through the recording pipette. Symbols for each treatment are indicated at bottom. E, F, Group data showing effects of drugs on activation and deactivation kinetics. Data from rat IGL neurons are shown in E, while data from HCN2−/− mice are shown in F. Symbols are the same as in D. *p < 0.05, one-way ANOVA (* for each condition, as compared to corresponding control), n = 10/each.
Figure 6.
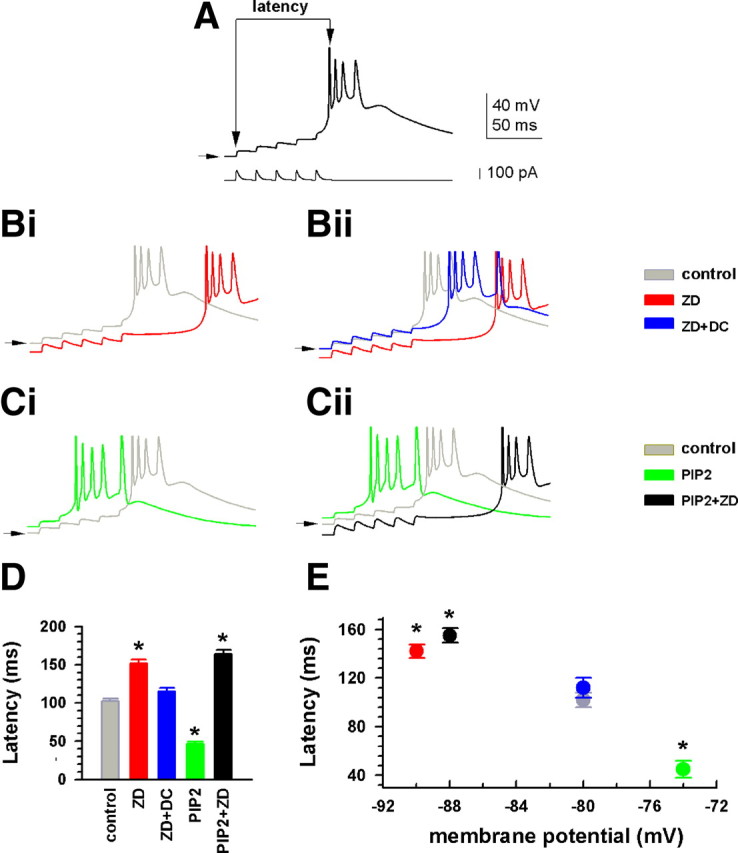
PIP2 increases Ih-dependent burst firing in IGL neurons. A, Intrinsic temporal summation producing burst firing was initiated by intracellular injection of a train containing five current pulses (100 pA); the protocol shown at bottom was previously described (Ying et al., 2005). EPSC-shaped current pulses were generated with the following function: I(t) = A × (1 − e−t/τrise)n e−t/τdecay, where A is the infinite time amplitude of the current (in picoamperes), n is an integer, and τrise (0.5 ms) and τdecay (5 ms) are rising and falling time constants, respectively (Magee, 1998). The latency was measured as indicated by vertical arrows. The horizontal arrow indicates the holding membrane potential of −80 mV in control before injection of the train in all panels. Bi, Overlay showing comparison of response to ZD7288 (ZD, 30 μm) to control in the same neuron as in A. Bii, Overlay showing effects of ZD7288 and ZD7288 plus DC compensation. Ci, In a different neuron, the control response was recorded within 50 s of obtaining the whole-cell configuration [before dialysis of PIP2 (10 μm) into the cell]. Cii, Overlay showing comparison of control, PIP2 (after 15 min dialysis) and PIP2 plus ZD7288 (30 μm). D, Bar graph showing effects of drugs on the latency of burst onset. E, Plot showing dependence of the latency on membrane potential. *p < 0.01, versus control, Tukey test; n = 14, 6, and 6 for control, ZD7288, and PIP2, respectively. Horizontal error bars are not shown for clarity. Symbol colors correspond to bar colors in D.
Figure 7.

Upregulation of HCN channel function facilitates rebound burst firing in HCN2−/− IGL neurons. A–C, Rebound bursts were elicited in IGL neurons using a hyperpolarizing current pulse (see Materials and Methods) in the absence (gray) and presence of ZD7288 (ZD, red), wortmannin (wort, cyan), or PIP2 (green); drugs were applied as in Figure 6. The membrane potential was held at −60 mV by DC injection before the current pulse was applied; traces are overlaid for comparison between control and drug. A short horizontal bar indicates the segment shown on an expanded time scale for better viewing of rebound delay. Calibration: 500 ms for main traces and 30 ms for insets. D, Bar graph summarizing effects of drugs on the number of action potentials/burst. E, The sag amplitude is plotted against rebound delay. Symbols: gray circle, control; green triangle, PIP2; cyan square, wortmannin (wort); red circle, ZD7288. SEs for rebound delay are small (±2.2 to ±3 ms) and are omitted for clarity. *p < 0.05, one-way ANOVA versus control (n = 24), n = 8/each for drug.
Figure 8.
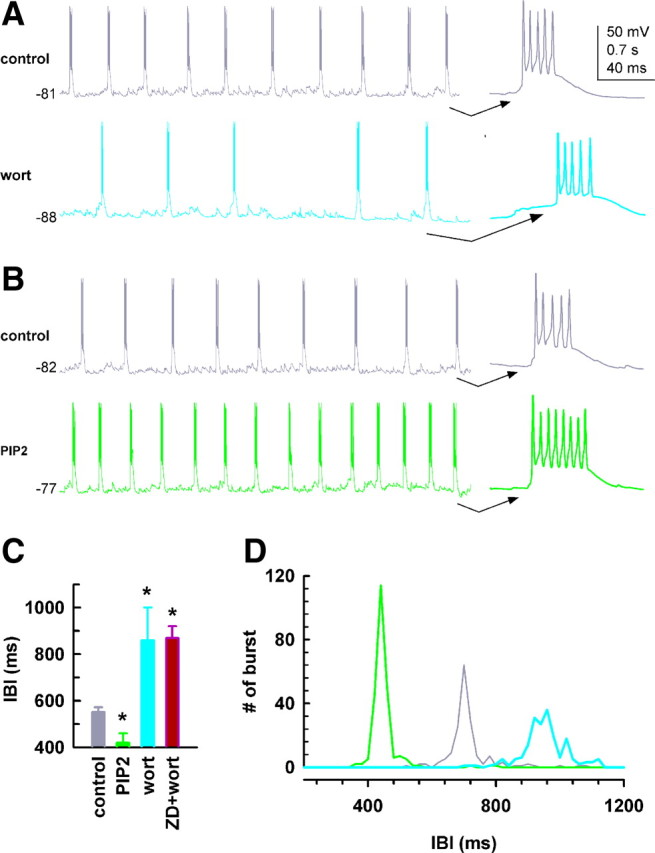
PIP2 is required for spontaneous LTS oscillations in HCN2−/− IGL neurons. A, Rhythmic burst firing of low-threshold spikes (LTSs) was recorded in IGL neurons in the absence (dark gray) and presence of wortmannin (15 μm, cyan). The last burst in each trace is shown on an expanded time scale (right). Membrane potential (in millivolts) is shown to the left of each trace. B, PIP2 (10 μm, green) in the recording pipette. C, Bar graph summarizing effects of drugs on IBI. ZD7288 (30 μm) was applied by superfusion. *p < 0.05, one-way ANOVA, versus control, n = 6/each. D, The number of bursts is plotted against IBI to show the regularity of burst firing; each trace is the average of 6 cells. SEs are omitted for clarity.
Study of voltage sag was performed using a protocol similar to the one that we previously described (Ying et al., 2006). We compared the sag amplitude between control and drug since membrane resistance varies from cell to cell and markedly changes following block of Ih. Sag amplitude is voltage dependent if the Ih conductance is present or not blocked (Ying et al., 2006), and thus comparison of the sag amplitude is valid at a similar degree of transient membrane hyperpolarization. In the present study, the control voltage response was elicited by injection of a current pulse of −60 pA (500 ms), and then followed by a series of smaller pulses (−10 pA/step) until the membrane was hyperpolarized to approximately −125 mV. A similar degree of peak membrane hyperpolarization during application of ZD7288 or wortmannin was generated by adjusting the injected current. This approach was adopted to prevent “over-hyperpolarization” elicited by current pulse injection during drug application. Since all IGL neurons studied here had a high input resistance (Rin > 500 MΩ), and Rin was much higher in the presence of either ZD7288 or wortmannin, patched neurons were generally lost if identical pulse intensity was applied during drug application. For experiments with PIP2, which altered Rin to a lesser degree, the peak voltage response in control was also near −125 mV; identical current intensity was applied before and after drug application. Drug effects were analyzed by comparing difference between drug and control. Steady-state input resistance was measured from voltage response elicited by injecting a small hyperpolarizing current pulse (−30 pA, 500 ms) in the absence and presence of drug.
Oocyte electrophysiology.
Subcloning and expression of hHCN3 were performed much as previously described (Goulding et al., 1993; Wainger et al., 2001). Thus, PCR amplification was used to introduce an XbaI site and idealized Kozak sequence (TCTAGAGCCGCCACC) immediately 5′ to the initiating methionine of the ORF of hHCN3 and a HinDIII site immediately 3′ to the stop codon. Following XbaI–HindIII subcloning into the high-expression pGHE vector, the amplified fragment was fully sequenced on both strands. cRNA was transcribed using T7 (Message Machine, Ambion). Recordings were made from Xenopus oocytes 30–48 h after injection with 50–100 ng of cRNA. Cells were maintained in L-15 media without Ficoll (Specialty Media) at 17°C until use.
Two-electrode voltage-clamp (TEVC) recordings were performed as previously described (Santoro et al., 2000; Fogle et al., 2007), except here the wide bandwidth output of the clamp was filtered at 2.5 kHz with a Frequency Devices 902 8-pole Bessel filter then digitized at 5 kHz and the bath solution for recording was (in mm): 87 NaCl, 25 KCl, 2 MgCl2, 10 HEPES-free acid pH 7.4 (NaOH). Briefly, cells were held at −30 mV and channels activated by hyperpolarizing steps applied in −10 mV intervals. Tail currents were recorded at 0 mV and their amplitudes determined as the difference between the plateau current (observed after the voltage clamp had settled and the uncompensated linear capacitance decayed but before marked channel closure) and the baseline current (observed after deactivation was complete).
Immunohistochemistry.
Rats and mice (P40–P60) were used for this study; immunolabeling experiments and image analyses were performed much as previously described (Abbas et al., 2006; Ying et al., 2006 and 2007b). Briefly, coronal sections (30 μm) containing the IGL were cut using a microslicer as described above. Free-floating slices were permeabilized with 0.1% Triton X-100 in 0.1 m PBS for 30 min, and processed for immunofluorescence labeling. Rabbit primary antibodies used to detect immunoreactivity (IR) for the corresponding HCN isoforms were as follows: anti-HCN1 (1:50 dilution, AB5884; Millipore Bioscience Research Reagents), anti-HCN2 and anti-HCN4 (1:40 dilution; Alomone Laboratories), and anti-HCN3 (1:50 dilution, Alpha Diagnostics). The staining for HCN antibodies was intensified using two secondary antibodies (monovalent fab fragments of goat anti-rabbit FITC; 1:100, Jackson ImmunoResearch Laboratories; donkey anti-goat IgG Alexa 488; 1:500, Invitrogen). Negative staining controls were performed by substitution of nonimmune serum for primary antibodies.
Staining for neuropeptide Y (NPY) in the IGL is much stronger than that for surrounding regions (Card and Moore, 1989; Morin et al., 1992; Moore and Card, 1994; Thankachan and Rusak, 2005). In our experiments, the NPY-labeled IGL (see Fig. 1) appeared as a small band interposed between the dorsal and ventral lateral geniculate nuclei (dLGN and vLGN) in coronal sections from both rat and mouse brains. NPY-positive neurons were labeled using anti-NPY rabbit antibody (1:500 dilution, T-4454; Peninsula Laboratories). The secondary antibody was donkey anti-rabbit Rhodamine Red-X IgG (1:100 dilution, Jackson ImmunoResearch).
Figure 1.
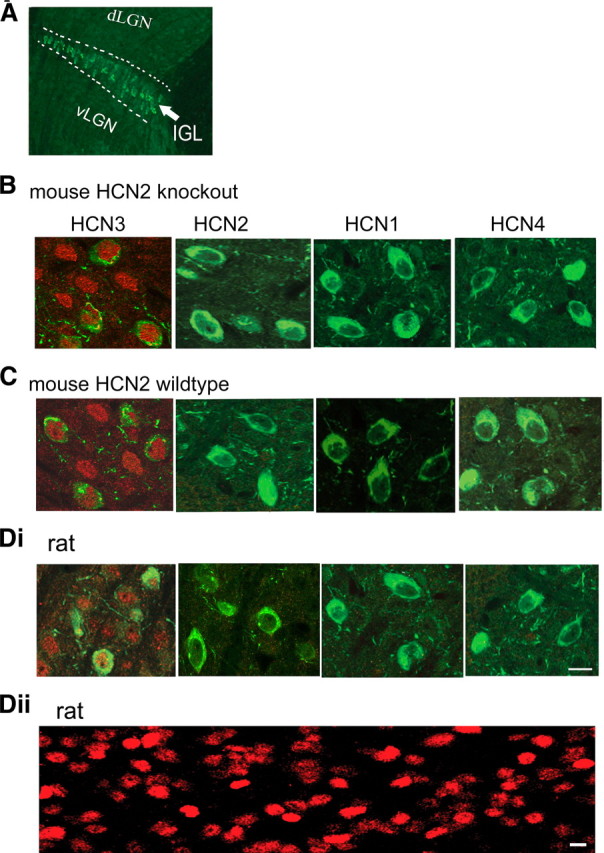
HCN3 is densely expressed in the IGL. A, A representative image of the IGL in a HCN2−/− mouse brain slice (30 μm); the IGL is marked by white dashed lines. NPY staining (green) as a marker for the IGL. B, C, Merged images showing immunolabeling for NPY (green) and HCN (red) in IGL neurons in the mouse (B, C) and the rat (Di, Dii), as indicated. Dii, HCN3-IR in a thick section (200 μm) from the rat. Images in B, C, and Di are from thin sections (30 μm). Note that dense labeling for HCN3 was present on the soma of both NPY-positive and -negative IGL cells in sections from both mice and rats; labeling for other 3 isoforms was essentially absent. Scale bar: 10 μm for all images in B–D.
Intracellular biocytin labeling of IGL neurons.
The intracellular biocytin filling method was previously described (Ying and Goldstein, 2005) with a modification for this study. Briefly, IGL neurons were filled with 0.2% biocytin (in the pipette solution) during whole-cell voltage-clamp recordings. After recordings were completed, the recording pipette remained in place for ∼15 min to permit sufficient diffusion of biocytin, and then was gently withdrawn from the cell body. Slices were placed in ice-cold 4% paraformaldehyde in 0.12 m PBS at 4°C overnight. Floating sections were washed several times in 0.12 m PBS at room temperature to remove any residual paraformaldehyde. Slices were blocked overnight in 10% donkey serum (prepared in 0.25% Triton X-100 and 0.03 m PBS), and then incubated overnight at 4°C with the antibody Rhodamine Red-X-Streptavidin (1:200, Jackson ImmunoResearch) prepared in 0.1% Triton X-100 and 0.1 m PBS. After washing with 0.1 m PBS, anti-HCN3 and anti-NPY antibodies were applied sequentially. All primary and secondary antibodies were prepared in 0.25% Triton X-100 and 0.03 m PBS. Slices were incubated with anti-HCN3 antibody for two nights at 4°C, and staining was intensified using secondary antibodies as described above. Subsequently, anti-NPY antibodies (two nights at 4°C) and secondary antibodies (donkey anti-rabbit Cy5 IgG; 1:500; Jackson ImmunoResearch) were applied for 4 h at room temperature. Biocytin-filled and fluorescently stained neurons were visualized and images were captured using a laser-scanning confocal microscope system. Z-sectioning was performed at 1.0 μm intervals, and stacks of optical sections in the z-axis were acquired. Images were processed for figure preparation using Adobe Photoshop V.9 (Adobe Systems).
Drugs.
ZD7288, CNQX, d-AP5, TTX, gabazine, and 8-Br cAMP were dissolved in water, and diluted with ACSF. Wortmannin was dissolved in DMSO (15 mm), and was diluted with ACSF. The final concentration for DMSO in control was (v/v) 0.1% (in slice experiments) and 0.04% (in oocyte experiments); at these concentrations, the vehicle had no effect on current or voltage responses. Drugs were from Tocris Bioscience unless otherwise noted; TTX was from Alomone Labs, PIP2 (l-α-phosphatidylinositol-4,5-bisphosphate), PIP (l-α-phosphatidylinositol-4-phosphate), and PI (l-α-lysophosphatidylinositol) were from Avanti Polar Lipids. The phosphoinositides were dispersed by sonication in water (stock solution: 1 mm) in an ice-cold chamber for 30 min, divided into aliquots, and then kept at −80°C. Before patch recordings the stock solution was thawed, diluted to 10 μm in intracellular solution, and sonicated again for 20 min before use.
Data analysis.
Data processing including the construction of activation curves, fit of time constants, and measurements of sag, burst and tonic spike firing was performed using MiniAnalysis (Synaptosoft) and Clampfit V.10, as previously described for neurons (Ying and Goldstein, 2005; Ying et al., 2006, 2007b). Data analyses for oocyte recordings were performed using PulseFit (HEKA Elektronik) and IgorPro (Wavemetrics, as previously reported (Santoro et al., 2000; Wainger et al., 2001; Fogle et al., 2007). Single-exponential time constants were obtained by fitting the first 4 s of the neuronal current trace (cf. Frère and Lüthi, 2004). Data are presented as mean ± SEM; statistical significance was determined using Student's t test or one-way ANOVA with pairwise comparisons as appropriate.
Results
DAB labeling has previously been used to demonstrate that HCN3 is expressed to the near exclusion of the other isoforms in the rat IGL (Notomi and Shigemoto 2004). We hypothesized that if the mouse IGL expressed dense HCN3, with HCN1 and HCN4 being absent (similar to the expression pattern in rats), then using IGL neurons from HCN2−/− mice would provide a model in which we could measure an essentially pure HCN3-mediated current. As HCN2 deletion does not produce compensatory upregulation in the other isoforms [see below and also Ludwig et al. (2003) and Ying et al. (2007b)], we focused primarily on properties of Ih currents from HCN2−/− IGL neurons.
HCN3 expression in IGL neurons
Confocal laser-scanning images at high magnification showed very dense immunoreactivity (IR) for HCN3 in HCN2−/− IGL neurons (Fig. 1B). The IR signal was observed on the soma of NPY-stained neurons, and similar somatic-shaped labeling appeared where there were no NPY-positive somata. These labeling patterns indicate that both NPY-positive and -negative IGL neurons similarly expressed the HCN3 isoform. Little, or no, punctate labeling was observed in the neuropil, suggesting that a nonsomatic expression pattern, if any, was very weak. HCN3-IR was found within, but not outside, the IGL in all slices from three HCN2−/− mice. Labeling for HCN1, HCN2, and HCN4 was absent from IGL neurons in these mice. HCN2+/+ IGL neurons showed a similar distribution pattern for HCN3 (Fig. 1C), and very little labeling for HCN2 was observed. Labeling for HCN1 and HCN4 was completely absent in all slices from three HCN2+/+ brains.
Rat IGL neurons also expressed very dense HCN3-IR (Fig. 1Di,Dii); similar to the mouse IGL, little punctate labeling for HCN3 was observed in the neuropil. Only weak HCN2-IR was visible in these neurons, while no labeling for HCN1 or HCN4 could be detected in any slices from three rat brains. These data are in agreement with previous observations for rat HCN expression (Notomi and Shigemoto, 2004).
In summary, very dense immunoreactivity for HCN3 was present in IGL neurons from HCN2−/− mice, and similar HCN3-IR signals were observed from IGL neurons from wild-type mice and rats, while HCN2 immunolabeling was weak or absent in IGL neurons from non-genetically modified animals. Deletion of HCN2 did not upregulate the other three isoforms in any of the brain slices.
Deletion of HCN2 does not alter Ih properties in IGL neurons
Only brain slices in which the IGL was clearly visible were used for recordings; representative images of slices containing the IGL are shown in Figure 2, A and B. Whole-cell voltage-clamp recordings showed that IGL neurons from HCN2−/− mice generated a slowly activating current in response to a large hyperpolarizing pulse (−130 mV, 10 s, VH = −50 mV); examples are shown in Figure 2C. HCN2+/+ IGL neurons generated a current with properties similar to those from HCN2−/− neurons, strongly suggesting that HCN2 channels are not involved (Fig. 2C,F,G). Pooled data indicate that deletion of HCN2 did not alter the activation time constant (HCN2−/−: 1.12 ± 0.12 s; HCN2+/+: 1.15 ± 0.11; n = 10/each group, p > 0.05) or current density (HCN2−/−: −14.2 ± 1.6 pA/pF, HCN2+/+: −14.5 ± 1.4 pA/pF, p > 0.05) in the IGL neurons studied (Fig. 2F,G). The current observed in both genotypes could be abolished by the specific Ih blocker ZD7288 (50 μm).
Intracellular biocytin labeling confirmed that somata of the recorded neurons were localized within the IGL (10 cells/each genotype for mice and 10 cells for rats). Morphologically, IGL neurons were variable in somatic size (7–14 μm in longest diameter) and the number of their dendrites (3–6) regardless of species. These neurons mostly appeared multipolar; representative confocal laser scanning images for labeled IGL neurons are shown in Figure 2, A and B. The morphology of these neurons does not appear to correlate with Ih properties (either density or kinetics), consistent with previously reported data (Szkudlarek and Raastad, 2007). In another set of experiments, neurons in the rat IGL were identified as NPY positive or negative; there was no significant difference in the kinetics or Ih density between NPY-positive and NPY-negative cells (n = 6/each, data not shown).
We also studied Ih properties of rat IGL neurons since the rat IGL has intense HCN3 immunolabeling, as shown in Figure 1D. Indeed, these neurons generated a robust Ih (Fig. 2E); their activation kinetics (1.19 ± 0.13 s, n = 8) and the current density (15.3 ± 1.5 pA/pF) were not statistically different from those seen in mouse IGL neurons from either genotype (Fig. 2F,G).
The observed slow kinetics of IGL neurons were not due to rundown or effects of biocytin in the recording pipette, as all recordings were completed within 40 s after whole-cell configuration was established. To confirm that the observed activation kinetics were nucleus specific due to their HCN subunit composition, we also studied Ih in vLGN neurons. We chose the vLGN as a positive control, as HCN2 is the predominant HCN isoform in this region (Notomi and Shigemoto, 2004). In HCN2+/+ mice, the activation time constant in vLGN neurons was much faster than that of IGL neurons (vLGN: 0.3 ± 0.04 s, IGL: 1.15 ± 0.1 s, p < 0.001, n = 10/each) (Fig. 2G). In contrast to IGL neurons, HCN2 deletion dramatically decreased Ih density (in −pA/pF) in vLGN neurons (HCN2+/+: 19.8 ± 1.9 vs HCN2−/−: 5.6 ± 0.6, p < 0.001) (Fig. 2F) and significantly increased the activation time from 0.3 ± 0.04 s to 0.92 ± 0.05 s (p < 0.05) (Fig. 2G).
In summary, the characteristics of IGL and vLGN Ih clearly reflect differences in HCN subunit expression between the two nuclei. The insensitivity of IGL Ih to HCN2 deletion, in conjunction with dense HCN3 labeling in that nucleus, suggests that Ih in IGL neurons is mediated by a pure population of HCN3 channels, whereas Ih in vLGN is mediated primarily by HCN2, and this interpretation was further tested in the next set of experiments.
cAMP insensitivity of Ih in IGL, but not vLGN, neurons
Distinct cAMP response patterns have been found for HCN channel subtypes and proven useful for identification and characterization of Ih generated by HCN subunits (Mistrík et al., 2005; Stieber et al., 2005) [for review, see Gauss and Seifert (2000) and Robinson and Siegelbaum (2003)]. Consequently, we tested cAMP modulation of Ih in IGL neurons.
A family of current traces was elicited in IGL neurons by hyperpolarizing voltage steps ∼10 min after whole-cell configuration was established. Representative Ih traces are shown in Figure 3, A (mouse) and B (rat). Bath application of the nonhydrolyzable and membrane-permeable cAMP analog 8-Br cAMP (200 μm) had no effects on voltage-dependent activation or the activation kinetics in IGL neurons. Activation curves are shown for each neuronal type in Figure 3. Analysis of tail currents for steady-state activation yielded a V1/2 (in millivolts) of −86.4 ± 3.1 for control and −85.2 ± 2.8 in the presence of 8-Br cAMP in HCN2−/− IGL neurons (Fig. 3A,D); in rat IGL neurons, V1/2 was −88.4 ± 3.5 for control and −87.4 ± 3.2 in the presence of 8-Br cAMP (Fig. 3B,D). The slope factor (in millivolts) was similar in these neurons before (HCN2−/− IGL, 9.6 ± 1.4; rat IGL, 9.5 ± 0.9) and after (HCN2−/− IGL, 9.2 ± 1.3; rat IGL, 9.1 ± 1.5) 8-Br cAMP application. The time constants of activation and deactivation were analyzed; 8-Br cAMP had no effect on the kinetics of channel activation or deactivation in IGL neurons (Fig. 3E). These data clearly indicate that 8-Br cAMP failed to alter voltage dependence or the time constant in IGL neurons from HCN2−/− mice and rats (Fig. 3D,E). Consistent with a lack of a contribution of HCN2 to Ih in IGL neurons, HCN2+/+ IGL neuron Ih was also insensitive to 8-Br cAMP (n = 6, not shown).
In contrast to IGL neurons, rat vLGN neurons were highly sensitive to modulation by 8-Br cAMP as superfusion of 8-Br cAMP markedly shifted voltage-dependent activation to more depolarized potentials (from −88.8 ± 1.2 mV to −74.2 ± 0.6 mV) (Fig. 3C,D) without significantly changing the slope factor (control, 11.2 ± 1.2 mV; 8-Br cAMP, 10.8 ± 0.7 mV). 8-Br cAMP significantly decreased the activation time constant (Fig. 3E), and significantly increased the deactivation time constant. The observed effects on the kinetics are consistent with cAMP-mediated stabilization of a cAMP-sensitive channel (such as HCN2) in the open state (Wainger et al., 2001; Wicks et al., 2011). The pronounced effect of 8-Br cAMP on Ih in vLGN neurons is consistent with the immunolabeling data demonstrating high levels of HCN2 immunoreactivity in the vLGN (Notomi and Shigemoto, 2004). These data are again consistent with earlier results indicating that the distinct properties of Ih in discrete brain regions are correlated with their HCN isoform composition (Santoro et al., 2000), with our findings supporting the conclusion that Ih in IGL neurons is generated by HCN3 channels.
Depletion of endogenous PIP2 pools inhibits HCN3 function
Cyclic nucleotides do not facilitate channel gating in either native or recombinant HCN3 channels; consequently, we asked what other ligand could enhance channel opening. Membrane phospholipids can directly influence the function of many channels, including HCN1, 2 and 4 (Pian et al., 2007; Suh and Hille, 2008); therefore, we first investigated whether endogenous PIP2 modulated HCN channel gating in IGL neurons. At micromolar concentrations, wortmannin blocks type III phosphatidylinositol 4-kinase (PI4K III) (Nakanishi et al., 1995), thereby inhibiting the final step in the biosynthetic pathway for PIP2 (Doughman et al., 2003; Balla and Balla, 2006; Sasaki et al., 2009). Brain slices were preincubated at 30°C in ACSF containing 15 μm wortmannin or 0.1% DMSO (the vehicle as control) for ∼45 min before recording. Recordings were made in IGL neurons from control and wortmannin-pretreated slices immediately after whole-cell configuration was established; representative examples are shown in Figure 4Ai. Tail currents were used to construct steady-state activation curves (Fig. 4B). Wortmannin treatment (Fig. 4Aii) markedly shifted channel activation to more hyperpolarized potentials by 17.1 ± 2.4 mV (V1/2 in mV: −89.2 ± 3.2; wortmannin, −106.3 ± 3.6, p < 0.01, n = 22) without an apparent change in the slope (9.2 ± 0.6 and 9.4 ± 0.7 mV for control and wortmannin, respectively).
In the same IGL neurons pretreated with wortmannin as described above, superfusion of 8-Br cAMP (200 μm) failed to produce additional effects on channel activation (−105.6 ± 2 mV, n = 6) (Fig. 4Aiii,B). Again, this nucleotide had no effect on the slope factor or the kinetics. In addition, wortmannin alone slowed channel activation (Fig. 4C) and decreased Ih density (Fig. 4D).
To establish that homomeric HCN3 channels are sensitive to the effects of wortmannin, we tested the actions of wortmannin on hHCN3 channels heterologously expressed in Xenopus oocytes 30–48 h after injection of HCN3. Oocytes were preincubated with wortmannin (15 μm) for 40 or 60 min at room temperature. The Ih current recorded from intact oocytes was shown to be typically slow; representative family traces are illustrated in Figure 4E; the maximal current amplitude ranged from 2 to 11 μA when evoked by a voltage step of −95 mV. Pretreatment with wortmannin also markedly shifted voltage-dependent activation to more negative potentials (Fig. 4F). Prolonging the incubation led to a more pronounced hyperpolarized shift in channel gating, a finding consistent with depletion of endogenous PIP2 under these conditions (Fig. 4G). A full time range analysis was not possible, as the oocytes did not tolerate exposures of >1 h. The effects of wortmannin on recombinant HCN3 channels recapitulated its effects on their native counterparts expressed in the IGL. The data obtained here, together with those from IGL neurons, further demonstrate that HCN3 channels are regulated by endogenous phosphoinositides.
PIP2 markedly enhances opening of Ih channels in IGL neurons
The above data indicate that endogenous PIP2 pools modulate HCN3 channel function; therefore, we directly tested how exogenous PIP2 influenced native Ih gating in IGL neurons. Ih currents in rat IGL neurons were elicited with a series of hyperpolarizing voltage steps; representative Ih traces are shown in Figure 5A. Intracellular application of PIP2 (10 μm in the recording pipette, 15 min dialysis) facilitated channel opening and produced a marked depolarizing shift in voltage dependence of channel activation (Fig. 5A, right). Very similar responses to PIP2 application were observed in HCN2−/− IGL neurons (Fig. 5B,D,F). Group data show that the facilitating effects of PIP2 on voltage-dependent activation were almost identical in IGL neurons from rats and HCN2−/− mice (ΔV1/2, mV: 16.2 ± 1.4 and 17.1 ± 1.5, respectively, n = 10/each) (Fig. 5D).
The PIP2-induced depolarizing shift in V1/2 (Fig. 5D) was not altered by addition of 8-Br cAMP (rat IGL neurons; PIP2 alone: 16.2 ± 1.2, PIP2 + 8-Br cAMP: 15.8 ± 1.4, and HCN2−/− IGL neurons; PIP2 alone: 17.1 ± 1, PIP2 + 8-Br cAMP: 16.2 ± 1.2). PIP2 had no effect on either the slope factor (in millivolts) (9.8 ± 1.2 and 9.2 ± 1.5 for control and PIP2, respectively, p > 0.05) or Ih density (in picoamperes per picofarad) at −130 mV (−13.8 ± 2.1 and −14.9 ± 2.4 for control and PIP2, respectively, p > 0.05).
The presence of PIP2 accelerated channel activation and slowed deactivation (Fig. 5E) in rat IGL neurons. In addition, PIP2 significantly increased Ih density in the physiological potential range in Figure 5A. Very similar responses in channel gating, kinetics, and Ih density to PIP2 application were observed in mouse HCN2−/− IGL neurons (Fig. 5B,D,F).
The shift in the V1/2 in HCN2−/− IGL neurons was very stable when PIP2 was present in the pipette solution, while such recordings without exogenous PIP2 caused a time-dependent hyperpolarizing drift in the V1/2 by >10 mV in another group of IGL neurons (Fig. 5C). The observed rundown in the voltage dependence of activation strongly suggests that regulation by endogenous PIP2 in the IGL was impaired by intracellular dialysis by the pipette solution. These results demonstrate that both endogenous and exogenous PIP2 enhance HCN3 channel gating.
To test whether the gating effect of terminal phospholipids in the native HCN channel might be dependent on the phosphate groups on the inositol ring, we studied possible effects of PIP2's parent compounds: phosphatidylinositol (PI), which is nonphosphorylated, and phosphatidylinositol-4-phosphate (PIP), which is phosphorylated on the inositol ring at position 4 (Sasaki et al., 2009). We used the same approach to apply these compounds as for PIP2 experiments (10 μm in the recording pipette). As shown in Figure 5, D and F, PI had no effect on the gating (ΔV1/2: 1.2 ± 1.5 mV, n = 10). In contrast, PIP was effective in enhancing HCN channel function, and its effectiveness was similar to PIP2 (ΔV1/2: 12.5 ± 1.4 mV for PIP, 17.1 ± 1.6 mV for PIP2, n = 10/each).
These data indicate that phosphoinositides facilitate HCN channel gating in IGL neurons, and this requires the presence of at least one phosphate group on the inositol ring of the phospholipid.
Regulation of Ih-dependent low-threshold burst firing in IGL neurons
Temporal summation of voltage responses is crucial for the initiation of low-threshold calcium spike (LTS) burst firing in thalamic neurons (Ying and Goldstein, 2005). Here, we examined burst firing and its regulation by Ih during hyperpolarization in HCN2−/− IGL neurons. We used the specific M-channel inhibitor XE991 (10 μm) to block the delayed-rectifier M-type potassium conductance (Hu et al., 2002), and CNQX (10 μm) and gabazine (10 μm) to block fast synaptic transmission, since these conductances are known to affect Ih-induced voltage responses (Magee, 1999; Ying et al., 2007b; George et al., 2009; Atherton et al., 2010). In normal ACSF, IGL neurons exhibited a resting membrane potential of −72.6 ± 2.4 mV (n = 14), and superfusion of the three blockers produced an insignificant depolarization in the membrane potential (3.5 ± 2.8 mV, p > 0.05, n = 14). To facilitate burst firing in IGL neurons, the membrane potential under control conditions was initially hyperpolarized by DC injection to −80 ± 1.8 mV (n = 14). At this potential, the IGL neurons tested here could generate EPSP-like voltage responses in response to intracellular injection of a train of current pulses, which summated to fire a burst (Fig. 6A). The latency of the burst onset was 102 ± 3.2 ms in control. Superfusion of the specific Ih blocker ZD7288 (30 μm) for 15 min hyperpolarized the membrane potential by 8.4 ± 2.4 mV (n = 6) (Fig. 6Bi), and markedly increased the latency to 155 ± 4.6 ms (Fig. 6Bi,D), indicating Ih-dependent burst firing in IGL neurons. Compensation for the hyperpolarization to control potential by injection of positive DC restored the latency (Fig. 6Bii,D), consistent with the observation that intrinsic temporal summation is voltage dependent (Williams and Stuart, 2000). In an additional three neurons, no bursts were seen following ZD application, although bursts could be seen following DC compensation (not shown), and these cells were excluded from further analysis. Our results are consistent with prior observations demonstrating the dependence of low-threshold burst firing on membrane potential in neurons expressing Ih channels (McCormick and Pape, 1990; Bal and McCormick, 1997; Lüthi et al., 1998; Ying et al., 2007b).
Another group of IGL neurons were tested with PIP2 (10 μm) in the recording pipette solution, and their control voltage response was measured immediately (within 30–50 s) after whole-cell mode was established; a representative trace is shown in Figure 6Ci. The latency was not significantly different from those obtained with normal intracellular solution as shown in Figure 6A (p > 0.05, n = 6). Dialysis of PIP2 for 15 min depolarized the membrane potential by 7.8 ± 3.6 mV (n = 6), and shortened the latency to 45 ± 3.4 ms. Subsequent bath application of ZD7288 (30 μm) for 15 min reversed the response, producing a hyperpolarization of 10 ± 3.5 mV in the same neurons (Fig. 6Cii,D). Group data demonstrate that ZD7288 lengthened, and PIP2 shortened, the latency of Ih-dependent burst firing during periods of hyperpolarization (Fig. 6D). These changes in latency were closely correlated to alterations in membrane potential (Fig. 6E).
Input resistance (Rin, in MΩ) was 545 ± 22 in control (at −80 mV); the holding membrane potential was changed in response to drug application (as described above), and Rin was significantly (p < 0.05) increased by ZD7288 (762 ± 38), PIP2 (643 ± 26), and PIP2 + ZD7288 (742 ± 35). The increase in Rin in the presence of PIP2 is counterintuitive to the expectation that an increase in Ih conductance should lead to a decrease in Rin. When the membrane potential was reset to −80 mV (as before drug) using DC current, Rin in the presence of PIP2 decreased to 463 ± 23 MΩ. This suggests that Rin is voltage dependent. The same phenomenon, significant voltage-dependent changes in Rin, has previously been reported regardless of the Ih conductance (Surges et al., 2004; Chu et al., 2010; Dembrow et al., 2010). The underlying mechanisms for these effects remain unclear, although Chu et al. (2010) suggest that the change is likely due to alteration in other voltage-dependent conductances. Since PIP2 can influence other ion channels (Suh and Hille, 2008), it is possible that PIP2-induced depolarization observed here might involve enhancing depolarizing conductance(s) and/or decreasing hyperpolarizing ones as seen in microvillar photoreceptors (del Pilar Gomez and Nasi, 2005).
Although the ZD7288-induced increase in input resistance lowered the burst firing threshold (i.e., bursting occurred at a more hyperpolarized membrane potential; see Fig. 6B), a marked increase in the latency correlates with a decrease in burst firing probability (Lüthi et al., 1998; Neuhoff et al., 2002). HCN3 channels are expressed in the soma of IGL neurons (Fig. 1), and our data are consistent with previous observations demonstrating that block of Ih decreases somatic, but not dendritic, excitability in several brain regions (Maccaferri and McBain, 1996; Lüthi et al., 1998; Saitow and Konishi, 2000; Neuhoff et al., 2002; Chu et al., 2010).
PIP2 augments rebound burst firing
One of most striking features of Ih is its activation during hyperpolarization and its ability to depolarize the membrane toward threshold for rebound burst firing (McCormick and Pape, 1990; Bal and McCormick, 1997; Ying et al., 2006); thus, we examined Ih regulation of low-threshold rebound burst firing in IGL neurons. The membrane was transiently hyperpolarized to approximately −125 mV from −60 mV by intracellular injection of hyperpolarizing current pulses (see Materials and Methods) in the absence (control) and presence of ZD7288 (30 μm, applied by superfusion). The hyperpolarization resulted in a prominent Ih-dependent depolarizing voltage sag and a rebound calcium spike upon depolarization, which was crowned by fast Na+ spikes in control (Fig. 7A). The presence of ZD7288 hyperpolarized the membrane by ∼8 mV, nearly abolished the depolarizing sag, increased the rebound delay time, and decreased the number of fast spikes in the same neuron.
We used the same method to study effects of wortmannin on rebound burst firing in another group of IGL neurons. Preincubation of brain slices with wortmannin (15 μm, 45 min) resulted in hyperpolarization of the membrane by ∼7 mV, and inhibition of rebound excitation (Fig. 7B). Wortmannin significantly increased Rin by 26 ± 2.4% (from 545 ± 22 in control to 687 ± 35 MΩ), although its effects were not as pronounced as ZD7288. A relatively small effect of wortmannin on Rin has also been previously shown in midbrain neurons (Zolles et al., 2006).
For experiments with PIP2, the voltage sag under control conditions (no drug) was elicited using the same protocol as above, and the injected current during PIP2 application was unchanged from control (see Materials and Methods); control sag amplitude in this group was not significantly different from those described above, and data were pooled. In contrast to the above inhibitory effects observed with ZD7288 and wortmannin, application of PIP2 (10 μm in the recording pipette) depolarized the membrane by ∼5 mV, increased the sag amplitude, and shortened the delay time (Fig. 7B) as compared to control. Group data are presented in Figure 7, D and E. The delay time of rebound burst firing was inversely correlated with the sag amplitude (Fig. 7E); this relationship suggests that the Ih conductance in IGL neurons is of importance for the initiation of burst firing following recovery from deep hyperpolarization.
PIP2 facilitates oscillations in IGL neurons
The above data demonstrated the ability of IGL neurons to generate Ih-dependent single bursts in response to a hyperpolarizing current pulse. Here, we investigated whether IGL neurons could spontaneously generate rhythmic burst firing patterns. Recordings were made in IGL neurons from HCN2−/− mice at 30°C to facilitate spontaneous activity, and the membrane potential was initially hyperpolarized to approximately −81 mV by intracellular DC injection (as described above). Under these conditions, spontaneous rhythmic LTS bursts were observed (Fig. 8A); these bursts oscillated over 15 to 60 min in 12 of 14 IGL neurons studied. Two neurons failed to generate rebound bursts regardless of holding membrane potential levels or the intensity of intracellular current pulse injected, although they were able to fire fast single spikes in response to depolarizing current injection (data not shown).
Pretreatment of slices with wortmannin (15 μm) lengthened the interburst interval (IBI) (Fig. 8A,C), indicating a decrease in the frequency of bursts. This inhibitory response was accompanied by a hyperpolarization in the membrane potential by 6.4 ± 1.2 mV (p < 0.05 compared to control, n = 6). Addition of ZD7288 (30 μm) had no additional affect on burst firing (Fig. 8C). ZD7288 alone prolonged the IBI in a subgroup of IGL neurons (552 ± 21 ms and 853 ± 62 ms for control and ZD7288, respectively, p < 0.05, n = 6, traces not shown), indicating that the oscillation frequency was Ih dependent. Intracellular application of PIP2 (10 μm) in different neurons increased the frequency of rhythmic burst firing; representative traces are shown in Figure 8B. PIP2 produced a significant depolarization in the membrane potential (5.2 ± 1.2 mV, p < 0.05) compared to control (no drug, n = 6). Analysis of the relationship of burst distributions with IBI demonstrated that PIP2 facilitates Ih-dependent oscillatory activity by enhancing the frequency and regularity of LTS bursting in IGL neurons (Fig. 8D).
Discussion
We conducted a thorough study of HCN channel function in IGL neurons, and obtained the following key findings: (1) HCN3 immunolabeling was present to the exclusion of that for HCN1 and HCN4 and near exclusion of HCN2 in HCN2+/+ mice; (2) Ih was robustly present and exhibited slow activation and cAMP insensitivity; (3) deletion of HCN2 altered neither the expression pattern of HCN1, HCN3, or HCN4 nor the behavior of Ih; (4) PIP2 enhanced channel function by shifting voltage-dependent activation to more depolarized potentials, accelerating activation and slowing deactivation kinetics; and (5) PIP2 enhancement of HCN channel opening resulted in the augmentation of burst firing and rhythmic LTS oscillations. Collectively, these data indicate that the Ih identified in IGL neurons resulted from functional expression of HCN3 channels and that such expression is crucial for controlling intrinsic excitability and rhythmic burst firing in these cells.
Functional expression of HCN3 in IGL neurons is correlated with biophysical properties of Ih
HCN3 is variably expressed in both the rodent (Ludwig et al., 2003; Notomi and Shigemoto, 2004; Mistrík et al., 2005) and human (Stieber et al., 2005) brain. We detected very dense HCN3-IR in somata of IGL neurons from HCN2−/− and HCN2+/+ mice as well as rats. Labeling for HCN1 and HCN4 was completely absent from all IGL neurons, thereby simplifying data interpretation. HCN2 labeling in IGL neurons from rats and HCN2+/+ mice was extremely weak. Several lines of evidence, however, suggest that HCN2 makes little, or no, contribution to Ih in IGL neurons. First, the Ih currents observed from HCN2+/+ and HCN2−/− IGL neurons were not different (Figs. 2, 3). Second, Ih recorded from IGL neurons is cAMP insensitive, with much slower kinetics than that of the Ih observed in vLGN neurons (Figs. 2, 3). Third, HCN2/3 heteromers do not appear to exist (Much et al., 2003). Thus, our Ih data indicate that no cAMP-sensitive homomeric HCN2 channels are involved, and are in keeping with the observed biophysical properties of recombinant HCN3 channels, which feature slow activation kinetics and no facilitatory gating effect during cAMP application (Mistrík et al., 2005; Stieber et al., 2005).
In contrast to IGL neurons, Ih currents in rat vLGN neurons activated faster and were highly sensitive to 8-Br cAMP (Figs. 1, 2), consistent with the prominent HCN2 expression in these cells (Notomi and Shigemoto, 2004). These data are consistent with the conclusion that cAMP insensitivity distinguishes HCN3 from the other HCN subunits (Stieber et al., 2005), and lead us to conclude that that HCN3 channels are the source of Ih in IGL neurons.
PIP2 is crucial for gating of HCN3 channels
The function of HCN channels is governed by both voltage-dependent and endogenous allosteric regulator-mediated gating (Robinson and Siegelbaum, 2003; Biel et al., 2009). Among the ligands that can influence HCN gating, the best understood is cAMP; however, the regulation of cellular physiology by Ih in IGL neurons is not mediated by this nucleotide. PIP2 is also an important modulator that regulates various cellular activities including ion channel function (Doughman et al., 2003; Suh and Hille, 2008). Incubation with wortmannin, which leads to depletion of endogenous PIP2 pools, resulted in a marked hyperpolarizing shift in voltage-dependent activation of both native and recombinant HCN3 channels (Fig. 4), while exogenous PIP2 facilitated native HCN gating. PIP2-mediated HCN gating in IGL neurons is not affected by 8-Br cAMP (Figs. 4, 5). Moreover, prolonged whole-cell recordings without PIP2 application caused a time-dependent hyperpolarizing shift by >10 mV (Fig. 5C). These data indicate that endogenous phosphoinositides regulate native HCN3 channel function in IGL neurons.
The action of PIP2 on other HCN subunits is direct, without requirement for its hydrolyzed products inositol trisphosphate and diacylglycerol (Pian et al., 2007). Phosphates on the inositol headgroup, which are produced by phosphorylation of the hydroxyl groups, are critical for HCN3 gating to occur in IGL neurons (Fig. 5). For example, PI, whose inositol headgroup is nonphosphorylated, was completely ineffective (Fig. 5). PI(4)P, which bears one phosphate group at position 4, was almost as effective as PI(4,5)P2, which bears two phosphate groups at positions 4 and 5. With the formation of a heavily negatively charged headgroup at physiological pH values, such phosphorylation may allow for the electrostatic interaction between charged headgroup(s) and the HCN channel (Pian et al., 2006, 2007; Zolles et al., 2006). The finding that PIP2 acts as a positive modulator contributes to our understanding of HCN3 regulation by an endogenous ligand.
Regulation of Ih-dependent voltage response by PIP2
IGL neurons could generate ZD7288-sensitive low-threshold calcium spike (LTS) bursts during membrane hyperpolarization (Figs. 6, 8); the generation of LTSs is critically dependent on activation of Ih and T-type calcium (IT) currents (Bal and McCormick, 1997; Bessaïh et al., 2008). Thus, Ih acts as the pacemaking conductance during hyperpolarization to depolarize the membrane toward threshold for IT activation, and the two depolarizing conductances contribute to the generation of cyclical LTS bursts. PIP2 depolarized IGL neurons and facilitated LTS burst firing; the effect likely is mediated by its enhancement of Ih as ZD7288 reduced or occluded the effect. Downregulation of Ih via inhibition of synthesis for endogenous PIP2 pools suppressed the generation of LTS bursts (Fig. 7). This is the first demonstration that the Ih-dependent voltage response in IGL neurons is regulated by PIP2.
Functional expression of HCN3 channels contributes to rhythmic burst firing in IGL neurons
Burst spike firing can be evoked in IGL neurons in vivo by retinal illumination (Ying et al., 1993; Thankachan and Rusak, 2005), and rhythmic oscillations can spontaneously occur under constant light (Werhun and Lewandowski, 2009) and can be evoked in slices by optic stimulation (Blasiak et al., 2009). Here we demonstrated that IGL neurons spontaneously fired LTS bursts when the membrane was hyperpolarized; such burst firing formed a rhythmic oscillation with a burst frequency of 0.5–2.6 Hz (Fig. 8). The dependence of frequency and rhythmicity on Ih was effectively modulated by exogenous and endogenous PIP2 levels (Fig. 8). Ih and IT are critically involved in the generation and facilitation of such LTS burst firing and rhythmic oscillations (Bal and McCormick, 1997; Lüthi et al., 1998; Ying et al., 2006; Bessaïh et al., 2008; Biel et al., 2009), and our data confirm the pacemaking role of Ih in generating such rhythmic bursts in IGL neurons.
Our findings suggest that HCN3 channels may influence the pharmacology of the circadian rhythm system via PIP2-mediated intracellular signaling pathways. For example, muscarinic acetylcholine receptors (mAChRs) are known to regulate both IGL oscillations in vivo (Werhun and Lewandowski, 2009) and circadian activity rhythms (Cain et al., 2007). Recombinant HCN channel function can be modulated by activation of mAChRs (Pian et al., 2007). Thus, PIP2-gated HCN3 channels in the IGL may represent an important target for drugs acting at the mAChR signaling pathway (Lanzafame et al., 2003).
In summary, we investigated the physiology of thalamic IGL neurons in brain slices; to the best of our knowledge, this is the first study describing the regulation of a specific ion channel in this nucleus. Pacemaking activity (e.g., spontaneous rhythmic LTS bursting) was Ih dependent in IGL neurons, and PIP2, which acts as a powerful modulator, was required for stable HCN channel opening and regulation of intrinsic excitability and rhythmic burst firing. The IGL is a secondary component of the circadian system, and has broad connections with many other brain regions, including its projection to the primary circadian clock residing in the suprachiasmatic nucleus (Morin and Allen, 2006). Enhancement of Ih-dependent bursting by PIP2 in the IGL may in turn influence biological clock activity associated with circadian rhythms and sleep.
Footnotes
This work was supported by the Department of Anesthesiology, Weill Cornell Medical College. We thank Juliane Stieber, University Erlangen-Nürnberg, for generously providing the HCN3 clone and John Riley and members of Steven Siegelbaum's laboratory for generously providing us with oocytes.
The authors declare no competing financial interests.
References
- Abbas SY, Ying SW, Goldstein PA. Compartmental distribution of hyperpolarization-activated cyclic-nucleotide-gated channel 2 and hyperpolarization-activated cyclic-nucleotide-gated channel 4 in thalamic reticular and thalamocortical relay neurons. Neuroscience. 2006;141:1811–1825. doi: 10.1016/j.neuroscience.2006.05.034. [DOI] [PubMed] [Google Scholar]
- Atherton JF, Kitano K, Baufreton J, Fan K, Wokosin D, Tkatch T, Shigemoto R, Surmeier DJ, Bevan MD. Selective participation of somatodendritic HCN channels in inhibitory but not excitatory synaptic integration in neurons of the subthalamic nucleus. J Neurosci. 2010;30:16025–16040. doi: 10.1523/JNEUROSCI.3898-10.2010. [DOI] [PMC free article] [PubMed] [Google Scholar]
- Bal T, McCormick DA. Synchronized oscillations in the inferior olive are controlled by the hyperpolarization-activated cation current Ih. J Neurophysiol. 1997;77:3145–3156. doi: 10.1152/jn.1997.77.6.3145. [DOI] [PubMed] [Google Scholar]
- Balla A, Balla T. Phosphatidylinositol 4-kinases: old enzymes with emerging functions. Trends Cell Biol. 2006;16:351–361. doi: 10.1016/j.tcb.2006.05.003. [DOI] [PubMed] [Google Scholar]
- Bessaïh T, Leresche N, Lambert RC. T current potentiation increases the occurrence and temporal fidelity of synaptically evoked burst firing in sensory thalamic neurons. Proc Natl Acad Sci U S A. 2008;105:11376–11381. doi: 10.1073/pnas.0801484105. [DOI] [PMC free article] [PubMed] [Google Scholar]
- Biel M, Wahl-Schott C, Michalakis S, Zong X. Hyperpolarization-activated cation channels: from genes to function. Physiol Rev. 2009;89:847–885. doi: 10.1152/physrev.00029.2008. [DOI] [PubMed] [Google Scholar]
- Blasiak A, Blasiak T, Lewandowski MH. Electrophysiology and pharmacology of the optic input to the rat intergeniculate leaflet in vitro. J Physiol Pharmacol. 2009;60:171–180. [PubMed] [Google Scholar]
- Cain SW, Verwey M, Szybowska M, Ralph MR, Yeomans JS. Carbachol injections into the intergeniculate leaflet induce nonphotic phase shifts. Brain Res. 2007;1177:59–65. doi: 10.1016/j.brainres.2007.07.048. [DOI] [PubMed] [Google Scholar]
- Card JP, Moore RY. Organization of lateral geniculate-hypothalamic connections in the rat. J Comp Neurol. 1989;284:135–147. doi: 10.1002/cne.902840110. [DOI] [PubMed] [Google Scholar]
- Chu Z, Takagi H, Moenter SM. Hyperpolarization-activated currents in gonadotropin-releasing hormone (GnRH) neurons contribute to intrinsic excitability and are regulated by gonadal steroid feedback. J Neurosci. 2010;30:13373–13383. doi: 10.1523/JNEUROSCI.1687-10.2010. [DOI] [PMC free article] [PubMed] [Google Scholar]
- del Pilar Gomez M, Nasi E. A direct signaling role for phosphatidylinositol 4,5-bisphosphate (PIP2) in the visual excitation process of microvillar receptors. J Biol Chem. 2005;280:16784–16789. doi: 10.1074/jbc.M414538200. [DOI] [PubMed] [Google Scholar]
- Dembrow NC, Chitwood RA, Johnston D. Projection-specific neuromodulation of medial prefrontal cortex neurons. J Neurosci. 2010;30:16922–16937. doi: 10.1523/JNEUROSCI.3644-10.2010. [DOI] [PMC free article] [PubMed] [Google Scholar]
- Doughman RL, Firestone AJ, Anderson RA. Phosphatidylinositol phosphate kinases put PI4,5P(2) in its place. J Membr Biol. 2003;194:77–89. doi: 10.1007/s00232-003-2027-7. [DOI] [PubMed] [Google Scholar]
- Fogle KJ, Lyashchenko AK, Turbendian HK, Tibbs GR. HCN pacemaker channel activation is controlled by acidic lipids downstream of diacylglycerol kinase and phospholipase A2. J Neurosci. 2007;27:2802–2814. doi: 10.1523/JNEUROSCI.4376-06.2007. [DOI] [PMC free article] [PubMed] [Google Scholar]
- Franklin KBJ, Paxinos G. The mouse brain in stereotaxic coordinates. Ed 3. New York: Academic; 2007. [Google Scholar]
- Frère SG, Lüthi A. Pacemaker channels in mouse thalamocortical neurones are regulated by distinct pathways of cAMP synthesis. J Physiol. 2004;554:111–125. doi: 10.1113/jphysiol.2003.050989. [DOI] [PMC free article] [PubMed] [Google Scholar]
- Frère SG, Kuisle M, Lüthi A. Regulation of recombinant and native hyperpolarization-activated cation channels. Mol Neurobiol. 2004;30:279–305. doi: 10.1385/MN:30:3:279. [DOI] [PubMed] [Google Scholar]
- Gauss R, Seifert R. Pacemaker oscillations in heart and brain: a key role for hyperpolarization-activated cation channels. Chronobiol Int. 2000;17:453–469. doi: 10.1081/cbi-100101057. [DOI] [PubMed] [Google Scholar]
- George MS, Abbott LF, Siegelbaum SA. HCN hyperpolarization-activated cation channels inhibit EPSPs by interactions with M-type K+ channels. Nat Neurosci. 2009;12:577–584. doi: 10.1038/nn.2307. [DOI] [PMC free article] [PubMed] [Google Scholar]
- Goulding EH, Tibbs GR, Liu D, Siegelbaum SA. Role of H5 domain in determining pore diameter and ion permeation through cyclic nucleotide-gated channels. Nature. 1993;364:61–64. doi: 10.1038/364061a0. [DOI] [PubMed] [Google Scholar]
- Herrmann S, Stieber J, Ludwig A. Pathophysiology of HCN channels. Pflugers Arch. 2007;454:517–522. doi: 10.1007/s00424-007-0224-4. [DOI] [PubMed] [Google Scholar]
- Hu H, Vervaeke K, Storm JF. Two forms of electrical resonance at theta frequencies, generated by M-current, h-current and persistent Na+ current in rat hippocampal pyramidal cells. J Physiol. 2002;545:783–805. doi: 10.1113/jphysiol.2002.029249. [DOI] [PMC free article] [PubMed] [Google Scholar]
- Lanzafame AA, Christopoulos A, Mitchelson F. Cellular signaling mechanisms for muscarinic acetylcholine receptors. Receptors Channels. 2003;9:241–260. [PubMed] [Google Scholar]
- Ludwig A, Budde T, Stieber J, Moosmang S, Wahl C, Holthoff K, Langebartels A, Wotjak C, Munsch T, Zong X, Feil S, Feil R, Lancel M, Chien KR, Konnerth A, Pape HC, Biel M, Hofmann F. Absence epilepsy and sinus dysrhythmia in mice lacking the pacemaker channel HCN2. EMBO J. 2003;22:216–224. doi: 10.1093/emboj/cdg032. [DOI] [PMC free article] [PubMed] [Google Scholar]
- Lüthi A, Bal T, McCormick DA. Periodicity of thalamic spindle waves is abolished by ZD7288,a blocker of Ih. J Neurophysiol. 1998;79:3284–3289. doi: 10.1152/jn.1998.79.6.3284. [DOI] [PubMed] [Google Scholar]
- Maccaferri G, McBain CJ. The hyperpolarization-activated current (Ih) and its contribution to pacemaker activity in rat CA1 hippocampal stratum oriens-alveus interneurones. J Physiol. 1996;497:119–130. doi: 10.1113/jphysiol.1996.sp021754. [DOI] [PMC free article] [PubMed] [Google Scholar]
- Magee JC. Dendritic hyperpolarization-activated currents modify the integrative properties of hippocampal CA1 pyramidal neurons. J Neurosci. 1998;18:7613–7624. doi: 10.1523/JNEUROSCI.18-19-07613.1998. [DOI] [PMC free article] [PubMed] [Google Scholar]
- Magee JC. Dendritic Ih normalizes temporal summation in hippocampal CA1 neurons. Nat Neurosci. 1999;2:508–514. doi: 10.1038/12229. [DOI] [PubMed] [Google Scholar]
- McCormick DA, Pape HC. Properties of a hyperpolarization-activated cation current and its role in rhythmic oscillation in thalamic relay neurones. J Physiol. 1990;431:291–318. doi: 10.1113/jphysiol.1990.sp018331. [DOI] [PMC free article] [PubMed] [Google Scholar]
- Meurers BH, Dziewczapolski G, Bittner A, Shi T, Kamme F, Shults CW. Dopamine depletion induced up-regulation of HCN3 enhances rebound excitability of basal ganglia output neurons. Neurobiol Dis. 2009;34:178–188. doi: 10.1016/j.nbd.2009.01.007. [DOI] [PubMed] [Google Scholar]
- Mistrík P, Mader R, Michalakis S, Weidinger M, Pfeifer A, Biel M. The murine HCN3 gene encodes a hyperpolarization-activated cation channel with slow kinetics and unique response to cyclic nucleotides. J Biol Chem. 2005;280:27056–27061. doi: 10.1074/jbc.M502696200. [DOI] [PubMed] [Google Scholar]
- Moore RY, Card JP. Intergeniculate leaflet: an anatomically and functionally distinct subdivision of the lateral geniculate complex. J Comp Neurol. 1994;344:403–430. doi: 10.1002/cne.903440306. [DOI] [PubMed] [Google Scholar]
- Morin LP, Allen CN. The circadian visual system, 2005. Brain Res Rev. 2006;51:1–60. doi: 10.1016/j.brainresrev.2005.08.003. [DOI] [PubMed] [Google Scholar]
- Morin LP, Blanchard J, Moore RY. Intergeniculate leaflet and suprachiasmatic nucleus organization and connections in the golden hamster. Vis Neurosci. 1992;8:219–230. doi: 10.1017/s095252380000287x. [DOI] [PubMed] [Google Scholar]
- Much B, Wahl-Schott C, Zong X, Schneider A, Baumann L, Moosmang S, Ludwig A, Biel M. Role of subunit heteromerization and N-linked glycosylation in the formation of functional hyperpolarization-activated cyclic nucleotide-gated channels. J Biol Chem. 2003;278:43781–43786. doi: 10.1074/jbc.M306958200. [DOI] [PubMed] [Google Scholar]
- Nakanishi S, Catt KJ, Balla T. A wortmannin-sensitive phosphatidylinositol 4-kinase that regulates hormone-sensitive pools of inositolphospholipids. Proc Natl Acad Sci U S A. 1995;92:5317–5321. doi: 10.1073/pnas.92.12.5317. [DOI] [PMC free article] [PubMed] [Google Scholar]
- Neuhoff H, Neu A, Liss B, Roeper J. Ih channels contribute to the different functional properties of identified dopaminergic subpopulations in the midbrain. J Neurosci. 2002;22:1290–1302. doi: 10.1523/JNEUROSCI.22-04-01290.2002. [DOI] [PMC free article] [PubMed] [Google Scholar]
- Nolan MF, Malleret G, Lee KH, Gibbs E, Dudman JT, Santoro B, Yin D, Thompson RF, Siegelbaum SA, Kandel ER, Morozov A. The hyperpolarization-activated HCN1 channel is important for motor learning and neuronal integration by cerebellar Purkinje cells. Cell. 2003;115:551–564. doi: 10.1016/s0092-8674(03)00884-5. [DOI] [PubMed] [Google Scholar]
- Nolan MF, Malleret G, Dudman JT, Buhl DL, Santoro B, Gibbs E, Vronskaya S, Buzsáki G, Siegelbaum SA, Kandel ER, Morozov A. A behavioral role for dendritic integration: HCN1 channels constrain spatial memory and plasticity at inputs to distal dendrites of CA1 pyramidal neurons. Cell. 2004;119:719–732. doi: 10.1016/j.cell.2004.11.020. [DOI] [PubMed] [Google Scholar]
- Notomi T, Shigemoto R. Immunohistochemical localization of Ih channel subunits, HCN1–4, in the rat brain. J Comp Neurol. 2004;471:241–276. doi: 10.1002/cne.11039. [DOI] [PubMed] [Google Scholar]
- Paxinos G, Watson C. The rat brain in stereotaxic coordinates. Ed 4. New York: Academic; 1998. [DOI] [PubMed] [Google Scholar]
- Pian P, Bucchi A, Robinson RB, Siegelbaum SA. Regulation of gating and rundown of HCN hyperpolarization-activated channels by exogenous and endogenous PIP2. J Gen Physiol. 2006;128:593–604. doi: 10.1085/jgp.200609648. [DOI] [PMC free article] [PubMed] [Google Scholar]
- Pian P, Bucchi A, Decostanzo A, Robinson RB, Siegelbaum SA. Modulation of cyclic nucleotide-regulated HCN channels by PIP2 and receptors coupled to phospholipase C. Pflügers Arch. 2007;455:125–145. doi: 10.1007/s00424-007-0295-2. [DOI] [PubMed] [Google Scholar]
- Robinson RB, Siegelbaum SA. Hyperpolarization-activated cation currents: from molecules to physiological function. Annu Rev Physiol. 2003;65:453–480. doi: 10.1146/annurev.physiol.65.092101.142734. [DOI] [PubMed] [Google Scholar]
- Saitow F, Konishi S. Excitability increase induced by β-adrenergic receptor-mediated activation of hyperpolarization-activated cation channels in rat cerebellar basket cells. J Neurophysiol. 2000;84:2026–2034. doi: 10.1152/jn.2000.84.4.2026. [DOI] [PubMed] [Google Scholar]
- Santoro B, Chen S, Lüthi A, Pavlidis P, Shumyatsky GP, Tibbs GR, Siegelbaum SA. Molecular and functional heterogeneity of hyperpolarization-activated pacemaker channels in the mouse CNS. J Neurosci. 2000;20:5264–5275. doi: 10.1523/JNEUROSCI.20-14-05264.2000. [DOI] [PMC free article] [PubMed] [Google Scholar]
- Sasaki T, Takasuga S, Sasaki J, Kofuji S, Eguchi S, Yamazaki M, Suzuki A. Mammalian phosphoinositide kinases and phosphatases. Prog Lipid Res. 2009;48:307–343. doi: 10.1016/j.plipres.2009.06.001. [DOI] [PubMed] [Google Scholar]
- Stieber J, Stöckl G, Herrmann S, Hassfurth B, Hofmann F. Functional expression of the human HCN3 channel. J Biol Chem. 2005;280:34635–34643. doi: 10.1074/jbc.M502508200. [DOI] [PubMed] [Google Scholar]
- Suh BC, Hille B. PIP2 is a necessary cofactor for ion channel function: how and why? Annu Rev Biophys. 2008;37:175–195. doi: 10.1146/annurev.biophys.37.032807.125859. [DOI] [PMC free article] [PubMed] [Google Scholar]
- Surges R, Freiman TM, Feuerstein TJ. Input resistance is voltage dependent due to activation of Ih channels in rat CA1 pyramidal cells. J Neurosci Res. 2004;76:475–480. doi: 10.1002/jnr.20075. [DOI] [PubMed] [Google Scholar]
- Szkudlarek HJ, Raastad M. Electrical properties of morphologically characterized neurons in the intergeniculate leaflet of the rat thalamus. Neuroscience. 2007;150:309–318. doi: 10.1016/j.neuroscience.2007.09.011. [DOI] [PubMed] [Google Scholar]
- Thankachan S, Rusak B. Juxtacellular recording/labeling analysis of physiological and anatomical characteristics of rat intergeniculate leaflet neurons. J Neurosci. 2005;25:9195–9204. doi: 10.1523/JNEUROSCI.2672-05.2005. [DOI] [PMC free article] [PubMed] [Google Scholar]
- Wainger BJ, DeGennaro M, Santoro B, Siegelbaum SA, Tibbs GR. Molecular mechanism of cAMP modulation of HCN pacemaker channels. Nature. 2001;411:805–810. doi: 10.1038/35081088. [DOI] [PubMed] [Google Scholar]
- Werhun K, Lewandowski MH. The effects of muscarinic cholinergic receptor antagonist on slow bursting neuronal activity in the rat intergeniculate leaflet. Folia Biol (Krakow) 2009;57:187–192. doi: 10.3409/fb57_3-4.187-192. [DOI] [PubMed] [Google Scholar]
- Wicks NL, Wong T, Sun J, Madden Z, Young EC. Cytoplasmic cAMP-sensing domain of hyperpolarization-activated cation (HCN) channels uses two structurally distinct mechanisms to regulate voltage gating. Proc Natl Acad Sci U S A. 2011;108:609–614. doi: 10.1073/pnas.1012750108. [DOI] [PMC free article] [PubMed] [Google Scholar]
- Williams SR, Stuart GJ. Site independence of EPSP time course is mediated by dendritic Ih in neocortical pyramidal neurons. J Neurophysiol. 2000;83:3177–3182. doi: 10.1152/jn.2000.83.5.3177. [DOI] [PubMed] [Google Scholar]
- Ying SW, Goldstein PA. Propofol-block of SK channels in reticular thalamic neurons enhances GABAergic inhibition in relay neurons. J Neurophysiol. 2005;93:1935–1948. doi: 10.1152/jn.01058.2004. [DOI] [PubMed] [Google Scholar]
- Ying SW, Zhang DX, Rusak B. Effects of serotonin agonists and melatonin on photic responses of hamster intergeniculate leaflet neurons. Brain Res. 1993;628:8–16. doi: 10.1016/0006-8993(93)90931-c. [DOI] [PubMed] [Google Scholar]
- Ying SW, Abbas SY, Harrison NL, Goldstein PA. Propofol block of Ih contributes to the suppression of neuronal excitability and rhythmic burst firing in thalamocortical neurons. Eur J Neurosci. 2006;23:465–480. doi: 10.1111/j.1460-9568.2005.04587.x. [DOI] [PubMed] [Google Scholar]
- Ying SW, Abbas SY, Goldstein PA. HCN3 channels contribute to Ih in thalamic IGL neurons. Soc Neurosci Abstr. 2007a;33:467–7. [Google Scholar]
- Ying SW, Jia F, Abbas SY, Hofmann F, Ludwig A, Goldstein PA. Dendritic HCN2 channels constrain glutamate-driven excitability in reticular thalamic neurons. J Neurosci. 2007b;27:8719–8732. doi: 10.1523/JNEUROSCI.1630-07.2007. [DOI] [PMC free article] [PubMed] [Google Scholar]
- Zolles G, Klöcker N, Wenzel D, Weisser-Thomas J, Fleischmann BK, Roeper J, Fakler B. Pacemaking by HCN channels requires interaction with phosphoinositides. Neuron. 2006;52:1027–1036. doi: 10.1016/j.neuron.2006.12.005. [DOI] [PubMed] [Google Scholar]