

Abstract
We investigated human hippocampal functional connectivity in wakefulness and throughout non-rapid eye movement sleep. Young healthy subjects underwent simultaneous EEG and functional magnetic resonance imaging (fMRI) measurements at 1.5 T under resting conditions in the descent to deep sleep. Continuous 5 min epochs representing a unique sleep stage (i.e., wakefulness, sleep stages 1 and 2, or slow-wave sleep) were extracted. fMRI time series of subregions of the hippocampal formation (HF) (cornu ammonis, dentate gyrus, and subiculum) were extracted based on cytoarchitectonical probability maps. We observed sleep stage-dependent changes in HF functional coupling. The HF was integrated to variable strength in the default mode network (DMN) in wakefulness and light sleep stages but not in slow-wave sleep. The strongest functional connectivity between the HF and neocortex was observed in sleep stage 2 (compared with both slow-wave sleep and wakefulness). We observed a strong interaction of sleep spindle occurrence and HF functional connectivity in sleep stage 2, with increased HF/neocortical connectivity during spindles. Moreover, the cornu ammonis exhibited strongest functional connectivity with the DMN during wakefulness, while the subiculum dominated hippocampal functional connectivity to frontal brain regions during sleep stage 2. Increased connectivity between HF and neocortical regions in sleep stage 2 suggests an increased capacity for possible global information transfer, while connectivity in slow-wave sleep is reflecting a functional system optimal for segregated information reprocessing. Our data may be relevant to differentiating sleep stage-specific contributions to neural plasticity as proposed in sleep-dependent memory consolidation.
Introduction
In functional magnetic resonance imaging (fMRI), spontaneous signal fluctuations have recently been used to study functional cerebral connectivity (Fox and Raichle, 2007). Such signal fluctuations are organized in distinct functional resting-state networks (RSNs). Among the various RSNs, the default mode network (DMN) received particular attention, being linked to self-referential processes in humans, such as autobiographical memory and future envisioning (Buckner et al., 2008). It consists of subsystems in which the hippocampal formation (HF) and the lateral temporal cortex are involved in memory collection and building of associations, flexible use of this information to construct mental simulations, and integration of these processes (Buckner et al., 2008; Buckner, 2010). Also, the posterior nodes of the DMN (posterior cingulate, precuneus, and inferior parietal lobules) correspond to regions involved in memory recollection (Vincent et al., 2006).
Preserved DMN connectivity was reported in light sleep (Horovitz et al., 2009; Larson-Prior et al., 2009), while the DMN showed disintegration in slow-wave sleep (Horovitz et al., 2009; Sämann et al., 2011). More subtle network changes, like a reduced contribution of the HF to the DMN, have also been shown at sleep onset (Sämann et al., 2011). However, as these studies focused on the DMN as a whole network, it remained unclear whether the HF builds up alternative functional connectivities with brain areas outside the DMN throughout non-rapid eye movement (NREM) sleep. Such a reorganization of functional connectivity (fc) may be of interest in light of the proposed role of sleep for long-term memory consolidation (Sutherland and McNaughton, 2000; Born et al., 2006; Rasch and Born, 2007; Walker, 2009). During sleep, memories initially encoded in the hippocampus may be transferred to the neocortex for long-term storage (Hasselmo and McClelland, 1999; Squire, 2004; Durrant and Lewis, 2009; Girardeau et al., 2009; Mölle and Born, 2009). In the present study, we focused on the hippocampal fc analyzing fMRI data collected during sleep by using the time courses of hippocampal subregions as seed regressors. We then analyzed their fc correlates for wakefulness (W), transitional sleep stage 1 (S1), and the NREM sleep stages 2 (S2) and slow-wave sleep (SWS); and extracted sleep spindle features from the EEG, probing four specific hypotheses. First, that the HF shows strongest functional connectivity to the major DMN nodes in wakefulness. Second, that in stable NREM sleep (stages S2 and SWS), different functional connectivity should be revealed. Based on the assumption of increased hippocampus-to-neocortical information transfer during sleep, frontal and temporal brain regions should be more involved. Third, that hippocampal functional connectivity changes during sleep are hypothesized to be associated with EEG spindle activity, based on the relation of hippocampal ripple and sleep spindle activity in rodents (Sirota et al., 2003). Fourth, regarding the role of hippocampal subregions (dentate gyrus, cornu ammonis, and subiculum), we hypothesize particularly enhanced functional connectivity of the hippocampal output region, the subiculum, during sleep.
Materials and Methods
Subjects
The study protocol was in accordance with the Declaration of Helsinki and was approved by the ethical review board of Ludwig-Maximilians University, Munich, Germany. Participants provided written informed consent after the procedure had been fully explained and were reimbursed for their participation. Subjects underwent a general medical and structured psychiatric interview, clinical MRI, and EEG to exclude clinical conditions that could interfere with the study protocol. Combined fMRI/polysomnography was obtained from 25 healthy adults [13 men, mean (SD) age 24.7 (3.2) years; 12 women, 24.8 (2.5) years]. Participants were instructed to follow a regular sleep–wake schedule with bedtimes between 23:00 and 08:00 h during the week before the experiment, documented by sleep diaries. Participants were asked to get up ∼3 h earlier on the experimental day to increase the probability of falling asleep in the MRI scanner. Wrist actigraphy during the night and day before the experiment was used to control subjects' adherence to the sleep restriction. Simultaneous EEG/fMRI experiments started round 21:00. After EEG montage and positioning in the MRI scanner, subjects were informed that no further active participation was required the following 2–3 h, and that they could fall asleep.
fMRI and EEG acquisition
Simultaneous polysomnography was comprised of 19 EEG electrodes placed according to the international standard 10/20 system, electrooculogram, submental electromyography, and an electrocardiogram (sampling rate 5 kHz, EasyCAP modified for sleep; VisionRecorder version 1.03, Brain Products). For noise protection, subjects wore ear plugs and headphones. fMRI was performed at 1.5 tesla (Signa LX; GE) using an eight-channel head coil.
One fMRI run consisted of 800 functional whole-brain images (EPI; repetition time, 2000 ms; echo time, 40 ms; flip angle, 90°; 64 × 64 matrix; in-plane resolution, 3.4 × 3.4 mm2; slices, 25; slice thickness, 3 mm; gap, 1 mm; oriented along anterior commissure–posterior commissure) acquired over 26.7 min. This time restriction originated in an absolute scanner software limitation to continuous acquisition of 20,000 slices at maximum. To allow for vigilance monitoring during the recording session, the sleep stage was determined online with real-time gradient EEG artifact correction performed using the Vision RecView (version 1.0) software (Brain Products). If the subject was not able to fall asleep, only reached light NREM sleep stages, or showed an early and rapid transition to S2 and SWS during the first run, acquisition was repeated in the same scanning session to increase the probability of recording the missing sleep stages. In total, 40 fMRI runs (length, 26.7 min) were acquired from 25 subjects. Graph theoretical analyses and an analysis focusing on the DMN using this dataset have been published previously (Spoormaker et al., 2010; Sämann et al., 2011).
Sleep stage rating
EEG data were first corrected for gradient-induced and cardioballistic artifacts (VisionAnalyzer 1.05; Brain Products). After this, spectral filtering (0.5–30 Hz) was applied. Sleep stage scoring following Rechtschaffen and Kales (1968) criteria of all 40 fMRI runs was performed in 20 s windows. The hypnograms of the 40 recorded 26.7 min sessions were then screened for 5 min intervals of one specific stable sleep stage with a presence of >85% throughout the epoch, without arousals or movement artifacts in either EEG or fMRI. This resulted in a total of 93 epochs from the four vigilance stages (W, 27; S1, 24; S2, 24; SWS, 18). Additional details about the selected epochs are given in Spoormaker et al. (2010, their Table 1 and supplemental Table 1).
Table 1.
HF functional connectivity during wakefulness
| Brain region | Brodmann areas | Cluster size (voxel) | Peak voxel |
|||||
|---|---|---|---|---|---|---|---|---|
| t value | MNI coordinates | |||||||
| 1 | L/C/R | (Posterior) cingulate, uncus, fusiform gyrus, precuneus, culmen, claustrum, thalamus, hippocampus, amygdala | R7, L20, 23, 27–31, 34–36, L37 | 7548 | 17.37 | 28 | −28 | −16 |
| 2 | R | Inferior/middle temporal gyrus | 21 | 322 | 10.93 | 50 | 2 | −32 |
| 3 | R | Middle/superior frontal gyrus | 8 | 207 | 9.72 | 24 | 22 | 54 |
| 4 | L/R | Anterior cingulate, medial frontal gyrus | 10, 32, L42 | 886 | 9.40 | 6 | 56 | 14 |
| 5 | L | Angular gyrus | 39 | 305 | 9.37 | −44 | −70 | 30 |
| 6 | L | Middle/superior frontal gyrus | 8 | 187 | 9.23 | −22 | 28 | 52 |
| 7 | R | Middle/superior temporal gyrus, angular gyrus, supramarginal gyrus | 39 | 491 | 8.81 | 44 | −64 | 28 |
| 8 | L | Middle/superior temporal gyrus | 21 | 298 | 8.25 | −56 | −14 | −14 |
Clusters resulting from second-level random-effects analysis (pFWE < 10−6, extent > 150). Regions showing significant functional connectivity with all HF subregions are listed. Sorting is after t values of the cluster peak voxel. Brodmann areas are identified for clusters covering >3% of the respective area. Coordinates (x, y, z) are given in MNI space. L, Left hemisphere; R, right hemisphere; C, central position.
fMRI analysis
Preprocessing.
All fMRI analyses were performed in 64-bit Linux workstations using SPM, version 5 (www.fil.ion.ucl.ac.uk/spm) and in-house scripts programmed in IDL version 6.3 (www.ittvis.com) and Matlab version 2008B (MathWorks). The fMRI preprocessing steps consisted of deletion of the first five volumes to avoid possible nonequilibrium contrasts, slice time correction to account for different acquisition times between slices, realignment using rigid body transformation of all images to the first image to correct for head motion (data with head movements >2 mm were excluded) and spatial normalization of the images to a standard EPI template in MNI (Montreal Neurological Institute) space (SPM5 distribution) and interpolation to a voxel resolution of 2 × 2 × 2 mm3 using fifth-degree splines.
Removal of artificial signals.
To remove artificial components from the time courses, normalized, spatially unsmoothed images were residualized by multiple regression analysis in the GLM framework against the following regressors: (1–6) six parameters derived from the realignment step, (7–12) their respective first order derivatives, (13, 14) global signals from white matter (WM) and CSF, and (15, 16) and their respective first-order derivatives. The resulting residual images, which represent the error term of the model and therefore only contain signal fluctuations not explained by motion or WM or CSF regressors, were temporally (low-pass filter, 0.1 Hz in FSL 3.2; www.fmrib.ox.ac.uk/fsl) and spatially (isotropic Gaussian kernel, full width half maximum, 6 mm) filtered. Additionally, data were analyzed without temporal low-pass filtering to qualitatively assess whether temporal filtering has a strong influence of the fc analysis (see supplemental Discussion, available at www.jneurosci.org as supplemental material).
Fixed-effects model.
For each subject and sleep stage, residual low-pass filtered data were then correlated with the corresponding hippocampal time courses extracted from the very same dataset. Subregions of the hippocampal formation were defined from probabilistic cytoarchitectonic maps as previously described (Amunts et al., 2005) and implemented in the SPM anatomy toolbox (supplemental Fig. 2, available at www.jneurosci.org as supplemental material) (Eickhoff et al., 2005). Time courses were calculated as the mean signal of all voxels inside the specific region, extracted using the SPM toolbox Marsbar (Brett et al., 2002). The following bilateral subregions were used: cornu ammonis (CA), dentate gyrus (DG), and subiculum (SUB), as well as all regions combined (whole hippocampus). To minimize contamination of the time courses with CSF contributions, only voxels with a probability <20% of being CSF (according to the SPM probability maps) were extracted from the subregions. For each subject and sleep stage, the mean time course of each bilateral subregion was regressed on the residual fMRI images in three separate fixed-effects analyses.
Random-effects model.
For analyzing sleep stage influences, second level random-effects analysis was performed using a two-factorial design (subregion, three subregions; and sleep, wakefulness and three NREM sleep stages). A map of the HF fc during wakefulness was generated by a t test against zero combining all subregions. Effects of sleep and subregion were tested using ANOVA. In addition, independent sample t tests in both directions were performed (W vs S1, W vs S2, W vs SWS, S1 vs S2, S1 vs SWS, and S2 vs SWS). Finally, specific subregional contributions were identified per sleep stage by contrasting each subregion against the two other subregions combined.
The fc map collected during wakefulness was thresholded at pFWE < 10−6, extent >150 voxels. For the main effects of sleep and subregion, for the bidirectional sleep stage comparison, and for the subregional analyses, a cluster collection threshold was defined at p < 0.001 and significance of the resulting clusters was assessed under consideration of nonstationary smoothness (pFWE,cluster < 0.05) (Hayasaka et al., 2004). Anatomical images were acquired during the clinical screening session. All activation maps are shown on the group mean 3D T1-weighted image. All figures are displayed using the neurological convention.
To control for the nestedness in our data due to subjects having epochs in various sleep stages (Spoormaker et al., 2010, their supplemental Table S1), we re-ran the analyses with linear mixed models as implemented in SPSS 16.0, correcting for the variable subject ID. The primary regions from SPM contrasts in Figure 2 were used for the analysis, in which we extracted the first eigenvariate of the magnitude values from the first-level contrasts. If a cluster was significant in a particular automated anatomical labeling (AAL) region (Tzourio-Mazoyer et al., 2002), we extracted values from the whole AAL region with SPM5. If a region showed a significant difference in the statistical parametric map (which does not control for nestedness) but not in the linear mixed model (which controls for nestedness), we would conclude that the results were confounded by nestedness.
Figure 2.
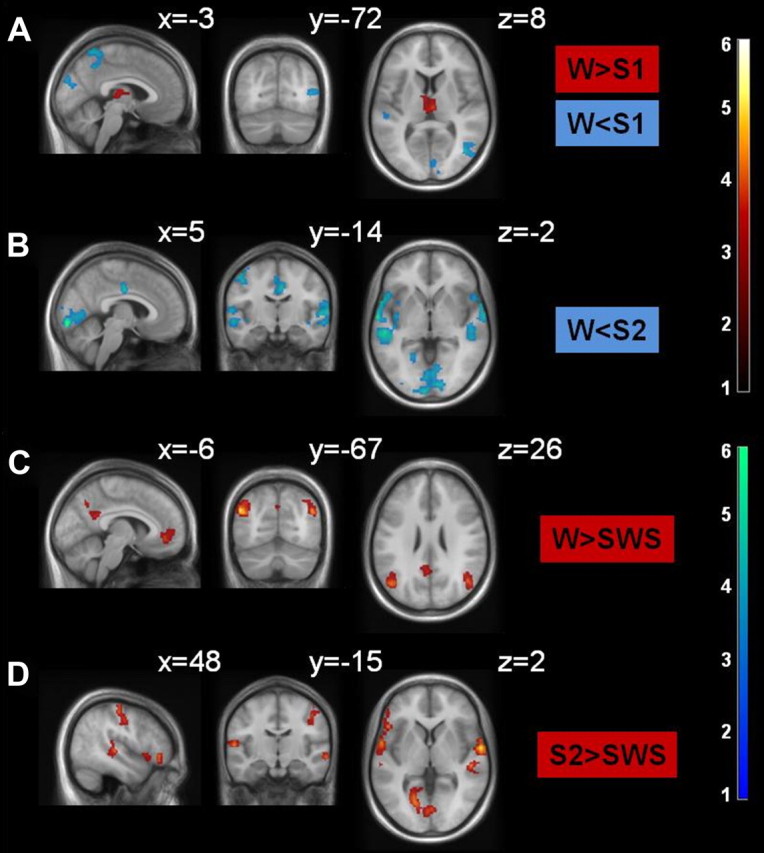
A–D, Comparison of HF functional connectivity across sleep stages. Data are thresholded at puncorr < 0.001, with a variable voxel extent, resulting in pFWE,cluster < 0.05 (Table 2). Color coding indicates t values. The HF has been masked out to avoid display of autocorrelations. MNI coordinates of each slice are given.
Sleep spindle analysis
Analysis of sleep spindles and related fMRI activation was based on the procedures described by Schabus et al. (2007). In the EEG data of the selected epochs in sleep stage 2, occurrence of slow and fast sleep spindles was determined after bandpass filtering of 11–13 Hz (0.0145 s, 48 dB/oct) and 13–15 Hz (0.0122 s, 48 dB/oct), respectively.
The spindle frequency range may be affected by residual magnetic field gradient artifacts at a frequency of ∼12.5 Hz due to the timing of the fMRI experiment. We assessed the quality of artifact correction based on the reduction of the higher frequency harmonics of the gradient artifact in the power spectrum. We found the power for spindles to be >200 times higher than the power of the remaining artifacts. We can therefore safely neglect the influence of the residual artifacts on spindle detection.
The root mean square (rms) of the filtered signal was calculated in time windows of 200 ms. For slow spindles, EEG data collected at electrode Fz were used, as slow spindles are known to be strongest over frontal brain regions; for fast spindles (with parietal dominance), Pz was used (De Gennaro and Ferrara, 2003). For each recording site, the 5% highest rms amplitudes of the respective filtered EEG signal segments were classified as spindles, leading to a binary vector with value 1 representing a 200 ms window exceeding the threshold (thus likely representing a spindle event), and 0 for a time window with rms values below the threshold. To verify the scalp distribution of the detected slow and fast spindle events, we analyzed the topography of the power spectra of the corresponding superthreshold segments (supplemental Fig. 3, available at www.jneurosci.org as supplemental material). Finally, the binary vector containing the temporal position of the classified spindles was convolved with the three basic canonical functions (hemodynamic response function and its time and dispersion derivatives).
As in Schabus et al. (2007), the power fluctuation in the EEG delta band (0.5–4 Hz) was added as a covariate, as spindles are modulated by slow waves. For this purpose, we extracted the delta power from Fz per fMRI volume using fast-Fourier transform (resolution = 0.5 Hz, Hanning window, 10%) and convolved it with the hemodynamic response function to account for the delayed neurovascular response in fMRI signal fluctuations. For each subject, the HRF convolved event regressors of fast and slow spindles and their derivatives, along with delta power, were regressed against the residual low-pass filtered fMRI images in a fixed-effects model.
The total number of superthreshold hits is constant across epochs (5% of 1450 bins, ≈73 bins). To determine the number of sleep spindles per 30 s epoch, we used an additional duration criterion on the binary onset regressor, described above. Only such hits are considered being part of a true spindle, which are followed by at least one more superthreshold hit in the following 3 s. Doing so, we found the total number of spindles (fast and slow) to be 3.23 (0.45) [mean (SD)] per 30 s, well in the range described in literature (Gais et al., 2002).
Second-level analysis was performed on the individual contrast images of the canonical regressor. A two-sample t test (slow and fast spindles) was then performed under consideration of violation of sphericity as implemented in SPM5 (Friston et al., 2005). Individual T-contrasts of the main effect for fast or slow spindles as well as the differential contrast between spindles types were analyzed. Statistical inference was made as described above. Spindle activity was also analyzed without temporal low-pass filtering of the fMRI data to assess effects of filtering.
Interaction analysis
Psychophysiological interaction analysis (PPI) refers to a method that relates the functional coupling between one area and the rest of the brain to results of psychological tests. More generally, any independent temporal event regressor, including physiological signals, may be used as interacting events. In our study, we used electrophysiological data, not psychological measures, for the interaction analysis, resulting in a physiophysiological interaction. PPIs between the EEG fast spindle data and the BOLD signal time courses of the three HF subregions were evaluated to test whether changes in HF fc had an interaction with increased spindle activity. PPIs were performed for CA, DG, and SUB in three distinct analyses. PPI was set up in the framework of SPM5. Herein, the BOLD signal fluctuations of each of the subregions are deconvolved from the HRF effects to get a neural representation of the presumed underlying neural activity. In PPI, the resulting regressor was forwarded to convolution with the binary vector of classified spindles. The three resulting regressors were as follows: (1) binary vector of classified spindles, (2) the neural representation of the fMRI time series, and (3) the binary vector of classified spindles convolved with the neural representation of the fMRI time series. In the fixed-effects model, these three regressors were eventually convolved with the HRF to match the hemodynamically delayed fMRI responses. Analysis was performed on the residualized low-pass filtered data as described above, and the interaction term (regressor 3, above) was evaluated. Finally, the resulting first-level contrast was forwarded to random-effects analysis using a one-sample t test. Again, the resulting maps were assessed at pFWE,cluster < 0.05, collection threshold p < 0.001 (Hayasaka et al., 2004).
Results
Subjects adhered to the experimental guidelines and sleep restriction, as shown by sleep diaries and wrist actigraphy. Sleep latency (time until first appearance of S2), only considering the first attempt of the subject to fall asleep, was 6.7 ± 4.9 min. Over all 40 fMRI runs, the average time spent in W, S1, S2, and SWS were 6.8 ± 5.2 min, 5.9 ± 4.2 min, 10.0 ± 5.4 min, and 4.8 ± 5.8 min, respectively. Eventually, a closer inspection of hypnograms identified 93 epochs (27, 24, 24, and 18 epochs of W, S1, S2, and SWS of 15, 18, 10, and 11 subjects, respectively), 5 contiguous minutes each, with a single prevailing vigilance stage, i.e. <15% of time spent in flanking sleep stages and without arousals. Assignment of all 5 min epochs to subjects and runs, including a description of the prevalence of the different sleep stages per run, was detailed previously (Spoormaker et al., 2010). Occurrence of REM sleep was not observed, which is not unexpected as our data were obtained only from the initial part of the sleep cycle and REM sleep is suppressed in the noisy MR environment (Czisch and Wehrle, 2009). During later processing, one dataset acquired during S1 was found to be corrupted and excluded.
Figure 1A shows the fc map for HF during wakefulness. HF is functionally connected, among others, to the major nodes of the DMN, namely the posterior cingulate cortex/retrosplenial cortex (PCC/RspC), medial prefrontal cortex (mPFC), bilateral inferior parietal lobule (IPL), and bilateral middle and superior temporal gyrus, as well as the thalamus (Table 1). The HF formation is most strongly connected to the DMN during wakefulness, with gradually decreasing fc with the DMN in NREM sleep stages, as illustrated in Figure 1B for the DMN core regions.
Figure 1.

A, Extension of the HF network during wakefulness. Positive functional connectivity of DMN nodes and the HF is shown (pFWE < 10−6, extent > 150 voxel). Color coding indicates t values. MNI coordinates of each slice are given. B, Contrast estimates ±SDs extracted at the peak voxel of the indicated cluster, separated for each sleep stage (W, S1, S2, SWS). MNI coordinates (x, y, z) of the cluster peak voxel are provided.
To further examine sleep stage-specific alterations in HF fc, an F test was performed on the factor sleep (supplemental Fig. 1A, available at www.jneurosci.org as supplemental material). We analyzed the respective changes, comparing wakefulness against all NREM sleep stages and comparing S2 and SWS, in independent sample t tests (Table 2). Comparing wakefulness with S1, only the thalamus showed higher fc with the HF during wakefulness. During S1, fc of the HF was generally found to be stronger in the middle and superior temporal gyrus, occipital cortex, and inferior parietal lobule (Fig. 2A). During S2, HF fc to the lateral temporal and the occipital cortex further increased compared with wakefulness, while no differences in thalamic connectivity were visible. In addition, during S2, fc of the HF with the cingulate cortex and superior temporal gyrus were higher compared with wakefulness (Fig. 2B). In the comparison between wakefulness and SWS (Fig. 2C), fc of the bilateral IPL, PCC, and mPFC with the HF was stronger in wakefulness, indicating a sleep stage-dependent decrease in the integration of the HF to the DMN. No regions exhibited stronger fc with the HF during SWS than wakefulness. The comparison between S2 and SWS (Fig. 2D) revealed stronger HF connectivity to occipital, lateral temporal, and inferior frontal regions in S2. No clusters were detected that showed higher fc during SWS compared with S2. Controlling for nestedness of the data did not change the significance of the clusters reported (supplemental Table 6, available at www.jneurosci.org as supplemental material).
Table 2.
Sleep stage specific functional HF connectivity changes
| Brain region | Brodmann areas, deep nuclei | Cluster size (voxel) | Peak voxel |
|||||
|---|---|---|---|---|---|---|---|---|
| t value | MNI coordinates | |||||||
| Wakefulness > S1 | ||||||||
| 1 | L/R | Thalamus | Ventral anterior nucleus, medial dorsal nucleus | 270 | 4.36 | 4 | −18 | 8 |
| Wakefulness < S1 | ||||||||
| 1 | R | Fusiform gyrus, culmen | 291 | 5.08 | 44 | −38 | −24 | |
| 2 | L/C/R | Middle/superior occipital gyrus, cuneus | R17–R19 | 858 | 4.69 | 16 | −82 | 30 |
| 3 | L | Culmen | 152 | 4.47 | −22 | −44 | −18 | |
| 4 | R | Middle temporal gyrus | 37, 39 | 271 | 4.46 | 42 | −68 | 8 |
| 5 | L/C/R | Precuneus, paracentral lobule | 5, L7 | 463 | 4.45 | −4 | 54 | 64 |
| 6 | L | Middle/superior temporal gyrus | 41 | 99 | 4.11 | −52 | −28 | 2 |
| Wakefulness > S2 | No suprathreshold cluster | |||||||
| Wakefulness < S2 | ||||||||
| 1 | L | Transverse/middle/superior temporal gyrus, inferior frontal gyrus, insula, inferior parietal lobule | 13, 21, 22, 29, 38, 40–42, 44, 45, 47 | 2367 | 6.85 | −64 | −8 | −4 |
| 2 | L/C/R | Posterior cingulate, fusiform gyrus, inferior occipital gyrus, lingual gyrus, cuneus | 17, 18, L23, 30 | 2564 | 6.81 | 8 | −88 | −8 |
| 3 | R | Transverse/middle/superior temporal gyrus, postcentral gyrus | 21, 22, 41–43, 47 | 1221 | 5.40 | 68 | −18 | 8 |
| 4 | L | Precentral gyrus | 1, 3, 4, 6 | 381 | 5.12 | −46 | −6 | 56 |
| 5 | L/C/R | Cingulate gyrus, paracentral lobule, medial frontal gyrus | 23, R24, L31 | 293 | 4.68 | 6 | −12 | 36 |
| Wakefulness > SWS | ||||||||
| 1 | L | Angular gyrus, supramarginal gyrus, inferior parietal lobule | 39, 40 | 659 | 5.55 | −48 | −70 | 30 |
| 2 | R | Middle frontal gyrus | 89 | 5.50 | 42 | 52 | −6 | |
| 3 | R | Angular gyrus, supramarginal gyrus, inferior/superior parietal lobule | 39, 40 | 628 | 4.83 | 46 | −66 | 28 |
| 4 | L/R | Anterior cingulate, medial frontal gyrus | 10, L32 | 744 | 4.77 | 10 | 48 | −10 |
| 5 | L | Inferior/medial frontal gyrus | 25, 47 | 119 | 4.64 | −20 | 20 | −20 |
| 6 | L/C/R | (Posterior) cingulate, precuneus | L7, L23, L30, L31 | 300 | 4.10 | −4 | −52 | 24 |
| 7 | L | Inferior/middle frontal gyrus | 47 | 60 | 3.91 | −32 | 32 | −18 |
| 8 | R | Inferior/middle frontal gyrus | 43 | 3.84 | 36 | 34 | −12 | |
| 9 | R | Inferior/middle/medial fronatl gyrus | 39 | 3.77 | 22 | 24 | −18 | |
| Wakefulness < SWS | No suprathreshold cluster | |||||||
| S2 > SWS | ||||||||
| 1 | R | Transverse/middle/superior temporal gyrus, inferior frontal gyrus | 21, 22, 29, 41, 47 | 727 | 5.30 | 66 | −12 | −6 |
| 2 | L | Inferior/medial frontal gyrus | 25, 47 | 249 | 4.89 | −28 | 24 | −20 |
| 3 | L | Transverse/superior temporal gyrus, inferior frontal gyrus | 21, 22, 41–43, 45, 47 | 827 | 4.71 | −58 | −22 | 8 |
| 4 | L/C/R | Posterior cingulate, lingual gyrus, cuneus | 30 | 647 | 4.40 | 8 | −88 | −8 |
| 5 | L/R | Orbital gyrus | 11 | 263 | 4.39 | 8 | 52 | −20 |
| 6 | L/C | Precuneus | 5, 7 | 454 | 4.33 | −4 | −52 | 64 |
| 7 | L/R | Superior/medial frontal gyrus | L9 | 197 | 4.27 | −2 | 58 | 32 |
| 8 | R | Pre-/postcentral gyrus | 3, 4 | 462 | 4.20 | 62 | −10 | 30 |
| S2 < SWS | No suprathreshold cluster | |||||||
Clusters resulting from second-level random-effects analysis (pFWE,cluster < 0.05, collection threshold puncorr < 0.001). Regions showing significant functional connectivity with all HF subregions are listed. Sorting is after t values of the cluster peak voxel. Brodmann areas are identified for clusters covering >3% of the respective area. Coordinates (x, y, z) are given in MNI space. L, Left hemisphere; R, right hemisphere; C, central position.
We further tested specific fc of three HF subregions across sleep stages. An F test on the main effect of subregion revealed widespread differences in fc between subregions (supplemental Fig. 1B, available at www.jneurosci.org as supplemental material). Independent sample t tests (supplemental Fig. 4, supplemental Table 1, available at www.jneurosci.org as supplemental material) showed that during wakefulness, fc of the CA was most robust to the IPL, the midline nodes of the DMN, and the thalamus. The fc with the lateral temporal cortex appears to be strongest in wakefulness and all NREM sleep stages for the CA. In S1, CA showed unique fc to the primary motor cortex. In S2, SUB revealed strongest fc to the anterior cingulate cortex/mPFC. Finally, in SWS, the DG showed unique fc to the occipital cortex, while SUB was most connected with the motor cortex. Results not restricted to low-frequency BOLD signal fluctuations (<0.1 Hz) showed qualitatively the same pattern as low-pass filtered data.
Furthermore, we generated activation maps related to sleep spindle activity in sleep stage 2, differentiating between slow and fast spindles. We were able to reproduce the basic pattern reported by Schabus and colleagues (2007) for fast spindles, with major clusters in the right thalamus, insula, lateral temporal cortex, cingulate cortex, and motor areas (Fig. 3A; supplemental Table 2, available at www.jneurosci.org as supplemental material). Notably, no spindle-specific activation was found in the HF, in accordance with the previous report. However, we observed a strong overlap between the HF fc map (contrast S2 > W) (Fig. 2) and the network associated with fast spindles. No significant activation was found for slow spindles. Fast spindles showed significantly higher activation than slow spindles in the left precentral and postcentral gyrus. Again, no effect of temporal low-pass filtering was observed.
Figure 3.

A, Activity related to fast sleep spindles in S2 (pFWE,cluster < 0.05, collection threshold p < 0.001) (supplemental Table 2, available at www.jneurosci.org as supplemental material). Note that the HF is not part of the spindle network. MNI coordinates of each slice are given. B, PPI analysis for the interaction fast spindles × SUB (pFWE,cluster < 0.05, collection threshold p < 0.001) (supplemental Table 3, available at www.jneurosci.org as supplemental material). Color coding indicates t values. MNI coordinates of each slice are given.
To investigate whether observed increases in hippocampal fc during S2 compared with wakefulness are associated with spindle activity in the EEG data, we performed PPI analyses separately for the three hippocampal subregions within S2. We observed that fc of the subiculum increased in parallel with EEG spindle activity (Fig. 3B) in a network comprising the cingulate cortex, lateral temporal cortex, motor cortex, SMA, and insular cortex. Spatially similar, yet less strong spindle-associated fc increases were found for the CA- and DG-bound network (supplemental Fig. 5 and supplemental Tables 3–5, available at www.jneurosci.org as supplemental material).
Discussion
Our data revealed altered functional connectivity of the hippocampal formation across NREM sleep stages compared with the waking state. We confirmed the previously reported integration of the HF into the DMN during wakefulness. During sleep stage 2, the HF was more strongly connected with the temporal, insular, occipital, and cingulate cortices than during wakefulness or slow-wave sleep. Spindle-related activity overlapped with the HF connectivity map (contrasting sleep stage 2 with wakefulness). The connectivity pattern of the subiculum to frontal, lateral temporal, and motor cortical regions and to the insula showed a strong interaction with occurrence of sleep spindles.
HF connectivity to the DMN
Contribution of the HF to the DMN has been reported earlier (Vincent et al., 2006; Buckner et al., 2008). Possible functions of the DMN include internal mentation and autobiographic memory retrieval; in autobiographical memory tasks, the HF, mPFC, and RspC have been found to be robustly coactivated (Svoboda et al., 2006). Similarly, episodic memory retrieval is related to activation in regions of the DMN (Wagner et al., 2005). Burianova et al. (2010) showed that a common neural network, including major DMN nodes, underlies the retrieval of declarative memories during wakefulness. Recently, Andrews-Hanna et al. (2010) showed that the DMN is comprised of two interacting subsystems, linked by a common midline core (PCC, mPFC). One of these subsystems, which includes the HF and the IPL, is particularly engaged during construction of mental scenes based on memory. Together, these reports showed that the fc of the hippocampus and the DMN conjointly constitute a network pivotal for episodic memory retrieval during wakefulness.
We observed only a trend for reduced coupling of the HF to the DMN in light sleep stages. In contrast, SWS was characterized by a robust decrease in functional coupling between the HF and the DMN. This breakdown of fc between the HF and DMN occurred in all core nodes of the DMN (PCC, mPFC, bilateral IPL). Reduced connectivity between the anterior and the posterior DMN nodes in SWS has been reported before (Horovitz et al., 2009; Sämann et al., 2011), while the posterior nodes (PCC, IPL) maintain (Sämann et al., 2011) or even increase (Horovitz et al., 2009) their connectivity. Using independent component analysis, we have shown previously that the HF has a sleep-dependent functional coupling to the DMN, significantly reduced already in sleep stage 1 (Sämann et al., 2011). We now report a breakdown of functional contribution of the HF to the DMN by a seed-based analysis. Reduced fc of the hippocampus to core DMN nodes (PCC, IPL) has also been reported for subjects under anesthesia (Martuzzi et al., 2010), which may point toward a common neural basis for behavioral similarities during these stages.
HF connectivity to neocortex is generally higher in S2 than in SWS
Our findings should be discussed in the context of the memory consolidation hypothesis of sleep (Walker and Stickgold, 2004; Diekelmann and Born, 2010). Several studies stress the relevance of SWS for memory consolidation (Plihal and Born, 1999; Gais and Born, 2004; Mölle et al., 2004; Peigneux et al., 2004; Rasch et al., 2007). However, there are reports that S2 may in fact play an equally important role (Gais et al., 2002; Schabus et al., 2004; Clemens et al., 2007; Nishida and Walker, 2007; Genzel et al., 2009). Furthermore, some data on the relevance of sleep EEG macrostructure for memory consolidation are derived from animal models, in which NREM sleep is usually not divided into substages (Ribeiro et al., 2004). Hence, it is not unambiguously clear, how, within NREM sleep, S2 and SWS differentially relate to the hippocampal–neocortical dialogue proposed to underlie sleep-related memory consolidation. Our data show that fc of HF with neocortical regions was higher in S2 than in SWS or wakefulness. This indicates functionally distinct processes during sleep: increased connectivity in S2 suggests an increased capacity for possible information transfer, whereas decreased connectivity between these regions in SWS suggests a functional system optimal for segregated reprocessing [in line with our previous findings of altered whole-brain network properties during sleep (Spoormaker et al., 2010)]; however, such a hypothesis needs affirmation by more fine-grained experimental methods and explicit memory testing.
Our analysis of subregional contributions to the HF network revealed that the CA region is driving the fc with the core DMN nodes (PCC/RspC, IPL, mPFC) during wakefulness, and to the lateral temporal cortex in all sleep stages. In contrast, mPFC fc is dominated by the subiculum in S2. In a series of elegant fMRI studies, sleep has been shown to alter the hippocampal–neocortical interplay, e.g., with the mPFC, underlying memory retrieval (Gais et al., 2007; Rauchs et al., 2008; Sterpenich et al., 2009; Takashima et al., 2009; Payne and Kensinger, 2011; Darsaud et al., 2010, 2011). The classical model of memory consolidation suggests that information is propagating from the neocortex to the hippocampus in the waking state while being reversed in sleep (Hasselmo and McClelland, 1999); however, a recent study showed more bidirectional coupling with increased influence of neocortical regions onto the HF toward deeper sleep stages (Wagner et al., 2010). We cannot comment on the direction of information propagation due to intrinsic limitations of fc analysis. Still, the strong involvement of the subiculum as the major hippocampal output region in S2 may suggest a hippocampal-to-neocortical information transfer.
Increased HF connectivity in S2 interacts with sleep spindles
Connectivity between HF and neocortex showed a strong interaction with fast sleep spindles, which was most pronounced for fc between the subiculum and the lateral temporal, insular, cingulate, and medial prefrontal cortices. Interestingly, we did not observe significant activation of the HF in direct association with occurrence of either fast or slow spindles (Fig. 3A; supplemental Table 2, available at www.jneurosci.org as supplemental material), in accordance with Schabus et al. (2007). This suggests that spindle activity may enhance fc between the HF and neocortical regions, but that it is not the sole cause of such connectivity. Temporal coupling between spindles, hippocampal ripples, and slow-oscillations has been described before in that during the up state of cortical slow oscillations, both spindle activity and hippocampal high-frequency ripple activity were increased (Sirota et al., 2003; Battaglia et al., 2004). The coordinated spindle–ripple events have been suggested to provide a mechanism for information transfer between hippocampus and neocortex (Siapas and Wilson, 1998; Sirota et al., 2003; Axmacher et al., 2006), which could explain that sleep spindles, most pronounced in S2 but also occurring in SWS (De Gennaro and Ferrara, 2003), are related to memory consolidation (Gais et al., 2002; Schabus et al., 2004, 2008; Clemens et al., 2005; Fogel and Smith, 2006; Genzel et al., 2009). At the same time, sleep spindles have been shown to reflect thalamus-driven cortical inhibition, which may signify a different or double functionality (Steriade et al., 1993; Cote et al., 2000).
Connectivity between the thalamus and HF was reduced in S1. This thalamic cluster was located in the nonspecific midline nucleus, known to send input to the hippocampal formation (Herkenham, 1978; Wouterlood et al., 1990). The finding of reduced HF/thalamus fc is in line with earlier observations of thalamic deactivation at sleep onset (Kaufmann et al., 2006) and generally reduced thalamic fc in S1 (Spoormaker et al., 2010).
Limitations
While our data provide evidence for generally increased HF fc in S2 and a relation of the hippocampal functional network and sleep spindles, we cannot conclusively state a direct link to memory-related processes. Future studies will need to compare HF fc in S2 with successful postsleep memory recall after intervention, as has been demonstrated in wakefulness (Durrant and Lewis, 2009; Takashima et al., 2009). Alternative functional interpretations, such as synaptic downscaling (Tononi and Cirelli, 2003; Axmacher et al., 2009) should also be considered in future experiments.
It should be noted that fMRI is limited by a lower temporal and spatial resolution than invasive electrophysiological data accessible in animal models. Therefore, low-frequency BOLD signal fluctuations during several minutes in a stable sleep stage, as analyzed here, can only provide an indirect measure of the hippocampal–cortical interplay and, especially in respect to memory processes, our data must be interpreted with caution. However, He et al. (2010) have recently demonstrated with intracranial electrophysiological data that the phase of lower frequencies is modulating the amplitude of higher frequencies. Moreover, He et al. (2008) showed that low-frequency BOLD signal fluctuations share a similar correlation structure as higher EEG frequencies. Following this idea, the reorganization of fc during sleep as detected by fMRI fluctuations may reflect low-frequency brain processes that provide a basis for information transfer during higher frequency EEG spindle activity.
Conclusion
Our data reveal important reorganization of the spontaneous HF connectivity during NREM sleep. Especially during sleep stage 2 and linked to sleep spindle activity, synchronous activation with lateral temporal, cingulate, and frontal regions arises that may represent coordinated neural activity within the memory network. As fMRI functional connectivity allows tracking of memory transfer in wakefulness, these altered functional connectivity patterns likely reflect differences in information processing, and possibly in sleep specific plasticity processes.
Footnotes
This study was supported by the Max Planck Society. K.C.A. acknowledges financial support from the Capes Foundation, Ministry of Education of Brazil (Protocol 2078066). V.I.S. acknowledges financial support from the Bavarian Academy of Sciences and Humanities. We thank Andrea Stiegler, Henning Peters, and Caroline Tully for the screening of participants; Rosa Schirmer for data management; and Armin Mann for technical support.
References
- Amunts K, Kedo O, Kindler M, Pieperhoff P, Mohlberg H, Shah NJ, Habel U, Schneider F, Zilles K. Cytoarchitectonic mapping of the human amygdala, hippocampal region and entorhinal cortex: intersubject variability and probability maps. Anat Embryol (Berl) 2005;210:343–352. doi: 10.1007/s00429-005-0025-5. [DOI] [PubMed] [Google Scholar]
- Andrews-Hanna JR, Reidler JS, Sepulcre J, Poulin R, Buckner RL. Functional-anatomic fractionation of the brain's default network. Neuron. 2010;65:550–562. doi: 10.1016/j.neuron.2010.02.005. [DOI] [PMC free article] [PubMed] [Google Scholar]
- Axmacher N, Mormann F, Fernández G, Elger CE, Fell J. Memory formation by neuronal synchronization. Brain Res Rev. 2006;52:170–182. doi: 10.1016/j.brainresrev.2006.01.007. [DOI] [PubMed] [Google Scholar]
- Axmacher N, Draguhn A, Elger CE, Fell J. Memory processes during sleep: beyond the standard consolidation theory. Cell Mol Life Sci. 2009;66:2285–2297. doi: 10.1007/s00018-009-0019-1. [DOI] [PMC free article] [PubMed] [Google Scholar]
- Battaglia FP, Sutherland GR, McNaughton BL. Hippocampal sharp wave bursts coincide with neocortical “up-state” transitions. Learn Mem. 2004;11:697–704. doi: 10.1101/lm.73504. [DOI] [PMC free article] [PubMed] [Google Scholar]
- Born J, Rasch B, Gais S. Sleep to remember. Neuroscientist. 2006;12:410–424. doi: 10.1177/1073858406292647. [DOI] [PubMed] [Google Scholar]
- Brett M, Anton JL, Valabregue R, Poline J-P. Region of interest analysis using an SPM toolbox. Presented at the 8th International Conference on Functional Mapping of the Human Brain; Sendai, Japan. 2002. [Google Scholar]
- Buckner RL. The role of the hippocampus in prediction and imagination. Annu Rev Psychol. 2010;61:27–48. doi: 10.1146/annurev.psych.60.110707.163508. [DOI] [PubMed] [Google Scholar]
- Buckner RL, Andrews-Hanna JR, Schacter DL. The brain's default network: anatomy, function, and relevance to disease. Ann N Y Acad Sci. 2008;1124:1–38. doi: 10.1196/annals.1440.011. [DOI] [PubMed] [Google Scholar]
- Burianova H, McIntosh AR, Grady CL. A common functional brain network for autobiographical, episodic, and semantic memory retrieval. Neuroimage. 2010;49:865–874. doi: 10.1016/j.neuroimage.2009.08.066. [DOI] [PubMed] [Google Scholar]
- Clemens Z, Fabó D, Halász P. Overnight verbal memory retention correlates with the number of sleep spindles. Neuroscience. 2005;132:529–535. doi: 10.1016/j.neuroscience.2005.01.011. [DOI] [PubMed] [Google Scholar]
- Clemens Z, Mölle M, Eross L, Barsi P, Halász P, Born J. Temporal coupling of parahippocampal ripples, sleep spindles and slow oscillations in humans. Brain. 2007;130:2868–2878. doi: 10.1093/brain/awm146. [DOI] [PubMed] [Google Scholar]
- Cote KA, Epps TM, Campbell KB. The role of the spindle in human information processing of high-intensity stimuli during sleep. J Sleep Res. 2000;9:19–26. doi: 10.1046/j.1365-2869.2000.00188.x. [DOI] [PubMed] [Google Scholar]
- Czisch M, Wehrle R. EEG–fMRI: Sleep. Heidelberg: Springer; 2009. [Google Scholar]
- Darsaud A, Dehon H, Lahl O, Sterpenich V, Boly M, Dang-Vu T, Desseilles M, Gais S, Matarazzo L, Peters F, Schabus M, Schmidt C, Tinguely G, Vandewalle G, Luxen A, Maquet P, Collette F. Does sleep promote false memories? J Cogn Neurosci. 2010;23:26–40. doi: 10.1162/jocn.2010.21448. [DOI] [PubMed] [Google Scholar]
- Darsaud A, Wagner U, Balteau E, Desseilles M, Sterpenich V, Vandewalle G, Albouy G, Dang-Vu T, Collette F, Boly M, Schabus M, Degueldre C, Luxen A, Maquet P. Neural precursors of delayed insight. J Cogn Neurosci. 2011;23:1900–1910. doi: 10.1162/jocn.2010.21550. [DOI] [PubMed] [Google Scholar]
- De Gennaro L, Ferrara M. Sleep spindles: an overview. Sleep Med Rev. 2003;7:423–440. doi: 10.1053/smrv.2002.0252. [DOI] [PubMed] [Google Scholar]
- Diekelmann S, Born J. The memory function of sleep. Nat Rev Neurosci. 2010;11:114–126. doi: 10.1038/nrn2762. [DOI] [PubMed] [Google Scholar]
- Durrant S, Lewis PA. Memory consolidation: tracking transfer with functional connectivity. Curr Biol. 2009;19:R860–R862. doi: 10.1016/j.cub.2009.08.019. [DOI] [PubMed] [Google Scholar]
- Eickhoff SB, Stephan KE, Mohlberg H, Grefkes C, Fink GR, Amunts K, Zilles K. A new SPM toolbox for combining probabilistic cytoarchitectonic maps and functional imaging data. Neuroimage. 2005;25:1325–1335. doi: 10.1016/j.neuroimage.2004.12.034. [DOI] [PubMed] [Google Scholar]
- Fogel SM, Smith CT. Learning-dependent changes in sleep spindles and stage 2 sleep. J Sleep Res. 2006;15:250–255. doi: 10.1111/j.1365-2869.2006.00522.x. [DOI] [PubMed] [Google Scholar]
- Fox MD, Raichle ME. Spontaneous fluctuations in brain activity observed with functional magnetic resonance imaging. Nat Rev Neurosci. 2007;8:700–711. doi: 10.1038/nrn2201. [DOI] [PubMed] [Google Scholar]
- Friston KJ, Stephan KE, Lund TE, Morcom A, Kiebel S. Mixed-effects and fMRI studies. Neuroimage. 2005;24:244–252. doi: 10.1016/j.neuroimage.2004.08.055. [DOI] [PubMed] [Google Scholar]
- Gais S, Born J. Low acetylcholine during slow-wave sleep is critical for declarative memory consolidation. Proc Natl Acad Sci U S A. 2004;101:2140–2144. doi: 10.1073/pnas.0305404101. [DOI] [PMC free article] [PubMed] [Google Scholar]
- Gais S, Mölle M, Helms K, Born J. Learning-dependent increases in sleep spindle density. J Neurosci. 2002;22:6830–6834. doi: 10.1523/JNEUROSCI.22-15-06830.2002. [DOI] [PMC free article] [PubMed] [Google Scholar]
- Gais S, Albouy G, Boly M, Dang-Vu TT, Darsaud A, Desseilles M, Rauchs G, Schabus M, Sterpenich V, Vandewalle G, Maquet P, Peigneux P. Sleep transforms the cerebral trace of declarative memories. Proc Natl Acad Sci U S A. 2007;104:18778–18783. doi: 10.1073/pnas.0705454104. [DOI] [PMC free article] [PubMed] [Google Scholar]
- Genzel L, Dresler M, Wehrle R, Grözinger M, Steiger A. Slow wave sleep and REM sleep awakenings do not affect sleep dependent memory consolidation. Sleep. 2009;32:302–310. doi: 10.1093/sleep/32.3.302. [DOI] [PMC free article] [PubMed] [Google Scholar]
- Girardeau G, Benchenane K, Wiener SI, Buzsáki G, Zugaro MB. Selective suppression of hippocampal ripples impairs spatial memory. Nat Neurosci. 2009;12:1222–1223. doi: 10.1038/nn.2384. [DOI] [PubMed] [Google Scholar]
- Hasselmo ME, McClelland JL. Neural models of memory. Curr Opin Neurobiol. 1999;9:184–188. doi: 10.1016/s0959-4388(99)80025-7. [DOI] [PubMed] [Google Scholar]
- Hayasaka S, Phan KL, Liberzon I, Worsley KJ, Nichols TE. Nonstationary cluster-size inference with random field and permutation methods. Neuroimage. 2004;22:676–687. doi: 10.1016/j.neuroimage.2004.01.041. [DOI] [PubMed] [Google Scholar]
- He BJ, Snyder AZ, Zempel JM, Smyth MD, Raichle ME. Electrophysiological correlates of the brain's intrinsic large-scale functional architecture. Proc Natl Acad Sci U S A. 2008;105:16039–16044. doi: 10.1073/pnas.0807010105. [DOI] [PMC free article] [PubMed] [Google Scholar]
- He BJ, Zempel JM, Snyder AZ, Raichle ME. The temporal structures and functional significance of scale-free brain activity. Neuron. 2010;66:353–369. doi: 10.1016/j.neuron.2010.04.020. [DOI] [PMC free article] [PubMed] [Google Scholar]
- Herkenham M. The connections of the nucleus reuniens thalami: evidence for a direct thalamo-hippocampal pathway in the rat. J Comp Neurol. 1978;177:589–610. doi: 10.1002/cne.901770405. [DOI] [PubMed] [Google Scholar]
- Horovitz SG, Braun AR, Carr WS, Picchioni D, Balkin TJ, Fukunaga M, Duyn JH. Decoupling of the brain's default mode network during deep sleep. Proc Natl Acad Sci U S A. 2009;106:11376–11381. doi: 10.1073/pnas.0901435106. [DOI] [PMC free article] [PubMed] [Google Scholar]
- Kaufmann C, Wehrle R, Wetter TC, Holsboer F, Auer DP, Pollmächer T, Czisch M. Brain activation and hypothalamic functional connectivity during human non-rapid eye movement sleep: an EEG/fMRI study. Brain. 2006;129:655–667. doi: 10.1093/brain/awh686. [DOI] [PubMed] [Google Scholar]
- Larson-Prior LJ, Zempel JM, Nolan TS, Prior FW, Snyder AZ, Raichle ME. Cortical network functional connectivity in the descent to sleep. Proc Natl Acad Sci U S A. 2009;106:4489–4494. doi: 10.1073/pnas.0900924106. [DOI] [PMC free article] [PubMed] [Google Scholar]
- Martuzzi R, Ramani R, Qiu M, Rajeevan N, Constable RT. Functional connectivity and alterations in baseline brain state in humans. Neuroimage. 2010;49:823–834. doi: 10.1016/j.neuroimage.2009.07.028. [DOI] [PMC free article] [PubMed] [Google Scholar]
- Mölle M, Born J. Hippocampus whispering in deep sleep to prefrontal cortex–for good memories? Neuron. 2009;61:496–498. doi: 10.1016/j.neuron.2009.02.002. [DOI] [PubMed] [Google Scholar]
- Mölle M, Marshall L, Gais S, Born J. Learning increases human electroencephalographic coherence during subsequent slow sleep oscillations. Proc Natl Acad Sci U S A. 2004;101:13963–13968. doi: 10.1073/pnas.0402820101. [DOI] [PMC free article] [PubMed] [Google Scholar]
- Nishida M, Walker MP. Daytime naps, motor memory consolidation and regionally specific sleep spindles. PLoS One. 2007;2:e341. doi: 10.1371/journal.pone.0000341. [DOI] [PMC free article] [PubMed] [Google Scholar]
- Payne JD, Kensinger EA. Sleep leads to changes in the emotional memory trace: evidence from fMRI. J Cogn Neurosci. 2011;23:1285–1297. doi: 10.1162/jocn.2010.21526. [DOI] [PubMed] [Google Scholar]
- Peigneux P, Laureys S, Fuchs S, Collette F, Perrin F, Reggers J, Phillips C, Degueldre C, Del Fiore G, Aerts J, Luxen A, Maquet P. Are spatial memories strengthened in the human hippocampus during slow wave sleep? Neuron. 2004;44:535–545. doi: 10.1016/j.neuron.2004.10.007. [DOI] [PubMed] [Google Scholar]
- Plihal W, Born J. Effects of early and late nocturnal sleep on priming and spatial memory. Psychophysiology. 1999;36:571–582. [PubMed] [Google Scholar]
- Rasch B, Born J. Maintaining memories by reactivation. Curr Opin Neurobiol. 2007;17:698–703. doi: 10.1016/j.conb.2007.11.007. [DOI] [PubMed] [Google Scholar]
- Rasch B, Büchel C, Gais S, Born J. Odor cues during slow-wave sleep prompt declarative memory consolidation. Science. 2007;315:1426–1429. doi: 10.1126/science.1138581. [DOI] [PubMed] [Google Scholar]
- Rauchs G, Orban P, Schmidt C, Albouy G, Balteau E, Degueldre C, Schnackers C, Sterpenich V, Tinguely G, Luxen A, Maquet P, Peigneux P. Sleep modulates the neural substrates of both spatial and contextual memory consolidation. PLoS One. 2008;3:e2949. doi: 10.1371/journal.pone.0002949. [DOI] [PMC free article] [PubMed] [Google Scholar]
- Rechtschaffen A, Kales A. Washington, D.C.: NIH; 1968. A manual of standardized terminology, techniques and scoring system for sleep stages of human subjects: NIH publication no 204. [DOI] [PubMed] [Google Scholar]
- Ribeiro S, Gervasoni D, Soares ES, Zhou Y, Lin SC, Pantoja J, Lavine M, Nicolelis MA. Long-lasting novelty-induced neuronal reverberation during slow-wave sleep in multiple forebrain areas. PLoS Biol. 2004;2:e24. doi: 10.1371/journal.pbio.0020024. [DOI] [PMC free article] [PubMed] [Google Scholar]
- Sämann PG, Wehrle R, Hoehn D, Spoormaker VI, Peters H, Tully C, Holsboer F, Czisch M. Cereb Cortex. 2011. Development of the brain's default mode network from wakefulness to slow wave sleep. [DOI] [PubMed] [Google Scholar]
- Schabus M, Gruber G, Parapatics S, Sauter C, Klösch G, Anderer P, Klimesch W, Saletu B, Zeitlhofer J. Sleep spindles and their significance for declarative memory consolidation. Sleep. 2004;27:1479–1485. doi: 10.1093/sleep/27.7.1479. [DOI] [PubMed] [Google Scholar]
- Schabus M, Dang-Vu TT, Albouy G, Balteau E, Boly M, Carrier J, Darsaud A, Degueldre C, Desseilles M, Gais S, Phillips C, Rauchs G, Schnakers C, Sterpenich V, Vandewalle G, Luxen A, Maquet P. Hemodynamic cerebral correlates of sleep spindles during human non-rapid eye movement sleep. Proc Natl Acad Sci U S A. 2007;104:13164–13169. doi: 10.1073/pnas.0703084104. [DOI] [PMC free article] [PubMed] [Google Scholar]
- Schabus M, Hoedlmoser K, Pecherstorfer T, Anderer P, Gruber G, Parapatics S, Sauter C, Kloesch G, Klimesch W, Saletu B, Zeitlhofer J. Interindividual sleep spindle differences and their relation to learning-related enhancements. Brain Res. 2008;1191:127–135. doi: 10.1016/j.brainres.2007.10.106. [DOI] [PMC free article] [PubMed] [Google Scholar]
- Siapas AG, Wilson MA. Coordinated interactions between hippocampal ripples and cortical spindles during slow-wave sleep. Neuron. 1998;21:1123–1128. doi: 10.1016/s0896-6273(00)80629-7. [DOI] [PubMed] [Google Scholar]
- Sirota A, Csicsvari J, Buhl D, Buzsáki G. Communication between neocortex and hippocampus during sleep in rodents. Proc Natl Acad Sci U S A. 2003;100:2065–2069. doi: 10.1073/pnas.0437938100. [DOI] [PMC free article] [PubMed] [Google Scholar]
- Spoormaker VI, Schröter MS, Gleiser PM, Andrade KC, Dresler M, Wehrle R, Sämann PG, Czisch M. Development of a large-scale functional brain network during human non-rapid eye movement sleep. J Neurosci. 2010;30:11379–11387. doi: 10.1523/JNEUROSCI.2015-10.2010. [DOI] [PMC free article] [PubMed] [Google Scholar]
- Squire LR. Memory systems of the brain: a brief history and current perspective. Neurobiol Learn Mem. 2004;82:171–177. doi: 10.1016/j.nlm.2004.06.005. [DOI] [PubMed] [Google Scholar]
- Steriade M, McCormick DA, Sejnowski TJ. Thalamocortical oscillations in the sleeping and aroused brain. Science. 1993;262:679–685. doi: 10.1126/science.8235588. [DOI] [PubMed] [Google Scholar]
- Sterpenich V, Albouy G, Darsaud A, Schmidt C, Vandewalle G, Dang Vu TT, Desseilles M, Phillips C, Degueldre C, Balteau E, Collette F, Luxen A, Maquet P. Sleep promotes the neural reorganization of remote emotional memory. J Neurosci. 2009;29:5143–5152. doi: 10.1523/JNEUROSCI.0561-09.2009. [DOI] [PMC free article] [PubMed] [Google Scholar]
- Sutherland GR, McNaughton B. Memory trace reactivation in hippocampal and neocortical neuronal ensembles. Curr Opin Neurobiol. 2000;10:180–186. doi: 10.1016/s0959-4388(00)00079-9. [DOI] [PubMed] [Google Scholar]
- Svoboda E, McKinnon MC, Levine B. The functional neuroanatomy of autobiographical memory: a meta-analysis. Neuropsychologia. 2006;44:2189–2208. doi: 10.1016/j.neuropsychologia.2006.05.023. [DOI] [PMC free article] [PubMed] [Google Scholar]
- Takashima A, Nieuwenhuis IL, Jensen O, Talamini LM, Rijpkema M, Fernández G. Shift from hippocampal to neocortical centered retrieval network with consolidation. J Neurosci. 2009;29:10087–10093. doi: 10.1523/JNEUROSCI.0799-09.2009. [DOI] [PMC free article] [PubMed] [Google Scholar]
- Tononi G, Cirelli C. Sleep and synaptic homeostasis: a hypothesis. Brain Res Bull. 2003;62:143–150. doi: 10.1016/j.brainresbull.2003.09.004. [DOI] [PubMed] [Google Scholar]
- Tzourio-Mazoyer N, Landeau B, Papathanassiou D, Crivello F, Etard O, Delcroix N, Mazoyer B, Joliot M. Automated anatomical labeling of activations in SPM using a macroscopic anatomical parcellation of the MNI MRI single-subject brain. Neuroimage. 2002;15:273–289. doi: 10.1006/nimg.2001.0978. [DOI] [PubMed] [Google Scholar]
- Vincent JL, Snyder AZ, Fox MD, Shannon BJ, Andrews JR, Raichle ME, Buckner RL. Coherent spontaneous activity identifies a hippocampal-parietal memory network. J Neurophysiol. 2006;96:3517–3531. doi: 10.1152/jn.00048.2006. [DOI] [PubMed] [Google Scholar]
- Wagner AD, Shannon BJ, Kahn I, Buckner RL. Parietal lobe contributions to episodic memory retrieval. Trends Cogn Sci. 2005;9:445–453. doi: 10.1016/j.tics.2005.07.001. [DOI] [PubMed] [Google Scholar]
- Wagner T, Axmacher N, Lehnertz K, Elger CE, Fell J. Sleep-dependent directional coupling between human neocortex and hippocampus. Cortex. 2010;46:256–263. doi: 10.1016/j.cortex.2009.05.012. [DOI] [PubMed] [Google Scholar]
- Walker MP. The role of sleep in cognition and emotion. Ann N Y Acad Sci. 2009;1156:168–197. doi: 10.1111/j.1749-6632.2009.04416.x. [DOI] [PubMed] [Google Scholar]
- Walker MP, Stickgold R. Sleep-dependent learning and memory consolidation. Neuron. 2004;44:121–133. doi: 10.1016/j.neuron.2004.08.031. [DOI] [PubMed] [Google Scholar]
- Wouterlood FG, Saldana E, Witter MP. Projection from the nucleus reuniens thalami to the hippocampal region: light and electron microscopic tracing study in the rat with the anterograde tracer Phaseolus vulgaris-leucoagglutinin. J Comp Neurol. 1990;296:179–203. doi: 10.1002/cne.902960202. [DOI] [PubMed] [Google Scholar]