Abstract
Social communication in nonhuman primates and humans is strongly affected by facial information from other individuals. Many cortical and subcortical brain areas are known to be involved in processing facial information. However, how the neural representation of faces differs across different brain areas remains unclear. Here, we demonstrate that the reference frame for spatial frequency (SF) tuning of face-responsive neurons differs in the temporal visual cortex and amygdala in monkeys. Consistent with psychophysical properties for face recognition, temporal cortex neurons were tuned to image-based SFs (cycles/image) and showed viewing distance-invariant representation of face patterns. On the other hand, many amygdala neurons were influenced by retina-based SFs (cycles/degree), a characteristic that is useful for social distance computation. The two brain areas also differed in the luminance contrast sensitivity of face-responsive neurons; amygdala neurons sharply reduced their responses to low luminance contrast images, while temporal cortex neurons maintained the level of their responses. From these results, we conclude that different types of visual processing in the temporal visual cortex and the amygdala contribute to the construction of the neural representations of faces.
Introduction
Nonhuman primates and humans rely extensively on facial information from other individuals for social communication. The neural mechanisms for processing facial information have been broadly studied by recording the neuronal activities in monkeys. Neurons selectively responding to faces are found in different parts of the brain, including several subregions of the temporal cortex (Gross et al., 1972; Bruce et al., 1981; Perrett et al., 1982; Desimone et al., 1984; Tsao et al., 2006), the inferior frontal convexity of the prefrontal cortex and the orbitofrontal cortex (Ö Scalaidhe et al., 1997; Rolls et al., 2006), and in several nuclei of the amygdala (Leonard et al., 1985; Nakamura et al., 1992; Gothard et al., 2007). Many of these neurons respond to grayscale photographs or line drawings of a face but not to scrambled images, indicating that they respond to face-like patterns and not to the color or texture of the face (Bruce et al., 1981; Perrett et al., 1982; Ö Scalaidhe et al., 1999; Kuraoka and Nakamura, 2006).
Despite these extensive studies, it remains unclear how the neural representation of faces differs across different brain areas. It is plausible that different face representations are constructed in different brain areas because multiple visual pathways are presumed to contribute to face processing. Although the cortical ventral pathway, which includes the temporal cortex, plays an important role in face processing (Rolls, 2000), brain imaging studies in human subjects suggest that face processing also occurs along a subcortical extrageniculostriate pathway (consisting of the superior colliculus, the pulvinar, and the amygdala), which bypasses the temporal cortex (Morris et al., 2001; Vuilleumier et al., 2003; Pasley et al., 2004; Williams et al., 2004).
Here, we investigated neural representation of faces in different brain areas by comparing the spatial reference frame for facial pattern representation in the temporal cortex and amygdala. When human subjects recognize or identify a face, they depend on the spatial frequencies (SFs) of the visual image of the face. Because their performance is only minimally influenced by stimulus size, they depend more on relative SFs or image-based SFs (cycles/image), which are given by the products of retina-based SFs (cycles/degree) and stimulus size (degrees/image), than on retina-based SFs themselves (Hayes et al., 1986; Näsänen, 1999). We thus expected that neurons directly involved in face recognition would be tuned to image-based SFs. Although face-responsive neurons in the temporal cortex are selective for SFs (Rolls et al., 1985, 1987), and different SF contents of faces elicit distinct activation patterns in the fusiform cortex and the amygdala (Vuilleumier et al., 2003), the reference frame of the SF tuning (image-based vs retina-based) has not been examined in any brain area.
We found that the majority of temporal cortex neurons are tuned to image-based SFs, while many amygdala neurons are influenced by retina-based SFs. We also found that sensitivity to stimulus luminance contrast differs in the two areas. We suggest that different neural mechanisms underlie the constructions of face representation in the temporal visual cortex and the amygdala.
Materials and Methods
Surgery.
Two monkeys (Macaca fuscata; Monkey S, male; and Monkey K, female) were used. All animal care and experimental procedures were approved by the Animal Experiment Committee of Osaka University in compliance with the National Institutes of Health Guide for the Care and Use of Laboratory Animals.
A head holder and a recording chamber were attached to the skull. The recording chamber was centered 20 or 21 mm anterior to the ear canals and 10 mm lateral with a 10° tilt relative to the midline. This setting allowed us to record from both the temporal cortex and the amygdala. Magnetic resonance images guided us to place the recording chamber at the proper position. A portion of the skull within the chamber was removed to allow for electrode insertion.
All surgical procedures were performed under anesthesia and aseptic conditions (Kotake et al., 2009). The monkeys were premedicated with atropine sulfate (0.03 mg/kg, i.m.; Tanabe) and sedated with ketamine hydrochloride (Ketalar, 5 mg/kg, i.m.; Sankyo). Surgical anesthesia was maintained by inhalation of isoflurane (1–3%) in 70% N2O and 30% O2 through an endotracheal cannula. Local anesthesia was applied with lidocaine (2% Xylocaine; AstraZeneca) as needed. A vasotropic drug (Adona, 1.0 mg/kg i.m.; Tanabe) and an anti-plasmin agent (Transamine, 17 mg/kg, i.m.; Dai-ichi) were given to reduce bleeding. Lactated Ringer's solution (Solulact-D, 3 ml/kg/h; Terumo) containing atropine sulfate (0.005 mg/kg/h) was infused through an intravenous tube. Electrocardiogram, arterial oxygen-saturation levels, and the heart rate were continuously monitored throughout the surgery. Body temperature was maintained at 37–38°C with a heating pad. After the surgery, an antibiotic (Pentcilin, 40 mg/kg, i.m.; Toyama Chemical), an anti-inflammatory/analgesic agent (Voltaren, 1 mg/kg; Novartis Pharma), and a corticosteroid (Decadron, 0.1 mg/kg, i.m.; Banyu) were given.
During the first postoperative week, the monkeys were treated with an anti-inflammatory/analgesic agent (Menamin, 0.8 mg/kg, i.m.; Chugai), Pentcilin, and Decadoron. After a period of >2 weeks, we started to train the monkeys to perform a fixation task.
Behavioral task.
The monkeys were required to perform a fixation task. They were seated with their head fixed in a primate chair in a dark room and faced a CRT monitor (HM903D-A, Iiyama; screen size, 36.5 × 27.5 cm; resolution, 1600 × 1200 pixels; refresh rate, 85 Hz). The screen subtended 32.8° × 25.5° in visual angle. Gaze direction was monitored with an infrared camera system (Matsuda et al., 2000). At the start of each trial, a dot (0.18° × 0.18°) was presented on the center of the screen. After the monkeys fixated on it for 0.5 s, a visual stimulus was presented for 0.5 s. The fixation point was overlaid by visual stimuli. During the stimulus period, the monkeys were required to keep fixation on the center of the screen without the fixation point. When completing fixation for a total of 1 s, they were rewarded with a drop of water. The fixation window was 2° × 2° for Monkey S and 3.5° × 3.5° for Monkey K. If the monkeys moved their gaze beyond the window, the trial was terminated without any reward and the data were discarded.
Visual stimuli were presented with an OpenGL program. Gamma correction was applied to accomplish a linear relationship between the actual luminance and the gun intensity of the CRT monitor. The lowest and maximum luminances were 0.02 cd/m2 and 46 cd/m2, respectively, and the background luminance was 22 cd/m2.
Face stimuli.
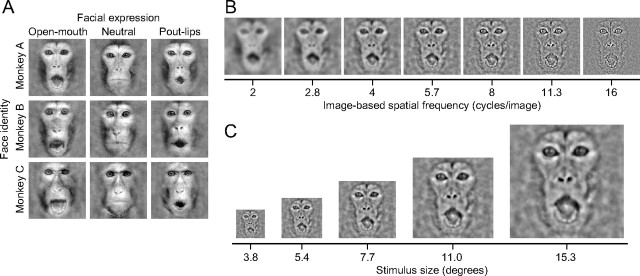
Face images were created from nine photographs of three monkeys displaying three different facial expressions (open-mouth, neutral, and pout-lips) (Fig. 1A). Open-mouth is an aggressive expression in monkeys and pout-lips is an affiliative expression indicating a wish for food or positive social interaction (Van Hooff, 1967). The nine photographs were first masked by a filter to isolate faces from body features and background scenes. Then, two-dimensional (2D) Fourier transforms of the photographs were calculated. The 2D amplitude spectrum of each face was replaced with the average 2D amplitude spectrum across all photographs, while the phase spectrum for each face was preserved. After this manipulation, the nine photographs were inverse-transformed to the space domain. Thus, the nine photographs had identical stimulus energy.
Figure 1.
Visual stimuli. A, Original face images consisted of three different monkeys displaying three different facial expressions (open-mouth, neutral, and pout-lips). B, Bandpass filtered face images. Bandpass filters with different center image-based SFs were applied to an original face image (top left in A) in seven steps. C, An example of changes in stimulus size. Size manipulation was applied to a filtered face image (center in B) in five steps. Size manipulation was applied to all filtered face images; thus, a stimulus set consisted of 35 images.
To examine the SF tuning of face-responsive neurons, we used bandpass filtered face images (Fig. 1B). Bandpass filtering was done by multiplying a Gaussian function that has an annulus shape in the 2D Fourier domain. The centers of the Gaussian functions were set at 2.0 cycles/image, 2.8 cycles/image, 4.0 cycles/image, 5.7 cycles/image, 8.0 cycles/image, 11.3 cycles/image, or 16.0 cycles/image. The full-width at half-maximum of the Gaussian function was always 2.4 octaves, regardless of the center image-based SFs. We set the amplitude spectrum of the original face images to be flat so that the total luminance contrast of the filtered face images was determined solely by the multiplied Gaussian function. The total luminance contrast was balanced among the filtered face images by setting the peak amplitude of the Gaussian function inversely proportional to the center image-based SF. We varied the size of the filtered face images between 3.8° × 3.8°, 5.4° × 5.4°, 7.7° × 7.7°, 11.0° × 11.0°, and 15.3° × 15.3° (Fig. 1C).
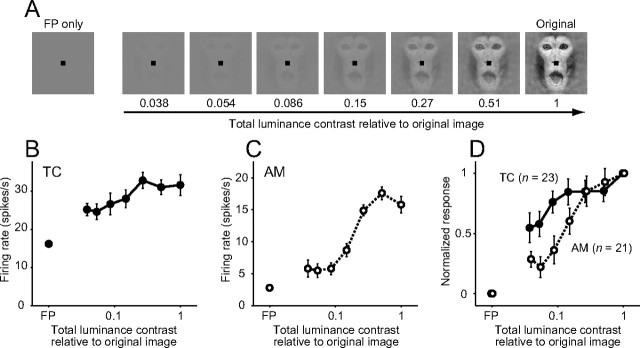
To test for luminance contrast sensitivity, face images of different total luminance contrast were created from an effective image (see Fig. 9A). We defined luminance contrast of each pixel as the deviation from the mean luminance across a face image, and calculated the total luminance contrast by integrating the luminance contrast over the image. Total luminance contrasts, relative to that of the original face image, were 0.038, 0.054, 0.086, 0.15, 0.27, 0.51, and 1. The size of the stimuli was fixed at 7.7° × 7.7°.
Figure 9.
Luminance contrast sensitivity of face-responsive neurons. A, An example of visual stimuli when testing for luminance contrast sensitivity. Total luminance contrast of an original face image (Fig. 1A, top left) was reduced in seven steps. B, C, Example responses of a temporal cortex neuron (B) and an amygdala neuron (C) to a series of contrast manipulated face images. Symbols and error bars indicate mean ± SEM. of firing rates during stimulus presentation. The neurons were tested by the stimulus set created from an original face image of Monkey A displaying a neutral expression (Fig. 1A, top center) in B, and Monkey A displaying pout-lips (Fig. 1A, top right) in C. D, Average normalized responses of temporal cortex neurons (n = 23; filled circles with a solid line) and amygdala neurons (n = 21; open circles with a dotted line). Symbols and error bars indicate mean ± SEM. of normalized mean firing rates across populations.
Electrophysiology.
We recorded neuronal activity with tungsten electrodes (0.2-2.0 MΩ at 1 kHz; Fredrick-Haer). The voltage signals were amplified and filtered by an amplifier (MEG-6116; Nihon Kohden) and monitored on an oscilloscope. We isolated extracellular action potentials or spikes from a single neuron with an on-line spike sorting system (Multi Spike Detector; Alpha-Omega). The voltage signals were sampled at 20 kHz and stored on a computer for off-line spike sorting. All results reported in this paper were based on data from off-line spike sorting.
Experimental protocol.
When we put electrodes toward the recording site, we noted transition patterns of spike occurrence and estimated the location of sulci, gray and white matter, as well as nuclei. The patterns were consistent with magnetic resonance images. Once a face-responding neuron was isolated, we presented a set of filtered face images, created from the most effective face, in a pseudo-random order. For this SF-size test, each stimulus was presented at least six times (mean, 9.8 times). For a subset of the recorded neurons that were clearly isolated even after completing the SF-size test, we examined luminance contrast sensitivity. Trials with a fixation point only were also included in this test. Face images were always centered on the fixation point. For this luminance contrast test, we presented each stimulus at least 10 times (mean, 10.2 times). We performed these tests only for the most effective face of the recorded neurons.
Data analysis.
We quantified neuronal responses by calculating the mean firing rate during a 500 ms time window of the stimulus period. The time window was delayed by 80 ms to compensate for response latency. We focused our analysis on face-responsive neurons that were selective to image-based SFs (Kruskal–Wallis test; p < 0.01) at two or more stimulus sizes. The neurons that responded only to a particular stimulus size were excluded from the analysis.
To characterize the dependence of the SF tuning on stimulus size, we fitted the neuronal responses with five Gaussian functions; each Gaussian function characterized the SF tuning for a particular stimulus size:
 |
where i is the index of the stimulus size (−2, −1, 0, 1, 2 corresponds to 3.8°, 5.4°, 7.7°, 11.0°, 15.3°, respectively), Ri(sf) denotes the response to the image-based SF, sf, at the corresponding size, Ai is the peak at the corresponding size, σi is the width at the corresponding size, B is the baseline activity, sf0 is the preferred image-based SF at a stimulus size of 7.7°, and shift index, SI, is the parameter that quantifies the dependency between the preferred image-based SFs and the sizes. When SI is 0, the preferred image-based SF does not change across stimulus sizes (i.e., ideally tuned to image-based SFs). When SI is 1, the preferred “image”-based SF is proportional to the stimulus size and the preferred “retina”-based SF does not change (i.e., ideally tuned to retina-based SFs). Parameters Ai and σi were independent across stimulus sizes, while B, sf0, and SI were the same for different sizes. All of these 13 parameters were estimated from data. This is a variant of the method used for characterizing speed tuning of neurons in area MT/V5 (Priebe et al., 2003). We used the “fmincon” function in MATLAB (Mathworks) to fit the parameters of the five SF tuning curves.
We constrained the parameters as follows. The amplitude of the Gaussian functions, Ai, and the baseline, B, were constrained to positive values. The width of the Gaussian functions, σi, was constrained to values between 0.25 and 4. The center of the Gaussian function at 7.7°, sf0, was constrained to values between 2 and 16. The parameter quantifying the size dependency, SI, was constrained to values between −2 and 2.
We estimated the response latency of each neuron by Poisson spike train analysis (Legéndy and Salcman, 1985; Hanes et al., 1995; Tanabe et al., 2004). One neuron in the amygdala was excluded because its response latency could not be determined.
We quantified the strength of selectivity for facial expression and face identity by calculating the transmitted information for each dimension (Panzeri and Treves, 1996; Sugase et al., 1999). If a neuron was tested only with a small number of repetitions (<10 times) in the initial test, or spikes from a neuron were sorted in the SF-size test but not in the initial test, the neuron was excluded from the analysis.
Histology.
After completing all experiments with Monkey S, we made electric lesions by passing an electric current (10 μA, 10 or 20 s, electrode negative) to histologically verify the recording sites. The monkey was overdosed with pentobarbital sodium (100 mg/kg, i.p.) and transcardially perfused with 0.9% sodium chloride solution and 4% paraformaldehyde. The brain was immersed in sucrose solutions (10–30%), frozen, and cut into 80 μm sections. The sections were stained with cresyl violet. Recording sites were reconstructed using the position of the electric lesions and the readings of the electrode manipulator. Monkey K is still alive and participating in other experiments.
Results
We used bandpass filtered face images of various stimulus sizes as visual stimuli (Fig. 1). We tested whether face-responsive neurons are tuned to image-based SFs or retina-based SFs by examining the effects of stimulus size on neuronal tuning to image-based SFs. If a neuron is ideally tuned to image-based SFs, by definition, its tuning curves to image-based SFs do not change across different stimulus sizes (Fig. 2A,C). If a neuron is tuned to retina-based SFs, on the other hand, its tuning curves should systematically shift along the axis of the image-based SFs to compensate for changes in retina-based SFs accompanying changes in stimulus size (Fig. 2B,D). We see this difference in a 2D plot of the responses where the abscissa denotes image-based SFs and the ordinate denotes stimulus sizes. For neurons tuned to image-based SFs, the peak positions of image-based SF tuning curves are aligned vertically (Fig. 2E). For neurons tuned to retina-based SFs, the peak position shifts systematically and the response field tilts to the right (Fig. 2F).
Figure 2.
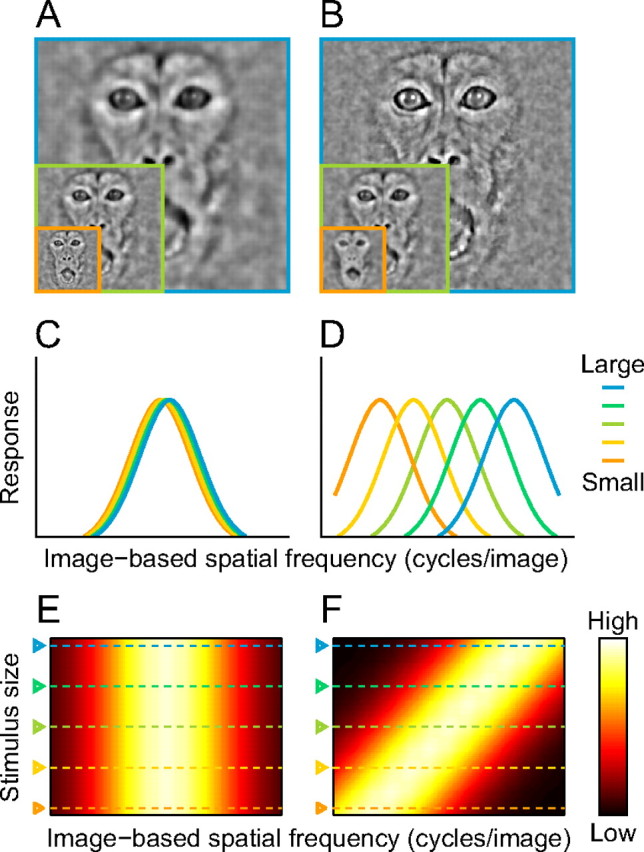
Tunings for image-based and retina-based SFs. A, B, Optimal stimuli at different sizes for hypothetical neurons tuned to image-based SFs (A) and retina-based SFs (B). These images were created by applying two-dimensional bandpass filters that share the same center image-based SF (A) or same center retina-based SF (B) across different sizes. C, D, Tuning curves for image-based SFs of hypothetical neurons tuned to image-based SFs (C) and to retina-based SFs (D). Curves with different colors correspond to tuning curves at different sizes. E, F, Response fields of neurons tuned to image-based SFs (E) and to retina-based SFs (F). The response magnitude is indicated by a color map.
Database
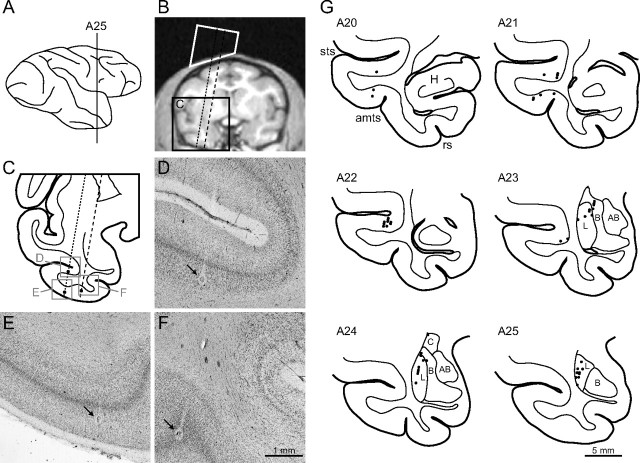
We recorded 115 and 120 face-responsive neurons in the temporal cortex and amygdala, respectively. Magnetic resonance images of the two monkeys indicated that face-responsive neurons in the temporal cortex were from both upper and lower banks and the fundus of the superior temporal sulcus as well as the inferior temporal gyrus (cytoarchitectonic area TE), spanning from A18 to A24. The recording area in the amygdala spanned from A20 to A25. In one monkey (Monkey S), we performed histological examination of the recording sites (Fig. 3). Recording sites were confirmed to reside in the lower bank of the superior temporal sulcus, the inferior temporal gyrus, and the lateral, basal, and central nuclei of the amygdala (Fig. 3G).
Figure 3.
Recording sites. A, Lateral view of the right hemisphere of Monkey S. The vertical line is positioned at 25 mm anterior to the ear canal (A25). B, A coronal slice of magnetic resonance images at A25. The white trapezoid indicates the recording chamber. Dotted and dashed lines indicate electrode penetrations to the temporal cortex and the amygdala, respectively. C, A coronal section corresponding to a region surrounded by the black rectangle in B. D–F, Photographs of regions corresponding to the gray squares in C. Arrows indicate electric lesions made along the penetrations. G, Reconstructed recording sites in the right hemisphere of Monkey S. H, Hippocampus; L, lateral nucleus; B, basal nucleus; AB, accessory basal nucleus; C, central nucleus of amygdala; sts, superior temporal sulcus; amts, anterior middle temporal sulcus; rs, rhinal sulcus. The SI values did not differ in the lateral (n = 21) and basal nuclei (n = 6) of the amygdala in Monkey S (Mann–Whitney test; p = 0.66).
Fifty-one of the 115 temporal cortex neurons and 50 of the 120 amygdala neurons were selective for SFs of bandpass filtered face images for at least two stimulus sizes (Kruskal–Wallis test; p < 0.01). Neurons not tuned to SFs were excluded from the analysis (44 temporal cortex neurons and 56 amygdala neurons). Neurons tuned to SFs only at a particular size (20 temporal cortex neurons and 14 amygdala neurons) were also excluded because they were not suitable for testing the reference frame of the SF tuning. This test requires an assessment of shifts in the SF tunings across at least two stimulus sizes. Among the 101 SF-selective neurons (51 temporal cortex neurons plus 50 amygdala neurons), the SF tuning data of 47 neurons in the temporal cortex (29 from Monkey S, 18 from Monkey K) and 44 neurons in the amygdala (28 from Monkey S, 16 from Monkey K) were fitted well by a set of Gaussian functions (R2 > 0.7). The following results were based on these 91 (47 + 44) neurons.
Responses to filtered face images in the temporal cortex
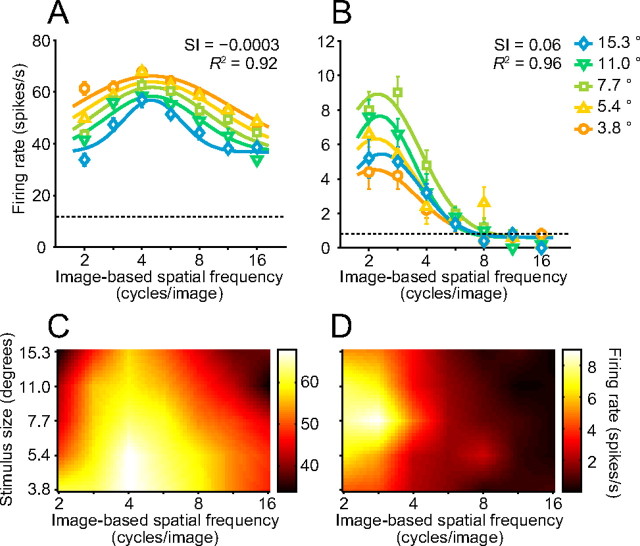
Most temporal cortex neurons exhibited little or no change in the peak position of their tuning to image-based SFs across different stimulus sizes (Fig. 4). The neuron shown in Figure 4A maximally responded to a middle range (4.0 cycles/image) of image-based SFs, regardless of stimulus size. Four cycles/image corresponds to 1.1 cycles/degree for the smallest stimulus (3.8° × 3.8°) and to 0.26 cycles/degree for the largest stimulus (15.3° × 15.3°). Despite a difference of two octaves in retina-based SFs, this neuron consistently demonstrated the maximal response to an image-based SF of 4.0 cycles/image. Plotting the tuning curves with an axis of retina-based SFs instead of image-based SFs showed a systematic shift depending on the stimulus size (see Fig. 6A). Another temporal cortex neuron (Fig. 4B) strongly responded to lower image-based SFs (2.0 cycles/image to 2.8 cycles/image) but not to higher SFs. Most neurons in the temporal cortex preferred low to middle image-based SFs, such as those shown in Figure 4.
Figure 4.
Responses of face-responsive temporal cortex neurons to filtered face images of different sizes. A, B, Tuning curves of two different neurons for image-based SFs. Symbols and error bars show mean ± SEM. of firing rates during stimulus presentation. Solid curves indicate a set of Gaussian functions fitted to the data. Different symbols with different colors represent tuning curves obtained with five different stimulus sizes. Dotted lines indicate the mean firing rate during the fixation period before stimulus presentation. Preferred original face images were Monkey A displaying pout-lips (Fig. 1A, top right) in A and Monkey B displaying a neutral expression (Fig. 1A, middle center) in B. C, D, Response fields in a 2D plot of image-based SFs and stimulus sizes. The mean firing rates for each stimulus condition of the neurons in A and B are replotted in C and D, respectively. The data are linearly interpolated and represented by a color map.
Figure 6.
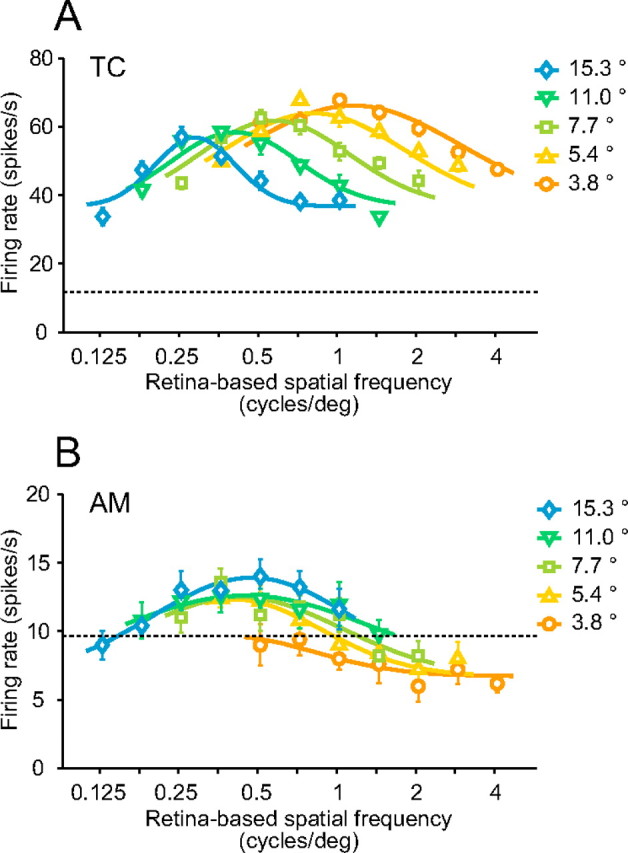
Tuning curves plotted with an axis of retina-based SFs. Responses of a temporal cortex neuron, shown in Figure 4A, and of an amygdala neuron, shown in Figure 5A, are replotted in A and B, respectively. Other conventions are the same as in Figure 4.
We fitted Gaussian functions to a set of SF tunings obtained with five different stimulus sizes. Some parameters defining the Gaussian functions were independent across stimulus sizes, while others were shared (see Materials and Methods). We exploited one of the shared parameters, SI, to assess the dependency of image-based SF tuning on stimulus size. An SI value of 0 indicates that the preferred image-based SF does not change across stimulus sizes (i.e., the neuron is ideally tuned to image-based SFs). On the other hand, when SI equals 1, the preferred image-based SF is proportional to the stimulus size, and the preferred retina-based SF does not change (i.e., the neuron is ideally tuned to retina-based SFs). The SF tunings of the neuron shown in Figure 4A were well fitted by a set of Gaussian functions (R2 = 0.92). The response field in the SF-stimulus size plot was not tilted (Fig. 4C). The SI for this neuron was close to 0 (−0.0003), indicating the peak position for image-based SFs was independent of size. This neuron was thus tuned to image-based SFs rather than to retina-based SFs. SF tuning curves of another temporal cortex neuron (Fig. 4B) were also well fitted by a set of Gaussian functions (R2 = 0.96). The SI of this neuron was also close to 0 (0.06). This neuron kept its preferred image-based SFs across different stimulus sizes (Fig. 4B,D).
Responses to filtered face images in the amygdala
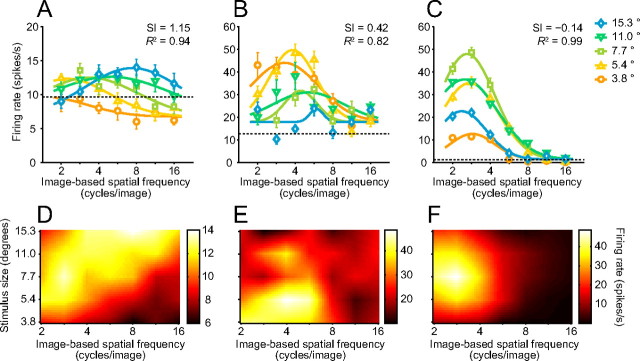
Face-responsive neurons in the amygdala demonstrated a variety of dependences of their SF tuning on stimulus size, including strong (Fig. 5A,D), weak (Fig. 5B,E), and little or no dependence (Fig. 5C,F). The neuron responses shown in Figure 5, A and D, have a systematically shifted peak of the SF tuning curve depending on the stimulus size. This neuron maximally responded to a low image-based SF of 2.8 cycles/image with a medium stimulus size of 7.7° but responded to a higher image-based SF of 8.0 cycles/image with a large stimulus size of 15.3°. The SI of this neuron was close to 1 (1.15), indicating that the peak position for image-based SFs was nearly proportional to the stimulus size. If we consider retina-based SFs instead of image-based SFs, the peak position of the neuron tuning curve only minimally depended on stimulus size (Fig. 6B). This neuron was thus tuned to retina-based SFs rather than to image-based SFs. An area of strong responses was elongated along a diagonal line (Fig. 5D) and was similar to that of a hypothetical neuron ideally tuned to retina-based SFs (Fig. 2F).
Figure 5.
Responses of face-responsive amygdala neurons to filtered face images of different sizes. A–C, Tuning curves of three different neurons. Preferred original face images were Monkey C displaying open-mouth (Fig. 1A, bottom left) in A, Monkey A displaying open-mouth (Fig. 1A, top left) in B, and Monkey B displaying a neutral expression (Fig. 1A, middle center) in C. D–F, Response fields of the same neurons for combinations of image-based SFs and stimulus sizes. Other conventions are the same as in Figure 4.
Responses of a neuron with a weak dependence are shown in Figure 5, B and E. Although this neuron demonstrated shifts in its tuning curves, the maximal responses were evoked only by low to middle image-based SFs when the stimulus became larger. The SI of this neuron was 0.42, a value intermediate between 0 and 1. The peak positions for retina-based SFs as well as for image-based SFs weakly depended on the stimulus size.
SF tunings of an amygdala neuron with only slight dependency on stimulus size are shown in Figure 5, C and F. The maximal responses were always evoked by a low image-based SF of 2.8 cycles/image. Like the temporal cortex neurons shown in Figure 4, the peak positions were independent of stimulus sizes and the SI was close to 0 (−0.14). This neuron was tuned to image-based SFs.
Comparison between the temporal cortex and the amygdala
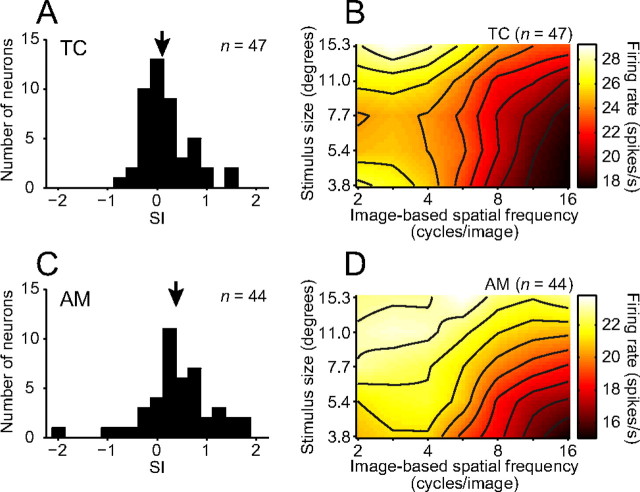
We compared the dependency of SF tuning curves on stimulus size in the temporal cortex and the amygdala (Fig. 7). The distribution of SIs across the 47 face-responsive neurons in the temporal cortex peaked near 0 (Fig. 7A) (median = 0.10). The peak positions for image-based SFs did not depend on size in most of the temporal cortex neurons. In contrast, the distribution across the 44 face-responsive neurons in the amygdala was deviated from 0 and peaked at a value between 0 and 1 (Fig. 7C) (median = 0.38). The peak positions for image-based SFs depended on size in many of the amygdala neurons. The distribution across the amygdala neurons was shifted toward higher values (Mann–Whitney test; p = 0.018) and was broader (F test; F = 2.24, p = 0.004) compared with that of the temporal cortex. The averaged response field across the amygdala neurons (Fig. 7D) had a diagonally elongated peak area (roughly corresponds to 0.25 cycles/degree) and was more tilted than that of the temporal cortex neurons (Fig. 7B). The quality of the fitting assessed by R2 was comparable between the two areas (Mann–Whitney test; p = 0.92).
Figure 7.
Comparisons of effects of stimulus size on image-based SF tunings. A, C, Distribution histograms of the SI for face-responsive neurons in the temporal cortex (A; TC) and the amygdala (B; AM). Arrows indicate median values (0.10 for TC and 0.38 for AM). B, D, Averaged response fields across the temporal cortex neurons (B) and amygdala neurons (D). Solid lines represent contour lines.
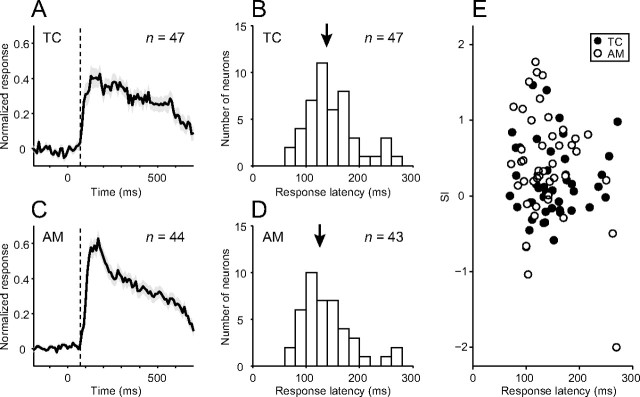
One might expect that neurons with different SI values represent different processing stages. Assuming that the response latency reflects the functional hierarchy (Maunsell and Gibson, 1992; Raiguel et al., 1999), we might expect an area difference in the response latency. However, the response onset of population peristimulus time histograms summed across the sampled neurons was comparable between the temporal cortex and the amygdala (Fig. 8A,C). We found no statistically significant difference between the two areas in the distribution of response latencies determined for individual neurons (Mann–Whitney test; p = 0.28) (Fig. 8B,D), even though the median of the amygdala neurons (126 ms) was slightly shorter than that of the temporal cortex neurons (138 ms). Because SIs were distributed across a wide range of values in both areas (Fig. 7), we analyzed the correlation between the response latencies and SIs within each area. No correlation was found in either the temporal cortex (Fig. 8E, filled circles) (Spearman's rank correlation; r = 0.063, p = 0.67) or the amygdala (Fig. 8E, open circles) (r = −0.073, p = 0.64).
Figure 8.
Temporal profiles of responses of face-responsive neurons. A, C, Average normalized peristimulus time histograms (PSTHs) of temporal cortex neurons (A) and amygdala neurons (C). We first made a PSTH with a bin width of 10 ms for each neuron across all of the trials for stimuli that elicited statistically significant responses. We then normalized the PSTH of each neuron by assigning its maximum to a value of 1 and the firing rate during the prestimulus period to a value of 0. For the average normalized PSTHs, we defined a bin as the onset of the responses where the value first exceeded a criterion (mean + 3 SD during the fixation period before stimulus presentation). The onset of the responses was in the 71 to 80 ms bin for both the temporal cortex and the amygdala. Shaded areas indicate mean ± SEM. Dotted lines indicate 70 ms after stimulus onset. B, D, Distribution histograms of the response latency for temporal cortex neurons (B) and amygdala neurons (D). Arrows indicate median values (138 and 126 ms for the temporal cortex and amygdala neurons, respectively). E, Relationship between the SI and the response latency for the temporal cortex neurons (filled circles) and the amygdala (open circles). There was no correlation between the two in either the temporal cortex (Spearman's rank correlation; r = 0.063, p = 0.67) or amygdala (r = −0.073, p = 0.64).
We also analyzed the correlation between SIs and the strength of selectivity for facial information to see if neurons with different SI values are involved in different functions such as discriminating facial expressions and recognizing face identities. No correlation was found between SIs and the strength of facial-expression selectivity in either the temporal cortex (Spearman's rank correlation; r = 0.013, p = 0.93) or the amygdala (r = −0.22, p = 0.20). For face-identity selectivity, no correlation was found in either the temporal cortex (r = 0.18, p = 0.24) or amygdala (r = −0.16, p = 0.36). SI values did not depend on the strength of selectivity for facial information.
Luminance contrast sensitivity of face-responsive neurons
Despite extensive anatomical input from the temporal cortex to the amygdala (Aggleton et al., 1980; Amaral et al., 1992; Cheng et al., 1997), we found the size effect on the SF tuning of the face-responsive neurons differed between the two areas, as shown above. One possible explanation is that responses of amygdala neurons to faces may depend not only on the ventral visual pathway but also on a visual pathway that bypasses it. Several lines of evidence suggest that the superior colliculus, pulvinar, and amygdala form another route for face processing (LeDoux, 2000; Morris et al., 2001; Vuilleumier et al., 2003; Johnson, 2005) (see Pessoa and Adolphs, 2010 for an alternative view). We assessed the relative contribution of this extrageniculostriate pathway to the responses of amygdala neurons by testing luminance contrast sensitivity. It has been shown that V1-damaged patients and monkeys can respond to a visual target of high luminance contrast but not to a target of low luminance contrast (Miller et al., 1980; Cowey and Stoerig, 2004; Yoshida et al., 2008). We therefore reasoned that if the responses of amygdala neurons to faces critically depend on the extrageniculostriate pathway, they should attenuate their responses to low luminance contrast stimuli.
We compared luminance contrast sensitivity between face-responsive neurons in the temporal cortex (n = 23) and those in the amygdala (n = 21) (Fig. 9). The responses of a temporal cortex neuron only gradually diminished as the total luminance contrast of the face image became lower (Fig. 9B). The response magnitude was roughly constant over a range of luminance contrast from 0.27 to 1. The slope of the sensitivity curve was modest. An example neuron in the amygdala strongly responded to higher luminance contrast images but greatly reduced its responses to lower luminance contrast images (Fig. 9C). The slope of the sensitivity curve was steep at a middle range between 0.086 and 0.51, compared with the temporal cortex neuron shown in Figure 9C. Across populations, face-responsive neurons in the amygdala were less sensitive to low luminance contrast than those in the temporal cortex (Fig. 9D) (two-way ANOVA; area, p = 0.001; contrast, p < 0.0001; interaction, p = 0.12). Manipulation of luminance contrast dissociated response profiles of face-responsive neurons between the temporal cortex and the amygdala.
Discussion
Image-based SF tuning versus retina-based SF tuning
Image-based SFs characterize spatial information of the face itself, whereas retina-based SFs characterize spatial information of the image on the retina. Recognition or identification of faces in human subjects depends more on image-based SFs than on retina-based SFs (Hayes et al., 1986; Näsänen, 1999). The visual system transforms the reference frame of SFs from retina-based to image-based. We examined quantitatively how neural processing of a face advances in a manner consistent with the known psychophysical properties. The distribution of SIs peaked near 0 (median = 0.10) in the temporal cortex. Because neurons that are ideally tuned to image-based SFs, regardless of stimulus size, have an SI of 0, we concluded that most face-responsive neurons of the temporal cortex are tuned to image-based SFs rather than retina-based SFs. Many neurons in the temporal visual cortex acquire size-invariant, hence distance-invariant, representation of face patterns.
Previous studies have examined the effects of stimulus size on shape selectivity in neurons of the inferior temporal cortex (Sato et al., 1980; Schwartz et al., 1983; Ito et al., 1995). A population of these neurons preserves shape selectivity across different stimulus sizes, which is similar to our image-based SF tuning results. One might consider that size-invariant shape selectivity and image-based SF tuning are different aspects of the same property. Size-invariant shape selectivity, however, does not always equal image-based SF tuning. Because shape stimuli contain a wide range of image-based SFs, it is possible to discriminate the stimuli based on lower image-based SFs when the stimuli are small and on higher image-based SFs when the stimuli are large. Therefore, neurons tuned to retina-based SFs, such as in Figure 5, A and D, could preserve shape selectivity across stimulus sizes. This means that neurons are not necessarily tuned to a particular range of image-based SFs, such as in Figure 4, to accomplish size-invariant shape selectivity.
We recorded only from the anterior part of the temporal cortex (A18–A24). We chose this anterior–posterior level for our analysis because only that part of the temporal cortex, among the ventral pathway areas, strongly projects to the amygdala (Aggleton et al., 1980; Amaral et al., 1992; Cheng et al., 1997). However, face processing relies on interconnected functional modules distributed over a large portion of the temporal cortex, including more posterior parts (Tsao et al., 2006; Moeller et al., 2008). Therefore, applying this paradigm to other face processing regions in the temporal cortex should further advance our understanding of face processing.
The distribution of SIs across face-responsive neurons of the amygdala was broad and biased toward 1 (median = 0.38) (Fig. 7). The broad distribution may reflect the many possible routes of visual inputs to the amygdala (Aggleton et al., 1980; Amaral et al., 1992). Unlike the temporal cortex, SF tunings in the amygdala were influenced by both image-based and retina-based SFs. Normalization by stimulus size (hence viewing distance) was incomplete. Although this response property is incompatible with face recognition or identification performance in human subjects, the sensitivity to the size of faces may be an important part of social distance computation, such as detection of an approaching threatening monkey. This property is consistent with neuropsychological results like that of an amygdala-damaged patient failing to regulate interpersonal distance (Kennedy et al., 2009).
Image-based SF tuning required a convergence of a wide range of retina-based SF information (lower retina-based SFs for a large stimulus and higher retina-based SFs for a small stimulus) (Fig. 6A), whereas retina-based SF tuning only covered a narrow range (Fig. 6B). Therefore, the retina-based SF range required for the SF tunings of the amygdala neurons is narrower than that of the temporal cortex neurons. In addition, the averaged response field of the amygdala was peaked at a low retina-based SF (∼0.25 cycles/degree) (Fig. 7D). These results suggest that the face representation in the amygdala is mainly constructed by using the narrow range of low retina-based SF information. This is consistent with the result of a functional magnetic resonance imaging (fMRI) study, that human amygdala preferentially responds to faces with low SF information (Vuilleumier et al., 2003).
Face processing along the extrageniculostriate pathway
Because the temporal visual cortex sends its major projections to the amygdala (Aggleton et al., 1980; Amaral et al., 1992; Cheng et al., 1997), and the SI distributions for the two areas overlapped (Fig. 7), input from the temporal cortex is likely to contribute to the construction of the face representation in the amygdala. However, it is unlikely that the retina-based SF tuning of many amygdala neurons is rebuilt solely based on the image-based SF information from the temporal cortex. Rather, the difference in the reference frame suggests the involvement of another pathway. Brain imaging studies in human subjects suggest that the subcortical extrageniculostriate pathway contributes to the responses of the amygdala to faces (Morris et al., 2001; Vuilleumier et al., 2003; Pasley et al., 2004; Williams et al., 2004; Johnson, 2005) (see Schmid et al., 2010 for another possible pathway). To probe the contribution of the extrageniculostriate pathway, we compared luminance contrast sensitivity of face-responsive neurons in the temporal cortex and amygdala (Fig. 9). Face-responsive neurons in the amygdala were less sensitive to low luminance contrast than those in the temporal cortex. Because the extrageniculostriate pathway is unresponsive to stimuli of low luminance contrast (Miller et al., 1980; Cowey and Stoerig, 2004; Yoshida et al., 2008), the results support the hypothesis that the extrageniculostriate pathway feeds input on faces to the amygdala.
A current hypothesis from studies on human subjects presumes that face processing along the extrageniculostriate pathway is faster than that of the ventral pathway (Johnson, 2005; Pourtois et al., 2010). If this is applicable to monkeys, one would expect that face-responsive neurons of the amygdala have shorter response latencies than those of the temporal cortex. Although the median latency of the amygdala neurons (126 ms) was shorter than that of the temporal cortex neurons (138 ms), we did not find a statistically significant difference in the latency distributions (Fig. 8). This may result from relatively small samples in our study. Another concern is the recording site within the amygdala. Leonard et al. reported that response latencies of face-responsive neurons in the accessory basal nucleus of the amygdala, where we did not record from, at least in Monkey S, are longer than those of the temporal cortex (Leonard et al., 1985). More extensive studies focusing on the subnuclei of the amygdala are required to clarify the response latency issue.
Implication for face representation in infants
Human infants show a preference for visually presented face-like patterns compared with scrambled nonface-like patterns (Goren et al., 1975; Johnson et al., 1991), suggesting that face representation exists in the infant brain. Psychophysical studies using grating stimuli (Atkinson et al., 1974; Banks and Salapatek, 1976; Boothe et al., 1988; Movshon and Kiorpes, 1988) indicated that only a narrow range of retina-based SF information is available in the infant visual system. Therefore, face representations in the infant brain are most likely constructed by using a narrow range of retina-based SF information. As mentioned earlier, retina-based SF tuning only requires a narrow range of retina-based SF information, suggesting the possibility that face-responsive neurons in infants are tuned to retina-based SFs.
Although some temporal cortex neurons of infant monkeys respond to faces (Rodman et al., 1993), the existence and properties of face-responsive neurons in the amygdala of infants are still unclear. We demonstrated in adult monkeys that a population of face-responsive neurons in the amygdala was not tuned to image-based SFs, instead responding to retina-based SFs. Moreover, the poor sensitivity to luminance contrast we observed in the amygdala of adult monkeys is consistent with psychophysical properties of infants (Atkinson et al., 1974; Banks and Salapatek, 1976; Boothe et al., 1988; Movshon and Kiorpes, 1988). The neural mechanisms that contribute to the amygdala response to faces in adults may apply to infants as well.
In conclusion, the reference frame for SF tuning and luminance contrast sensitivity of face-responsive neurons differs in the temporal visual cortex and the amygdala. This suggests that at least two types of visual processing exist and contribute differently to the neural representations of faces in the temporal cortex and the amygdala. The experimental paradigm we describe can be applied to other brain areas, to infant brain, or to human fMRI experiments to explore further details on the neural mechanisms involved in face processing.
Footnotes
This work was supported by grants from the Ministry of Education, Culture, Sports, Science, and Technology (17022025), the National Institute of Information and Communications Technology, and the Japan Science and Technology Agency (Core Research for Evolutional Science and Technology). We thank Ralph Adolphs, Yasutaka Okazaki, Hiroshi Tamura, and Shingo Tanaka for helpful comments on this manuscript; Keisuke Kunizawa and Takayuki Wakatsuchi for technical assistance; Taijiro Doi for help in setting up the instrument for experiments; and Peter Karagiannis for help in improving the English. Magnetic resonance images were taken at the National Institute for Physiological Sciences.
References
- Aggleton JP, Burton MJ, Passingham RE. Cortical and subcortical afferents to the amygdala of the rhesus monkey (Macaca mulatta) Brain Res. 1980;190:347–368. doi: 10.1016/0006-8993(80)90279-6. [DOI] [PubMed] [Google Scholar]
- Amaral DG, Price JL, Pitkänen A, Carmichael ST. Anatomical organization of the primate amygdaloid complex. In: Aggleton JP, editor. The amygdala: neurobiological aspects of emotion, memory, and mental dysfunction. New York: Wiley; 1992. pp. 1–66. [Google Scholar]
- Atkinson J, Braddick O, Braddick F. Acuity and contrast sensitivity of infant vision. Nature. 1974;247:403–404. doi: 10.1038/247403a0. [DOI] [PubMed] [Google Scholar]
- Banks MS, Salapatek P. Contrast sensitivity function of the infant visual system. Vision Res. 1976;16:867–869. doi: 10.1016/0042-6989(76)90147-4. [DOI] [PubMed] [Google Scholar]
- Boothe RG, Kiorpes L, Williams RA, Teller DY. Operant measurements of contrast sensitivity in infant macaque monkeys during normal development. Vision Res. 1988;28:387–396. doi: 10.1016/0042-6989(88)90181-2. [DOI] [PubMed] [Google Scholar]
- Bruce C, Desimone R, Gross CG. Visual properties of neurons in a polysensory area in superior temporal sulcus of the macaque. J Neurophysiol. 1981;46:369–384. doi: 10.1152/jn.1981.46.2.369. [DOI] [PubMed] [Google Scholar]
- Cheng K, Saleem KS, Tanaka K. Organization of corticostriatal and corticoamygdalar projections arising from the anterior inferotemporal area TE of the macaque monkey: a Phaseolus vulgaris leucoagglutinin study. J Neurosci. 1997;17:7902–7925. doi: 10.1523/JNEUROSCI.17-20-07902.1997. [DOI] [PMC free article] [PubMed] [Google Scholar]
- Cowey A, Stoerig P. Stimulus cueing in blindsight. Prog Brain Res. 2004;144:261–277. doi: 10.1016/S0079-6123(03)14418-4. [DOI] [PubMed] [Google Scholar]
- Desimone R, Albright TD, Gross CG, Bruce C. Stimulus-selective properties of inferior temporal neurons in the macaque. J Neurosci. 1984;4:2051–2062. doi: 10.1523/JNEUROSCI.04-08-02051.1984. [DOI] [PMC free article] [PubMed] [Google Scholar]
- Goren CC, Sarty M, Wu PY. Visual following and pattern discrimination of face-like stimuli by newborn infants. Pediatrics. 1975;56:544–549. [PubMed] [Google Scholar]
- Gothard KM, Battaglia FP, Erickson CA, Spitler KM, Amaral DG. Neural responses to facial expression and face identity in the monkey amygdala. J Neurophysiol. 2007;97:1671–1683. doi: 10.1152/jn.00714.2006. [DOI] [PubMed] [Google Scholar]
- Gross CG, Rocha-Miranda CE, Bender DB. Visual properties of neurons in inferotemporal cortex of the Macaque. J Neurophysiol. 1972;35:96–111. doi: 10.1152/jn.1972.35.1.96. [DOI] [PubMed] [Google Scholar]
- Hanes DP, Thompson KG, Schall JD. Relationship of presaccadic activity in frontal eye field and supplementary eye field to saccade initiation in macaque: poison spike train analysis. Exp Brain Res. 1995;103:85–96. doi: 10.1007/BF00241967. [DOI] [PubMed] [Google Scholar]
- Hayes T, Morrone MC, Burr DC. Recognition of positive and negative bandpass-filtered images. Perception. 1986;15:595–602. doi: 10.1068/p150595. [DOI] [PubMed] [Google Scholar]
- Ito M, Tamura H, Fujita I, Tanaka K. Size and position invariance of neuronal responses in monkey inferotemporal cortex. J Neurophysiol. 1995;73:218–226. doi: 10.1152/jn.1995.73.1.218. [DOI] [PubMed] [Google Scholar]
- Johnson MH. Subcortical face processing. Nat Rev Neurosci. 2005;6:766–774. doi: 10.1038/nrn1766. [DOI] [PubMed] [Google Scholar]
- Johnson MH, Dziurawiec S, Ellis H, Morton J. Newborns' preferential tracking of face-like stimuli and its subsequent decline. Cognition. 1991;40:1–19. doi: 10.1016/0010-0277(91)90045-6. [DOI] [PubMed] [Google Scholar]
- Kennedy DP, Gläscher J, Tyszka JM, Adolphs R. Personal space regulation by the human amygdala. Nat Neurosci. 2009;12:1226–1227. doi: 10.1038/nn.2381. [DOI] [PMC free article] [PubMed] [Google Scholar]
- Kotake Y, Morimoto H, Okazaki Y, Fujita I, Tamura H. Organization of color-selective neurons in macaque visual area V4. J Neurophysiol. 2009;102:15–27. doi: 10.1152/jn.90624.2008. [DOI] [PubMed] [Google Scholar]
- Kuraoka K, Nakamura K. Impacts of facial identity and type of emotion on responses of amygdala neurons. Neuroreport. 2006;17:9–12. doi: 10.1097/01.wnr.0000194383.02999.c5. [DOI] [PubMed] [Google Scholar]
- LeDoux JE. Emotion circuits in the brain. Annu Rev Neurosci. 2000;23:155–184. doi: 10.1146/annurev.neuro.23.1.155. [DOI] [PubMed] [Google Scholar]
- Legéndy CR, Salcman M. Bursts and recurrences of bursts in the spike trains of spontaneously active striate cortex neurons. J Neurophysiol. 1985;53:926–939. doi: 10.1152/jn.1985.53.4.926. [DOI] [PubMed] [Google Scholar]
- Leonard CM, Rolls ET, Wilson FA, Baylis GC. Neurons in the amygdala of the monkey with responses selective for faces. Behav Brain Res. 1985;15:159–176. doi: 10.1016/0166-4328(85)90062-2. [DOI] [PubMed] [Google Scholar]
- Matsuda K, Nagami T, Kawano K, Yamane S. A new system for measuring eye position on a personal computer. Soc Neurosci Abstr. 2000;26:744–2. [Google Scholar]
- Maunsell JH, Gibson JR. Visual response latencies in striate cortex of the macaque monkey. J Neurophysiol. 1992;68:1332–1344. doi: 10.1152/jn.1992.68.4.1332. [DOI] [PubMed] [Google Scholar]
- Miller M, Pasik P, Pasik T. Extrageniculostriate vision in the monkey. VII. Contrast sensitivity functions. J Neurophysiol. 1980;43:1510–1526. doi: 10.1152/jn.1980.43.6.1510. [DOI] [PubMed] [Google Scholar]
- Moeller S, Freiwald WA, Tsao DY. Patches with links: a unified system for processing faces in the macaque temporal lobe. Science. 2008;320:1355–1359. doi: 10.1126/science.1157436. [DOI] [PMC free article] [PubMed] [Google Scholar]
- Morris JS, DeGelder B, Weiskrantz L, Dolan RJ. Differential extrageniculostriate and amygdala responses to presentation of emotional faces in a cortically blind field. Brain. 2001;124:1241–1252. doi: 10.1093/brain/124.6.1241. [DOI] [PubMed] [Google Scholar]
- Movshon JA, Kiorpes L. Analysis of the development of spatial contrast sensitivity in monkey and human infants. J Opt Soc Am A. 1988;5:2166–2172. doi: 10.1364/josaa.5.002166. [DOI] [PubMed] [Google Scholar]
- Nakamura K, Mikami A, Kubota K. Activity of single neurons in the monkey amygdala during performance of a visual discrimination task. J Neurophysiol. 1992;67:1447–1463. doi: 10.1152/jn.1992.67.6.1447. [DOI] [PubMed] [Google Scholar]
- Näsänen R. Spatial frequency bandwidth used in the recognition of facial images. Vision Res. 1999;39:3824–3833. doi: 10.1016/s0042-6989(99)00096-6. [DOI] [PubMed] [Google Scholar]
- Ö Scalaidhe SP, Wilson FA, Goldman-Rakic PS. Areal segregation of face-processing neurons in prefrontal cortex. Science. 1997;278:1135–1138. doi: 10.1126/science.278.5340.1135. [DOI] [PubMed] [Google Scholar]
- Ö Scalaidhe SP, Wilson FA, Goldman-Rakic PS. Face-selective neurons during passive viewing and working memory performance of rhesus monkeys: evidence for intrinsic specialization of neuronal coding. Cereb Cortex. 1999;9:459–475. doi: 10.1093/cercor/9.5.459. [DOI] [PubMed] [Google Scholar]
- Panzeri S, Treves A. Analytical estimates of limited sampling biases in different information measures. Network: Comp Neural Sys. 1996;7:87–107. doi: 10.1080/0954898X.1996.11978656. [DOI] [PubMed] [Google Scholar]
- Pasley BN, Mayes LC, Schultz RT. Subcortical discrimination of unperceived objects during binocular rivalry. Neuron. 2004;42:163–172. doi: 10.1016/s0896-6273(04)00155-2. [DOI] [PubMed] [Google Scholar]
- Perrett DI, Rolls ET, Caan W. Visual neurones responsive to faces in the monkey temporal cortex. Exp Brain Res. 1982;47:329–342. doi: 10.1007/BF00239352. [DOI] [PubMed] [Google Scholar]
- Pessoa L, Adolphs R. Emotion processing and the amygdala: from a ‘low road’ to ‘many roads’ of evaluating biological significance. Nat Rev Neurosci. 2010;11:773–783. doi: 10.1038/nrn2920. [DOI] [PMC free article] [PubMed] [Google Scholar]
- Pourtois G, Spinelli L, Seeck M, Vuilleumier P. Temporal precedence of emotion over attention modulations in the lateral amygdala: Intracranial ERP evidence from a patient with temporal lobe epilepsy. Cogn Affect Behav Neurosci. 2010;10:83–93. doi: 10.3758/CABN.10.1.83. [DOI] [PubMed] [Google Scholar]
- Priebe NJ, Cassanello CR, Lisberger SG. The neural representation of speed in macaque area MT/V5. J Neurosci. 2003;23:5650–5661. doi: 10.1523/JNEUROSCI.23-13-05650.2003. [DOI] [PMC free article] [PubMed] [Google Scholar]
- Raiguel SE, Xiao DK, Marcar VL, Orban GA. Response latency of macaque area MT/V5 neurons and its relationship to stimulus parameters. J Neurophysiol. 1999;82:1944–1956. doi: 10.1152/jn.1999.82.4.1944. [DOI] [PubMed] [Google Scholar]
- Rodman HR, Ö Scalaidhe SP, Gross CG. Response properties of neurons in temporal cortical visual areas of infant monkeys. J Neurophysiol. 1993;70:1115–1136. doi: 10.1152/jn.1993.70.3.1115. [DOI] [PubMed] [Google Scholar]
- Rolls ET. Functions of the primate temporal lobe cortical visual areas in invariant visual object and face recognition. Neuron. 2000;27:205–218. doi: 10.1016/s0896-6273(00)00030-1. [DOI] [PubMed] [Google Scholar]
- Rolls ET, Baylis GC, Leonard CM. Role of low and high spatial frequencies in the face-selective responses of neurons in the cortex in the superior temporal sulcus in the monkey. Vision Res. 1985;25:1021–1035. doi: 10.1016/0042-6989(85)90091-4. [DOI] [PubMed] [Google Scholar]
- Rolls ET, Baylis GC, Hasselmo ME. The responses of neurons in the cortex in the superior temporal sulcus of the monkey to band-pass spatial frequency filtered faces. Vision Res. 1987;27:311–326. doi: 10.1016/0042-6989(87)90081-2. [DOI] [PubMed] [Google Scholar]
- Rolls ET, Critchley HD, Browning AS, Inoue K. Face-selective and auditory neurons in the primate orbitofrontal cortex. Exp Brain Res. 2006;170:74–87. doi: 10.1007/s00221-005-0191-y. [DOI] [PubMed] [Google Scholar]
- Sato T, Kawamura T, Iwai E. Responsiveness of inferotemporal single units to visual pattern stimuli in monkeys performing discrimination. Exp Brain Res. 1980;38:313–319. doi: 10.1007/BF00236651. [DOI] [PubMed] [Google Scholar]
- Schmid MC, Mrowka SW, Turchi J, Saunders RC, Wilke M, Peters AJ, Ye FQ, Leopold DA. Blindsight depends on the lateral geniculate nucleus. Nature. 2010;466:373–377. doi: 10.1038/nature09179. [DOI] [PMC free article] [PubMed] [Google Scholar]
- Schwartz EL, Desimone R, Albright TD, Gross CG. Shape recognition and inferior temporal neurons. Proc Natl Acad Sci U S A. 1983;80:5776–5778. doi: 10.1073/pnas.80.18.5776. [DOI] [PMC free article] [PubMed] [Google Scholar]
- Sugase Y, Yamane S, Ueno S, Kawano K. Global and fine information coded by single neurons in the temporal visual cortex. Nature. 1999;400:869–873. doi: 10.1038/23703. [DOI] [PubMed] [Google Scholar]
- Tanabe S, Umeda K, Fujita I. Rejection of false matches for binocular correspondence in macaque visual cortical area V4. J Neurosci. 2004;24:8170–8180. doi: 10.1523/JNEUROSCI.5292-03.2004. [DOI] [PMC free article] [PubMed] [Google Scholar]
- Tsao DY, Freiwald WA, Tootell RB, Livingstone MS. A cortical region consisting entirely of face-selective cells. Science. 2006;311:670–674. doi: 10.1126/science.1119983. [DOI] [PMC free article] [PubMed] [Google Scholar]
- Van Hooff, JARAM . The facial displays of the catarrhine monkeys and apes. In: Morris D, editor. Primate ethology. Chicago: Aldine; 1967. pp. 7–68. [Google Scholar]
- Vuilleumier P, Armony JL, Driver J, Dolan RJ. Distinct spatial frequency sensitivities for processing faces and emotional expressions. Nat Neurosci. 2003;6:624–631. doi: 10.1038/nn1057. [DOI] [PubMed] [Google Scholar]
- Williams MA, Morris AP, McGlone F, Abbott DF, Mattingley JB. Amygdala responses to fearful and happy facial expressions under conditions of binocular suppression. J Neurosci. 2004;24:2898–2904. doi: 10.1523/JNEUROSCI.4977-03.2004. [DOI] [PMC free article] [PubMed] [Google Scholar]
- Yoshida M, Takaura K, Kato R, Ikeda T, Isa T. Striate cortical lesions affect deliberate decision and control of saccade: implication for blindsight. J Neurosci. 2008;28:10517–10530. doi: 10.1523/JNEUROSCI.1973-08.2008. [DOI] [PMC free article] [PubMed] [Google Scholar]


