

Abstract
Feeling the beat and meter is fundamental to the experience of music. However, how these periodicities are represented in the brain remains largely unknown. Here, we test whether this function emerges from the entrainment of neurons resonating to the beat and meter. We recorded the electroencephalogram while participants listened to a musical beat and imagined a binary or a ternary meter on this beat (i.e., a march or a waltz). We found that the beat elicits a sustained periodic EEG response tuned to the beat frequency. Most importantly, we found that meter imagery elicits an additional frequency tuned to the corresponding metric interpretation of this beat. These results provide compelling evidence that neural entrainment to beat and meter can be captured directly in the electroencephalogram. More generally, our results suggest that music constitutes a unique context to explore entrainment phenomena in dynamic cognitive processing at the level of neural networks.
Introduction
Beat perception in music refers to the ability to perceive periodicities from sounds that are not necessarily periodic in reality (e.g., spontaneous head bouncing, foot tapping on the beat when listening to music) (Large, 2008). Beats can be organized in meters, corresponding to subharmonics (i.e., integer ratios) of the beat frequency.
How beat and meter are processed in the human brain remains largely unknown. The resonance theory for beat and meter perception (Large and Kolen, 1994; van Noorden and Moelants, 1999; Large, 2008) proposes that beat perception emerges from the entrainment of neuronal populations resonating at the beat frequency, itself giving rise to higher-order resonance at subharmonics of beat frequency, corresponding to the meter. Several studies have explored the neural processes underlying beat and meter perception using original but indirect approaches to examine how beat and meter structures create temporal expectancies and metrical representations. For example, investigators have examined how beat and meter may influence the transient evoked potentials (EPs) elicited by brief violations or accentuations inserted in a beat structure (Brochard et al., 2003; Snyder and Large, 2005; Grube and Griffiths, 2009), or how the transient EPs elicited by auditory stimuli may be modulated as a function of their position with respect to the beat structure (Iversen et al., 2009; Fujioka et al., 2010; Schaefer et al., 2011). All these findings are compatible with the theory of neural resonance. Indeed, neuronal oscillations have been shown to be instruments of entrainment in sensory cortices. In particular, Lakatos et al. (2008) showed that neuronal oscillations in primary sensory cortices may entrain to attended rhythmic streams. Hence, the observed modulations of transient EPs by beat and meter could be interpreted as the consequence of a periodic modulation of the responsiveness of the neuronal populations giving rise to these transient EPs. However, direct neurophysiological evidence supporting this resonance theory in the context of musical beat and meter is still lacking.
Here, we chose a novel approach: we hypothesized that neuronal entrainment to beat and meter can be captured directly as a steady-state EP, that is, the electrocortical activity generated by a population of neurons resonating by entrainment at the frequency of a periodic stimulus (Galambos et al., 1981; Regan, 1989; Draganova et al., 2002; Plourde, 2006). To this aim, we asked participants to listen to a sound pattern from which they could perceive a 2.4 Hz beat. They were asked to voluntarily imagine the meter of this beat as either binary or ternary (Fig. 1). We predicted that the beat extracted from the sound pattern would elicit a steady-state EP at the beat frequency (f = 2.4 Hz) and, most importantly, that the meter imagery would elicit a distinct steady-state EP at the metrically related subharmonic of beat frequency (f/2 and f/3 for binary and ternary meters, respectively). Thereby, we aimed to tag directly the neuronal entrainment hypothesized to subtend beat perception, as well as the higher-order resonance phenomenon hypothesized to underlie the representation of meter.
Figure 1.

Experimental design. A, A 6 s excerpt of the 33 s auditory stimulus (x-axis: time; y-axis: sound amplitude). Note the pseudo-periodic beat structure, visible as a slightly irregular modulation of amplitude. From this pseudo-periodic stimulus, subjects perceived the 2.4 Hz beat represented in blue. In the binary and ternary meter conditions (shown in red and green, respectively), subjects were asked to imagine a binary (1.2 Hz) and ternary (0.8 Hz) metric structure onto this beat. B, The frequency spectrum of the sound stimulus. Note the peak corresponding to the frequency of the tone (333.33 Hz), as well as the sideband frequencies resulting from the convolution of that carrier frequency with the two different amplitude modulation frequencies (2.4 and 11 Hz). C, The frequency content of the sound envelope obtained by convoluting the two different amplitude modulation frequencies (2.4 and 11 Hz). Note that the sound envelope contains a peak at the frequency corresponding to the beat (2.4 Hz), but does not contain any sideband frequencies at the frequency of the binary (1.2 Hz) and ternary (0.8 Hz) meters.
Materials and Methods
Participants.
Eight healthy volunteers (3 females, 7 right-handed; mean age, 30 ± 4 years; age range, 22–32 years) took part in the study after providing written informed consent. They all had musical experience, either in performance (3 participants with 15–25 years of practice) or as amateur listeners or dancers (5 participants). They had no history of hearing, neurological, or psychiatric disorder, and were not taking any drug at the time of the experiment. The study was approved by the local ethics committee.
Auditory stimulation.
Each auditory stimulus lasted 33 s. The stimulus consisted of a 333.3 Hz pure tone in which a 2.4 Hz auditory beat was introduced by modulating the amplitude of the tone with a 2.4 Hz periodicity (i.e., 144 beats/min), using an asymmetrical Hanning envelope (22 ms rise time and 394 ms fall time, amplitude modulation between 0 and 1). A 2.4 Hz periodicity was chosen because (1) pilot participants were comfortable in imagining binary (1.2 Hz) and ternary (0.8 Hz) rhythms using this 2.4 Hz tempo and (2) these tempi lie in the ecological range of tempo perception and production (Drake and Botte, 1993). The sound was then amplitude modulated using an 11 Hz sinusoidal function oscillating between 0.3 and 1. Because the 2.4 Hz frequency was not an integer ratio of the 11 Hz frequency, the convolution of the two frequencies generated subtle irregularities in terms of amplitude and occurrence of the beats, thus resulting in a pseudo-periodic beat structure (Fig. 1A). Importantly, the frequency content of the sound envelope obtained by convoluting the two different amplitude modulation frequencies (2.4 and 11 Hz) contained a peak at the frequency of the beat (2.4 Hz) but did not contain any sideband frequencies corresponding to the frequencies of the binary or ternary meters (i.e., 1.2 and 0.8 Hz, respectively) (Fig. 1C). The subtle irregularities of the beat were perceived by all subjects and were purposely created to avoid induction of an involuntary binary subjective meter in the control condition (Bolton, 1894; Vos, 1973). Furthermore, the pseudo-periodicity of the beat structure, resulting from these irregularities, was closer to the more ecological situation where beat perception refers to the perception of periodicity from a non-strictly periodic framework (Large, 2008).
The auditory stimuli were generated using the PsychToolbox extensions (Brainard, 1997) running under Matlab 6.5 (The MathWork), and presented binaurally through earphones at a comfortable hearing level (BeyerDynamic DT 990 PRO).
Meter mental imagery and control conditions.
Participants were asked to perform three different tasks: a control task, a binary meter imagery task, and a ternary meter imagery task, in separate conditions (Fig. 1). Each condition consisted of 10 trials during which the 33 s auditory stimulus was presented after a 3 s foreperiod. Stimulus presentation was self-paced. During the first condition, participants performed the control task. They were asked to detect a very short (4 ms) sound interruption that was inserted at a random position in two additional trials interspersed within the block. This control task required a sustained level of attention as the stimulus had a complex structure. The two trials containing a short interruption were excluded from further analyses. During the second condition, participants performed the binary meter imagery task. They were asked to imagine a binary metric structure onto the perceived beat (f/2 = 1.2 Hz). During the third condition, they performed the ternary meter imagery task, by imagining a ternary metric structure onto the beat (f/3 = 0.8 Hz). Before the binary and ternary meter conditions, to ensure that participants understood the task, they were asked to perform overt movements (e.g., hand tapping, aloud counting) paced to the imposed metric structure, first with the help of the experimenter, and then alone. Subjective evaluation by the experimenter of the synchrony of those movements with the meter indicated that all participants performed the task without difficulty. The participants were then asked to begin their meter imagery as soon as they heard the first auditory beat of the stimulus, and to maintain this imagery as consistently as possible throughout the entire trial. During debriefing, participants reported that they had performed the mental imagery task without difficulty, although it did require a relatively high level of attention.
EEG recording.
Subjects were comfortably seated in a chair with their head resting on a support. They were instructed to relax, avoid any head or body movement during the recordings, and keep their eyes fixated on a point displayed on a computer screen in front of them. The experimenter remained in the recording room to monitor compliance to these instructions. The EEG was recorded using 64 Ag-AgCl electrodes placed on the scalp according to the International 10/10 system (Waveguard64 cap, Cephalon A/S). Vertical and horizontal eye movements were monitored using four additional electrodes placed on the outer canthus of each eye and in the inferior and superior areas of the right orbit. Electrode impedances were kept at <10 kΩ. The signals were amplified, low-pass filtered at 500 Hz, digitized using a sampling rate of 1000 Hz, and referenced to an average reference (64 channel high-speed amplifier, Advanced Neuro Technology).
EEG analysis.
Continuous EEG recordings were filtered using a 0.1 Hz high-pass Butterworth zero-phase filter to remove very slow drifts in the recorded signals. EEG epochs lasting 32 s were then obtained by segmenting the recordings from +1 to +33 s relative to the onset of the auditory stimulus at the beginning of each trial, thus yielding 10 epochs for each subject and condition. The EEG recorded during the first second of each epoch was removed (1) to discard the transient auditory evoked potential related to the onset of the stimulus (Saupe et al., 2009), (2) because previous studies have shown that steady-state EPs require several cycles of stimulation to be steadily entrained (Regan, 1989), and (3) because previous studies have shown that several repetitions of the beat are required to elicit a steady perception of beat and meter (Repp, 2005). These EEG processing steps were performed using Analyzer 1.05 (Brain Products).
The following EEG processing steps were performed using Letswave (Mouraux and Iannetti, 2008), Matlab (The MathWorks), and EEGLAB (http://sccn.ucsd.edu).
Artifacts produced by eye blinks or eye movements were removed using a validated method based on an independent component analysis (Jung et al., 2000), using the runica algorithm (Bell and Sejnowski, 1995; Makeig et al., 1996), as implemented in EEGLAB. For each subject and condition, EEG epochs were averaged across trials to reduce the contribution of activities non-phase locked to the stimulation train. The time-domain-averaging procedure was used to enhance the signal-to-noise ratio by attenuating the contribution of activities that were not strictly phase locked across trials (i.e., activities that were not phase locked to the sound stimulus). The obtained average waveforms were then transformed in the frequency domain using a discrete Fourier transform (Frigo and Johnson, 1998), yielding a frequency spectrum of signal amplitude (μV) ranging from 0 to 500 Hz with a frequency resolution of 0.031 Hz (Bach and Meigen, 1999).
Within the obtained frequency spectra, signal amplitude may be expected to correspond to the sum of (1) EEG activity induced by the auditory beat and/or the meter imagery task (i.e., beat- and meter-related steady-state EPs) and (2) unrelated residual background noise due, for example, to spontaneous EEG activity, muscle activity, or eye movements. Therefore, to obtain valid estimates of the beat- and meter-related steady-state EPs, the contribution of this noise was removed by subtracting, at each bin of the frequency spectra, the average amplitude measured at neighboring frequency bins (two frequency bins ranging from −0.15 to −0.09 Hz and from +0.09 to +0.15 Hz relative to each frequency bin). The validity of this subtraction procedure relies on the assumption that, in the absence of a steady-state EP, the signal amplitude at a given frequency bin should be similar to the signal amplitude of the mean of the surrounding frequency bins.
Finally, the magnitude of beat- and meter-related steady-state EPs was estimated by averaging the signal amplitude measured at the three frequency bins centered on the target frequency of each steady-state EP (i.e., 2.4 Hz: bins ranging from 2.356 to 2.418 Hz; 1.2 Hz: bins ranging from 1.178 to 1.240 Hz; 0.8 Hz: bins ranging from 0.775 to 0.837 Hz; 1.6 Hz: bins ranging from 1.581 to 1.643 Hz), thereby accounting for a possible spectral leakage due to the fact that the discrete Fourier transform did not estimate signal amplitude at the exact frequency of each steady-state EP.
Statistical analyses.
For each participant, condition, and target frequency, the magnitude of steady-state EPs was averaged across all scalp electrodes, thus excluding any electrode selection bias (see Figs. 2, 3). This approach was used because there was no a priori assumption on the scalp topography of the beat- and meter-induced responses. Group-level results were expressed using the median and interquartile range (see Fig. 4). To examine whether the beat and meter induced a significant steady-state response, one-sample t tests were used to determine whether the noise-subtracted amplitudes measured at the target frequencies were significantly different from zero. Indeed, in the absence of a steady-state response, the average of the subtracted signal amplitude may be expected to tend toward zero.
Figure 2.
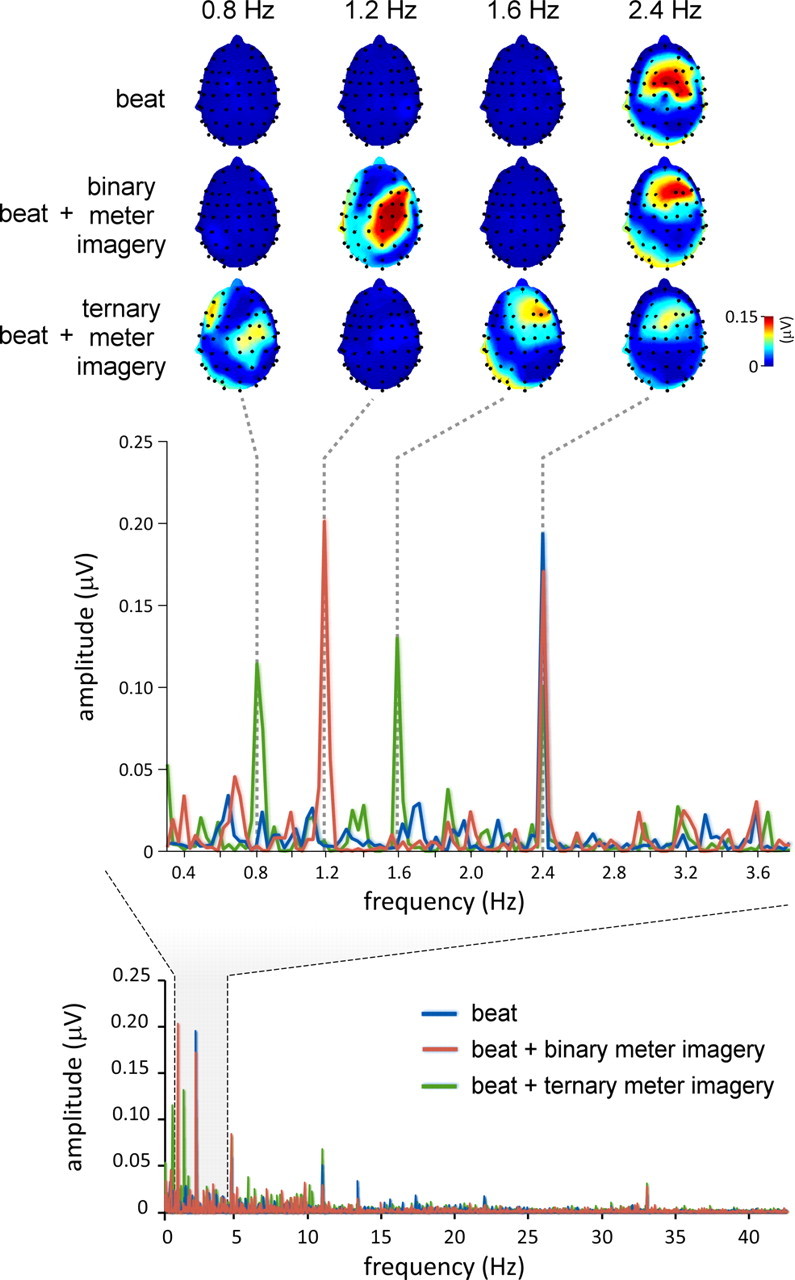
Beat- and meter-related steady-state EPs recorded in a single representative subject. Bottom, The EEG amplitude spectrum (in microvolts) from 0 to 45 Hz, averaged across all scalp electrodes, after applying the noise subtraction procedure (see Materials and Methods). The EEG spectrum obtained in the control condition is shown in blue, whereas the EEG spectra obtained in the binary and ternary meter imagery conditions are shown in red and green, respectively. Middle, The EEG amplitude spectrum (in microvolts) within a frequency range comprising the frequency of the beat (2.4 Hz) and the frequency of the imagined binary and ternary meters (1.2 and 0.8 Hz, respectively). Note that in all three conditions, the auditory stimulus elicited, at f = 2.4 Hz, a clear beat-related steady-state EP. Also note the emergence of a meter-related steady-state EP at 1.2 Hz in the binary meter imagery condition, and at 0.8 and 1.6 Hz in the ternary meter imagery condition. Top, The topographical maps of EEG signal amplitude at 0.8, 1.2, 1.6, and 2.4 Hz, obtained in each of the three conditions.
Figure 3.

Group-level average of the beat- and meter-related steady-state EPs elicited by the 2.4 Hz auditory beat in the control condition (top), the binary meter imagery condition (middle), and the ternary meter imagery condition (bottom). The frequency spectra represent the amplitude of the EEG signal (in microvolts) as a function of frequency, averaged across all scalp electrodes, after applying the noise subtraction procedure (see Materials and Methods). The group-level average frequency spectra are shown using a thick colored line, while single-subject spectra are shown in gray lines. Note that in all three conditions, the auditory stimulus elicited a clear beat-related steady-state EP at f = 2.4 Hz. Also, note the emergence of a meter-related steady-state EP at 1.2 Hz in the binary meter imagery condition, and at 0.8 and 1.6 Hz in the ternary meter imagery condition.
Figure 4.

Amplitude of the beat- and meter-related steady-state EPs elicited in the control condition, the binary meter imagery condition, and the ternary meter imagery condition. Dots represent individual amplitude values of the EEG signal for each experimental condition at each target frequency (1.2, 0.8, 1.6, and 2.4 Hz), averaged across all scalp electrodes after applying the noise subtraction procedure. The whisker plots represent the group-level median and interquartile range.
To compare the beat- and meter-induced steady-state responses across experimental conditions, for each target frequency a one-way repeated-measures ANOVA was used to compare the noise-subtracted amplitudes obtained in the control, binary meter, and ternary meter conditions. Degrees of freedom were corrected using the Greenhouse–Geisser correction for violations of sphericity. Size effects were expressed using the partial η2. When significant, post hoc pairwise comparisons were performed using paired-sampled t tests. The significance level was set at p < 0.05.
Transient auditory event-related potentials.
To examine whether the beat and meter elicited transient auditory event-related potentials that could be identifiable in the time domain, average waveforms were computed after bandpass filtering (0.3 Hz to 30 Hz) and epoch segmentation from +1 s to +33 s relative to the onset of the sound stimulus (see Fig. 5).
Figure 5.

Transient auditory event-related potentials elicited by the 33 s sound stimulus (group-level average waveforms recorded at FCz) in the control condition (blue), the binary meter condition (red), and the ternary meter condition (green). Top, The onset of the auditory stimulus elicited a clear auditory evoked potential consisting of a negative peak (N1) followed by a positive peak (P2). In contrast, beat onsets (represented by the dashed vertical lines) did not elicit a measurable transient event-related potential.
Results
As shown at the individual level (Fig. 2) as well as in the group-level average of the global field amplitude spectra (Fig. 3), the auditory beat elicited, in all three conditions, a clear increase of EEG signal amplitude at 2.4 Hz, corresponding to the frequency of the beat, and referred to as beat-related steady-state EP. Furthermore, binary meter imagery elicited an additional response at 1.2 Hz (corresponding to the frequency of the binary meter), whereas ternary meter imagery elicited an additional response at 0.8 Hz (corresponding to the frequency of the ternary meter) and 1.6 Hz (corresponding to the first upper harmonic of the frequency of the ternary meter), referred to as binary and ternary meter-related steady-state EPs, respectively.
Beat-related steady-state EP
The median noise-subtracted amplitude of the 2.4 Hz beat-related steady-state EP, averaged across all scalp electrodes, was 0.23 μV (interquartile range, 0.12–0.27 μV) in the control condition; 0.20 μV (interquartile range, 0.12–0.28 μV) in the binary meter condition; and 0.22 μV (interquartile range, 0.14–0.35 μV) in the ternary meter condition (Figs. 3, 4). This increase in signal amplitude was significant in all three conditions (control condition: t = −8.1, p < 0.0001; binary meter condition: t = −4.3, p = 0.003; ternary meter condition: t = −4.4, p = 0.03).
The scalp topography of the beat-related steady-state EP was widely distributed over both hemispheres, and most often maximal over frontocentral and temporal regions (Fig. 2, in one subject, as shown).
The magnitude of the beat-related steady-state EP was not significantly different across conditions (F(1.6,11.5) = 0.7, p = 0.494, η2 = 0.09) (Figs. 2–4).
Meter-related steady-state EPs
In the binary meter condition, the noise-subtracted amplitude of the 1.2 Hz meter-related steady-state EP was 0.12 μV (interquartile range, 0.05–0.24 μV). This increase in signal amplitude was significant (t = −3.1, p = 0.01). In contrast, the amplitude of the noise-subtracted signal at 1.2 Hz obtained in the control condition (0.004 μV; interquartile range, −0.04–0.03 μV) and in the ternary meter condition (0.004 μV; interquartile range, −0.01–0.03 μV) was not significantly greater than zero (control condition: t = −0.2, p = 0.81; ternary meter condition: t = −0.10, p = 0.92) (Figs. 2, 3).
The magnitude of the 1.2 Hz meter-related steady-state EP differed significantly across conditions (F(1.2,13.4) = 11.5, p = 0.008, η2 = 0.62). Post hoc comparisons revealed that the magnitude of the EEG signal at 1.2 Hz was significantly greater in the binary meter condition than in the control condition (t = 3.4; p = 0.012) and the ternary meter condition (t = 3.6; p = 0.009) (Fig. 4).
In the ternary meter condition, the noise-subtracted amplitude of the 0.8 Hz meter-related steady-state EP was 0.18 μV (interquartile range, 0.10–0.21 μV) and that of the 1.6 Hz meter-related steady-state EP was 0.08 μV (interquartile range, 0.05–0.14 μV). Both increases in signal amplitude were significant (t = 5.7, p = 0.001; and t = 26.8, p < 0.0001, respectively). In contrast, the amplitude of the noise-subtracted signals obtained at 0.8 and 1.6 Hz in the control condition [0.8 Hz: −0.02 μV (−0.05–−0.01 μV); 1.6 Hz: 0.02 μV (−0.02–0.023 μV)] and in the binary meter condition [0.8 Hz: −0.002 μV (−0.07–0.02 μV); 1.6 Hz: −0.003 μV (−0.01–0.02 μV)] were not significantly greater than zero (control condition at 0.8 Hz: t = 0.1, p = 0.91, and 1.6 Hz: t = −0.3, p = 0.74; binary meter condition at 0.8 Hz: t = 1.4, p = 0.21, and 1.6 Hz: t = −0.4, p = 0.71) (Figs. 2, 3).
The magnitude of the 0.8 and 1.6 Hz meter-related steady-state EP differed significantly across conditions (0.8 Hz: F(1.8,12.4) = 12.5, p = 0.001, η2 = 0.64; 1.6 Hz: F(1.2,7.9) = 22.1, p = 0.001, η2 = 0.76). Post hoc comparisons revealed that at both 0.8 and 1.6 Hz the magnitude of the EEG signal was significantly greater in the ternary meter condition than in both the control condition (0.8 Hz: t = 4.1, p = 0.005; 1.6 Hz: t = 6.1, p < 0.001) and the binary meter condition (0.8 Hz: t = 4.0, p = 0.005; 1.6 Hz: t = 10.8, p < 0.001) (Fig. 4).
The topographical distribution of the 1.2, 0.8, and 1.6 Hz meter-related steady-state EPs varied largely across subjects (Fig. 2, scalp topographies obtained in one subject).
Transient auditory event-related potentials
As shown in Figure 5, the onset of the auditory stimulus elicited a clear auditory evoked potential (N1 and P2 peaks), maximal at frontocentral electrodes. However, probably because the auditory beats were not induced by abrupt changes in the sound stream such as auditory “clicks,” the beat onsets did not show measurable transient event-related potentials.
Discussion
Our results show that neural entrainment to beat and meter can be captured directly in the human EEG as a periodic response entrained at the frequency of the beat and meter, respectively. Indeed, we found that the perception of a beat in a complex auditory signal was related to the emergence of a sustained periodic response in the EEG spectrum, appearing as a steady-state EP at the beat frequency (f = 2.4 Hz). More importantly, although the auditory stimulus was identical in all experimental conditions, we found that the voluntary metric interpretation of the beat as binary or ternary induced the emergence of an additional periodic signal in the EEG, at the corresponding subharmonic of beat frequency (f/2 = 1.2 Hz and f/3 = 0.8 Hz for binary and ternary interpretations, respectively).
These findings provide strong and direct support to the resonance theory for beat and meter processing, which proposes that beat perception is subtended by the entrainment of neurons resonating at the beat frequency, and to the idea that endogenous metric representations of the beat are subtended by higher-order resonance products at frequencies corresponding to specific subharmonics of the beat frequency (Large and Kolen, 1994; van Noorden and Moelants, 1999; Large, 2008; Large and Snyder, 2009).
Neuronal entrainment to the beat
In the present study, the beat was induced by a continuous sound pattern whose amplitude envelope was not strictly periodic, thus requiring the endogenous reconstruction of beat periodicity. Musical beats are usually induced by acoustic features, such as a periodic modulation of loudness, melodic or harmonic accents, or timbre variations (Drake et al., 2000; London, 2004). Musical beats can also be generated by mental representations shaped by prior musical experience, by the expectation of a periodicity, and by a natural human tendency to generate periodic motions at rates corresponding to musical tempo range (Palmer and Krumhansl, 1990; van Noorden and Moelants, 1999; London, 2004).
How the brain performs these processes remains unclear. In the dynamic attending model proposed by Jones and Boltz (1989) and Large and Jones (1999), beat perception is considered to be the result of a dynamic process in which the periodic structure of the beat synchronizes or entrains the listener's attention, leading to a periodic modulation of expectancy as a function of time. Building on this notion, the resonance theory for beat and meter perception (Large and Kolen, 1994; van Noorden and Moelants, 1999; Large, 2008) proposes that beat perception is subtended by neuronal entrainment at the beat frequency. Here, we show that the periodic activity resulting from this neuronal entrainment can be captured directly in the human EEG, as a steady-state EP. Nevertheless, whether or not the beat- and meter-induced steady-state responses reported in the present study reflected the entrainment of the neuronal populations contributing to transient auditory-evoked potentials remains, at present, an open question (Navarro Cebrian and Janata, 2010).
Furthermore, we propose that the beat-induced periodic EEG response identified in the present study may constitute a direct correlate of the actual mechanism through which attentional and perceptual processes are dynamically modulated as a function of time. Indeed, the responsiveness of the neuronal population that is entrained to the beat may be expected to vary according to the phase of the beat-induced cycle. Most importantly, this hypothesis would account for the previous observations that event-related potentials elicited at different time points relative to the beat or meter cycle exhibit differences in amplitude (Brochard et al., 2003; Snyder and Large, 2005; Pablos Martin et al., 2007; Grube and Griffiths, 2009; Iversen et al., 2009; Fujioka et al., 2010; Schaefer et al., 2011). Indeed, several electrophysiological studies in primates including humans have suggested that when the activity of a neuronal population synchronizes at a given frequency, the phase of the induced oscillations can elicit a cyclic fluctuation of the excitability of the responding neuronal population, leading to an amplitude modulation of the event-related brain potentials that can be generated by these populations (Varela et al., 1981; Haig and Gordon, 1998; Makeig, 2002; Buzsáki and Draguhn, 2004; Lakatos et al., 2008; Schroeder et al., 2008; Sirota et al., 2008), but also a modulation of behavioral performance (Busch et al., 2009).
Neuronal entrainment to the meter
Musical beats can be organized in meters. As for the beat, meters in music are usually induced by accents, defined as periodic physical changes in the beat sequence such as changes in duration, loudness, timbre, or pitch (Lerdahl and Jackendoff, 1983). When these accents are impoverished, ambiguous, or even absent, the perception of a meter can still emerge, based on mental representations of meter (Lerdahl and Jackendoff, 1983; Repp, 2010). Perception of meter can emerge involuntarily as in the “tick tock” phenomenon (Bolton, 1894; Vos, 1973; Brochard et al., 2003) or, as in the present study, be induced voluntarily by imposing onto the beat the mental imagery of a given meter (Iversen et al., 2009; Fujioka et al., 2010; Schaefer et al., 2011).
Perceiving a given metric structure introduces additional periodicities, corresponding to integer ratios, or subharmonics, of the beat frequency (e.g., f/2 for a binary meter, as in a march; f/3 for a ternary meter, as in a waltz). A number of psychophysical and electrophysiological studies have shown that humans have a natural preference for such integer ratios in timing perception and production (Essens, 1986; Brochard et al., 2003; Repp, 2005; Pablos Martin et al., 2007), corroborating the resonance theory for beat and meter processing (Large, 2008). Our finding that an internally driven metric structure applied onto the beat induces a periodic response in the EEG at the frequency of the applied meter suggests that the metric interpretation of the beat could emerge from the facilitation or enhancement of specific subharmonics within the neuronal network entrained by the beat. Importantly, because, in the present study, this metric interpretation was entirely driven by mental imagery, one must hypothesize that the emergence of these subharmonics of beat frequency can be generated through a dynamic top-down biasing of auditory beat processing.
Interestingly, when participants performed the ternary meter imagery task, this led not only to the emergence of a steady-state EP at the frequency of the corresponding meter (f/3 = 0.8 Hz), but also at twice this frequency (1.6 Hz). The frequency of this additional steady-state EP corresponds to the frequency of the first upper harmonic of the meter frequency [i.e., 2 × (f/3) = 1.6 Hz] and could thus reflect the involuntary emergence of an additional metric level, here corresponding to a binary metric level spontaneously emerging alongside the voluntary ternary metric representation. This interpretation would suggest that the representation of multiple metric levels could be represented by such higher-order resonance products and would agree with the natural human bias for binary structures in timing perception and production (Essens, 1986; Brochard et al., 2003; Repp, 2005; Pablos Martin et al., 2007). Conversely, the frequency of this additional steady-state EP also corresponds to the frequency of the cross-modulation product between beat and meter frequencies [i.e., f − (f/3) = 1.6 Hz]. Several studies have shown that when two or more steady-state EPs are elicited simultaneously, cross-modulation products can appear due to the nonlinear convergence of the two oscillators (Regan, 1989; Sutoyo and Srinivasan, 2009). Hence, this additional steady-state EP could reflect an interaction between beat and meter processing in the human brain, in the form of a specific higher-order resonance product, or “integration frequency” (Regan, 1989; Sutoyo and Srinivasan, 2009).
Conclusion
The results of the present study constitute direct experimental evidence for the entrainment of neuronal populations at the frequency of the beat, and at the subharmonics corresponding to the metric interpretation of this beat. These findings thus bring strong support for the resonance theory for beat and meter perception in humans (Large and Kolen, 1994; van Noorden and Moelants, 1999; Large, 2008). More generally, the finding that a mental representation of a given metric structure can induce a marked neuronal entrainment at the frequency of the meter provides a compelling empirical evidence of the theory of neuronal oscillations for dynamic cognitive processing (Buzsáki and Draguhn, 2004) and suggests that, due to their inherent periodic temporal structures, music and dance constitute a unique context to explore the phenomenon of entrainment at the level of neural networks.
Footnotes
S.N. and M.M. are supported by the Fund for Scientific Research of the French-speaking community of Belgium. I.P. is supported by the Natural Sciences and Engineering Research Council of Canada, the Canadian Institutes of Health Research, and a Canada Research Chair. We thank Giandomenico Iannetti (University College London, London, UK), Valery Legrain (Ghent University, Ghent, Belgium), and Bruno Rossion (Université Catholique de Louvain, Brussels, Belgium) for their highlighting comments and suggestions.
References
- Bach M, Meigen T. Do's and don'ts in Fourier analysis of steady-state potentials. Doc Ophthalmol. 1999;99:69–82. doi: 10.1023/a:1002648202420. [DOI] [PubMed] [Google Scholar]
- Bell AJ, Sejnowski TJ. An information-maximization approach to blind separation and blind deconvolution. Neural Comput. 1995;7:1129–1159. doi: 10.1162/neco.1995.7.6.1129. [DOI] [PubMed] [Google Scholar]
- Bolton TL. Rhythm. Am J Psychol. 1894;6:145–238. [Google Scholar]
- Brainard DH. The psychophysics toolbox. Spat Vis. 1997;10:433–436. [PubMed] [Google Scholar]
- Brochard R, Abecasis D, Potter D, Ragot R, Drake C. The “tick-tock” of our internal clock: direct brain evidence of subjective accents in isochronous sequences. Psychol Sci. 2003;14:362–366. doi: 10.1111/1467-9280.24441. [DOI] [PubMed] [Google Scholar]
- Busch NA, Dubois J, VanRullen R. The phase of ongoing EEG oscillations predicts visual perception. J Neurosci. 2009;29:7869–7876. doi: 10.1523/JNEUROSCI.0113-09.2009. [DOI] [PMC free article] [PubMed] [Google Scholar]
- Buzsáki G, Draguhn A. Neuronal oscillations in cortical networks. Science. 2004;304:1926–1929. doi: 10.1126/science.1099745. [DOI] [PubMed] [Google Scholar]
- Draganova R, Ross B, Borgmann C, Pantev C. Auditory cortical response patterns to multiple rhythms of AM sound. Ear Hear. 2002;23:254–265. doi: 10.1097/00003446-200206000-00009. [DOI] [PubMed] [Google Scholar]
- Drake C, Botte MC. Tempo sensitivity in auditory sequences: evidence for a multiple look model. Percept Psychophys. 1993;54:277–286. doi: 10.3758/bf03205262. [DOI] [PubMed] [Google Scholar]
- Drake C, Jones MR, Baruch C. The development of rhythmic attending in auditory sequences: attunement, referent period, focal attending. Cognition. 2000;77:251–288. doi: 10.1016/s0010-0277(00)00106-2. [DOI] [PubMed] [Google Scholar]
- Essens PJ. Hierarchical organization of temporal patterns. Percept Psychophys. 1986;40:69–73. doi: 10.3758/bf03208185. [DOI] [PubMed] [Google Scholar]
- Frigo M, Johnson SG. FFTW: an adaptive software architecture for the FFT. Proceedings of the 1998 IEEE International Conference on Acoustics, Speech and Signal Processing; Washington, DC: IEEE; 1998. pp. 1381–1384. [Google Scholar]
- Fujioka T, Zendel BR, Ross B. Endogenous neuromagnetic activity for mental hierarchy of timing. J Neurosci. 2010;30:3458–3466. doi: 10.1523/JNEUROSCI.3086-09.2010. [DOI] [PMC free article] [PubMed] [Google Scholar]
- Galambos R, Makeig S, Talmachoff PJ. A 40-Hz auditory potential recorded from the human scalp. Proc Natl Acad Sci U S A. 1981;78:2643–2647. doi: 10.1073/pnas.78.4.2643. [DOI] [PMC free article] [PubMed] [Google Scholar]
- Grube M, Griffiths TD. Metricality-enhanced temporal encoding and the subjective perception of rhythmic sequences. Cortex. 2009;45:72–79. doi: 10.1016/j.cortex.2008.01.006. [DOI] [PubMed] [Google Scholar]
- Haig AR, Gordon E. Prestimulus EEG alpha phase synchronicity influences N100 amplitude and reaction time. Psychophysiology. 1998;35:591–595. doi: 10.1017/s0048577298970512. [DOI] [PubMed] [Google Scholar]
- Iversen JR, Repp BH, Patel AD. Top-down control of rhythm perception modulates early auditory responses. Ann NY Acad Sci. 2009;1169:58–73. doi: 10.1111/j.1749-6632.2009.04579.x. [DOI] [PubMed] [Google Scholar]
- Jones MR, Boltz M. Dynamic attending and responses to time. Psychol Rev. 1989;96:459–491. doi: 10.1037/0033-295x.96.3.459. [DOI] [PubMed] [Google Scholar]
- Jung TP, Makeig S, Westerfield M, Townsend J, Courchesne E, Sejnowski TJ. Removal of eye activity artifacts from visual event-related potentials in normal and clinical subjects. Clin Neurophysiol. 2000;111:1745–1758. doi: 10.1016/s1388-2457(00)00386-2. [DOI] [PubMed] [Google Scholar]
- Lakatos P, Karmos G, Mehta AD, Ulbert I, Schroeder CE. Entrainment of neuronal oscillations as a mechanism of attentional selection. Science. 2008;320:110–113. doi: 10.1126/science.1154735. [DOI] [PubMed] [Google Scholar]
- Large EW. Resonating to musical rhythm: theory and experiment. In: Grondin S, editor. The psychology of time. West Yorkshire, UK: Emerald; 2008. pp. 189–232. [Google Scholar]
- Large EW, Jones MR. The dynamics of attending: how people track time-varying events. Psychol Rev. 1999;106:119–159. [Google Scholar]
- Large EW, Kolen JF. Resonance and the perception of musical meter. Connect Sci. 1994;6:177–208. [Google Scholar]
- Large EW, Snyder JS. Pulse and meter as neural resonance. The neurosciences and music III—disorders and plasticity. Ann NY Acad Sci. 2009;1169:46–57. doi: 10.1111/j.1749-6632.2009.04550.x. [DOI] [PubMed] [Google Scholar]
- Lerdahl F, Jackendoff R. A generative theory of tonal music. Cambridge, MA: MIT; 1983. [Google Scholar]
- London J. London: Oxford UP; 2004. Hearing in time: psychological aspects of musical meter. [Google Scholar]
- Makeig S. Response: event-related brain dynamics—unifying brain electrophysiology. Trends Neurosci. 2002;25:390. doi: 10.1016/s0166-2236(02)02198-7. [DOI] [PubMed] [Google Scholar]
- Makeig S, Bell AJ, Jung TP, Sejnowski TJ. Independent component analysis of electroencephalographic data. In: Touretzky D, Mozer M, Hasselmo M, editors. Advances in neural information processing systems. Vol 8. Cambridge, MA: MIT; 1996. pp. 145–151. [Google Scholar]
- Mouraux A, Iannetti GD. Across-trial averaging of event-related EEG responses and beyond. Magn Reson Imaging. 2008;26:1041–1054. doi: 10.1016/j.mri.2008.01.011. [DOI] [PubMed] [Google Scholar]
- Navarro Cebrian A, Janata P. Electrophysiological correlates of accurate mental image formation in auditory perception and imagery tasks. Brain Res. 2010;1342:39–54. doi: 10.1016/j.brainres.2010.04.026. [DOI] [PubMed] [Google Scholar]
- Pablos Martin X, Deltenre P, Hoonhorst I, Markessis E, Rossion B, Colin C. Perceptual biases for rhythm: the mismatch negativity latency indexes the privileged status of binary vs non-binary interval ratios. Clin Neurophysiol. 2007;118:2709–2715. doi: 10.1016/j.clinph.2007.08.019. [DOI] [PubMed] [Google Scholar]
- Palmer C, Krumhansl CL. Mental representations for musical meter. J Exp Psychol Hum Percept Perform. 1990;16:728–741. doi: 10.1037//0096-1523.16.4.728. [DOI] [PubMed] [Google Scholar]
- Plourde G. Auditory evoked potentials. Best Pract Res Clin Anaesthesiol. 2006;20:129–139. doi: 10.1016/j.bpa.2005.07.012. [DOI] [PubMed] [Google Scholar]
- Regan D. New York: Elsevier; 1989. Human brain electrophysiology: evoked potentials and evoked magnetic fields in science and medicine. [Google Scholar]
- Repp BH. Sensorimotor synchronization: a review of the tapping literature. Psychon Bull Rev. 2005;12:969–992. doi: 10.3758/bf03206433. [DOI] [PubMed] [Google Scholar]
- Repp BH. Do metrical accents create illusory phenomenal accents? Atten Percept Psychophys. 2010;72:1390–1403. doi: 10.3758/APP.72.5.1390. [DOI] [PubMed] [Google Scholar]
- Saupe K, Schröger E, Andersen SK, Müller MM. Neural mechanisms of intermodal sustained selective attention with concurrently presented auditory and visual stimuli. Front Hum Neurosci. 2009;3:58. doi: 10.3389/neuro.09.058.2009. [DOI] [PMC free article] [PubMed] [Google Scholar]
- Schaefer RS, Vlek RJ, Desain P. Decomposing rhythm processing: electroencephalography of perceived and self-imposed rhythmic patterns. Psychol Res. 2011;75:95–106. doi: 10.1007/s00426-010-0293-4. [DOI] [PMC free article] [PubMed] [Google Scholar]
- Schroeder CE, Lakatos P, Kajikawa Y, Partan S, Puce A. Neuronal oscillations and visual amplification of speech. Trends Cogn Sci. 2008;12:106–113. doi: 10.1016/j.tics.2008.01.002. [DOI] [PMC free article] [PubMed] [Google Scholar]
- Sirota A, Montgomery S, Fujisawa S, Isomura Y, Zugaro M, Buzsáki G. Entrainment of neocortical neurons and gamma oscillations by the hippocampal theta rhythm. Neuron. 2008;60:683–697. doi: 10.1016/j.neuron.2008.09.014. [DOI] [PMC free article] [PubMed] [Google Scholar]
- Snyder JS, Large EW. Gamma-band activity reflects the metric structure of rhythmic tone sequences. Brain Res Cogn Brain Res. 2005;24:117–126. doi: 10.1016/j.cogbrainres.2004.12.014. [DOI] [PubMed] [Google Scholar]
- Sutoyo D, Srinivasan R. Nonlinear SSVEP responses are sensitive to the perceptual binding of visual hemifields during conventional “eye” rivalry and interocular “percept” rivalry. Brain Res. 2009;1251:245–255. doi: 10.1016/j.brainres.2008.09.086. [DOI] [PMC free article] [PubMed] [Google Scholar]
- van Noorden L, Moelants D. Resonance in the perception of musical pulse. J New Music Res. 1999;28:43–66. [Google Scholar]
- Varela FJ, Toro A, John ER, Schwartz EL. Perceptual framing and cortical alpha rhythm. Neuropsychologia. 1981;19:675–686. doi: 10.1016/0028-3932(81)90005-1. [DOI] [PubMed] [Google Scholar]
- Vos PG. Nijmegen, The Netherlands: Stichting Studentenpers; 1973. Waarneming van metrische toon reeksen. [Google Scholar]