

Abstract
The frontal eye field (FEF) of the primate neocortex occupies a pivotal position in the matrix of inter-areal projections. In addition to its role in directing saccadic eye movements, it is the source of an attentional signal that modulates the activity of neurons in extrastriate and parietal cortex. Here, we tested the prediction that FEF preferentially excites inhibitory neurons in target areas during attentional modulation. Using the anterograde tracer biotinylated dextran amine, we found that the projections from FEF terminate in all cortical layers of area 46, lateral intraparietal area (LIP), and visual area V4. Axons in layer 1 spread extensively, those in layer 2/3 were most numerous, individual axons in layer 4 formed sprays of collaterals, and those of the deep layers were the finest caliber and irregular. All labeled synapses were the typical asymmetric morphology of excitatory synapses of pyramidal neurons. Dendritic spines were the most frequent synaptic target in all areas (95% in area 46, 89% in V4, 84% in LIP, 78% intrinsic local FEF). The remaining targets were one soma and dendritic shafts, most of which showed characteristics of inhibitory neurons with smooth dendrites (5% of all targets in area 46, 2% in V4, 9% in LIP, and 13% in FEF).
Introduction
The prefrontal cortical area of the frontal eye field (FEF) (area 8A) occupies a pivotal position in the primate visual system. Although best known for its key role in eye movements (Ferrier, 1874; Robinson and Fuchs, 1969; Schiller et al., 1979; Goldberg and Bushnell, 1981), FEF is also implicated in working memory (Balan and Ferrera, 2003), decision-making (Ferrera et al., 2009), and mechanisms of attention (Moore and Fallah, 2001). Attention has been shown to enhance oscillatory activity originating in FEF (Buschman and Miller, 2009) and the coupling between FEF and area V4 (Gregoriou et al., 2009). Electrical stimulation of FEF in monkeys drives attention-like changes in receptive fields in extrastriate cortex, modulates attentional performance, and modulates the blood oxygen level-derived (BOLD) signal across a wide swathe of visual areas (Moore and Fallah, 2004; Armstrong et al., 2006; Armstrong and Moore, 2007; Ekstrom et al., 2008). In humans, transcranial magnetic stimulation of FEF modulates the BOLD signal in the visual cortex (Ruff et al., 2006).
Neurons in V4 increase their firing when the monkey attends to a stimulus within their receptive fields (Luck et al., 1997; McAdams and Maunsell, 1999, 2000; Reynolds et al., 1999, 2000). Mitchell et al. (2007) found that presumed inhibitory neurons show larger attention-dependent increases in firing rates than do presumed excitatory neurons. Hussar and Pasternak (2009) reported similar biases for presumed inhibitory neurons in the effects of attention in area 46, which is monosynaptically connected to FEF (Barbas and Mesulam, 1981; Huerta et al., 1987; Barbas and Pandya, 1989; Stanton et al., 2005). Inhibitory neurons have also been implicated in the strong suppression effects of distractors on area 46 neurons (Lennert and Martinez-Trujillo, 2011).
There is, however, a gap in our knowledge about the anatomical pathways whereby FEF exerts its effects on visual areas (Kayser and Logothetis, 2006). The most direct and likely route is the monosynaptic connection from the FEF to the posterior parietal and the occipital lobe (Huerta et al., 1987; Stanton et al., 1995), including area V1 (Clavagnier et al., 2004), V2 (Markov et al., 2011), and V4 (Stanton et al., 1995; Barone et al., 2000). In the occipital lobe, the earliest and strongest effects of the attentional signal are seen in V4, with progressively later and lesser effects in V2 and V1 (Buffalo et al., 2010).
For the inhibitory neurons to be activated differentially from their neighboring excitatory cells under the conditions of an attentional signal, their excitatory input must shift from local sources (Binzegger et al., 2004) to external sources, such as the inter-areal connections or the thalamus. This requires that projections from the source of the attentional signal, in this case FEF, strongly target inhibitory neurons. We tested this prediction by defining quantitatively the synaptic targets of FEF projections to V4, area 46, and lateral intraparietal area (LIP). Our data support the null hypothesis: in all areas we found that the overwhelming majority of targets were the spines of excitatory pyramidal cells, not putative inhibitory neurons.
Materials and Methods
The material presented here was taken from two adult female cynomolgus monkeys (Macaca fascicularis) and one adult female rhesus monkey (Macaca mulatta). Animal treatment and surgical protocols were performed in accordance with the guidelines of the Direction départementale de services vétérinaires du Rhône and the Kantonal Veterinaeramt of Zurich (the experimental protocols for the project “Microcircuits of Neocortex” were approved by the Kantonal Veterinaeramt of Zurich, which issued the license numbers 50/3002 and 50/2003 to K.A.C.M.). Animals were prepared for surgery after intramuscular premedication with Largactil (0.5 ml), atropine (1.25 mg), and dexamethasone (4 mg), followed by ketamine hydrochloride (20 mg/kg) or ketamine hydrochloride (10 mg/kg) and xylazine (0.5 mg/kg), followed by alphaxalone/alphadalone (Saffan). Anesthesia was continued with halothane in N2O and O2 (70:30). The following procedures are similar to those used by Anderson and Martin (2002).
Two animals received pressure injections of the neuronal tracer biotinylated dextran amine (BDA) (Invitrogen) as a 10% solution in 0.01 m PBS, pH 7.4, using a Hamilton syringe. One of these animals received two injections into ventrolateral FEF (lateral area 8) of each hemisphere. The second of these animals received four injections into dorsomedial FEF (medial area 8) of one hemisphere and three injections into ventrolateral FEF (lateral area 8) of the other hemisphere. The location of area 8/FEF was determined using recognizable landmarks (Fig. 1).
Figure 1.

Location of injection sites and labeled boutons. A–D, Schematic drawing of a macaque brain (A) showing cortical areas V4 (left, dark gray), LIP (middle, gray), and area 46 (right, light gray). Also shown are schematic sections made in the coronal plane through the following: tip of prearcuate gyrus (dotted line), shown in B (as, arcuate sulcus); dorsal prelunate area (dashed line, left), shown in C; and prefrontal cortex (dashed line, right), shown in D. The injection sites in FEF are indicated in B (arrows). Labeled boutons were taken (curved arrows, C, D) from areas LIP, V4, and 46, as well as the FEF injection site area. Small axes, L, lateral; D, dorsal.
After a 14 d survival period, the animals were very deeply anesthetized with pentobarbital (20 mg/kg, i.v.) and then perfused transcardially with a normal saline solution, followed by a solution of 4% paraformaldehyde, 0.3% glutaraldehyde, and 15% picric acid in 0.1 m phosphate buffer (PB), pH 7.4. To explore the local projections within FEF, the third animal received small iontophoretically delivered injections of BDA into the superficial layers of FEF (area 8L) using ∼1 μA for 10–30 s. The tip diameter of the delivery pipette was from 0.02 to 0.04 μm. The animal was maintained under general anesthesia for 30 h and then perfused as above. The brain was removed and blocks of cortex containing the injection site and areas 46, V4, and LIP were taken. The block was cryoprotected by sinking in sucrose solutions of 10, 20, and 30% in 0.1 m PB, then freeze-thawed in liquid nitrogen and washed in 0.1 m PB. Sections were cut from the block at 80 μm in the coronal plane and collected in 0.1 m PBS. We used standard procedures to reveal the neuronal tracers. In brief outline, washes in PBS were followed by 10% normal swine serum (NSS) in PBS (1 h). Further washes in NSS preceded overnight exposure (5°C) to an avidin-biotin complex (Vector Laboratories ABC kit Elite). The peroxidase activity was identified using 3,3′-diaminobenzidine tetrahydrochloride (DAB) with nickel intensification. After assessment by light microscopy, selected regions of tissue were treated with 1% osmium tetroxide in 0.1 m PBS. Dehydration through alcohols (1% uranyl acetate in the 70% alcohol) and propylene oxide allowed flat mounting in Durcupan (Fluka) on glass slides. Some non-osmicated sections were Nissl-stained with cresyl violet to identify cortical laminae.
Light microscopic observations of labeled axons were performed to locate and select regions of interest for electron microscopy. We reconstructed groups of collaterals over one or two sections to show the general pattern of innervation and to locate individual collaterals in specific laminae. This was followed by correlated light and electron microscopy. Serial ultrathin sections at 40 or 60 nm thickness were collected on Pioloform-coated single-slot copper grids. Labeled boutons were photographed at a magnification of 21,000×. Synapses and associated structures were classified using conventional criteria (Peters et al., 1991). Collections of serial sections were digitized, reconstructed, and measured using Reconstruct (Fiala, 2005). We used the “rare event systematically optimized random sampling” (RESORS) physical disector method (da Costa et al., 2009) for counting rare events, to estimate the proportion of labeled synapses. Adobe Photoshop CS and Adobe Illustrator CS were used to prepare digital photomicrographs and enhance image contrast.
Results
Light microscopy
Both female cynomolgus monkeys (Macaca fascicularis) received pressure injections of BDA into area 8A (FEF) in a crescent along the anterior edge of the arcuate sulcus, medial and lateral to a caudal projection of the principal sulcus (Fig. 1). The needle passed vertically through the lip of the arcuate sulcus, down its anterior bank, labeling cells to the fundus of the sulcus through all layers of cortex. In one animal, two 0.5 μl pressure injections were made into each hemisphere along the lip of the arcuate gyrus, lateral to the caudal projection of principal sulcus, described as area 8A/45 border (Saleem and Logothetis, 2007). This region is generally accepted as the lateral portion of the FEF. In the second animal, three 0.2 μl injections of BDA were made into the lateral area 8A of one hemisphere, and in the other hemisphere, four injections were made along the lip of the arcuate sulcus, medial to the caudal projection of the principal sulcus. Lateral injections had BDA label more confined to the lateral regions of the area 8, whereas the medial injections, because they descend vertically, resulted in more extensive labeling of area 8. The BDA label around the injection sites spread over >1 mm in the case of the larger injection volumes and ∼0.5 mm for the smaller injections. The regions nearest to the penetration were diffusely labeled with a penumbra of scattered and dispersed pyramidal cells. Pressure injections were all confined to the gray matter, and the BDA label could be seen in all laminae, which made it impossible to identify the precise laminar location of the cells of origin of the projecting axons.
A third monkey (rhesus, Macaca mulatta) received small iontophoretic injections into layer 2/3 of lateral area 8A. Each iontophoretic injection labeled a small cluster of ∼5–10 labeled neurons in layer 2/3. Most of the labeled cells were pyramidal. Occasionally, a cell with smooth dendrites and lacking an apical dendrite was found amid the tangle of spiny cells. Myelin is a barrier to the penetration of the reagents, and thus axons were stained only at their cut ends, nodes, or branch points from where the collaterals emerged.
In the pressure-injected animals, anterogradely labeled axonal arbors were found in extrastriate visual areas and prefrontal cortex as well as the STS, intraparietal sulcus, and postcentral gyrus. Pale-stained somata of deep and superficial layer neurons were occasionally seen, due to weak retrograde transport of the BDA. They had a very lightly scattered, grainy reaction-product within the cell soma, but their dendrites and axon collaterals were not labeled. The small iontophoretic injections labeled local neurons, but not other cortical areas. Most of the labeled axons were seen in the immediate vicinity of the labeled cell bodies. More distal boutons were rarely seen and were not examined in the electron microscope.
V4, area 46, and LIP
Labeled axons and their terminals were found in all layers of areas V4 (Fig. 2), area 46, and LIP. Fibers entered from the white matter and projected upward to the pial surface. The path of the projection was radial and oblique and spread over large areas of cortex. Bouton-rich collaterals formed in all layers. Sometimes a thicker fiber traversed through a particular lamina, sending out fine collaterals that radiated or even descended when in layers 4, 5, and 6, and when in layer 2 and 3, climbed to layer 1. Layer 1 had long, horizontally projecting axons that occasionally dropped collaterals down into layers 2 and 3. The fine horizontal fibers of layer 1 and the fibers that descended to layers 2 and 3 showed bouton-like swellings that were later demonstrated by electron microscopy to be synaptic. However, the thicker horizontal axons in layer 1 had fewer swellings, many of which proved to be nonsynaptic in the electron microscope. These fibers were intermittently myelinated, and so they appeared and disappeared from view in the light microscope as the penetration of the reagents varied. This description of the overall LM appearance applies equally to areas 46, LIP, and V4.
Figure 2.

Light microscopic reconstruction of BDA-labeled terminals and their boutons in area V4. The reconstruction is composed from two adjacent 80-μm-thick sections. Laminae and their boundaries are indicated to the left. Scale bar, 100 μm.
In addition to the general features described above, we found some variations in the patterns of innervation. For example, in V4, layer 4 was innervated in only one of the two pressure-injected animals. Terminal boutons were found in all laminae of LIP in one hemisphere of one animal, while in the second animal, the densest boutons were predominantly in deep and superficial layers, although at the fringes of the densest innervation, layer 4 did contain boutons. The densest labeling of boutons in LIP was consistently in layers 1 and 2. We could not relate these variants to differences in the location of our pressure injection sites. For example, after injections in lateral FEF in one animal, there were labeled boutons in all layers including 4 of V4, but despite similar injection locations in the other hemisphere, labeled boutons appeared in all layers except layer 4.
Electron microscopy
To provide a convincing test of the hypothesis that smooth neurons were the principal target of the FEF projection, we examined a total of 555 boutons (158 in V4, 195 in LIP, 202 in area 46). Of this sample, 395 single boutons were serially sectioned and completely reconstructed so that the area of the postsynaptic density (PSD) could be measured. The remaining 53 boutons were not sufficiently complete for quantification of their synapses, but were used in the assessment of synaptic targets. Altogether, we examined 120 boutons from layer 1, 166 from layer 2/3, 125 from layer 4, and 144 from layer 5/6. All the synapses formed by labeled boutons were asymmetric (Gray's type 1), which is typical of pyramidal cell axons.
The reaction end-product was electron dense, though its intensity varied between boutons. Synaptic vesicles and mitochondria were clearly visible within the boutons, and occasional boutons contained vacuoles (Fig. 3; see Figs. 5, 7B). Most boutons were small (<0.5 μm), although the sample showed a considerable range of sizes. The labeled boutons were filled with synaptic vesicles and usually contained at least one mitochondria, and a clear density was seen postsynaptically.
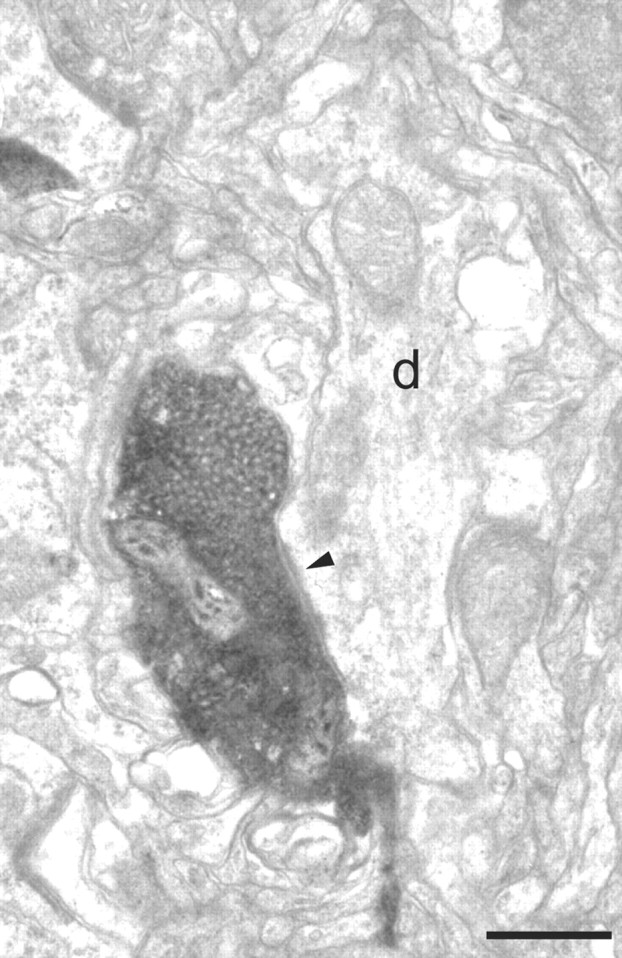
Figure 3.

Electron micrograph of BDA-labeled bouton located in layer 1 of area V4. A labeled bouton forms an asymmetric synapse (solid arrowhead) with a spine (sp1) that can be traced back to the parent dendrite (d). A second spine (sp2) can be seen to connect with the same dendritic shaft (d). Scale bar, 0.5 μm.
Figure 5.

Electron micrographs of BDA-labeled boutons located in layers 4 and 5/6 of area V4. A, A labeled bouton in layer 4 forms an asymmetric synapse (solid arrowhead) with a spine (sp). The spine also forms a symmetric synapse (small arrow). B, A labeled bouton in layer 5/6 forms two asymmetric synapses with spines (sp). Scale bars, 0.5 μm.
Figure 7.
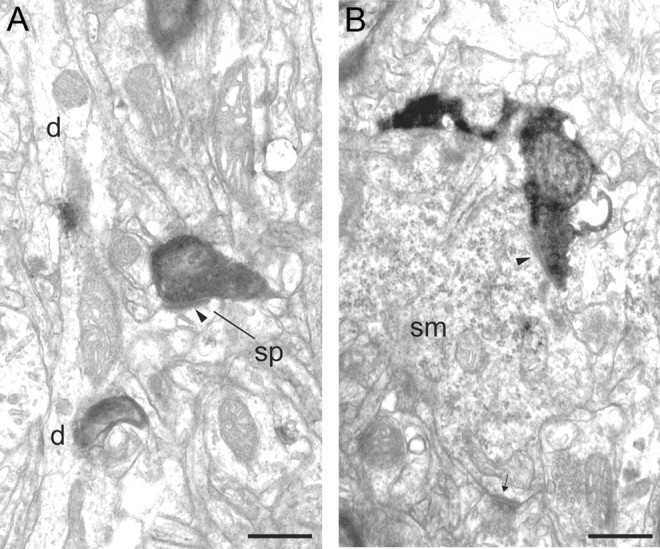
Electron micrographs of BDA-labeled boutons in layer 4 and 5/6 of area 46. A, A labeled bouton forms an asymmetric synapse (solid arrowhead) with a small spine (sp) in layer 4. The spine (sp) can be traced back to the parent dendrite (d). B, A labeled bouton forms an asymmetric synapse (solid arrowhead) with a neuronal soma (sm) in layer 5/6 that also forms a second asymmetric synapse (small arrow) with an unidentified bouton. The soma forms numerous asymmetric synapses and contains many perikaryal organelles and rough endoplasmic reticulum. These features are characteristic of neurons with smooth dendrites that are GABAergic. Scale bars, 0.5 μm.
Synaptic targets were identified using standard ultrastructural criteria (Peters et al., 1991). Serial sections through the bouton and its synaptic target assisted greatly in the identification of the target type. The majority of targets were spines (89%); the remainder were dendritic shafts, and only 1 soma. We reconstructed complete postsynaptic spines to discover whether they formed a second synapse, but following the thin spine neck back to its parent dendrite often proved impossible. Approximately 2% of the reconstructed spines received a second synapse from an unlabeled bouton. The second synapse was always identified as a symmetric (Gray's type 2) synapse. Dendrites often contained mitochondria or microtubules, making their identification relatively simple.
Layer 1 boutons were relatively easy to locate in V4, area 46, and LIP (Fig. 3; see Figs. 6A,B, 9A), as the axons often traversed the lamina horizontally. In layer 1 we examined 35 boutons in V4, 45 in area 46, and 40 in LIP. Spines were the most frequent target (V4, 86%; area 46, 96%; LIP, 93%). We pooled the boutons from layers 2 and 3 (Fig. 4). We selected 55 boutons from V4, 58 from area 46, and 53 from LIP. Samples from V4 and area 46 showed spines to be 92% of targets and in LIP, 89%. The remainder were dendritic shafts.
Figure 6.
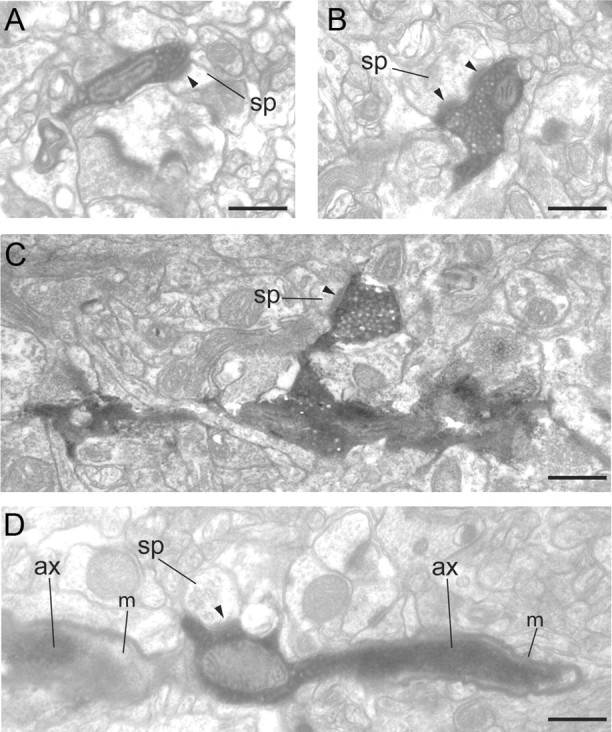
Electron micrographs of BDA-labeled axons and synaptic boutons in layers 1 and 2/3 of area 46. A, A labeled bouton forms an asymmetric synapse (solid arrowhead) with a small spine (sp) in layer 1. B, A labeled bouton forms a perforated asymmetric synapse (solid arrowheads) with a medium-sized spine (sp) in layer 1. C, A labeled bouton terminal forms an asymmetric synapse (solid arrowhead) with a small spine (sp) in layer 2/3. The labeled bouton can be traced back to the main axon. D, A labeled bouton en passant forms an asymmetric synapse (solid arrowhead) with a small spine (sp) in layer 2/3. The bouton forms part of the path of the labeled axon (ax) and emerges from an interruption in the myelin sheath (m). Scale bars, 0.5 μm.
Figure 9.
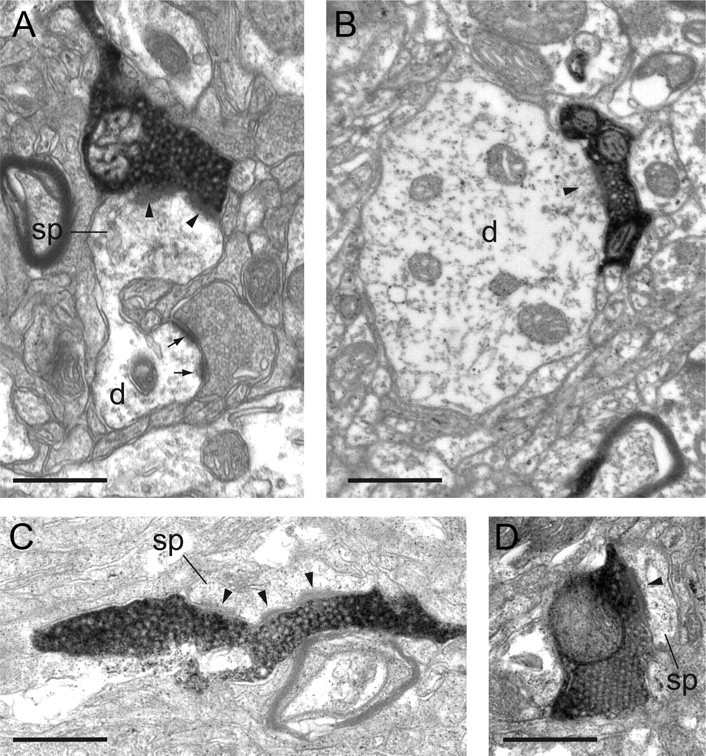
Electron micrographs of BDA-labeled boutons in layers 1, 2/3, 4, and 5/6 of area LIP. A, A labeled bouton of layer 1 forms an asymmetric synapse (solid arrowhead) with a large spine (sp) that can be followed back to the parent dendrite (d). B, A labeled bouton in layer 2/3 forms an asymmetric synapse (solid arrowhead) with a large-diameter dendritic shaft (d). The dendrite formed asymmetric synapses with unidentified boutons and contained numerous mitochondria. These features are characteristic of neurons with smooth dendrites and that are GABAergic. C, A slender, labeled bouton in layer 4 forms a perforated synapse (solid arrowhead) with a spine (sp). D, A vesicle-packed labeled bouton in layer 5/6 forms a synapse (solid arrowhead) with a spine (sp). Scale bars, 0.5 μm.
Figure 4.
Electron micrograph of BDA-labeled axon and boutons located in layer 2/3 of area V4. The boutons form asymmetric synapses (solid arrowheads) with spines (sp1 and sp2). One of the synapse-bearing spines (sp1) can be traced back to the large dendrite (d). The second spine (sp2) was not connected to the dendrite, and a third spine (sp3) just begins to emerge from the large dendrite (d). Scale bar, 0.5 μm.
Boutons in layer 4 proved more difficult to obtain than in other layers. The lamina was thin (∼100 μm) and made the accurate verification of the boutons' location critical in order not to misidentify the lamina location of the boutons. Only one animal provided boutons from layer 4 of V4 (Fig. 5A); the second animal provided no equivalent material in osmicated tissue. In the non-osmicated sections, a few axon collaterals could be seen that lay on the layer 3–4 border and passing through layer 4, but most were not bouton bearing. For the layer 4 samples, we sectioned 21 boutons (86% spines) from V4, 46 boutons from area 46 (96% spines) (see Fig. 7A), and 58 boutons from LIP (78% spines) (see Fig. 9).
It was also difficult to harvest boutons from layers 5 and 6, because the axons were very fine and scattered, sometimes more densely in layer 5 and sometimes more in layer 6. We examined 47 boutons from V4, 53 from area 46, and 44 from LIP (Fig. 5A; see Figs. 7B, 9). Spines were the predominant target, 92% in V4, 95% in area 46, and 81% in LIP. The only somatic synapse to be formed with a labeled bouton came from this sample, taken from area 46 (see Fig. 7B). All other synapses were formed with dendritic shafts (see Fig. 8). In FEF itself, we sampled boutons taken near somata labeled by the small iontophoretic injections. All 82 boutons we examined were located in layers 2 and 3. Spines were the predominant target (78%) and the remainder were dendritic shafts.
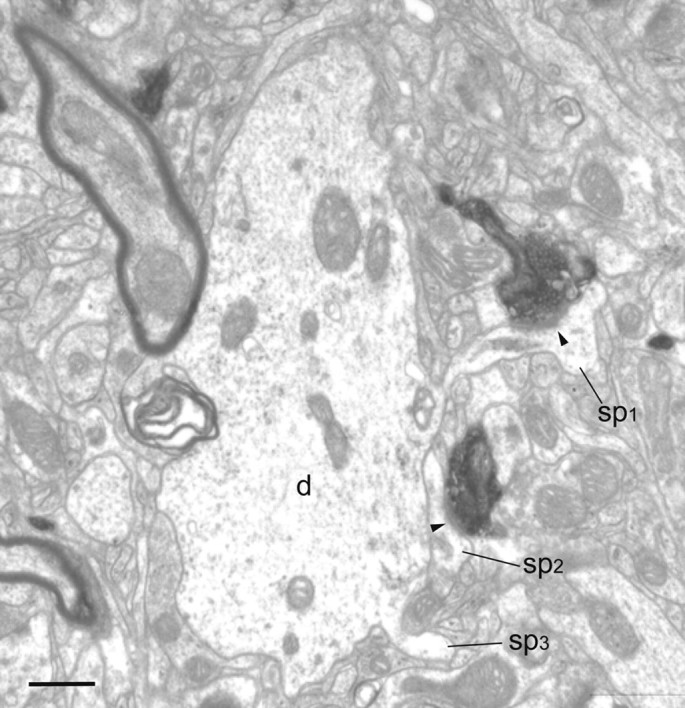
Figure 8.
Electron micrographs of a BDA-labeled bouton in layer 2/3 of area 46. The labeled bouton forms an asymmetric synapse (solid arrowhead) with a dendritic shaft (d). The dendrite was seen to contain numerous mitochondria and forms asymmetric synapses with unidentified boutons in subsequent sections. These features are characteristic of neurons with smooth dendrites that are GABAergic. Scale bar, 0.5 μm.
Axons of all areas were sometimes myelinated (Fig. 6D), and the largest caliber axons were up to 0.7 μm in diameter. The majority of myelinated axons were ∼0.5 μm in diameter, and regardless of diameter, most axons bore a 0.1-μm-thick sheath of myelin. The collaterals bearing boutons were very fine, and sometimes the label was intermittent in the finest axons (∼50 nm).
Spines
Serial sectioning and reconstruction helped with the identification of synaptic targets (see Fig. 10). We also used standard ultrastructural characteristics to classify targets (Peters et al., 1991). Spines could be identified by their small size; their heads often contained spine apparatus, and they were filled with pale and fluffy cytoplasm. The spine neck was often too thin and tortuous to follow for any distance, although occasionally it could be traced back to a parent dendrite (Figs. 3, 4, 7A; see Fig. 9A). Rarely did a spine form a second synapse, and when it did occur, it was always a symmetric synapse (Fig. 5A). The dual input spines constituted 2.5% of spines in V4, 2% of spines in area 46, and 3.5% in LIP. In the small iontophoretic injection sites in layer 2/3, 6.25% of spines showed dual input.
Figure 10.

A, LM reconstruction of axon shown in B. B, Three-dimensional reconstruction of BDA-labeled axon (red) in layer 2/3 of area V4 from serial ultrathin sections. The main trajectory of the axon is right to left and is roughly orthogonal to the radially aligned large-caliber dendrite (gray) (approximately 2 μm in diameter). The dendrite is spine bearing (also gray), and all reconstructed spines formed a synapse (green). At the point of intersection of the dendrite and the axon, the latter produces a flurry of mostly bouton terminals. Eleven of these labeled boutons form synapses with spines coming from the reconstructed dendrite. Ten more of the labeled boutons formed synapses with spines (data not shown) that could not be traced back to the large dendrite. One labeled bouton formed a synapse with a small dendrite and one formed no synapse. The large dendrite shows many features characteristic of the apical dendrite of a large pyramidal neuron. Scale bar (A): 12 μm.
Dendrites
Dendritic shafts represented only a small proportion of the synaptic targets: 13% in V4, 5% in area 46 (Fig. 8), 16% in LIP, and 22% in FEF. Typically, excitatory cells have spiny dendrites that contain few mitochondria and form few synapses on their dendritic shafts. In contrast, the dendrites of inhibitory cells are spine free or smooth, contain numerous mitochondria, and form relatively more synapses on the shaft. They may also have widely variable diameter over their length. Dendrites with these characteristics contain γ-aminobutyric acid (GABA) and are GABAergic (Somogyi et al., 1983; Peters and Saint Marie, 1984; Kisvárday et al., 1985; Ahmed et al., 1997). The majority of dendritic shafts were small in diameter (∼0.5 μm or less), and serial sections were usually required to characterize neurons as smooth or spiny. On the basis of the established criteria, most of the target dendritic shafts originated from smooth, putative GABAergic neurons. The dendritic shaft targets of intrinsic FEF synapses formed 13.4% (11 of 82) of all targets. Of these, 61% (11 of 18) were smooth and GABAergic in appearance. In area 46, all of the dendritic shafts (100%) were of smooth GABAergic neurons (4.8% of all targets), 22% in V4 (2.4% of all targets), and 55% in LIP (8.5% of all targets). One of the area 46 target dendrites of layer 1 forming multiple asymmetric shaft synapses also bore a synaptic spine. We have noted this unusual configuration previously among the profiles of layer 1, and this is probably a characteristic of GABAergic neurons of layer 1.
Somata
Only one synapse was formed with a soma, which was located in layer 5 of area 46 (Fig. 7B). Although the profile of the soma was very small in our series of sections (a section through the edge of the soma), there were enough features to classify the neuron as GABAergic. There were numerous asymmetric synapses formed with unidentified boutons, and the cytoplasm was filled with rough endoplasmic reticulum and perikaryal organelles, which are characteristic features of GABAergic neurons (Somogyi et al., 1983).
Postsynaptic density.
Reconstructing the boutons and their targets gave us the opportunity to measure the area of the complete PSD (see Fig. 11). We have used this technique previously to obtain values for the surface area of synapses (Anderson et el., 1998; Anderson and Martin, 2002, 2005, 2006, 2009). By focusing on the PSD rather than the presynaptic membrane, we avoided the difficulties that details might be obscured by the reaction end-product in the presynaptic bouton. Due to the small numbers of dendritic synapses, we confined our comparisons between the distributions of synaptic areas to synapses made by spines. There were relatively few significant differences seen between those spinous synapses made in different areas or different laminae. The range of synaptic areas on spines (∼0.07–0.13 μm2) was similar to those of previous studies of inter-areal connections (Anderson et al., 1998; Anderson and Martin, 2002, 2005, 2006, 2009). The areas of layer 1 PSDs were consistently the largest and those from layers 4 and 5/6 consistently the smallest. Within V4, PSD areas showed no significant laminar differences with the exception of layer 1 synapses (mean = 0.103 μm2, SEM = 0.012), which were larger (p = 0.09, two-tailed t test) than those of layer 4 (mean = 0.078 μm2, SEM = 0.007). In area 46, both layer 1 synapses (mean = 0.098 μm2, SEM = 0.008) and synapses located in layers 2 and 3 (mean = 0.082 μm2, SEM = 0.005) had significantly larger PSDs (p = 0.0005 and 0.04, respectively, two-tailed t test) than did synapses of layer 4 (mean = 0.067 μm2, SEM = 0.005). The PSDs of LIP synapses showed the most significant differences. Layer 1 PSDs were significantly larger (mean = 0.131 μm2, SEM = 0.014) than those of synapses in layers 2 and 3 (mean = 0.095 μm2, SEM = 0.007, p = 0.020), layer 4 (mean = 0.075 μm2, SEM = 0.007, p = 0.0006), and layer 5/6 (mean = 0.075 μm2, SEM = 0.005, p = 0.0004, two-tailed t test). PSDs from layer 2/3 were just significantly larger than those of layer 4 (p = 0.050, two-tailed t test) and layer 5/6 (p = 0.030, two-tailed t test). When comparing the PSD sizes of synapses between areas, the only significant difference came from the labeled synapses of layer 1 in LIP, which had slightly larger PSDs than those of area 46 (mean = 0.098 μm2, SEM = 0.002, p = 0.030, two-tailed t test). Labeled spine synapses from the two superficial layer iontophoretic injection sites showed no differences in PSD sizes and so were pooled (mean = 0.139 μm2, SEM = 0.012).
Figure 11.
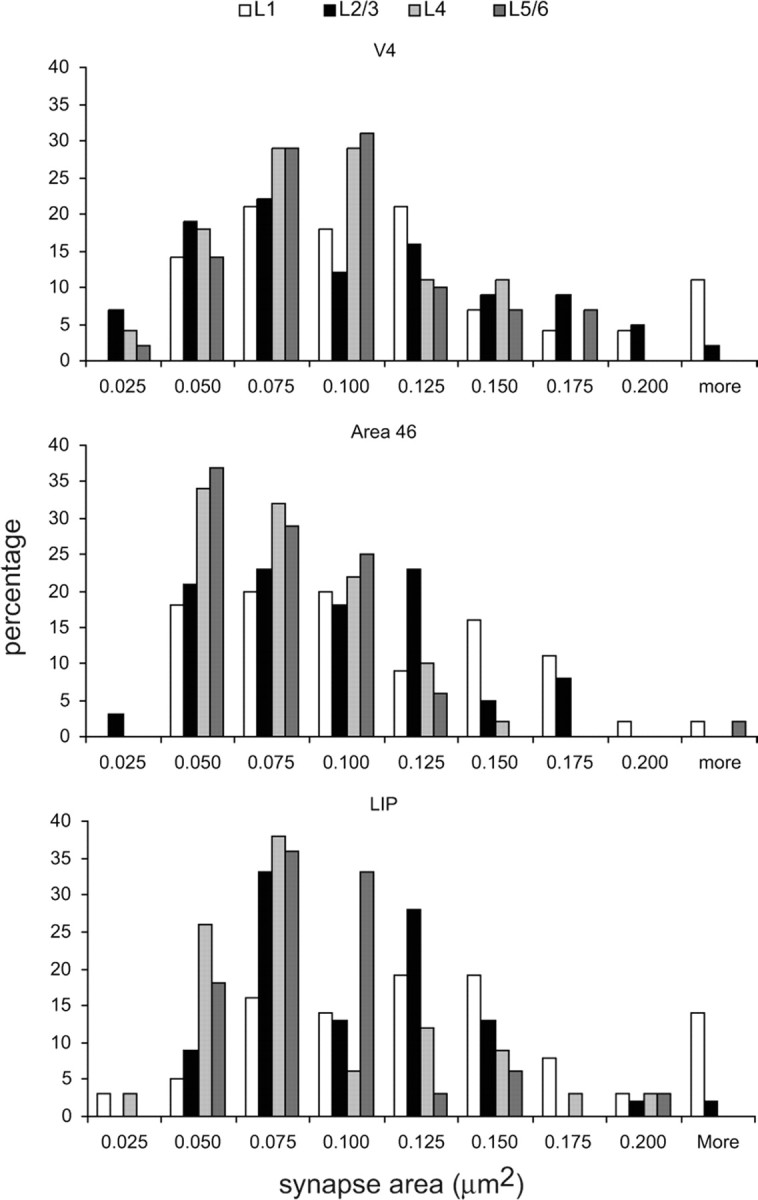
Histograms of the distribution of postsynaptic areas (μm2) formed with spines and labeled FEF boutons in layers 1, 2/3, 4, and 5/6 of areas V4, 46, and LIP.
Synapses formed with dendritic shafts were few and had consistently smaller PSDs (V4: 0.073 μm2, SEM = 0.015; area 46: 0.074 μm2, SEM = 0.006; LIP: 0.076 μm2, SEM = 0.010) than the spine synapses (V4: 0.089 μm2, SEM = 0.004; area 46: 0.09 μm2, 0.007; LIP: 0.095 μm2, SEM = 0.005). When pooled, the PSDs of dendritic synapses of V4, area 46, and LIP were not significantly different from one another. However, on target dendritic shafts of putative GABAergic cells (n = 11), the mean size of the PSDs (n = 36; 0.068 μm2, SEM = 0.006) formed by the FEF boutons was significantly larger than that of PSDs formed by unlabeled boutons on the same dendritic shafts (n = 39; 0.045 μm2, SEM = 0.003; Wilcoxon rank p = 0.003).
Viewed en face, the shape of the PSD was a simple disc, or doughnut, or horseshoe shaped. In single sections these latter synapses appear to be perforated. They were more frequently formed with spines than dendritic shafts (Fig. 6B). Similar observations were made in the study of synapses made by reciprocal V1 and V2 boutons, V1 and V2 afferent boutons in area MT, V2 afferent boutons in area V3A, and V4 afferent boutons in V2 (Anderson et al., 1998; Anderson and Martin, 2002, 2005, 2006, 2009).
Target types.
Spines were the dominant target in all layers and all areas (Figs. 3–7A, 9; see Fig. 12). A slightly higher proportion of spine synapses was found in area 46 (95%) than in V4 (89%), LIP (84%), or FEF (78%). Within each cortical area there were also differences in the proportion of synapses formed with spines and dendrites in respective laminae. The range of numbers of spine synapses across different laminae was 92–96% for area 46, 84–92% for V4, and 78–93% for LIP. The remaining targets were dendritic shafts. Of these, smooth GABAergic neurons provided the majority of the dendritic shaft targets in LIP (55%) and FEF (61%), respectively, all of those in area 46 (Fig. 8), and 22% of those in V4.
Figure 12.
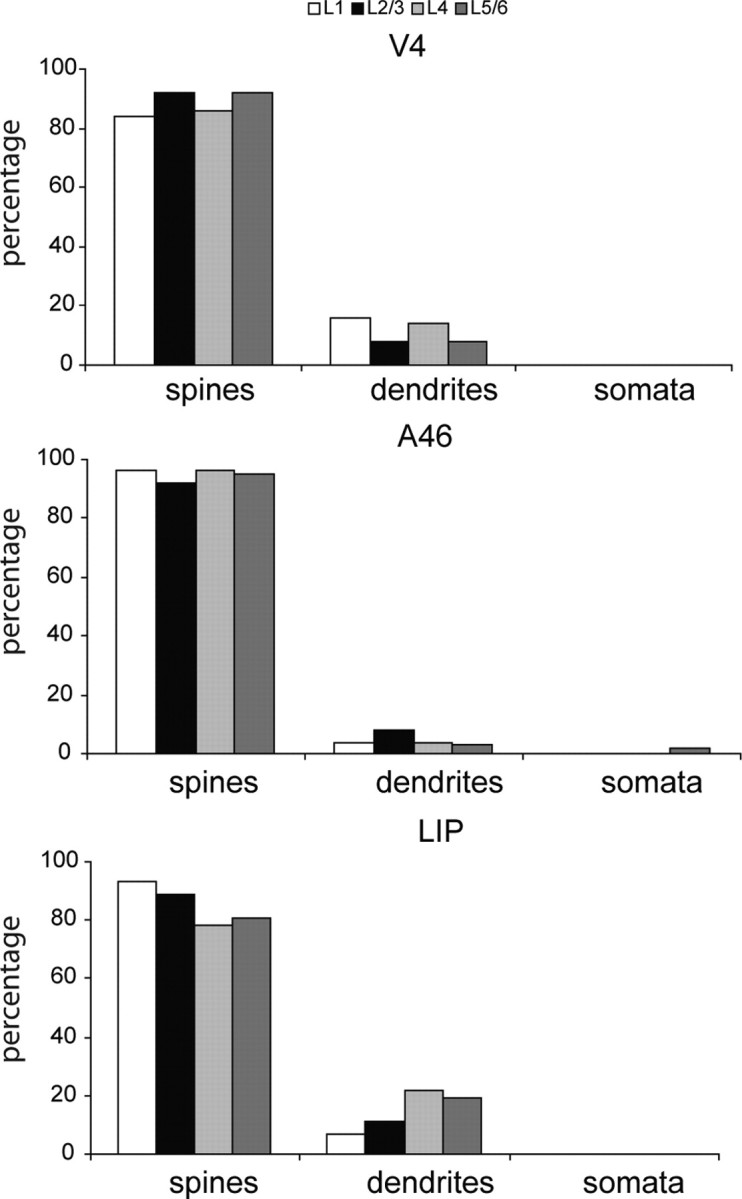
Histograms of the synaptic targets of labeled FEF boutons in layers 1, 2/3, 4, and 5/6 of areas V4 (147 spines, 19 dendrites), 46 (190 spines, 10 dendrites, 1 soma), and LIP (169 spines, 31 dendrites).
Serial reconstructions indicated that most boutons made only one synapse and only rarely made two or more synapses (Fig. 5B; see Fig. 13). On average, there were 1.05 synapses per labeled bouton, both for V4 and area 46, and 1.03 in LIP. Exceptionally, a bouton might form three or even four synapses, each on a different target dendrite. A single bouton that formed four synapses was found in layer 5/6 of area 46. The multisynaptic boutons tended to have larger than average diameters, up to 1 μm.
Figure 13.

Histogram of the number of synapses formed per labeled FEF bouton in layers 1, 2/3, 4, and 5/6 of areas V4, 46, and LIP.
We have rarely encountered multiple synapses formed on a target dendrite by the same axon. This may be simply due to the short lengths of dendrite that can be followed in serial electron microscopy. However, from detailed LM observations, we identified one possible multisynaptic configuration. In the light microscope we followed an unbranched axon, which passed through layer 2/3 of V4, covering a distance of ∼400 μm within a single section and showing few features, other than the occasional bouton terminal. At one point, however, it produced a spray of fine bouton terminals over a very limited length of axon (11 μm). At the EM level, the cluster of labeled boutons was found to form synapses with 21 spines and one small-diameter dendrite. One bouton did not form a synapse (Fig. 10). Eleven target spines were followed back to a large-diameter (∼2 μm), radially oriented dendrite. The dendrite contained many microtubules and few mitochondria, and formed numerous synaptic spines and very few dendritic shaft synapses, but it could not be traced back to a parent soma. These ultrastructural features are characteristic of the apical dendrite of a large layer 3 or layer 5 pyramidal cell (Fig. 10).
Synaptic density measurement
Using the RESORS method (da Costa et al., 2009), we estimated the relative proportion of labeled synapses in LIP that appeared to be the most densely innervated region we found after a tracer injection in FEF. We developed this method to estimate accurately synapse numbers when they were sparsely distributed. Previously, we sampled from an area that contained a labeled synapse, which we recognized biased our sampling procedure. Without this priming, however, we counted no labeled synapses with standard physical dissector sampling. Using RESORS, this bias is removed. We sampled at random from many (∼1000) small sites in layers 1 and 2 of LIP in one animal. We estimated that only 0.16% of synapses in layer 1 were formed by labeled boutons, despite the fact that in the light microscope it appeared as the most densely labeled layer of LIP. In layer 2, the next most densely innervated layer, this value fell to 0.04%.
Discussion
We have investigated the hypothesis that the attentional signal from area 8A, or FEF, is transmitted by a monosynaptic connection from FEF neurons selectively to GABAergic neurons in areas 46, V4, and LIP. This hypothesis was originally proposed to account for the observation that during attention, fast-spiking neurons of areas V4 and 46 increase their firing relative to regular-spiking neurons. Since the fast-spiking neurons are thought to be putative GABAergic neurons of the parvalbumin subtype (Mitchell et al., 2007), this selective activation of inhibition is consistent with normalization models of attention, which rely on divisive inhibition (Reynolds and Heeger, 2009), and with attention-dependent response synchronization due to fast inhibition (Fries et al., 2001). However, our data do not support the hypothesis that FEF has private lines to the inhibitory circuits of its target areas. The data that led us to this conclusion are as follows.
FEF projections excite mainly pyramidal cells in areas 46, V4, and LIP
Our data indicate that FEF connects predominantly to pyramidal cells in areas 46, V4, and LIP. The neurons of FEF that project to V4, area 46, and LIP provide input to both superficial and deep layer pyramidal cells. If anything, more spines are targeted (89% in V4, 95% in area 46, 84% in LIP) than for most other pathways we have examined (V1 to MT, 54%; V2 to MT, 67%; V2 to V3a, 76%; V4 to V2, V1 to V2, 72%; V2 to V1 84%; Anderson et al., 1998; Anderson and Martin, 2002, 2005, 2006, 2009; see also Rockland, 1997). Apart from one soma, the dendritic shafts of smooth (putative GABAergic) and spiny neurons make up the remaining targets of the FEF projection in roughly equal proportion.
Significance of laminar specificity
Attentional signals are particularly prominent in V4, influencing 73% of recorded neurons according to the recent study by Buffalo et al. (2010). FEF afferents are unusual in forming synapses in all layers of V4. In addition, retrograde tracer studies show that the projection from FEF to V4 arises mainly from superficial layer cells, not the deep layer cells typically associated with “feedback” projections (Barone et al., 2000; Pouget et al., 2009; Markov et al., 2011). The FEF projection connections could excite neurons weakly to provide a stochastic resonance-like mechanism that biases the local circuits for top-down versus bottom-up saliency (Baluch and Itti, 2011).
One difficulty with any explanation is quantitative: our previous estimates of inter-areal bouton density indicated that they contribute only 2–6% of excitatory synapses in their densest patches of innervation (Anderson and Martin, 2002, 2005, 2006). This is already low, but because we were able to eliminate the sampling bias acknowledged in our previous studies (da Costa et al., 2009), we find here that the unbiased densities are even lower, <0.16% of excitatory synapses. This weak input to V4 is consistent with the “weight” measured in terms of the number of FEF neurons that contribute to the V4 projection. This weight value is several orders of magnitude lower than that seen for the heaviest cortical input and the thalamic input to V1 (Markov et al., 2011). Such low values imply that the number of synapses FEF contributes to any target neuron is probably in single digits. The question, then, is how the FEF projections come to be at all effective.
Amplification via recurrent circuits?
The minimal excitatory input from FEF might be amplified by local recurrent circuits in much the same way that the small thalamic input is amplified in visual cortex. We found evidence for such recurrent circuits within FEF itself, where pyramidal cells connect mainly with other pyramidal cells (87%), the remaining 13% of synapses being with GABAergic neurons. This ratio is typical of local cortical circuits: the sole exception is for area 9 of macaque prefrontal cortex, where Melchitzky et al. (2001) reported that pyramidal cells divide their local output equally between spines and GABAergic dendrites.
Recurrent circuits of excitatory and inhibitory neurons can readily be configured to express a rich palette of computational primitives, including amplification, signal restoration, and decision-making (Douglas and Martin, 2004, 2007). Our biologically based model of FEF microcircuits (Heinzle et al., 2007) exploits some of these computational primitives to compute a saliency map in the middle layers and an attentional signal in the superficial layers (whose pyramidal neurons provide the major output to areas 46, LIP, and V4; Markov et al., 2011). Recent recordings from FEF by Cohen et al. (2010) indicated that there is an increased interaction between pairs of cells that are involved in the attentional selection of a target embedded in distractors. Their data are consistent with a soft winner-take-all operation in which excitation between neurons with similar parameter preferences is amplified, and those with dissimilar or competing preferences are suppressed by inhibition (Douglas and Martin, 2004).
The role of these local circuits also goes some way to explain the mismatch in the latency to the attention-driven changes. We found that the FEF afferents were myelinated, even in the gray matter, and thus the conduction time from FEF to V4, the most caudal area we examined, is probably 10–20 ms, in agreement with indirect estimates of 8–13 ms (Gregoriou et al., 2009), whereas the latencies of attention are an order of magnitude longer (Buffalo et al., 2010). The explanation for this is probably the time for recurrent processing in local circuits (Baluch and Itti, 2011).
Amplification by synapse strength?
The postsynaptic densities formed between FEF afferents and the smooth dendrites of putative GABAergic neurons were larger than the unlabeled asymmetric synapses formed on the same smooth dendrites, albeit smaller than FEF synapses formed with spines. The unlabeled asymmetric synapses, which were much more numerous, presumably originated mainly from the recurrent collaterals of local pyramidal cells (Binzegger et al., 2004; Markov et al., 2011). We assume that larger postsynaptic densities correlate with physiological strength, so the larger synapses on GABAergic dendrites may partially compensate for the tiny number of synapses delivered to V4 by FEF.
We found that synapses in the superficial layers were consistently larger than those of layers 4, 5, and 6, although this difference was only significant in the case of LIP. The smallest synapses were those in layer 4, though not significantly so. The largest synapses were formed in layer 1, which might indicate that FEF input to the pyramidal cells' apical tufts in layer 1 evoke larger EPSPs than synapses in other layers.
Amplification by apical dendrites?
The FEF afferents form synapses with the apical dendrites of pyramidal cells, and it is possible that this input is amplified by an active calcium conductance in the apical dendrites of pyramidal cells (Larkum and Zhu, 2002; Larkum et al., 2007). Our data also indicated the existence, albeit rare, of a highly focused, multiple synaptic innervation, as revealed by the 11 excitatory inputs from a single labeled axon to one small region of a putative apical dendrite in layer 2/3 of V4. It may be that this focused input to the main shaft of the apical dendrite is also “just enough” (Douglas and Martin, 2007) to have a consequence on spike output. Certainly, the probability of activating downstream neurons (Moore and Fallah, 2004; Armstrong et al., 2006; Armstrong and Moore, 2007) or BOLD signal (Ruff et al., 2006) is increased by the highly synchronized FEF output evoked by electrical or magnetic stimulation, which effectively produces attention-like changes in neuronal activity. However, Ekstrom et al. (2008) claim that the top-down modulation only acts if there is also bottom-up activity.
Circuits of attention
To explain the effects of FEF on attention, there are two competing ideas. One is that attention increases the signal-to-noise ratio (Tolhurst et al., 1983; McAdams and Maunsell, 1999; for review, see Salinas and Sejnowski, 2001; Reynolds and Heeger, 2009; Baluch and Itti, 2011), which could be achieved if the FEF neurons synchronize their output and drive their target inhibitory neurons more strongly and with less variance (Mitchell et al., 2007). The other idea is that the attentional signal reduces the correlation in the firing of the target neurons (Cohen and Maunsell, 2009; Mitchell et al., 2009), thus allowing the independent noise contributed by individual neurons to be averaged out. In the first case, the prediction is that the inhibitory neurons are more active in reducing background noise. In the second case, where there is decreased noise correlation, the prediction is that the inhibitory influence is reduced (Cohen and Maunsell, 2009). Could we reconcile these functional data with our structural data by supposing that FEF drives selectively a disinhibitory circuit in V4? The answer is no, for the reason that our structural data indicate that most of the targets of the FEF projection are pyramidal cells, whereas the functional data indicate that the principal change in firing during attention occurs selectively in putative inhibitory neurons (Mitchell et al., 2007). These yet unresolved puzzles indicate how incomplete our understanding is of the wiring of the inter- and intra-areal circuits that form the “pathways of attention.”
Footnotes
We acknowledge the support of the European Union; Daisy Grant FP6-2005-015803 (to H.K. and K.A.C.M.) and Swiss National Science Foundation, National Centres of Competence in Research Grant “Neuroplasticity and Repair” (to K.A.C.M.). We thank Rita Bopp, German Köstinger, Pascale Giroud, and Nuno da Costa for expert technical assistance.
References
- Ahmed B, Anderson JC, Martin KAC, Nelson JC. Map of the synapses onto layer 4 basket cells of the primary visual cortex of the cat. J Comp Neurol. 1997;380:230–242. [PubMed] [Google Scholar]
- Anderson JC, Martin KAC. Connection from cortical area V2 to MT in macaque monkey. J Comp Neurol. 2002;443:56–70. doi: 10.1002/cne.10100. [DOI] [PubMed] [Google Scholar]
- Anderson JC, Martin KAC. Connection from cortical area V2 to V3A in macaque monkey. J Comp Neurol. 2005;488:320–330. doi: 10.1002/cne.20580. [DOI] [PubMed] [Google Scholar]
- Anderson JC, Martin KAC. Synaptic connection from cortical area V4 to V2 in macaque monkey. J Comp Neurol. 2006;495:709–721. doi: 10.1002/cne.20914. [DOI] [PubMed] [Google Scholar]
- Anderson JC, Martin KAC. The synaptic connections between cortical areas V1 and V2 in macaque monkey. J Neurosci. 2009;29:11283–11293. doi: 10.1523/JNEUROSCI.5757-08.2009. [DOI] [PMC free article] [PubMed] [Google Scholar]
- Anderson JC, Binzegger T, Martin KAC, Rockland KS. The connection from cortical area V1 to V5: A light and electron microscopic study. J Neurosci. 1998;18:10525–10540. doi: 10.1523/JNEUROSCI.18-24-10525.1998. [DOI] [PMC free article] [PubMed] [Google Scholar]
- Armstrong KM, Moore T. Rapid enhancement of visual cortical response discriminability by microstimulation of the frontal eye field. Proc Natl Acad Sci U S A. 2007;104:9499–94504. doi: 10.1073/pnas.0701104104. [DOI] [PMC free article] [PubMed] [Google Scholar]
- Armstrong KM, Fitzgerald JK, Moore T. Changes in visual receptive fields with microstimulation of frontal cortex. Neuron. 2006;50:791–798. doi: 10.1016/j.neuron.2006.05.010. [DOI] [PubMed] [Google Scholar]
- Balan PF, Ferrera VP. Effects of gaze shifts on maintenance of spatial memory in macaque frontal eye field. J Neurosci. 2003;23:5446–5454. doi: 10.1523/JNEUROSCI.23-13-05446.2003. [DOI] [PMC free article] [PubMed] [Google Scholar]
- Baluch F, Itti L. Mechanisms of top-down attention. Trends Neurosci. 2011;34:210–224. doi: 10.1016/j.tins.2011.02.003. [DOI] [PubMed] [Google Scholar]
- Barbas H, Mesulam MM. Organization of afferent input to subdivisions of area 8 in the rhesus monkey. J Comp Neurol. 1981;200:407–431. doi: 10.1002/cne.902000309. [DOI] [PubMed] [Google Scholar]
- Barbas H, Pandya DN. Architecture and intrinsic connections of the prefrontal cortex in the rhesus monkey. J Comp Neurol. 1989;286:353–375. doi: 10.1002/cne.902860306. [DOI] [PubMed] [Google Scholar]
- Barone P, Batardiere A, Knoblauch K, Kennedy H. Laminar distribution of neurons in extrastriate areas projecting to visual areas V1 and V4 correlates with the hierarchical rank and indicates the operation of a distance rule. J Neurosci. 2000;20:3263–3281. doi: 10.1523/JNEUROSCI.20-09-03263.2000. [DOI] [PMC free article] [PubMed] [Google Scholar]
- Binzegger T, Douglas RJ, Martin KAC. A quantitative map of the circuit of cat primary visual cortex. J Neurosci. 2004;24:8441–8453. doi: 10.1523/JNEUROSCI.1400-04.2004. [DOI] [PMC free article] [PubMed] [Google Scholar]
- Buffalo EA, Fries P, Landman R, Liang H, Desimone R. A backward progression of attentional effects in the ventral stream. Proc Natl Acad Sci U S A. 2010;107:361–365. doi: 10.1073/pnas.0907658106. [DOI] [PMC free article] [PubMed] [Google Scholar]
- Buschman TJ, Miller EK. Serial, covert shifts of attention during visual search are reflected by the frontal eye fields and correlated with population oscillations. Neuron. 2009;63:386–396. doi: 10.1016/j.neuron.2009.06.020. [DOI] [PMC free article] [PubMed] [Google Scholar]
- Clavagnier S, Falchier A, Kennedy H. Long-distance feedback projections to area V1: implications for multimodal integration, spatial awareness and visual consciousness. Cogn Affect Behav Neurosci. 2004;4:117–126. doi: 10.3758/cabn.4.2.117. [DOI] [PubMed] [Google Scholar]
- Cohen HR, Maunsell JH. Attention improves performance primarily by reducing interneuronal correlations. Nat Neurosci. 2009;12:1594–1600. doi: 10.1038/nn.2439. [DOI] [PMC free article] [PubMed] [Google Scholar]
- Cohen JY, Crowder EA, Heitz RP, Subraveti CR, Thompson KG, Woodman GF, Schall JD. Cooperation and competition among frontal eye field neurons during visual target selection. J Neurosci. 2010;30:3227–3238. doi: 10.1523/JNEUROSCI.4600-09.2010. [DOI] [PMC free article] [PubMed] [Google Scholar]
- da Costa NM, Hepp K, Martin KAC. A systematic random sampling scheme optimized to detect the proportion of rare synapses in the neuropil. J Neurosci Methods. 2009;180:77–81. doi: 10.1016/j.jneumeth.2009.03.001. [DOI] [PubMed] [Google Scholar]
- Douglas RJ, Martin KAC. Neuronal circuits of the neocortex. Annu Rev Neurosci. 2004;27:419–451. doi: 10.1146/annurev.neuro.27.070203.144152. [DOI] [PubMed] [Google Scholar]
- Douglas RJ, Martin KAC. Mapping the matrix: The ways of neocortex. Neuron. 2007;56:226–238. doi: 10.1016/j.neuron.2007.10.017. [DOI] [PubMed] [Google Scholar]
- Ekstrom LB, Roelfsema PR, Arsenault JT, Bonmassar G, Vanduffel W. Bottom-up dependent gating of frontal signals in early visual cortex. Science. 2008;321:414–417. doi: 10.1126/science.1153276. [DOI] [PMC free article] [PubMed] [Google Scholar]
- Ferrera VP, Yanike M, Cassanello C. Frontal eye field neurons signal changes in decision criteria. Nat Neurosci. 2009;12:1458–1462. doi: 10.1038/nn.2434. [DOI] [PMC free article] [PubMed] [Google Scholar]
- Ferrier D. The localization of function in the brain. Proc R Soc Lond Biol Ser B. 1874;22:229–232. [Google Scholar]
- Fiala JC. Reconstruct: a free editor for serial section microscopy. J Microsc. 2005;218:52–61. doi: 10.1111/j.1365-2818.2005.01466.x. [DOI] [PubMed] [Google Scholar]
- Fries P, Reynolds JH, Rorie AE, Desimone R. Modulation of oscillatory neuronal synchronization by selective visual attention. Science. 2001;291:1560–1563. doi: 10.1126/science.1055465. [DOI] [PubMed] [Google Scholar]
- Goldberg ME, Bushnell MC. Behavioral enhancement of visual responses in monkey cerebral cortex. II. Modulation in frontal eye fields specifically related to saccades. J Neurophysiol. 1981;46:773–787. doi: 10.1152/jn.1981.46.4.773. [DOI] [PubMed] [Google Scholar]
- Gregoriou GG, Gotts SJ, Zhou H, Desimone R. High-frequency, long-range coupling between prefrontal and visual cortex during attention. Science. 2009;324:1207–1210. doi: 10.1126/science.1171402. [DOI] [PMC free article] [PubMed] [Google Scholar]
- Heinzle J, Hepp K, Martin KAC. A microcircuit model of the frontal eye fields. J Neurosci. 2007;27:9341–9353. doi: 10.1523/JNEUROSCI.0974-07.2007. [DOI] [PMC free article] [PubMed] [Google Scholar]
- Huerta MF, Krubitzer LA, Kaas JH. Frontal eye field as defined by intracortical microstimulation in squirrel monkeys, owl monkeys, and macaque monkeys. II. Cortical connections. J Comp Neurol. 1987;265:332–361. doi: 10.1002/cne.902650304. [DOI] [PubMed] [Google Scholar]
- Hussar CR, Pasternak T. Flexibility of sensory representations in prefrontal cortex depends on cell type. Neuron. 2009;10:730–743. doi: 10.1016/j.neuron.2009.11.018. [DOI] [PMC free article] [PubMed] [Google Scholar]
- Kayser C, Logothetis N. Vision: stimulating your attention. Curr Biol. 2006;16:R581–R583. doi: 10.1016/j.cub.2006.07.009. [DOI] [PubMed] [Google Scholar]
- Kisvárday ZF, Martin KAC, Whitteridge D, Somogyi P. Synaptic connections of intracellularly filled clutch neurons, a type of small basket neuron in the visual cortex of the cat. J Comp Neurol. 1985;241:111–137. doi: 10.1002/cne.902410202. [DOI] [PubMed] [Google Scholar]
- Larkum ME, Zhu JJ. Signaling of layer 1 and whisker evoked Ca2+ and Na + action potentials in distal and terminal dendrites of neocortical pyramidal neurons in vitro and in vivo. J Neurosci. 2002;22:6991–7005. doi: 10.1523/JNEUROSCI.22-16-06991.2002. [DOI] [PMC free article] [PubMed] [Google Scholar]
- Larkum ME, Waters J, Sakmann B, Helmchen F. Dendritic spikes in apical dendrites of neocortical layer 2/3 pyramidal neurons. J Neurosci. 2007;27:8999–9008. doi: 10.1523/JNEUROSCI.1717-07.2007. [DOI] [PMC free article] [PubMed] [Google Scholar]
- Lennert T, Martinez-Trujillo J. Strength of response suppression to distracter stimuli determines attentional-filtering performance in primate prefrontal neurons. Neuron. 2011;70:141–152. doi: 10.1016/j.neuron.2011.02.041. [DOI] [PubMed] [Google Scholar]
- Luck SJ, Chelazzi L, Hillyard SA, Desimone R. Neural mechanisms of spatial selective attention in areas V1, V2, and V4 of macaque visual cortex. J Neurophysiol. 1997;77:24–42. doi: 10.1152/jn.1997.77.1.24. [DOI] [PubMed] [Google Scholar]
- Markov NT, Misery P, Falchier A, Lamy C, Vezoli J, Quilodran R, Gariel MA, Giroud P, Ercsey-Ravasz M, Pilaz LJ, Huissoud C, Barone P, Dehay C, Toroczkai Z, Van Essen DC, Kennedy H, Knoblauch K. Weight consistency specifies regularities of macaque cortical networks. Cereb Cortex. 2011;21:1254–1272. doi: 10.1093/cercor/bhq201. [DOI] [PMC free article] [PubMed] [Google Scholar]
- McAdams CJ, Maunsell JH. Effects of attention on the reliability of individual neurons in monkey visual cortex. Neuron. 1999;23:765–773. doi: 10.1016/s0896-6273(01)80034-9. [DOI] [PubMed] [Google Scholar]
- McAdams CJ, Maunsell JH. Attention to both space and feature modulates neuronal responses in macaque area V4. J Neurophysiol. 2000;83:1751–1755. doi: 10.1152/jn.2000.83.3.1751. [DOI] [PubMed] [Google Scholar]
- Melchitzky DS, González-Burgos G, Barrionuevo G, Lewis DA. Synaptic targets of the intrinsic axon collaterals of supragranular pyramidal neurons in monkey prefrontal cortex. J Comp Neurol. 2001;430:209–221. doi: 10.1002/1096-9861(20010205)430:2<209::aid-cne1026>3.0.co;2-#. [DOI] [PubMed] [Google Scholar]
- Mitchell JF, Sundberg KA, Reynolds JH. Differential attention-dependent response modulation across cell classes in macaque visual area V4. Neuron. 2007;55:131–141. doi: 10.1016/j.neuron.2007.06.018. [DOI] [PubMed] [Google Scholar]
- Mitchell JF, Sundberg KA, Reynolds JH. Spatial attention decorrelates intrinsic activity fluctuations in macaque area V4. Neuron. 2009;63:879–888. doi: 10.1016/j.neuron.2009.09.013. [DOI] [PMC free article] [PubMed] [Google Scholar]
- Moore T, Fallah M. Control of eye movements and spatial attention. Proc Natl Acad Sci U S A. 2001;98:1273–1276. doi: 10.1073/pnas.021549498. [DOI] [PMC free article] [PubMed] [Google Scholar]
- Moore T, Fallah M. Microstimulation of the frontal eye field and its effects on covert spatial attention. J Neurophysiol. 2004;91:152–162. doi: 10.1152/jn.00741.2002. [DOI] [PubMed] [Google Scholar]
- Peters A, Saint Marie RL. Smooth and sparsely spinous non-pyramidal cells forming local axonal plexuses. In: Jones EG, Peters A, editors. Cerebral cortex, Vol 1, Cellular components of the cerebral cortex. New York: Plenum; 1984. pp. 419–445. [Google Scholar]
- Peters A, Palay SL, Webster HDeF. Ed 3. New York: Oxford OUP; 1991. The fine structure of the nervous system: neurons and their supporting cells. [Google Scholar]
- Pouget P, Stepniewska I, Crowder EA, Leslie MW, Emeric EE, Nelson MJ, Schall JD. Visual and motor connectivity and the distribution of calcium-binding proteins in macaque frontal eye field: implications for saccade target selection. Front Neuroanat. 2009;3:2. doi: 10.3389/neuro.05.002.2009. [DOI] [PMC free article] [PubMed] [Google Scholar]
- Reynolds JH, Heeger DJ. The normalization model of attention. Neuron. 2009;61:168–185. doi: 10.1016/j.neuron.2009.01.002. [DOI] [PMC free article] [PubMed] [Google Scholar]
- Reynolds JH, Chelazzi L, Desimone R. Competitive mechanisms subserve attention in macaque areas V2 and V4. J Neurosci. 1999;19:1736–1753. doi: 10.1523/JNEUROSCI.19-05-01736.1999. [DOI] [PMC free article] [PubMed] [Google Scholar]
- Reynolds JH, Pasternak T, Desimone R. Attention increases sensitivity of V4 neurons. Neuron. 2000;26:703–714. doi: 10.1016/s0896-6273(00)81206-4. [DOI] [PubMed] [Google Scholar]
- Robinson DA, Fuchs AF. Eye movement evoked by stimulation of frontal eye fields. J Neurophysiol. 1969;32:637–648. doi: 10.1152/jn.1969.32.5.637. [DOI] [PubMed] [Google Scholar]
- Rockland KS. Elements of cortical hierarchy revisited. In: Rockland KS, Kaas JH, Peters A, editors. Cerebral cortex, Vol 12, Extrastriate cortex in primates. New York: Plenum; 1997. pp. 243–293. [Google Scholar]
- Ruff CC, Blankenburg F, Bjoertomt O, Bestmann S, Freeman E, Haynes JD, Rees G, Josephs O, Deichmann R, Driver J. Concurrent TMS-fMRI and psychophysics reveal frontal influences in human retinotopic visual cortex. Curr Biol. 2006;16:1479–1488. doi: 10.1016/j.cub.2006.06.057. [DOI] [PubMed] [Google Scholar]
- Saleem KS, Logothetis NK. The rhesus monkey brain in stereotaxic coordinates. New York: Elsevier Academic; 2007. [Google Scholar]
- Salinas E, Sejnowski TJ. Correlated neuronal activity and the flow of neural information. Nat Rev Neurosci. 2001;2:539–550. doi: 10.1038/35086012. [DOI] [PMC free article] [PubMed] [Google Scholar]
- Schiller PH, True SD, Conway JL. Effects of frontal eye field and superior colliculus ablations on eye movements. Science. 1979;206:590–592. doi: 10.1126/science.115091. [DOI] [PubMed] [Google Scholar]
- Somogyi P, Kisvárday ZF, Martin KAC, Whitteridge D. Synaptic connections of morphologically identified and physiologically characterized large basket cells in the striate cortex of cat. Neuroscience. 1983;10:261–294. doi: 10.1016/0306-4522(83)90133-1. [DOI] [PubMed] [Google Scholar]
- Stanton GB, Bruce CJ, Goldberg ME. Topography of projections to posterior cortical areas from the macaque frontal eye fields. J Comp Neurol. 1995;353:291–305. doi: 10.1002/cne.903530210. [DOI] [PubMed] [Google Scholar]
- Stanton GB, Friedman HR, Dias EC, Bruce CJ. Cortical afferents to the smooth-pursuit region of the macaque monkey's frontal eye field. Exp Brain Res. 2005;165:179–192. doi: 10.1007/s00221-005-2292-z. [DOI] [PubMed] [Google Scholar]
- Tolhurst DJ, Movshon JA, Dean AF. The statistical reliability of signals in single neurons in cat and monkey visual cortex. Vision Res. 1983;23:775–785. doi: 10.1016/0042-6989(83)90200-6. [DOI] [PubMed] [Google Scholar]