

Abstract
Variability of evoked single-trial responses despite constant input or task is a feature of large-scale brain signals recorded by fMRI. Initial evidence signified relevance of fMRI signal variability for perception and behavior. Yet the underlying intrinsic neuronal sources have not been previously substantiated. Here, we address this issue using simultaneous EEG–fMRI and real-time classification of ongoing alpha-rhythm states triggering visual stimulation in human subjects. We investigated whether spontaneous neuronal oscillations—as reflected in the posterior alpha rhythm—account for variability of evoked fMRI responses. Based on previous work, we specifically hypothesized linear superposition of fMRI activity related to fluctuations of ongoing alpha rhythm and a visually evoked fMRI response. We observed that spontaneous alpha-rhythm power fluctuations largely explain evoked fMRI response variance in extrastriate, thalamic, and cerebellar areas. For extrastriate areas, we confirmed the linear superposition hypothesis. We hence linked evoked fMRI response variability to an intrinsic rhythm's power fluctuations. These findings contribute to our conceptual understanding of how brain rhythms can account for trial-by-trial variability in stimulus processing.
Introduction
Pronounced trial-to-trial variability is a universal feature of evoked responses across different species and recording modalities. Invasive animal recordings indicate evoked-response variance to be explained by neuronal background activity superimposed on fixed evoked responses (Arieli et al., 1996). In case of motor fMRI, fluctuating coherent background fMRI activity—constituting resting-state networks (Biswal et al., 1995; Raichle et al., 2001; Greicius et al., 2003; Beckmann et al., 2005)—linearly superimposes evoked responses (Fox et al., 2006), explaining much of the trial-by-trial variance. Since fMRI provides indirect measures of neuronal activity, it is unclear whether fluctuating signal parts reflect intrinsic neuronal activity. The fact of behavior and perception being comodulated with ongoing fMRI activity (Fox et al., 2007; Hesselmann et al., 2008) makes non-neuronal sources, e.g., respiration or heartbeat, seem unlikely (Birn, 2007); however, a proof for neuronal sources has not been previously provided.
Thus, while variations of evoked neuronal responses are explained by intrinsic neuronal-signal fluctuations and variations of evoked vascular (fMRI) responses by intrinsic vascular-signal fluctuations, the key question remains how fluctuations of the vascular-evoked fMRI-response are related to ongoing fluctuations in the neuronal domain. Although tight links between evoked neuronal activity and fMRI signal changes (Logothetis et al., 2001) and between spontaneous coherent fMRI signal fluctuations and intrinsic EEG rhythms (Mantini et al., 2007) exist, there has been no data available [with the single exception of a recent study by Scheeringa et al. (2011)] linking variability of fMRI stimulus responses to intrinsic neuronal signal amplitudes—the latter being noninvasively assessable by EEG. Hence, we used EEG–fMRI simultaneously (Ritter and Villringer, 2006; Laufs et al., 2008) to investigate neuronal underpinnings of evoked fMRI response variability.
In EEG, ongoing activity is related to variability of evoked responses. For example, the posterior alpha (8–12 Hz) rhythm covaries with features of the visual evoked potential (VEP) (Makeig et al., 2002; Becker et al., 2008; Mazaheri and Jensen, 2008). Functional relevance in terms of perception and behavior has been proposed for the alpha rhythm (Klimesch et al., 2006; Mathewson et al., 2009). Furthermore, this rhythm is associated with fMRI signal decreases in occipital areas (Goldman et al., 2002; Moosmann et al., 2003; Feige et al., 2005; de Munck et al., 2007) resembling visual resting-state networks (Damoiseaux et al., 2006; De Luca et al., 2006). Here, we examine whether alpha-rhythm-dependent fluctuations of fMRI background activity (fMRI-baseline) are superimposed on evoked fMRI responses. In case of such a mechanism, the alpha rhythm would represent a neuronal substrate of fMRI trial-to-trial variability.
Our working hypothesis was that ongoing alpha activity strength accounts for variance of sensory-evoked fMRI responses. As linear superposition of ongoing and task-related brain signals has previously been observed across different time scales and imaging modalities (Arieli et al., 1996; Fox et al., 2006), we specifically tested whether linear superposition also holds true for fMRI responses to spontaneously fluctuating alpha power (i.e., neuronal activity-related fMRI-baseline fluctuations) and stimulus-evoked fMRI responses (hereafter called the superposition hypothesis). Furthermore, we tested whether ongoing alpha activity, as measured here, has functional relevance for behavior.
Materials and Methods
Experimental design and procedure
Simultaneous EEG–fMRI was acquired from 16 healthy subjects (seven females; mean age, 26.8 ± 2.9 years), with the final sample consisting of 12 subjects (for exclusion criteria, see BCG reduction, below). Written informed consent according to the Declaration of Helsinki was obtained from each subject before the investigation and the study was approved by the local ethics committee. An overview of the entire experimental setup and the resulting model is provided in Figure 1.
Figure 1.

Scheme of the experimental setup (left) and of the resulting model for analysis (right). A, First, IAAs were removed online. B, Then we used the demixing matrix obtained from the pre-experiment as a spatial filter. C, We extracted the posterior alpha-rhythm component and minimized signatures from other sources, such as heartbeat-related BCG. D, On these data, a short-term FFT was applied to calculate alpha-band power online. E, In the high alpha-state condition, stimulation was triggered when the current alpha-band power exceeded an adaptive threshold (condition I). F, Trigger timings from high alpha-state stimulation condition (condition I) were recorded and used for the state-independent stimulation condition (condition II). G, H, K–M, Model creation for fMRI analysis. Gray, Alpha power; green, final regressors. G, H, Calculation of stimulus regressor for conditions I (Regressor Ia) and II (Regressor IIa). Red, Unconvolved stick functions derived from stimulation. K, Calculation of prestimulus alpha power regressor for condition II (Regressor IIb). Thin dashed line, Parameterized alpha power stick function; orange, after mean correction. Final regressor (green) is orthogonal to Regressor IIa. Regressor IIb is thought to probe the effect of fluctuating prestimulus alpha activity on the evoked fMRI response. L, Calculation of ongoing alpha-power regressor (Regressor IIc). Thick dashed line, Ongoing alpha power convolved with HRF. Final regressor (green) is orthogonalized to Regressors IIa and IIb. Regressor IIc is supposed to probe stimulus-unrelated alpha activity, testing the effect of fluctuating alpha activity on the fMRI baseline. M, The model comprises additional regressors representing deviant stimuli, realignment parameters, and constant offsets.
Pre-experiment
Before the main experiment, all subjects underwent an EEG experiment in the static magnetic field of the magnetic resonance (MR) system designed to modulate the power of the posterior alpha rhythm in a controlled fashion. Alpha rhythm was modulated by a blockwise eyes open/eyes closed task (12 blocks each consisting of 20 s eyes closed and 20 s eyes open; total duration, 8 min). On these data, we performed independent component analysis using temporal decorrelation source separation (TDSEP) (Ziehe et al., 2000), a computationally efficient method for extraction of independent components (ICs). This method has been successfully used for the separation of ongoing EEG rhythms (Ritter et al., 2009b). We examined the degree of correlation between the alpha band power of each resulting IC and the experimental protocol. In each subject, we identified the IC best representing the posterior alpha rhythm, i.e., responsive to eyes opening/closing as indicated by a maximum correlation coefficient. Subsequently, the resulting individual demixing matrices were transferred to the main experiment and the IC best representing the posterior alpha rhythm (henceforth termed “alpha IC”) was extracted to enhance signal-to-noise ratio.
Main experiment
The main experiment consisted of a visual oddball task, requiring subjects to remain awake with eyes open, pay attention to the stimulus while focusing on the constantly shown fixation cross, and respond to deviant stimuli with the right-hand index finger. Visual evoked responses were elicited by projecting a circular black-and-white checkerboard onto an acrylic screen in the bore of the MR system. Duration of the stimulus was 900 ms. In 20% of cases, a deviant stimulus was shown, consisting of a contrast reversal of the circular checkerboard after 500 ms.
We used two experimental conditions in this experiment. In the high alpha-state stimulation condition, stimuli were applied during a state of high alpha-rhythm power, achieved by the method described in Real- time EEG alpha-state classification and stimulus triggering, below. In the state-independent stimulation condition, stimuli were applied independent of alpha-rhythm power, with stimulus timings replayed from condition I (see Single subject analyses and models, below) to maintain corresponding interstimulus intervals (ISIs) across conditions.
The experiment was split into eight blocks of 7 min each. Stimulus conditions were pseudorandomly assigned to these blocks to avoid order effects. Also, the sequences of stimulus triggers from high alpha-state stimulation runs being replayed in the state-independent stimulation runs were assigned in a pseudorandom fashion.
Data acquisition
EEG–fMRI
Simultaneous EEG–fMRI poses the challenge that the two major types of artifacts in the EEG, related to gradient switching during image acquisition and to heartbeat in the magnetic field, may critically interfere with real-time alpha-rhythm evaluation. Thus, we carefully minimized those artifacts in real time via two approaches before alpha-rhythm evaluation and used strict validation criteria to ensure adequate reduction of artifacts. Detailed procedures and validation of the real-time EEG are described in EEG system and recording parameters and in Validation of alpha-state-dependent triggering approach, below.
EEG system and recording parameters
EEG recordings were conducted with a 32-channel MR-compatible EEG system (BrainAmp MR Plus; Brain Products) and an MR-compatible EEG cap (EasyCap; FMS), using ring-type sintered silver chloride electrodes with iron-free copper leads. Twenty-one scalp electrodes were arranged according to the International 10–20 System with the reference located at electrode position FCz. In addition, one vertical electrooculogram, two horizontal electrooculogram, and two electrocardiogram channels were recorded. Impedances of all electrodes were kept below 10 kΩ using an abrasive electrolyte gel (Abralyt 2000; FMS). The EEG amplifier's recording range was ±16.38 mV at a resolution of 0.5 μV, capturing both low-amplitude EEG and high-amplitude image acquisition artifacts (IAAs) without reaching saturation. EEG sampling rate was 5 kHz. A hardware low-pass filter of 250 Hz was applied. To allow acquisition of the entire frequency spectrum of the physiological EEG as well as of IAAs, we enabled DC recording (Ritter et al., 2009a). To ensure time-invariant sampling of the IAA, we synchronized the EEG-sampling clock to the gradient-switching clock of the MR scanner (Anami et al., 2003; Freyer et al., 2009).
Real-time EEG alpha-state classification and stimulus triggering.
Before evaluation of alpha states, we removed IAAs in real time using the IAA correction plug-in from the BrainVision RecView v1.0 software package (Brain Products), which performs online calculation of an artifact template based on a number of preceding IAA epochs (here, n = 3) and subsequent subtraction of this template from each following artifact epoch.
For online reduction of the other major artifact, the ballistocardiogram (BCG), we extracted the alpha IC from the IAA-corrected raw EEG data by applying the TDSEP-derived spatial filter from the pre-experiment. This maximizes sensitivity to the posterior alpha rhythm and reduces contribution of BCG and other sources of noise to the high alpha-state stimulation condition.
Next, alpha-band (8–12 Hz) power was calculated in real time by an in-house-developed RecView plug-in based on a real-time short-term fast Fourier transform (FFT) approach with a sliding (20 ms steps) time window of 4096 sample points/819.2 ms. The resulting value was compared with an adaptive baseline, which was defined as the average alpha power of the preceding 1 min time window. Visual stimulation was triggered when the current alpha-band power exceeded 2 SDs of the adaptive baseline. After each stimulus, a dead time (i.e., no stimulation) of 4–6 s ensured sufficiently long ISIs. The resulting median ISI for both high alpha-state stimulation and state-independent stimulation conditions amounted to 10.5 s (median absolute deviation: 4.9 s for high alpha state, 4.7 s for state-independent stimulation). For each stimulus condition, deviant stimuli (independent of ongoing alpha power) were triggered in 20% of total stimulations.
Behavioral data
To exclude condition-wise shifts in vigilance and attention as possible confounds for differences between the high alpha-state and state-independent stimulation conditions, we compared the response times for deviant stimuli of both stimulation conditions. A paired Student's t test was used, testing whether there was a within-subject effect of stimulus condition on response times. We also analyzed resulting hit rates for both conditions.
fMRI data acquisition
For fMRI recordings, we used a 1.5 T Siemens Vision MR scanner with a modified T2*-weighted BOLD-sensitive echo planar imaging sequence (stepping stone), which was specifically developed for EEG–fMRI acquisition (Anami et al., 2003). Recording parameters were as follows: repetition time, 3000 ms; acquisition time, 2090 ms; echo time, 39.29 ms; 22 slices covering the whole brain and acquired aligned to the anterior/posterior commissure; 135 volumes per run (eight runs per subject); voxel size, 3 × 3×5.5 mm (0.5 mm gap); flip angle, 90°; matrix, 64 × 64; field of view, 192 × 192 mm.
Data analysis
EEG preprocessing
For subsequent analyses, EEG data were offline corrected for IAAs and filtered (bandpass, 0.5–40 Hz) using BrainVision Analyzer v1.05 (Brain Products) software. All following analyses were performed in MATLAB v7.3 (Mathworks) and EEGLAB v5.03 (Delorme and Makeig, 2004). For handling in EEGLAB, data were down-sampled to 200 Hz.
Movement artifacts were rejected with EEGLAB using an exclusion threshold of 100 μV and improbability criteria, such as joint-probability and kurtosis-of-activity, as estimated with EEGLAB preset defaults. Of 105 ± 12 (mean ± SD) trials for the high alpha-state stimulation and 107 ± 11 trials for the state-independent stimulation, an average of 98 ± 15 and 99 ± 14 trials, respectively, were retained after artifact correction.
For all subsequent EEG analyses, we extracted the alpha IC using the demixing matrix from the pre-experiment. By back-projecting alpha ICs to occipital electrode position O2, polarity information and scaling in microvolt was regained. We then performed a time-frequency decomposition using a short-term FFT. The resulting data were used for validation of our approach (see Validation of alpha-state-dependent triggering approach, below) and to construct regressors for fMRI analysis (see Single subject fMRI analyses and models, below).
Validation of alpha-state-dependent triggering approach
To validate our alpha-state-dependent triggering approach, we analyzed spatial distribution of alpha ICs, evoked potentials, spectral EEG activity of both stimulus conditions before and after stimulus onset, and efficiency of BCG reduction. If not stated otherwise, all analyses are based on the individual alpha IC component back-projected to channel O2 as described above.
Spatial distribution of alpha ICs.
For visualization of the spatial distribution of alpha ICs, topographies of single-subject alpha ICs were analyzed and an average across alpha IC weightings of all subjects was computed.
Analysis of evoked potentials.
A grand-average evoked potential (EP) was calculated for each stimulation condition. To examine whether previously reported results of late EP modulations in the visual (Becker et al., 2008; Mazaheri and Jensen, 2008) and somatosensory (Reinacher et al., 2009) domains could be reproduced, a paired Student's t test over the average in the time window of 250–350 ms was performed.
Spectral activity of stimulus conditions.
To ensure accuracy of our real-time stimulus triggering, we analyzed the time-frequency behavior of peristimulus data. To validate our triggering approach, we performed one-sample t test statistics on the time-frequency behavior for our two stimulus conditions and their difference.
BCG reduction.
To assess the efficiency of the used spatial filter for the reduction of heartbeat-related BCG contamination (Debener et al., 2008) in our signal, we segmented data in a dual manner relative to the heartbeat-related R-peak and relative to high alpha-state stimulation. Event-related spectral perturbations within the alpha band were calculated using a short-term FFT time-frequency analysis and grand averages across all subjects were computed and compared (Fig. 2D). Ideally, there should be no increase in alpha-band power locked to the BCG (as defined by segmenting data relative to R-peak). We excluded any systematic relation between the timing of BCG and high-alpha state stimulation. This was achieved by a double-check approach. First, we calculated subject-wise χ2 test of deviation from uniform distribution of R-peaks relative to high alpha-state stimulation onset (significance threshold, p ≤ 0.05). This led to the exclusion of two subjects. Second, we calculated the power distance between the BCG–alpha response and the high alpha trigger and determined the threshold value up to which a systematic temporal relation was detected in at least one subject using the above mentioned χ2 test. The limit value turned out to be 3.5 dB. Two additional subjects who failed to reach this threshold were also excluded. This highly conservative double-check approach resulted in a final sample of 12 subjects (mean, 26.8 ± 3.4 years), with an average distance measure of 5.9 dB ± 1.1 (SD), meaning that the average alpha power increase during the alpha triggering exceeded the maximum BCG-locked activity by almost 300%.
Figure 2.
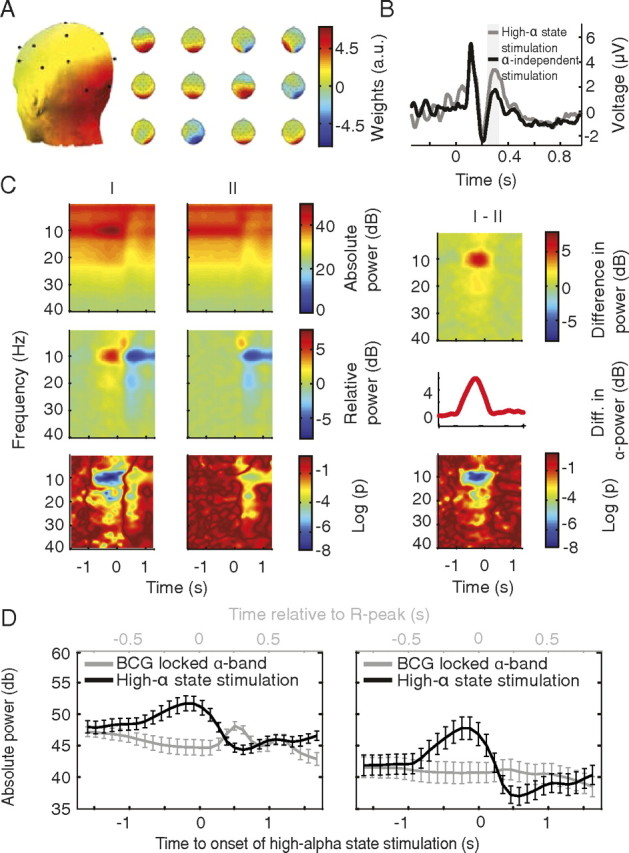
Validation of the online EEG-triggered stimulation approach. All analyses are based on the alpha-associated IC. A, Left, Average posterior spatial distribution of alpha-associated IC. Right, Spatial distribution of alpha ICs for single subjects. Color bar represents weightings (arbitrary units). B, Grand average EPs of the alpha IC for high alpha-state and state-independent stimulations reproducing previously reported amplitude increases of a late evoked component for the high alpha-state stimulation condition (window of analysis in gray, p ≤ 0.05). C, Grand average time-frequency plots of EEG data for stimulation and interstimulus conditions demonstrate proper alpha state-dependent triggering. Top and middle rows, Images depict same data without (top) and with (middle) baseline correction. Bottom row, Significance of time-frequency behavior, tested against a prestimulus baseline. Decadic logarithmized p values are color coded (e.g., −2 indicates p < 10−2). Left column, High alpha-state stimulation; Middle column, state-independent stimulation; Right column, difference of time-frequency behavior between high alpha-state and state-independent stimulation conditions. Right column, middle row, Average prestimulus alpha-power increase (cf. Fig. 3). D, Validation of alpha-rhythm extraction and efficient BCG reduction. Grand averages of EEG alpha-band power of IAA-corrected data locked to either high alpha-state stimulation (black) or the heartbeat-related R peak (gray) before (left) and after (right) applying the spatial filter from the pre-experiment, extracting the alpha IC. Alpha rhythm is maintained in the alpha IC while BCG is strongly reduced. Note the different time scales for the two averages.
fMRI preprocessing
The fMRI data were preprocessed and analyzed using the software package SPM5 (www.fil.ion.ucl.ac.uk/spm). Preprocessing consisted of realignment for motion correction, normalization to the brain template of the Montreal Neurological Institute (MNI) supplied with SPM, resampling data to a resolution of 2 × 2 × 2 mm, and subsequent spatial smoothing with a kernel of 6 mm full-width-at-half-maximum. A temporal high-pass filter with a cutoff of 128 s was applied. The first five scans of each run were discarded to account for spin-saturation effects.
fMRI statistical analysis
Single subject analyses and models.
We performed a regression analysis based on the general linear model for each individual subject (first-level analysis). For visualization of how regressors were calculated, see Figure 1. The model, i.e., the design matrix, designed for condition I sessions consisted of a high alpha-state stimulation (Regressor Ia) and a response to deviants (Regressor Ix). For condition II sessions, the design matrix consisted of an alpha state-independent stimulation (Regressor IIa), a prestimulus alpha power (Regressor IIb), an alpha baseline (Regressor IIc), and a response to deviants (Regressor IIx).
For both stimulus conditions, stimulus onsets were modeled by stick-like Dirac functions convolved with the canonical hemodynamic response function (HRF) exhibiting a delay of 5 s relative to event onset (Regressors Ia and IIa). Additional temporal and dispersion derivatives of this response function were added, yielding a basis set. Furthermore, for condition II sessions, two different types of fluctuating alpha activity were examined for their effect on the fMRI signal.
First, the effect of fluctuating prestimulus alpha power on the fMRI stimulus response was examined (Regressor IIb). Depending on the prestimulus alpha power level, a parametric event-related regressor (z-scored alpha power was grouped into discrete classes with a range of 1–7 after mean correction from −3 to +3; resulting scaled Dirac functions were convolved with a basis set of HRFs) was calculated in addition (and orthogonal) to the standard fixed-amplitude stimulus response regressor (IIa). In case prestimulus alpha power affects the evoked response, this parametric prestimulus alpha power regressor will explain a significant part of the variance of the data.
Second, we were also interested in fMRI correlates of ongoing stimulus-unrelated alpha-power variations, i.e., the alpha-rhythm power-related fMRI baseline modulations (Regressor IIc). This alpha baseline regressor was calculated by convolving continuous alpha-band power fluctuations during condition II with a basis set of HRFs. The resulting functions were orthogonalized, first to the stimulus regressors and then to the prestimulus alpha regressors described above.
This model was complemented by adding the set of six translational and rotational realignment parameters and constant session offsets. It was then fitted to the fMRI data and, based on the estimated parameter values (effect sizes), contrast images were calculated as follows: for condition I: high alpha-state stimulus response (contrast on Regressor Ia); for condition II: state-independent stimulus response (contrast on Regressor IIa), prestimulus alpha response modulation (contrast on Regressor IIb), alpha-dependent baseline modulation (contrast on Regressor IIc); and the difference between stimulus responses of the two conditions: the high-alpha state stimulus response modulation (Regressor Ia vs IIa).
Group level analyses.
Based on these single-subject contrasts, we calculated a group-level random-effects analysis, allowing inferences on the whole population.
To analyze alpha-state-dependent effects on the visual-evoked fMRI activity, regions exhibiting significant responses to visual stimulation under either stimulation condition were defined as visually responsive regions-of-interest [ROI; comprising all significantly activated voxels of both conditions with p ≤ 0.0003, corrected for multiple comparisons based on false discovery rate (FDR), extent threshold 60 voxels]. This visual ROI was used as a mask for all further analyses.
For the high-alpha state stimulus-response modulation, the alpha-dependent baseline modulation, and the prestimulus alpha activity correlation, we used a statistical peak threshold of t > 2.9 and an extent threshold of 10 voxels, guaranteeing an FDR-corrected threshold of p < 0.04 in all conditions.
To test our linear superposition hypothesis, we looked for areas in which the alpha-dependent fMRI baseline and stimulus response were systematically modulated in the same manner. To derive a statistical measure for the existence and systematic occurrence of brain regions with such equally directed alpha-dependent baseline- and stimulus-response modulations, we performed a conjunction analysis that explicitly included only voxels found active in both contrasts, using the same previously defined initial threshold of t > 2.9 for each condition.
fMRI response functions.
By using the estimated hemodynamic alpha impulse response function for the ongoing alpha regressor, we were able to predict the corresponding hemodynamic baseline modulation for the high-alpha state that was observed in our alpha-dependent stimulus condition (condition I). This procedure is explained in Figure 3. The resulting predicted hemodynamic response curve (comparable to the difference between high-alpha and average-alpha stimulation responses) is termed high alpha-state baseline modulation. Its amplitude was compared with the observed high alpha-state stimulus-response modulation. For the case that the baseline modulations (as predicted to occur during the high alpha state) account for the complete observed fMRI stimulus response variability, i.e., in case of linear superposition, both curves are expected to match. In turn, differences between the observed and the predicted response give an estimate of the degree of nonadditivity.
Figure 3.

How we used observed alpha-dependent fMRI baseline modulations to predict high alpha-state fMRI baseline modulations. A, Ongoing alpha power (condition II). B, Regressor IIc (i.e., ongoing alpha power convolved with the canonical HRF+ derivatives, orthogonalized to Regressors IIa and IIb) is fitted to the data to estimate beta magnitudes. C, Prestimulus alpha power increase found in the high alpha condition relative to control condition (Fig. 2C). D, Estimation of the alpha-rhythm power impulse-response function by scaling HRF+ derivatives with the beta values obtained in B. With the generic hemodynamic impulse response function, we can predict an fMRI response to any arbitrary alpha-power behavior. E, We predicted fMRI responses to prestimulus high alpha-rhythm power signals by convolving the curves depicted in C and D. Resulting predictions were compared with the observed high alpha fMRI stimulus-response modulations (Fig. 6, blue and red curves).
Single-trial correlation between prestimulus alpha activity and the evoked fMRI response.
Finally, we tested whether alpha activity affects stimulus responses also on a trial-by-trial basis. To this end, for the alpha-independent stimulation (condition II) we examined those areas exhibiting both alpha-dependent baseline (Regressor IIc) and stimulus response modulations (Regressor Ia–Regressor IIa), as identified by individual conjunction analysis (using a subject-wise adaptive threshold of p < 0.05 or smaller to identify individual peak clusters of <450 voxels). We tested whether prestimulus alpha-based predicted-fMRI signal modulations (i.e., fitted Regressor IIb) account for the observed fMRI stimulus-response modulations on a trial-by-trial basis. Time series of the respective individually determined voxels were collapsed to yield average time series for each subject using the Marsbar toolbox for SPM (http://marsbar.sourceforge.net). Then, within subjects, we correlated the predicted effect of prestimulus alpha power with the observed data (with realignment parameters regressed out). Data points of 0 to 9 s after stimulation were included in this correlation analysis.
Results
This results section is divided into two parts. The first part, comprised of EEG and behavioral data, focuses on the general validation of our approach from a methodological and experimental-design perspective. The second part, based on the (EEG-related) fMRI data, deals with the main results of the study.
EEG and behavioral results
Validation of alpha-state-dependent triggering approach
Spatial distribution of alpha ICs.
Figure 2A, left, depicts the average distribution of the alpha IC with a clear posterior focus. Figure 2A, right, shows the corresponding single subject ICs (please note that for single IC maps, depicted weightings have arbitrary polarity).
Evoked potentials.
As was previously reported from related EEG and magnetoencephalography studies (Jasiukaitis and Hakerem, 1988; Becker et al., 2008; Mazaheri and Jensen, 2008), late evoked-component amplitudes were significantly increased in the high alpha-state stimulation condition (p ≤ 0.05) (Fig. 2B).
Spectral activity of stimulus and interstimulus conditions.
In all subjects, a pronounced and frequency-specific increase of prestimulus alpha-band activity for the high alpha-state stimulation condition was observed. Figure 2C, top row, shows absolute magnitudes of spectral activity; the middle row depicts baseline-corrected data (corrected in a prestimulus window of −2 to −1 s before stimulus onset). For the high alpha-state stimulation (Fig. 2C, left), power increases preceding stimulation were restricted to the alpha band, verifying that stimulation was effectively triggered by high alpha states. The alpha band increase starts at −800 ms before actual stimulation with a significance of p < 1 × 10⁻⁵ throughout the prestimulus period (Fig. 2C, bottom). In contrast, poststimulus power increases below the alpha band reflect the EP and decreases in the alpha band reflect the classical alpha rhythm event-related desynchronization (ERD) due to stimulation, which also occurs for state-independent stimulation (Fig. 2C, middle column). Figure 2C, right, shows the difference between high alpha-state stimulation and state-independent stimulation, i.e., the increase of prestimulus alpha power.
BCG reduction.
How relevant the use of the alpha IC is for reduction of BCG-locked activity is shown in Figure 2D. The left plot shows the relation of BCG-locked and -triggered alpha activity without use of the alpha IC (i.e., channel data); the right plot shows the effect of using the alpha IC for triggering. This indicates efficient reduction of BCG activity after use of the spatial filter from the pre-experiment and extraction of the alpha IC.
Consideration of eye movements.
Regarding the issue of possible alpha rhythm-related eye movements, comparing artifact detection rate in EEG across stimulus conditions did not indicate a systematic accumulation of eye movement-related responses before the alpha-triggered stimulation. Also, a more specific time-frequency analysis of frontal electrodes did not reveal any systematic effects during alpha-triggered stimulation.
Response times
Mean response times for deviant stimuli were 489 ms for the high alpha-state stimulation condition and 497 ms for the state-independent stimulation condition. Within subjects, the average difference was not significant (mean, 9 ms; SD across subjects, 53 ms; p = 0.59). Hit rate was 95.77% (high alpha-state condition) and 94.86% (state-independent condition). This indicates corresponding levels of vigilance and attention across stimulus conditions.
Deviants differed from nondeviant visual stimuli (consisting of 900 ms black-and-white checkerboard presentations) by a contrast reversal after 500 ms. Hence, reaction times can be related either to the alpha-rhythm power before stimulus-response onset or to the alpha-rhythm power before the response to contrast reversal. In the latter case, desynchronized alpha activity, i.e., lower alpha-rhythm power, due to the preceding 500 ms checkerboard stimulus will be present. In addition, the amount of alpha-rhythm power change, i.e., ERD, can be related to behavior. We did all three analyses. In a time window from −250 to 250 ms around the contrast reversal in the deviant, a subject-wise correlation analysis of alpha power and reaction times revealed no significant correlation different from zero [mean correlation coefficient (cc) = −0.04 ± 0.05 (SEM), p = 0.45, Student's t test], whereas a (negative) correlation (mean cc = −0.16 ± 0.04, p = 0.001) exists for the time −1000 to −500 ms before contrast reversal, i.e., in the 500 ms window before stimulation onset. With respect to alpha ERD, we found an equally directed correlation (mean cc = −0.11 ± 0.03, p = 0.005). Notably deviant stimuli were not triggered dependent on alpha power in either condition, but rather were generated independent of alpha activity after a pseudorandomized delay, so this does not constitute a difference across conditions.
fMRI results
All group level fMRI maps reported in the following are based on a statistical threshold of t > 2.9, with p < 0.04 (FDR corrected) if not stated otherwise. The main fMRI map yielded by conjunction analysis (henceforth referred to as map purple) of alpha-dependent stimulus response (map red) and baseline modulations (map blue) is also based on the same statistical threshold.
Group level analyses: statistical parametric maps for alpha-dependent stimulus response modulation (condition I vs II)
We first examined whether fMRI stimulus responses were altered when stimulation occurred in the high alpha state (condition I–condition II). Within the visual ROI (Fig. 4A, gray areas), we identified reduced stimulus-response amplitudes for the high alpha state (compared with the control condition, i.e., alpha state-independent stimulation) (for response curves, see Fig. 4B) in bilateral occipitoparietal cortex, cuneus [Brodmann area (BA) 18, 19], bilateral thalamus, and left cerebellum (map red; p < 0.04, FDR corrected) (Fig. 4A; Table 1). At the same statistical threshold, no positive high alpha-state activations were found.
Figure 4.

fMRI results for alpha-dependent stimulus response modulation [t > 2.9; p < 0.04, FDR corrected (pFDR); extent threshold 10 voxels]. A, The observed deactivations (red) within the visual ROI (gray) are projected onto a glass brain template. For corresponding z-values and MNI coordinates with anatomical labeling, see Table 1. B, The resulting response curves for the identified clusters, depicting the high alpha-state stimulus response, the alpha-independent stimulus response, and their difference (error bars indicating SEM across subjects).
Table 1.
fMRI results of random-effects group analyses (n = 12) for alpha-dependent stimulus response modulation, alpha-dependent baseline modulation, their conjunction, and prestimulus alpha-dependent responses
| Anatomical region | Hemisphere | Coordinates |
Cluster size | t value | z value | ||
|---|---|---|---|---|---|---|---|
| x | y | z | |||||
| Alpha-dependent stimulus-response modulation (map red) | |||||||
| Cerebellum | L | −42 | −66 | −28 | 155 | 5.00 | 4.29 |
| Middle occipital gyrus/cuneus (BA 18) | R | 34 | −82 | 20 | 453 | 4.51 | 3.95 |
| Thalamus | R | 8 | −10 | −2 | 51 | 4.19 | 3.73 |
| Thalamus | L | −10 | −8 | 0 | 29 | 3.70 | 3.36 |
| Middle occipital gyrus/cuneus (BA 18) | L | −20 | −92 | 22 | 32 | 3.60 | 3.28 |
| Cerebellum | L | −10 | −64 | −4 | 17 | 3.32 | 3.06 |
| Cerebellum/fusiform gyrus (BA 19) | L | −26 | −66 | −12 | 15 | 3.06 | 2.85 |
| Alpha-dependent baseline modulation (map blue) | |||||||
| Cerebellum | L | −28 | −78 | −16 | 429 | 4.82 | 4.16 |
| Middle occipital gyrus/cuneus (BA 18/19) | L | −24 | −96 | 24 | 56 | 4.52 | 3.96 |
| Cerebellum/lingual gyrus (BA 18) | R | 26 | −84 | −20 | 186 | 4.50 | 3.94 |
| Cuneus/middle occipital gyrus (BA 18) | L | −18 | −102 | −16 | 69 | 4.02 | 3.60 |
| Cuneus/middle occipital gyrus (BA 18/19) | R | 24 | −92 | 18 | 97 | 3.69 | 3.35 |
| Cuneus/lingual gyrus (BA 17/18) | R | 6 | −98 | 4 | 120 | 3.41 | 3.14 |
| Cuneus/lingual gyrus (BA 17/18) | R | 22 | −102 | 4 | 12 | 3.37 | 3.1 |
| Conjunction analysis on alpha-dependent responses (map purple) | |||||||
| Cuneus/middle occipital gyrus (BA 18) | R | 22 | −90 | 20 | 68 | 3.60 | 3.28 |
| Cuneus/middle occipital gyrus (BA 18) | L | −10 | −94 | 24 | 22 | 3.41 | 3.13 |
| Cuneus/middle occipital gyrus (BA 18) | L | −20 | −94 | 24 | 32 | 3.32 | 3.06 |
| Cuneus/middle occipital gyrus (BA 18) | R | 12 | −94 | 26 | 4 | 3.09 | 2.88 |
| Fusiform gyrus (BA 19)/cerebellum | L | −28 | −66 | −12 | 8 | 3.06 | 2.85 |
| Prestimulus alpha response (map orange) | |||||||
| Cuneus (BA 18) | R | 2 | −80 | 32 | 372 | 5.06 | 4.33 |
| Cerebellum/lingual gyrus (BA 18) | L | −36 | −70 | −24 | 694 | 4.64 | 4.04 |
| Cuneus/middle occipital gyrus (BA 18) | R | 28 | −82 | 24 | 96 | 4.54 | 3.97 |
| Cuneus/middle occipital gyrus (BA 18/19) | L | −22 | −92 | 24 | 47 | 4.44 | 3.91 |
| Cerebellum/fusiform gyrus (BA 19) | R | 24 | −70 | −20 | 298 | 4.21 | 3.74 |
Statistical parametric maps for alpha-dependent baseline response modulation
Next, we examined the effect of the ongoing alpha activity on the fMRI baseline (i.e., alpha-dependent baseline modulation). Also here, we only found regions with significantly reduced fMRI baseline signal in response to increased alpha activity. They were observed in bilateral occipital areas (BAs 17, 18, 19) and bilateral cerebellum (map blue; p < 0.03 FDR corrected) (Fig. 5; Table 1).
Figure 5.

fMRI results for alpha-dependent baseline response modulation [t > 2.9; p < 0.03, FDR corrected (pFDR); extent threshold 10 voxels]. The observed deactivations (blue) within the visual ROI (gray) projected onto a glass brain template. For corresponding z-values and MNI coordinates with anatomical labeling, see Table 1.
Statistical parametric maps for alpha-dependent baseline and stimulus-response comodulations
At this stage, our results provided evidence of alpha rhythm-dependent fMRI baseline and stimulus-response alterations—more precisely, deactivations—however, they did not yet directly address the superposition hypothesis, which states that fMRI-baseline modulations related to the alpha rhythm add linearly to a fixed evoked response and thus are responsible for the observed stimulus-evoked fMRI response modulations. To this end, we first examined—on a qualitative basis—to what degree a spatial overlap exists for areas that are systematically modulated by the alpha rhythm in the same way during stimulation and nonstimulation periods, using a conjunction analysis. Analogous to the resulting statistical maps of the separate analyses (for alpha baseline and stimulus response modulation), we identified areas showing a significant deactivating effect in both conditions (i.e., in and between stimulations, map purple; p < 0.04, FDR corrected) (Fig. 6A,B, Table 1). These areas comprise bilateral cuneus (BA 18), left fusiform gyrus (left BA 19), and cerebellum.
Figure 6.

fMRI results of conjunction analysis. A, B, Occipital and occipitoparietal clusters deactivating during high-alpha activity during both stimulation and nonstimulation periods [t > 2.9; p < 0.04, FDR corrected (pFDR); purple] depicted on a typical brain (Colin single-subject MNI brain template) and on a glass brain, together with the visual ROI (gray). C, In these areas, the observed difference in evoked fMRI responses due to high alpha stimulation (gray line) compared with state-independent stimulation (black line; difference depicted by red line) can be explained by the modulation of the fMRI baseline due to high alpha during nonstimulation periods (blue). Error bars indicate SEM across subjects. For corresponding z values and MNI coordinates with anatomical labeling, see Table 1.
fMRI-response functions
For a further quantitative test of our linear superposition hypothesis, we extracted magnitudes of high alpha-state stimulus and baseline fMRI modulations by estimating average HRFs. Of particular interest are the response curves in the areas that exhibit alpha-dependent comodulations of the baseline and the stimulus response (Figs. 4A, 5). Here, equal magnitudes of the two curves would imply the hypothesized linear superposition, i.e., alpha-dependent fMRI baseline modulations accounting for the observed alpha-dependent fMRI stimulus-response modulations. In other words, fMRI stimulus response variability could be explained by a linear superposition of alpha-dependent fMRI baseline modulations and a fixed visually evoked fMRI response (Fig. 6C). By necessity, in map purple, the areas exhibiting both high alpha-state stimulus response modulations and alpha-dependent baseline modulations—both being deactivations—will only yield negative responses. However, their amplitudes do not necessarily match each other. Notably, our results (Fig. 6C, red and blue curves) show that magnitudes of both types of response curves are highly similar in map purple. We also analyzed response curves separately for each cluster in all three maps. For map purple, alpha-dependent baseline and stimulus-response curves matched for all clusters—so that the average curves shown in Figure 6C fully reflect what we also see on single-cluster level. The same results were found for the clusters of map blue. With respect to map red, we found a differential behavior (Fig. 7). Those areas of map red that were part of map purple, i.e., the conjunction result, exhibited response curves that matched in amplitude (including the largest statistically significant cluster, observed in the right extrastriate cortex). Those areas, however, that were located outside of map purple, such as thalamus and cerebellar areas at the margins of map purple, exhibited a stronger deactivation to high-alpha stimuli, as predicted by less pronounced (and nonsignificant) alpha-dependent baseline modulations, meaning that here amplitudes of baseline and response modulations did not match.
Figure 7.

A, Within the map of suprathreshold high alpha-state stimulus-response modulations, i.e., map red, two kinds of clusters can be identified. B, In one set of cortical areas (purple rings in A), the observed modulation during high alpha-state stimulation can be explained by baseline modulations caused by high alpha states (top). In the other set (black rings in A), including thalamic and cerebellar areas outside the conjunction map, the observed effect cannot be explained by baseline modulations (bottom).
Statistical parametric maps for trial-by-trial prestimulus alpha-dependent stimulus-response modulations
In addition to the observed alpha-triggered stimulus response modulation, we also investigated whether significant alpha-dependent stimulus response modulations exist for fluctuating prestimulus alpha activity (in condition II). In Figure 8, the resulting areas showing significant deactivations are depicted (p < 0.02, FDR corrected), comprising bilateral inferior and superior occipital clusters (map orange). A further conjunction of this prestimulus alpha analysis with the alpha-triggered stimulus response and the alpha baseline modulation did not change the outcome in terms of identified areas (data not shown). This supports the notion that alpha-triggered response modulations and the trial-by-trial alpha-dependent response modulations originate from the same functional network.
Figure 8.

fMRI results of single-trial prestimulus alpha correlation analysis, testing the effect of fluctuating prestimulus alpha power on the single-trial evoked fMRI response [t > 2.9; p < 0.02, FDR corrected (pFDR); extent threshold 10 voxels]. Found deactivations are depicted on a glass brain (orange; visual ROI, gray). For corresponding z values and MNI coordinates with anatomical labeling, see Table 1.
Single-trial correlation between prestimulus alpha activity and the evoked fMRI response
As it became apparent from the conjunction analysis, a close relation between alpha-dependent stimulus response and baseline modulations exists. To further support this finding, we performed additional single-subject analyses correlating the predicted (i.e., modeled and fitted) fMRI effect of prestimulus alpha and single-trial evoked fMRI responses. For this analysis, we examined areas exhibiting conjoint effects of both alpha-dependent stimulus response modulation and alpha-dependent baseline modulation in single subjects. Results of all subjects are depicted in Figure 9(one scatter plot per subject). A clear alpha-dependency of the fMRI stimulus response across the entire continuum of prestimulus alpha power can be observed (mean cc = 0.30; range across subjects, 0.12–0.48). This provides further positive evidence that variability of the evoked fMRI response can be explained by the ongoing alpha power on a trial-by-trial basis.
Figure 9.

Single-trial correlation between prestimulus alpha power-based predictions of fMRI signal modulations (x-axis) and actually observed evoked fMRI responses (y-axis) for all individual subjects. The inverse relation between alpha power and fMRI signal is accounted for by model fitting. Hence the fitted model yields a positive correlation with the fMRI signal. A clear alpha dependency of the fMRI stimulus response across the entire continuum of prestimulus alpha power can be observed.
In summary, our results link fMRI variance and ongoing neuronal activity. During high alpha-state stimulation, a robust effect, i.e., a decrease of the fMRI stimulus response compared with state-independent stimulation, is revealed (Fig. 4A,B). A corresponding decrease of the fMRI baseline due to spontaneous alpha fluctuations can be observed (Fig. 5). These two alpha-dependent effects appear to share a common network of regions (Fig. 6A,B), with their hemodynamic responses matching in size (Fig. 6C). This supports the idea of linear superposition of hemodynamic responses to ongoing alpha and a fixed evoked stimulus response. Further positive evidence for linear superposition is provided by single-trial analysis (during state-independent stimulation) identifying a negative linear correlation of prestimulus alpha power and fMRI evoked responses in every subject (Figs. 8, 9).
Discussion
In this study, we provide the anticipated and requested (Birn, 2007) evidence for the assumption that intrinsic neuronal activity is indeed responsible for intrinsic fMRI fluctuations superimposed on evoked fMRI responses (Fox et al., 2006).
Excluding possible confounds
EEG–fMRI is an artifact-prone method potentially leading to erroneous inferences (Ritter et al., 2009a). We implemented several strategies to exclude such confounds, as detailed in the Materials and Methods and Results, above. Both kinds of MR-related artifacts were reduced efficiently by a spatial-filter approach [capable of identifying even subtle mu rhythm fMRI correlates (Ritter et al., 2009b)] and an optimized EEG–fMRI setup (Freyer et al., 2009).
Due to relatively short nonstimulation periods, the ongoing alpha activity assessed here might differ qualitatively from alpha activity assessed during continuous rest. However, by orthogonalizing alpha baseline regressors to stimulus and prestimulus alpha regressors, we ensured that the identified fMRI correlates reflect ongoing nonstimulus-locked alpha power changes. Notably, observed fMRI correlates of orthogonalized regressors correspond to previous resting-state findings in terms of location and response character.
Considerations on neurophysiology
In the cat visual cortex, broadband ongoing membrane potentials correlate linearly with evoked postsynaptic membrane potentials (Azouz and Gray, 1999). Without excluding nonlinear scenarios, our main finding agrees with such linear superposition of ongoing and evoked activities on the neuronal level and subsequent linear transformation of summed neuronal signals into hemodynamic responses. In accordance with previous studies (Goldman et al., 2002; Moosmann et al., 2003; Feige et al., 2005; de Munck et al., 2007), intrinsic alpha rhythm negatively correlates with fMRI signals in extrastriate areas, indicating decreases of net neuronal activity during high alpha states (Ritter et al., 2002). This baseline effect seems to add linearly to fixed visually evoked fMRI responses, finally leading to the observed decrease of alpha-triggered fMRI stimulus responses.
Regarding the EEG, present and earlier findings also suggest linear superposition between ongoing alpha rhythm and fixed evoked responses for early VEP components at ∼100 ms poststimulus-time (P100) (Mazaheri and Jensen, 2006; Becker et al., 2008) and positive relations between prestimulus alpha-rhythm power and late evoked components (∼300 ms poststimulus). These findings agree well with the notion that the VEP–P100 component is generated in extrastriate visual cortex (Schroeder et al., 1998) for which our fMRI data indicate linear superposition. How does the finding of linear superposition in extrastriate visual areas relate to invasive animal recordings reporting linear superposition in striate visual cortex (Arieli et al., 1996; Azouz and Gray, 1999)? One likely explanation is that alpha-rhythm ICs in our study only contained minor alpha activity from striate cortex due to this structure's deep location and unfavorable potential orientations. Accordingly, many EEG–fMRI studies report extrastriate fMRI correlates of EEG–alpha activity (Goldman et al., 2002; Moosmann et al., 2003; Feige et al., 2005; Gonçalves et al., 2006; de Munck et al., 2007). Our findings do not exclude the possibility of similar effects in primary visual areas. What they do suggest is that ongoing alpha activity, as measured here, explains evoked activity in secondary visual areas best, being in accordance with a recent study of Scheeringa et al. (2011).
Complementary to the latter study, we also analyzed subcortical areas such as thalamus and cerebellum, where we identified significant alpha-dependent fMRI stimulus-response modulations but no corresponding baseline modulations. Here, the linear superposition hypothesis does not hold true. The theory of linear superposition is also linked to the (possibly simplified) assumption of linear neurovascular coupling. While some studies report nonlinear neurovascular coupling for specific brain areas and stimulus conditions (Huettel et al., 2004), less is known about possible nonlinear couplings of ongoing EEG activity and fMRI baseline responses. Empirical and theoretical studies suggest U-shaped, i.e., nonlinear, relationships of ongoing activity and behavior (Linkenkaer-Hansen et al., 2004) and between ongoing activity and evoked EEG responses (Rajagovindan and Ding, 2011). Such phenomena may account for some of the nonlinearities we have observed. In terms of statistical robustness, our prevailing finding is linear superposition of ongoing and evoked fMRI responses.
Functional implications
Linear superposition occurs mainly in secondary visual (extrastriate) cortex, including occipitoparietal visual association areas important for visuospatial attention (Yantis et al., 2002; Tuch et al., 2005). As information passes through visual hierarchies from striate via extrastriate to the visual association cortex, increasing levels of specialization of processing occur (Haxby et al., 1991). The areas identified here (extrastriate occipitoparietal cortex, including cuneus), of which the stimulus-response behavior is modulated by ongoing alpha activity, point to alpha-dependent modulations of higher visual functions.
A proposed mechanism linking alpha band oscillatory activity and modulation of visual processing is gating by inhibition (Jensen and Mazaheri, 2010). Accumulating evidence supports this theory. For example, power of prestimulus alpha band oscillations is inversely related to cortical excitability (Romei et al., 2008). Spatial attention is tightly related to alpha-rhythm power and the latter to cortical excitability. Spatial attention-related top-down regulations of stimulus-related excitability have recently been shown for somatosensory areas (Schubert et al., 2008). Other studies demonstrated that high prestimulus alpha-rhythm power in somatosensory cortex reduces perception of somatosensory (Schubert et al., 2009) and painful (Babiloni et al., 2006) stimuli. This is in line with findings in the visual system, where spontaneous power fluctuations of prestimulus alpha rhythm are inversely related to perceptual performance (Ergenoglu et al., 2004; van Dijk et al., 2008; Busch et al., 2009).
While the present study was not conceived to investigate relations between alpha-rhythm power and behavior, it is worth mentioning that even for the sparsely inserted deviant trials requiring behavioral responses, we found a relation between alpha rhythm and behavior, adding evidence to the notion of the alpha rhythm's functional role. Given the low number of trials and the particularity of deviant stimuli (the contrast reversal falling into windows where alpha ERD is already present), it was beyond the scope of this study to further identify exact mechanisms underlying the observed behavioral effects (for related debates, see Klimesch et al. 2006). Notably, it supports the notion that linear-superposition mechanisms, as observed here, and functional roles of ongoing activity are not mutually exclusive, as also shown previously by fMRI (Fox et al., 2007). While spatial attention modulates alpha-rhythm power (Thut et al., 2006; Rajagovindan and Ding, 2011) and firing rates of neurons (Rajagovindan and Ding, 2011), it does not affect early VEPs (Gomez Gonzalez et al., 1994; Clark and Hillyard, 1996; Noesselt et al., 2002). Attention may be mediated through modulation of synchrony of neuronal oscillations (Mitchell et al., 2009). In humans, nonrelevant neurons coding nonattended receptive fields presumably synchronize in the alpha band. With their increasing engagement in oscillatory networks, responsiveness of neurons to external inputs decreases (Buzsáki and Draguhn, 2004) along with reduced synaptic transmissions and decreased fMRI activity. In case of stimulation, the thus modulated baseline would add linearly to visually evoked responses. How can this be reconciled with the fact that later components of the VEP covary with prestimulus alpha-rhythm power (Becker et al., 2008) and also with attention (Noesselt et al., 2002)? These effects were expected to introduce deviations from linear superposition given the temporal low-pass filtering properties of fMRI and hence blurring of early and late responses. Possible explanations are differences in location and the recently proposed origin of such late components, i.e., alpha-rhythm amplitude asymmetry (Nikulin et al., 2007; Mazaheri and Jensen, 2008). This would represent a mechanism probably not associated with hemodynamic responses (other than prestimulus alpha-related fMRI activity) and hence poses one possible scenario reconcilable with our present findings [and the recent findings of Scheeringa et al. (2011)].
Another functional role of ongoing oscillations with respect to state-dependent processing may be the integration of bottom-up and top-down processes in line with the theories of predictive coding and hierarchical inference (Friston, 2003). In real life, we often have feature-based and spatial foreknowledge. These sources of information are presumably used in concert to optimize the allocation of attention and eye movements (Egner et al., 2008). The finding of state-dependency of evoked responses is also compatible with the theory of preferred cortical states (Tsodyks et al., 1999), implying the existence of intrinsic facilitative neuronal modes.
Outlook
We demonstrated the role of the posterior alpha rhythm for variability of fMRI stimulus responses. Our findings, however, do not exclude the presence of additional intrinsic sources of evoked-response variability as proposed, for example, in Truccolo et al. (2002). Apart from the alpha rhythm, we expect other neuronal signatures already known to contribute to fMRI signal variability under resting condition (Laufs et al., 2003; Giraud et al., 2007; Mantini et al., 2007; Nir et al., 2007) to further explain fMRI evoked-response variability. Also, complementary to our results on amplitude-dependent effects, a link between alpha-rhythm phase and fMRI stimulus-evoked responses has recently been revealed (Scheeringa et al., 2011). Thus, in the wake of future multimodal studies, we may appreciate additional forms of integration of intrinsic neuronal context, sensation, and action constituting the foundation of adaptive behavior.
From a theoretical perspective, large-scale neural-systems models indicate the importance of local dynamics, anatomical connectivity, and noise for the emergence of resting-state patterns in general (Deco et al., 2011) and the alpha rhythm in particular (Freyer et al., 2011). By illuminating underlying physiological parameters that are otherwise inaccessible to noninvasive recordings, those modeling approaches may contribute to a deeper understanding of state-dependent information processing in humans.
Footnotes
This work was supported by the German Federal Ministry of Education and Research (Berlin NeuroImaging Center, Bernstein Center for Computational Neuroscience, Bernstein Focus State Dependencies of Learning), the German Research Foundation (Berlin School of Mind and Brain), the Robert Bosch Foundation, and the James S. McDonnell Foundation (Brain NRG).
References
- Anami K, Mori T, Tanaka F, Kawagoe Y, Okamoto J, Yarita M, Ohnishi T, Yumoto M, Matsuda H, Saitoh O. Stepping stone sampling for retrieving artifact-free electroencephalogram during functional magnetic resonance imaging. Neuroimage. 2003;19:281–295. doi: 10.1016/s1053-8119(03)00048-x. [DOI] [PubMed] [Google Scholar]
- Arieli A, Sterkin A, Grinvald A, Aertsen A. Dynamics of ongoing activity: explanation of the large variability in evoked cortical responses. Science. 1996;273:1868–1871. doi: 10.1126/science.273.5283.1868. [DOI] [PubMed] [Google Scholar]
- Azouz R, Gray CM. Cellular mechanisms contributing to response variability of cortical neurons in vivo. J Neurosci. 1999;19:2209–2223. doi: 10.1523/JNEUROSCI.19-06-02209.1999. [DOI] [PMC free article] [PubMed] [Google Scholar]
- Babiloni C, Brancucci A, Del Percio C, Capotosto P, Arendt-Nielsen L, Chen AC, Rossini PM. Anticipatory electroencephalography alpha rhythm predicts subjective perception of pain intensity. J Pain. 2006;7:709–717. doi: 10.1016/j.jpain.2006.03.005. [DOI] [PubMed] [Google Scholar]
- Becker R, Ritter P, Villringer A. Influence of ongoing alpha rhythm on the visual evoked potential. Neuroimage. 2008;39:707–716. doi: 10.1016/j.neuroimage.2007.09.016. [DOI] [PubMed] [Google Scholar]
- Beckmann CF, DeLuca M, Devlin JT, Smith SM. Investigations into resting-state connectivity using independent component analysis. Philos Trans R Soc Lond B Biol Sci. 2005;360:1001–1013. doi: 10.1098/rstb.2005.1634. [DOI] [PMC free article] [PubMed] [Google Scholar]
- Birn RM. The behavioral significance of spontaneous fluctuations in brain activity. Neuron. 2007;56:8–9. doi: 10.1016/j.neuron.2007.09.021. [DOI] [PubMed] [Google Scholar]
- Biswal B, Yetkin FZ, Haughton VM, Hyde JS. Functional connectivity in the motor cortex of resting human brain using echo-planar MRI. Magn Reson Med. 1995;34:537–541. doi: 10.1002/mrm.1910340409. [DOI] [PubMed] [Google Scholar]
- Busch NA, Dubois J, VanRullen R. The phase of ongoing EEG oscillations predicts visual perception. J Neurosci. 2009;29:7869–7876. doi: 10.1523/JNEUROSCI.0113-09.2009. [DOI] [PMC free article] [PubMed] [Google Scholar]
- Buzsáki G, Draguhn A. Neuronal oscillations in cortical networks. Science. 2004;304:1926–1929. doi: 10.1126/science.1099745. [DOI] [PubMed] [Google Scholar]
- Clark VP, Hillyard SA. Spatial selective attention affects early extrastriate but not striate components of the visual evoked potential. J Cogn Neurosci. 1996;8:387–402. doi: 10.1162/jocn.1996.8.5.387. [DOI] [PubMed] [Google Scholar]
- Damoiseaux JS, Rombouts SA, Barkhof F, Scheltens P, Stam CJ, Smith SM, Beckmann CF. Consistent resting-state networks across healthy subjects. Proc Natl Acad Sci U S A. 2006;103:13848–13853. doi: 10.1073/pnas.0601417103. [DOI] [PMC free article] [PubMed] [Google Scholar]
- Debener S, Mullinger KJ, Niazy RK, Bowtell RW. Properties of the ballistocardiogram artefact as revealed by EEG recordings at 1.5, 3 and 7 T static magnetic field strength. Int J Psychophysiol. 2008;67:189–199. doi: 10.1016/j.ijpsycho.2007.05.015. [DOI] [PubMed] [Google Scholar]
- Deco G, Jirsa VK, McIntosh AR. Emerging concepts for the dynamical organization of resting-state activity in the brain. Nat Rev Neurosci. 2011;12:43–56. doi: 10.1038/nrn2961. [DOI] [PubMed] [Google Scholar]
- Delorme A, Makeig S. EEGLAB: an open source toolbox for analysis of single-trial EEG dynamics including independent component analysis. J Neurosci Methods. 2004;134:9–21. doi: 10.1016/j.jneumeth.2003.10.009. [DOI] [PubMed] [Google Scholar]
- De Luca M, Beckmann CF, De Stefano N, Matthews PM, Smith SM. fMRI resting state networks define distinct modes of long-distance interactions in the human brain. Neuroimage. 2006;29:1359–1367. doi: 10.1016/j.neuroimage.2005.08.035. [DOI] [PubMed] [Google Scholar]
- de Munck JC, Gonçalves SI, Huijboom L, Kuijer JP, Pouwels PJ, Heethaar RM, Lopes da Silva FH. The hemodynamic response of the alpha rhythm: an EEG/fMRI study. Neuroimage. 2007;35:1142–1151. doi: 10.1016/j.neuroimage.2007.01.022. [DOI] [PubMed] [Google Scholar]
- Egner T, Monti JM, Trittschuh EH, Wieneke CA, Hirsch J, Mesulam MM. Neural integration of top-down spatial and feature-based information in visual search. J Neurosci. 2008;28:6141–6151. doi: 10.1523/JNEUROSCI.1262-08.2008. [DOI] [PMC free article] [PubMed] [Google Scholar]
- Ergenoglu T, Demiralp T, Bayraktaroglu Z, Ergen M, Beydagi H, Uresin Y. Alpha rhythm of the EEG modulates visual detection performance in humans. Brain Res Cogn Brain Res. 2004;20:376–383. doi: 10.1016/j.cogbrainres.2004.03.009. [DOI] [PubMed] [Google Scholar]
- Feige B, Scheffler K, Esposito F, Di Salle F, Hennig J, Seifritz E. Cortical and subcortical correlates of electroencephalographic alpha rhythm modulation. J Neurophysiol. 2005;93:2864–2872. doi: 10.1152/jn.00721.2004. [DOI] [PubMed] [Google Scholar]
- Fox MD, Snyder AZ, Zacks JM, Raichle ME. Coherent spontaneous activity accounts for trial-to-trial variability in human evoked brain responses. Nat Neurosci. 2006;9:23–25. doi: 10.1038/nn1616. [DOI] [PubMed] [Google Scholar]
- Fox MD, Snyder AZ, Vincent JL, Raichle ME. Intrinsic fluctuations within cortical systems account for intertrial variability in human behavior. Neuron. 2007;56:171–184. doi: 10.1016/j.neuron.2007.08.023. [DOI] [PubMed] [Google Scholar]
- Freyer F, Becker R, Anami K, Curio G, Villringer A, Ritter P. Ultrahigh-frequency EEG during fMRI: pushing the limits of imaging-artifact correction. Neuroimage. 2009;48:94–108. doi: 10.1016/j.neuroimage.2009.06.022. [DOI] [PubMed] [Google Scholar]
- Freyer F, Roberts JA, Becker R, Robinson PA, Ritter P, Breakspear M. Biophysical mechanisms of multistability in resting state cortical rhythms. J Neurosci. 2011;31:6353–6361. doi: 10.1523/JNEUROSCI.6693-10.2011. [DOI] [PMC free article] [PubMed] [Google Scholar]
- Friston K. Learning and inference in the brain. Neural Netw. 2003;16:1325–1352. doi: 10.1016/j.neunet.2003.06.005. [DOI] [PubMed] [Google Scholar]
- Giraud AL, Kleinschmidt A, Poeppel D, Lund TE, Frackowiak RS, Laufs H. Endogenous cortical rhythms determine cerebral specialization for speech perception and production. Neuron. 2007;56:1127–1134. doi: 10.1016/j.neuron.2007.09.038. [DOI] [PubMed] [Google Scholar]
- Goldman RI, Stern JM, Engel J, Jr, Cohen MS. Simultaneous EEG and fMRI of the alpha rhythm. Neuroreport. 2002;13:2487–2492. doi: 10.1097/01.wnr.0000047685.08940.d0. [DOI] [PMC free article] [PubMed] [Google Scholar]
- Gomez Gonzalez CM, Clark VP, Fan S, Luck SJ, Hillyard SA. Sources of attention-sensitive visual event-related potentials. Brain Topogr. 1994;7:41–51. doi: 10.1007/BF01184836. [DOI] [PubMed] [Google Scholar]
- Gonçalves SI, de Munck JC, Pouwels PJ, Schoonhoven R, Kuijer JP, Maurits NM, Hoogduin JM, Van Someren EJ, Heethaar RM, Lopes da Silva FH. Correlating the alpha rhythm to BOLD using simultaneous EEG/fMRI: Inter-subject variability. Neuroimage. 2006;30:203–213. doi: 10.1016/j.neuroimage.2005.09.062. [DOI] [PubMed] [Google Scholar]
- Greicius MD, Krasnow B, Reiss AL, Menon V. Functional connectivity in the resting brain: a network analysis of the default mode hypothesis. Proc Natl Acad Sci U S A. 2003;100:253–258. doi: 10.1073/pnas.0135058100. [DOI] [PMC free article] [PubMed] [Google Scholar]
- Haxby JV, Grady CL, Horwitz B, Ungerleider LG, Mishkin M, Carson RE, Herscovitch P, Schapiro MB, Rapoport SI. Dissociation of object and spatial visual processing pathways in human extrastriate cortex. Proc Natl Acad Sci U S A. 1991;88:1621–1625. doi: 10.1073/pnas.88.5.1621. [DOI] [PMC free article] [PubMed] [Google Scholar]
- Hesselmann G, Kell CA, Eger E, Kleinschmidt A. Spontaneous local variations in ongoing neural activity bias perceptual decisions. Proc Natl Acad Sci U S A. 2008;105:10984–10989. doi: 10.1073/pnas.0712043105. [DOI] [PMC free article] [PubMed] [Google Scholar]
- Huettel SA, McKeown MJ, Song AW, Hart S, Spencer DD, Allison T, McCarthy G. Linking hemodynamic and electrophysiological measures of brain activity: evidence from functional MRI and intracranial field potentials. Cereb Cortex. 2004;14:165–173. doi: 10.1093/cercor/bhg115. [DOI] [PubMed] [Google Scholar]
- Jasiukaitis P, Hakerem G. The effect of prestimulus alpha activity on the P300. Psychophysiology. 1988;25:157–165. doi: 10.1111/j.1469-8986.1988.tb00979.x. [DOI] [PubMed] [Google Scholar]
- Jensen O, Mazaheri A. Shaping functional architecture by oscillatory alpha activity: gating by inhibition. Front Hum Neurosci. 2010;4:186. doi: 10.3389/fnhum.2010.00186. [DOI] [PMC free article] [PubMed] [Google Scholar]
- Klimesch W, Doppelmayr M, Hanslmayr S. Upper alpha ERD and absolute power: their meaning for memory performance. Prog Brain Res. 2006;159:151–165. doi: 10.1016/S0079-6123(06)59010-7. [DOI] [PubMed] [Google Scholar]
- Laufs H, Krakow K, Sterzer P, Eger E, Beyerle A, Salek-Haddadi A, Kleinschmidt A. Electroencephalographic signatures of attentional and cognitive default modes in spontaneous brain activity fluctuations at rest. Proc Natl Acad Sci U S A. 2003;100:11053–11058. doi: 10.1073/pnas.1831638100. [DOI] [PMC free article] [PubMed] [Google Scholar]
- Laufs H, Daunizeau J, Carmichael DW, Kleinschmidt A. Recent advances in recording electrophysiological data simultaneously with magnetic resonance imaging. Neuroimage. 2008;40:515–528. doi: 10.1016/j.neuroimage.2007.11.039. [DOI] [PubMed] [Google Scholar]
- Linkenkaer-Hansen K, Nikulin VV, Palva S, Ilmoniemi RJ, Palva JM. Prestimulus oscillations enhance psychophysical performance in humans. J Neurosci. 2004;24:10186–10190. doi: 10.1523/JNEUROSCI.2584-04.2004. [DOI] [PMC free article] [PubMed] [Google Scholar]
- Logothetis NK, Pauls J, Augath M, Trinath T, Oeltermann A. Neurophysiological investigation of the basis of the fMRI signal. Nature. 2001;412:150–157. doi: 10.1038/35084005. [DOI] [PubMed] [Google Scholar]
- Makeig S, Westerfield M, Jung TP, Enghoff S, Townsend J, Courchesne E, Sejnowski TJ. Dynamic brain sources of visual evoked responses. Science. 2002;295:690–694. doi: 10.1126/science.1066168. [DOI] [PubMed] [Google Scholar]
- Mantini D, Perrucci MG, Del Gratta C, Romani GL, Corbetta M. Electrophysiological signatures of resting state networks in the human brain. Proc Natl Acad Sci U S A. 2007;104:13170–13175. doi: 10.1073/pnas.0700668104. [DOI] [PMC free article] [PubMed] [Google Scholar]
- Mathewson KE, Gratton G, Fabiani M, Beck DM, Ro T. To see or not to see: prestimulus alpha phase predicts visual awareness. J Neurosci. 2009;29:2725–2732. doi: 10.1523/JNEUROSCI.3963-08.2009. [DOI] [PMC free article] [PubMed] [Google Scholar]
- Mazaheri A, Jensen O. Posterior alpha activity is not phase-reset by visual stimuli. Proc Natl Acad Sci U S A. 2006;103:2948–2952. doi: 10.1073/pnas.0505785103. [DOI] [PMC free article] [PubMed] [Google Scholar]
- Mazaheri A, Jensen O. Asymmetric amplitude modulations of brain oscillations generate slow evoked responses. J Neurosci. 2008;28:7781–7787. doi: 10.1523/JNEUROSCI.1631-08.2008. [DOI] [PMC free article] [PubMed] [Google Scholar]
- Mitchell JF, Sundberg KA, Reynolds JH. Spatial attention decorrelates intrinsic activity fluctuations in macaque area V4. Neuron. 2009;63:879–888. doi: 10.1016/j.neuron.2009.09.013. [DOI] [PMC free article] [PubMed] [Google Scholar]
- Moosmann M, Ritter P, Krastel I, Brink A, Thees S, Blankenburg F, Taskin B, Obrig H, Villringer A. Correlates of alpha rhythm in functional magnetic resonance imaging and near infrared spectroscopy. Neuroimage. 2003;20:145–158. doi: 10.1016/s1053-8119(03)00344-6. [DOI] [PubMed] [Google Scholar]
- Nikulin VV, Linkenkaer-Hansen K, Nolte G, Lemm S, Müller KR, Ilmoniemi RJ, Curio G. A novel mechanism for evoked responses in the human brain. Eur J Neurosci. 2007;25:3146–3154. doi: 10.1111/j.1460-9568.2007.05553.x. [DOI] [PubMed] [Google Scholar]
- Nir Y, Fisch L, Mukamel R, Gelbard-Sagiv H, Arieli A, Fried I, Malach R. Coupling between neuronal firing rate, gamma LFP, and BOLD fMRI is related to interneuronal correlations. Curr Biol. 2007;17:1275–1285. doi: 10.1016/j.cub.2007.06.066. [DOI] [PubMed] [Google Scholar]
- Noesselt T, Hillyard SA, Woldorff MG, Schoenfeld A, Hagner T, Jäncke L, Tempelmann C, Hinrichs H, Heinze HJ. Delayed striate cortical activation during spatial attention. Neuron. 2002;35:575–587. doi: 10.1016/s0896-6273(02)00781-x. [DOI] [PubMed] [Google Scholar]
- Raichle ME, MacLeod AM, Snyder AZ, Powers WJ, Gusnard DA, Shulman GL. A default mode of brain function. Proc Natl Acad Sci U S A. 2001;98:676–682. doi: 10.1073/pnas.98.2.676. [DOI] [PMC free article] [PubMed] [Google Scholar]
- Rajagovindan R, Ding M. From prestimulus alpha oscillation to visual-evoked response: an inverted-U function and its attentional modulation. J Cogn Neurosci. 2011;23:1379–1394. doi: 10.1162/jocn.2010.21478. [DOI] [PubMed] [Google Scholar]
- Reinacher M, Becker R, Villringer A, Ritter P. Oscillatory brain states interact with late cognitive components of the somatosensory evoked potential. J Neurosci Methods. 2009;183:49–56. doi: 10.1016/j.jneumeth.2009.06.036. [DOI] [PubMed] [Google Scholar]
- Ritter P, Villringer A. Simultaneous EEG-fMRI. Neurosci Biobehav Rev. 2006;30:823–838. doi: 10.1016/j.neubiorev.2006.06.008. [DOI] [PubMed] [Google Scholar]
- Ritter P, Villringer A, Tomita M, Kanno I, Hamel E. Brain activation and CBF control. Amsterdam: Elsevier; 2002. Inhibition and functional magnetic resonance imaging; pp. 213–222. [Google Scholar]
- Ritter P, Becker R, Freyer F, Villringer A. EEG quality: the image acquisition artefact. In: Mulert C, Lemieux L, editors. EEG-fMRI - Physiological Basis, Technique, and Applications. New York: Springer; 2009a. pp. 153–171. [Google Scholar]
- Ritter P, Moosmann M, Villringer A. Rolandic alpha and beta EEG rhythms' strengths are inversely related to fMRI-BOLD signal in primary somatosensory and motor cortex. Hum Brain Mapp. 2009b;30:1168–1187. doi: 10.1002/hbm.20585. [DOI] [PMC free article] [PubMed] [Google Scholar]
- Romei V, Brodbeck V, Michel C, Amedi A, Pascual-Leone A, Thut G. Spontaneous fluctuations in posterior alpha-band EEG activity reflect variability in excitability of human visual areas. Cereb Cortex. 2008;18:2010–2018. doi: 10.1093/cercor/bhm229. [DOI] [PMC free article] [PubMed] [Google Scholar]
- Scheeringa R, Mazaheri A, Bojak I, Norris DG, Kleinschmidt A. Modulation of visually evoked cortical fMRI responses by phase of ongoing occipital alpha oscillations. J Neurosci. 2011;31:3813–3820. doi: 10.1523/JNEUROSCI.4697-10.2011. [DOI] [PMC free article] [PubMed] [Google Scholar]
- Schroeder CE, Mehta AD, Givre SJ. A spatiotemporal profile of visual system activation revealed by current source density analysis in the awake macaque. Cereb Cortex. 1998;8:575–592. doi: 10.1093/cercor/8.7.575. [DOI] [PubMed] [Google Scholar]
- Schubert R, Ritter P, Wustenberg T, Preuschhof C, Curio G, Sommer W, Villringer A. Spatial attention related SEP amplitude modulations covary with BOLD signal in S1: a simultaneous EEG-fMRI study. Cereb Cortex. 2008;18:2686–2700. doi: 10.1093/cercor/bhn029. [DOI] [PubMed] [Google Scholar]
- Schubert R, Haufe S, Blankenburg F, Villringer A, Curio G. Now you'll feel it, now you won't: EEG rhythms predict the effectiveness of perceptual masking. J Cogn Neurosci. 2009;21:2407–2419. doi: 10.1162/jocn.2008.21174. [DOI] [PubMed] [Google Scholar]
- Thut G, Nietzel A, Brandt SA, Pascual-Leone A. Alpha-band electroencephalographic activity over occipital cortex indexes visuospatial attention bias and predicts visual target detection. J Neurosci. 2006;26:9494–9502. doi: 10.1523/JNEUROSCI.0875-06.2006. [DOI] [PMC free article] [PubMed] [Google Scholar]
- Truccolo WA, Ding M, Knuth KH, Nakamura R, Bressler SL. Trial-to-trial variability of cortical evoked responses: implications for the analysis of functional connectivity. Clin Neurophysiol. 2002;113:206–226. doi: 10.1016/s1388-2457(01)00739-8. [DOI] [PubMed] [Google Scholar]
- Tsodyks M, Kenet T, Grinvald A, Arieli A. Linking spontaneous activity of single cortical neurons and the underlying functional architecture. Science. 1999;286:1943–1946. doi: 10.1126/science.286.5446.1943. [DOI] [PubMed] [Google Scholar]
- Tuch DS, Salat DH, Wisco JJ, Zaleta AK, Hevelone ND, Rosas HD. Choice reaction time performance correlates with diffusion anisotropy in white matter pathways supporting visuospatial attention. Proc Natl Acad Sci U S A. 2005;102:12212–12217. doi: 10.1073/pnas.0407259102. [DOI] [PMC free article] [PubMed] [Google Scholar]
- van Dijk H, Schoffelen JM, Oostenveld R, Jensen O. Prestimulus oscillatory activity in the alpha band predicts visual discrimination ability. J Neurosci. 2008;28:1816–1823. doi: 10.1523/JNEUROSCI.1853-07.2008. [DOI] [PMC free article] [PubMed] [Google Scholar]
- Yantis S, Schwarzbach J, Serences JT, Carlson RL, Steinmetz MA, Pekar JJ, Courtney SM. Transient neural activity in human parietal cortex during spatial attention shifts. Nat Neurosci. 2002;5:995–1002. doi: 10.1038/nn921. [DOI] [PubMed] [Google Scholar]
- Ziehe A, Müller KR, Nolte G, Mackert BM, Curio G. Artifact reduction in magnetoneurography based on time-delayed second-order correlations. IEEE Trans Biomed Eng. 2000;47:75–87. doi: 10.1109/10.817622. [DOI] [PubMed] [Google Scholar]