

Abstract
The study of human brain electrophysiology has extended beyond traditional frequency ranges identified by the classical EEG rhythms, encompassing both higher and lower frequencies. Changes in high-gamma-band (>70 Hz) power have been identified as markers of local cortical activity. Fluctuations at infra-slow (<0.1 Hz) frequencies have been associated with functionally significant cortical networks elucidated using fMRI studies. In this study, we examined infra-slow changes in band-limited power across a range of frequencies (1–120 Hz) in the default mode network (DMN). Measuring the coherence in band-limited power fluctuations between spatially separated electrodes makes it possible to detect small, spatially extended, and temporally coherent fluctuating components in the presence of much larger incoherent fluctuations. We show that the default network is characterized by significant high-gamma-band (65–110 Hz) coherence at infra-slow (<0.1 Hz) frequencies. This coherence occurs over a narrow frequency range, centered at 0.015 Hz, commensurate with the frequency of BOLD signal fluctuations seen by fMRI, suggesting that quasi-periodic, infra-slow changes in local cortical activity form the neurophysiological basis for this network.
Introduction
Increasing interest has been shown in the dynamics of brain activity at very high- and very low-frequency ranges. Changes in high-gamma power (>70 Hz) measured with electrocorticography (ECoG) have been shown to correlate with local cortical activity (Crone et al., 2001; Miller et al., 2007a,b). At the other end of the spectrum, fluctuations at infra-slow frequencies (<0.1 Hz) characterize cortical networks. These networks were discovered using fMRI blood oxygen level-dependent signals and have been shown to be anatomically and functionally distinct (Fox et al., 2005).
One such network, the default mode network (DMN), is of particular interest because (1) it modulates other functional networks, (2) it modulates behavior, and (3) it has been implicated in several pathological states such as dementia and schizophrenia (Fox and Raichle, 2007; Buckner et al., 2008; Hagmann et al., 2008; Broyd et al., 2009; Zhang and Raichle, 2010). The power spectral density (PSD) of this fluctuating BOLD signal exhibits a peak near 0.015 Hz. (Raichle et al., 2001; Fox et al., 2005). Despite the large number of studies using functional connectivity fMRI, the neurophysiological dynamics underlying the BOLD phenomena defining the DMN have not been precisely determined.
Previous electrophysiological studies have measured very-low-frequency fluctuations in power within the traditional frequency bands from EEG recordings, reporting large power variations with 1/f-like power spectra (Linkenkaer-Hansen et al., 2001). ECoG and local field potential studies of correlated high-gamma-band (40–100 Hz) power fluctuations in functional networks also report such 1/f-like dynamics at very low (<0.1 Hz) frequencies (Leopold et al., 2003; Nir et al., 2008). Slow fluctuations (<0.5 Hz) in gamma-band power have been shown to spatially correlate with fMRI BOLD signal from sensorimotor areas (He et al., 2008) but have not yet been shown within the DMN.
We report here spectral coherence of the time-dependent power between ECoG electrodes overlying DMN cortex. We are able to detect a coherent signal in the presence of large power fluctuations that are not simultaneously present in both electrodes because such temporally incoherent fluctuations average out over time, whereas shared spectrally coherent components do not. This coherence appears in the high-gamma band (65–110 Hz) in a narrow frequency range that is consistent with peaks seen in the power spectra of BOLD signal from the same regions, providing a putative neurophysiological basis for these infra-slow fluctuations.
Materials and Methods
Subjects.
Subjects were selected patients undergoing invasive subdural electrode monitoring for seizure localization at Seattle Children's Hospital and Harborview Medical Center (Seattle, WA). Four children and 10 adults were screened for electrode coverage of the DMN. Three female children possessed sufficient electrode coverage of the DMN to allow spectral coherence analysis. We found two male and two female adult subjects with sufficient coverage of medial prefrontal cortex (mPFC) and posterior cingulate cortex (PCc) to allow spectral coherence analysis. Subject details are given in Table 1.
Table 1.
Subject data, sampling rate for recordings, and electrode number and location
| Subject (age/sex) | ICA | Sampling rate (Hz) | Default network electrodes | Electrode locations | Max. gamma-band coherence (Hz) |
|---|---|---|---|---|---|
| S1 | 23 | 500 | 14 | Posterior cingulate | 0.018 |
| (11/F) | (3) | Precuneus | |||
| Cingulate gyrus | |||||
| S2 | 29 | 500 | 1 | Cingulate gyrus | n/a |
| (14/M) | (28) | ||||
| S3 | 38 | 500 | 4 | Middle temporal gyrus | 0.018 |
| (11/F) | (7) | Inferior frontal gyrus | |||
| S4 | 28 | 500 | 3 | Inferior frontal gyrus | 0.015 |
| (7/F) | (24) | Superior frontal gyrus | |||
| S5 | n/a | 250 | 11 | Precuneus | 0.012 |
| (24/M) | Posterior cingulate | ||||
| Cingulate gyrus | |||||
| S6 | n/a | 2000 | 5 | Medial frontal gyrus | — |
| (43/F) | Cingulate gyrus | ||||
| S7 | n/a | 250 | 6 | Posterior cingulate | 0.018 |
| (38/M) | Cingulate gyrus | ||||
| Precuneus | |||||
| S8 | n/a | 500 | 10 | Anterior cingulate | — |
| (20/F) | Medial frontal gyrus | ||||
| Superior frontal gyrus | |||||
| Precuneus | |||||
| Cingulate gyrus |
If applicable, the number of components identified using independent components analysis is indicated (ICA) with the component corresponding to the Default Mode Network indicated in parentheses. The frequency at which maximum gamma-band coherence appears, if seen, is presented in the final column.
ECoG acquisition.
Subdural platinum electrode arrays and strips (Ad-Tech) with 2.3 mm diameter exposed and 10 mm interelectrode distance were implanted. Data were acquired using standard XLTEK clinical system parameters. These impose a high-pass filter on AC-coupled data at about 0.1 Hz. Sampling rates ranged from 250 Hz to 2000 Hz. Data were gathered over a long period (6–23 h) of time, and contiguous seizure- and artifact-free segments were identified. Segments recorded during behavior restricted to the hospital bed were used for analysis. Periods where patients appeared to be asleep as determined by video monitoring were excluded as polysomnography was not available for accurate sleep staging. For each subject, >18,000 s of data were analyzed.
fMRI data acquisition and electrode localization.
Functional MRI data were collected in four subjects at Seattle Children's Hospital according to clinical protocols for language and motor mapping. Imaging was performed using a Siemens 3 tesla (Trio) scanner. Functional MRI was performed using EPIBOLD images (Siemens clinical sequence, ep2d pace), with the following parameters: 36 slices, slice thickness = 3 mm with a 0.75 mm gap, TE = 30 ms, TR = 3820 ms, FA = 90°, FOV = 192 × 192 mm, matrix = 64 × 64. Sixty volumes were obtained per run, resulting in a total time of about 4 min per scan. High-resolution structural T1 (MPRAGE) images were acquired using standard protocols for offline registration.
Images were analyzed using FSL (FMRIB's Software Library) and FEAT (FMRI Expert Analysis Tool) Version 5.92. The following preprocessing steps were applied: motion correction using MCFLIRT, nonbrain removal using BET, spatial smoothing using a Gaussian kernel of FWHM 5 mm, grand-mean intensity normalization of the entire 4D dataset by a single multiplicative factor, and high-pass temporal filtering (Gaussian-weighted least-squares straight line fitting, with σ = 50.0 s). Independent component analysis (multisession temporal concatenation) was performed using probabilistic independent component analysis (Beckmann 2004) as implemented in MELODIC (Multivariate Exploratory Linear Decomposition into Independent Components) Version 3.09 (FMRIB's Software Library). An independent component (IC) representing DMN was identified as a component that (1) presented in all of the following anatomical regions: PCc, mPFC, and bilateral lateral parietal cortex; and (2) had a relatively large power and percentage of explained variance dominated by low-frequency components (< 0.1 Hz). The z-score maps of these ICs were then thresholded at the value of Z = 3.0 and saved as a patient-specific map of the DMN (see supplemental Table 1, available at www.jneurosci.org as supplemental material).
Registration to high-resolution MPRAGE images and electrode localization was performed using the BioImage Suite image analysis software (http://www.bioimagesuite.org) (Papademetris et al., 2006). The average intensity (z-score) over a 5 mm radius sphere centered on each electrode was calculated, and electrodes were determined to overlie the DMN if such intensity was >3. Adult subjects did not have fMRI data or high-resolution CT scans. Surface electrode positions were localized using the LOC package (Miller et al., 2007b), and the DMN was identified anatomically (Damoiseaux et al., 2006).
Spectral coherence.
This technique has been used to characterize 1/f noise fluctuations in resistors (Seidler and Solin, 1996) and is analogous to techniques used by others to study spontaneous fluctuations in ECoG band-limited power (Leopold and Logothetis, 2003; Nir et al., 2008).
ECoG voltage signals were referenced to the common average. FFTs were calculated using the MATLAB fft function after application of a Hanning window to nonoverlapping segments. Our first step was to compute the FFT of each 0.5 s segment of the ECoG signal:
Here, v(t,a) is the time-dependent ECoG voltage from electrode a. Our next step was to compute the corresponding power:
This produced a time-series representation of the average power of each Fourier component of the voltage during each 0.5 s segment. Our next step was to compute the “second spectrum”:
The square of the absolute power of Equation 3 produces a time-series representation of the average power of each Fourier component of the power during each 300 s segment:
The power P1(f1,t1,a) that results from the first FFT is called the first power, or the first spectrum. The power P2(f1,f2,t2,a) that results from the second FFT is called the second power, or the second spectrum. The frequencies f1 and f2 are called the first and second frequencies, respectively; f1 labels the Fourier frequency components of the voltage and f2 labels the Fourier frequency components of the first power. Our first frequency values ranged from 0 Hz to 120 Hz with 2 Hz resolution. These power time series can be averaged across f1 frequencies to form band-limited power time series; in Figure 1, we define a gamma-band-limited power time series, averaging P1 from 70 to 120 Hz. Our second frequency values ranged from 0 Hz to 0.5 Hz with 0.003 Hz resolution.
Figure 1.

Spectral coherence in ECoG recordings reveals evidence of spatially extended, temporally coherent oscillations in the DMN. A, DMN fMRI and electrode localization for a single subject. Electrodes overlying DMN are marked in green. Exemplar electrodes over DMN (D1, D2) and one distant electrode (ND) are indicated. Orange regions indicate cortex from which fMRI BOLD signal is derived. B, Gamma-band (70–120 Hz) second spectral power in D1, D2, and ND electrodes, showing 1/f-like power distribution. Significant peaks in second spectral power at 0.015 Hz would be difficult to identify. C, Gamma-band spectral coherence between DMN (D1–D2) electrodes exhibits a peak around 0.015 Hz, a frequency similar to that seen in the BOLD PSD. Other interactions (D1–ND, D2–ND) do not. The 0.015 Hz peak is clearly seen for this electrode pair. Analyses of grouped electrodes, with statistical confirmation of significance, show similar results (see Fig. 2 and Results).
This information can be represented in a plane where the y-axis represents f1 and the x-axis represents f2. The values across the plane represent how much the power at f1 oscillates at frequency f2. This is an inferred power-to-power coupling because the two frequencies are not measured simultaneously.
We used pooled coherence to characterize all interactions within a group of electrodes as a single interaction. For any pair of spatially separated electrodes a and b, the record-averaged, magnitude-squared cross-power spectral density (CPSD) is
where 〈 〉 represents the average over the entire record of demeaned 300 s segments. Normalizing CPSD by P2 gives the spectral coherence for a given electrode pair. Pooled coherence is
 |
where x is a group of interactions a[lrarr]b numbering k. The resulting record-averaged, magnitude-squared, pooled spectral coherence varied between 0 and 1. Pooled coherence was calculated for default electrodes (DD), where both electrodes lay over DMN cortex, and a group of similarly spaced electrodes that did not overlie default cortex (CON). DD and CON groups had an identical number of electrodes and hence an equivalent number of epochs for pooled coherence calculation. CON electrodes were not chosen with respect to other resting-state networks.
Because all electrodes were recorded simultaneously, parametric methods for determining significant pooled coherence levels are not valid (Amjad et al., 1997). A bootstrapping procedure was used. For each interaction i, the 300 s segments were shuffled. This shuffled order was maintained as pooled coherence was calculated over all interactions in the group, preserving autocorrelations and cross-correlations due to simultaneous recording. For DD and CON electrodes, 2000 and 500 bootstrap samples were used, respectively. Bonferroni correction for multiple comparisons would have required a prohibitive number of bootstrap samples and would have been overly conservative; therefore, the positive false discovery rate (pFDR) was used (Storey and Tibshirani, 2003). This measure assumes that a significant result has been found and returns a false-positive rate (q value) for a given p value.
To examine results across subjects, a histogram was constructed. Significant spectral coherence values with the lowest false-positive rate were totaled across subjects. The percentage of significant values across subjects was used as a measure of the likelihood of finding significant coherence. If this likelihood were identical across all (f1, f2), one can use the binomial distribution to predict an expected number of significant spectral coherence values for any (f1, f2). Deviations from this value are associated with a p value, and histogram values across subjects that are significantly higher than this value, with Bonferroni correction, were determined using the binocdf function in MATLAB as follows:
where h is the histogram value, N the total number of subjects, and TP is the percentage of significant values found across all subjects. The percentages of significant coherence values in the DMN and control groups were 17.37% and 17.44%, respectively.
Results
We looked for coherent fluctuations that (1) correspond spatially with the DMN and (2) occur at a frequency commensurate with the peak seen in the BOLD power spectra derived from DMN cortex.
As seen in Figure 1B, using band-limited power spectra to differentiate DMN and non-DMN electrodes can be difficult, as total power can differ from electrode to electrode and 1/f-like noise may be superimposed upon the more narrow-band signal we are seeking. Spectral coherence, however, can reveal coherent power fluctuations between electrodes overlying DMN cortex that may not be obvious when examining individual power spectra. In Figure 1C, a peak in gamma-band (70–120 Hz) spectral coherence between two distant DMN electrodes is obvious and corresponds to the peak seen in the BOLD signal power spectrum for this subject. This peak is not seen in the DMN to non-DMN interactions.
To make a statistically robust statement about spectral coherence, and to examine all interactions within a group of electrodes simultaneously, we used pooled coherence. Electrodes over DMN cortex (DD) were compared with a control group of electrodes located over nondefault mode network (CON) cortex. These control electrodes were selected to control for interelectrode distance, and both groups contained the same number of electrodes. This addresses the possibility that coherence effects seen in DMN electrodes are due to volume conduction or other distance-dependent phenomena, while controlling for statistical bias by equalizing the number of epochs of data being compared.
We examined spectral coherence for very-low-frequency f2 from 0 to 0.5 Hz with 0.003 Hz resolution of the time-dependent power over the f1 frequency range from 0 to120 Hz with 2 Hz spectral resolution. The location of electrodes and the corresponding spectral coherence for one subject (S3) are shown in Figure 2. There is a clear peak in the BOLD signal PSD near 0.017 Hz. There is also a significant region in gamma-band (65–110 Hz) spectral coherence in DD electrodes at a matching frequency. The CON electrodes do not show a similar peak in the gamma band. The results for all of our fMRI subjects are consistent with the results for this subject. Some, but not all, of the adult subjects show similar distribution of gamma-band coherence in DD electrodes and a similar lack of significant gamma-band coherence in CON electrodes (see supplemental material, available at www.jneurosci.org). This may result from a different method of selecting DD versus CON electrodes in adults who did not have fMRI data available for DMN localization.
Figure 2.

Spectral coherence in ECoG shows significant gamma-band coherence in the DMN and not in non-DMN control electrodes in a single subject: S3. A, DMN fMRI and electrode localization. Electrodes overlying DMN are green. A control group of electrodes (blue) does not overlie DMN cortex. B, BOLD time series derived from DMN cortex marked in orange in A. C, Top, Control group electrodes do not exhibit a clear peak in gamma-band coherence (p = 0.002, q = 0.0076). C, Middle, DMN electrodes show a significant peak in coherence near 0.015 Hz (p = 0.0005, q = 0.0277), which is commensurate with the highest peak (C, bottom) in the BOLD PSD derived from DMN cortex in this subject. Both control and DMN electrodes exhibit spectral coherence throughout the f2 range in the alpha band (f1 = 4–15 Hz). Black contour lines outline areas of significant spectral coherence.
The spectral coherence histogram, pooling data from all of our subjects, is shown in Figure 3. The DMN and control groups each had ∼17% of their coherence values deemed significant. The interesting finding is not the percentage of significant values, but rather the distribution of significant values within the (f1, f2) plane. DD electrode groups exhibit spectral coherence within the gamma band in a narrow f2 frequency range significantly more often than expected if significant coherence values were distributed uniformly across all (f1, f2) values (h = 4, p = 0.007). Significant coherence values are similarly nonuniformly distributed in CON electrode groups (h = 4, p = 0.007), but these significant values are not located within the gamma band. Both groups show considerable spectral coherence when f1 within 4–14 Hz and f2 within 0–0.2 Hz. This is consistent with the well known spatially extended alpha-band activity.
Figure 3.
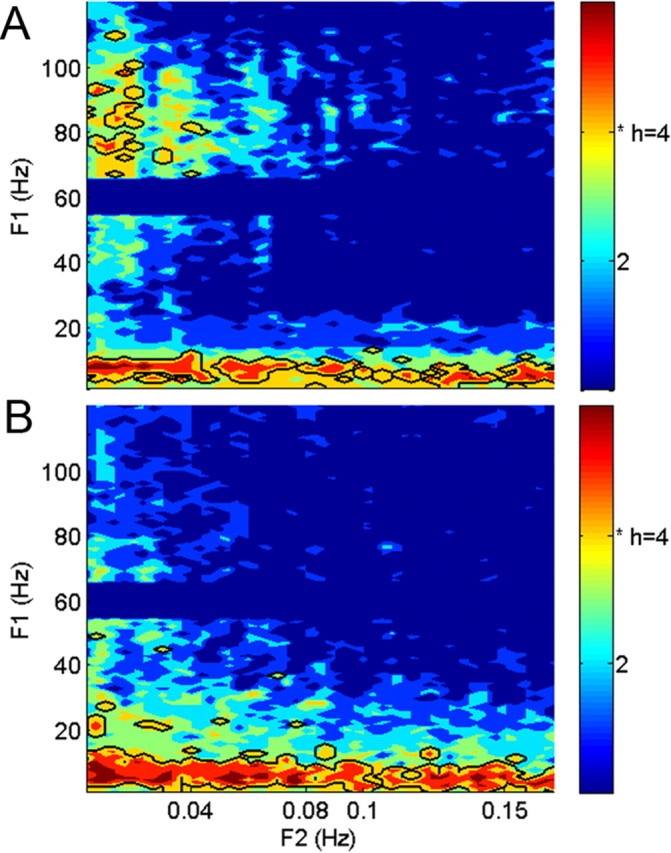
Histograms of significant coherence values across subjects. A, DMN electrodes show significant coherence in the gamma band at an f2 range near 0.017 Hz. Across subjects, this happens more often (h = 4, p = 0.007) than one would expect if significant values were distributed across all (f1, f2) uniformly. Importantly, the frequency range where gamma-band coherence appears is consistent across different individuals. In the alpha band, the pattern of significant coherence is not limited to a narrow f2 range. B, Control electrodes do not show a consistent pattern of significant gamma-band coherence across subjects. However, significant coherence in the alpha-band range is seen throughout the f2 range (h = 4, p = 0.007). Significant gamma-band coherence therefore seems specific to the DMN, whereas the broadband coherence in the alpha band is consistent with correlated 1/f-like fluctuations in power.
Our results show that high-gamma activity is spatially and temporally coherent over the default region, at a narrow f2 frequency band near 0.017 Hz. This is evidence that the DMN is not characterized only by correlations in infra-slow fluctuations of gamma-band power having 1/f-distributed power spectra. Infra-slow changes in gamma band power in the DMN have a specific time scale, with coherent, quasi-periodic fluctuations occurring every 60–70 s.
Discussion
Previous studies of correlated, spontaneous fluctuations in ECoG or EEG have described a 1/f-like power spectrum without a dominant characteristic frequency (Linkenkaer-Hansen et al., 2001; Nir et al., 2008). Our gamma-band power spectra show similar 1/f-like distributions (Fig. 1B). However, our analysis differs significantly, using a lower Nyquist frequency and higher resolution for our infra-slow range (0.5 Hz, 0.003 Hz resolution). We also look for interactions specifically in the frequency domain using spectral coherence. Spectral coherence measurements suppress the incoherent components of the 1/f-like fluctuations, thereby making it possible to observe small spectral coherence signals between pairs of electrodes.
Previous studies examining BOLD fluctuations and electrophysiological signals have identified correlations between to the two using relatively broad frequency ranges. For example, He et al. (2008) used gamma-band-filtered signals at <0.5 Hz to show spatial correlations between BOLD and ECoG fluctuations over sensorimotor cortex, whereas others have found increased correlations in infra-slow components (<0.1 Hz) of gamma-band power when compared with intermediate (0.1–1.0 Hz) or “fast” (>1.0 Hz) fluctuations of spontaneous gamma-band power in auditory cortex (Nir et al., 2008). These frequency ranges are comparatively broadband with respect to the frequency band over which we see increased gamma-band spectral coherence. In our study, for f1 from 65 to 110 Hz, there was a peak in the spectral coherence for electrodes over DMN regions at ∼0.017 Hz, which is consistent with the peak seen in the power spectrum of BOLD signal derived from DMN cortex for each subject.
Interestingly, this gamma-band coherence does not seem to be uniform for f1 >70 Hz, with little significant coherence seen above 110 Hz. The debate regarding the nature of high-gamma activity in the brain has been recently summarized (Crone et al., 2011), with other recent studies (Gaona et al., 2011) contributing to the idea that activity-related changes in high-gamma-band (>60 Hz) power, while a reliable indicator of focal cortical activity, may not be characterized by simple broadband increases in power that are uniform throughout the high-gamma range. Our results add to this debate, illustrating that at infra-slow time scales, high-gamma-band activity may show a nonuniform nature.
The measured spectral coherence for f1 from 4 to 15 Hz with electrodes over the DMN exhibits broadband spectral coherence over the entire f2 range from 0 to 0.5 Hz. In control electrodes, this spectral coherence persists with a similar, broadband pattern. This is consistent with spatially extended alpha activity that has been described. These fluctuations do not have a characteristic time scale, have 1/f-like dynamics, and may reflect self-organized criticality and allow intrinsic stochastic resonance, which may be useful in the rapid detection of stimuli (Linkenkaer-Hansen et al., 2001, 2004; Kleinfeld, 2008). This broadband coherence may also be nonspecific and may be a distance-related phenomenon such as volume conduction.
Our results provide support for the existence of a correlate to the default network fluctuations that have been observed using fMRI. Previous studies have shown (1) that changes in gamma-band power are correlated with the local cortical activity (Crone et al., 2001; Miller et al., 2007b), and (2) that changes in the high-gamma power are functionally consistent with patterns of default network activity (Miller et al., 2009; Jerbi et al., 2010). We report here that (1) DMN cortex exhibits an oscillatory component in gamma-band spectral coherence, (2) the frequency of the fluctuations in the spectral coherence is consistent with the peak in the fMRI BOLD signal, and (3) this peak occurs when ECoG electrodes are over the DMN region and does not appear in similarly spaced, control group electrodes that are not selected to overlie a single resting-state network.
Our study identifies coherent, quasi-periodic activity that was not seen in previous studies, occurring within a narrow-band frequency range. Simultaneous ECoG and fMRI measurements are clearly indicated, but we could not make them at this time. It will be interesting to see whether there are similar peaks in gamma-band coherence associated with other functional networks. Such studies should help clarify the relationship between electrophysiological activity and BOLD fluctuations.
Footnotes
The authors declare no competing financial interests.
References
- Amjad AM, Halliday DM, Rosenberg JR, Conway BA. An extended difference of coherence test for comparing and combining several independent coherence estimates: theory and application to the study of motor units and physiological tremor. J Neurosci Methods. 1997;73:69–79. doi: 10.1016/s0165-0270(96)02214-5. [DOI] [PubMed] [Google Scholar]
- Beckmann CF, Smith SM. Probabilistic independent component analysis for functional magnetic resonance imaging. IEEE Trans Med Imaging. 2004;24:137–152. doi: 10.1109/TMI.2003.822821. [DOI] [PubMed] [Google Scholar]
- Broyd SJ, Demanuele C, Debener S, Helps SK, James CJ, Sonuga-Barke EJ. Default-mode brain dysfunction in mental disorders: a systematic review. Neurosci Biobehav Rev. 2009;33:279–296. doi: 10.1016/j.neubiorev.2008.09.002. [DOI] [PubMed] [Google Scholar]
- Buckner RL, Andrews-Hanna JR, Schacter DL. The brain's default network: anatomy, function, and relevance to disease. Ann NY Acad Sci. 2008;1124:1–38. doi: 10.1196/annals.1440.011. [DOI] [PubMed] [Google Scholar]
- Crone NE, Boatman D, Gordon B, Hao L. Induced electrocorticographic gamma activity during auditory perception. Brazier Award-winning article, 2001. Clin Neurophysiol. 2001;112:565–582. doi: 10.1016/s1388-2457(00)00545-9. [DOI] [PubMed] [Google Scholar]
- Crone NE, Korzeniewska A, Franaszczuk PJ. Cortical gamma responses: searching high and low. Int J Psychophysiol. 2011;79:9–15. doi: 10.1016/j.ijpsycho.2010.10.013. [DOI] [PMC free article] [PubMed] [Google Scholar]
- Damoiseaux JS, Rombouts SA, Barkhof F, Scheltens P, Stam CJ, Smith SM, Beckmann CF. Consistent resting-state networks across healthy subjects. Proc Natl Acad Sci U S A. 2006;103:13848–13853. doi: 10.1073/pnas.0601417103. [DOI] [PMC free article] [PubMed] [Google Scholar]
- Fox MD, Raichle ME. Spontaneous fluctuations in brain activity observed with functional magnetic resonance imaging. Nat Rev Neurosci. 2007;8:700–711. doi: 10.1038/nrn2201. [DOI] [PubMed] [Google Scholar]
- Fox MD, Snyder AZ, Vincent JL, Corbetta M, Van Essen DC, Raichle ME. The human brain is intrinsically organized into dynamic, anticorrelated functional networks. Proc Natl Acad Sci U S A. 2005;102:9673–9678. doi: 10.1073/pnas.0504136102. [DOI] [PMC free article] [PubMed] [Google Scholar]
- Gaona CM, Sharma M, Freudenburg ZV, Breshears JD, Bundy DT, Roland J, Barbour DL, Schalk G, Leuthardt EC. Nonuniform high-gamma (60–500 Hz) power changes dissociate cognitive task and anatomy in human cortex. J Neurosci. 2011;31:2091–2100. doi: 10.1523/JNEUROSCI.4722-10.2011. [DOI] [PMC free article] [PubMed] [Google Scholar]
- Hagmann P, Cammoun L, Gigandet X, Meuli R, Honey CJ, Wedeen VJ, Sporns O. Mapping the structural core of human cerebral cortex. PLoS Biol. 2008;6:e159. doi: 10.1371/journal.pbio.0060159. [DOI] [PMC free article] [PubMed] [Google Scholar]
- He BJ, Snyder AZ, Zempel JM, Smyth MD, Raichle ME. Electrophysiological correlates of the brain's intrinsic large-scale functional architecture. Proc Natl Acad Sci U S A. 2008;105:16039–16044. doi: 10.1073/pnas.0807010105. [DOI] [PMC free article] [PubMed] [Google Scholar]
- Jerbi K, Vidal JR, Ossandon T, Dalal SS, Jung J, Hoffmann D, Minotti L, Bertrand O, Kahane P, Lachaux JP. Exploring the electrophysiological correlates of the default-mode network with intracerebral EEG. Front Syst Neurosci. 2010;4:27. doi: 10.3389/fnsys.2010.00027. [DOI] [PMC free article] [PubMed] [Google Scholar]
- Kleinfeld D. Application of spectral methods to representative datasets in electrophysiology and functional neuroimaging. In: Mitra P, editor. Neural signal processing: quantitative analysis of neural activity. Washington, DC: Society for Neuroscience; 2008. pp. 21–34. [Google Scholar]
- Leopold DA, Logothetis NK. Spatial patterns of spontaneous local field activity in the monkey visual cortex. Rev Neurosci. 2003;14:195–205. doi: 10.1515/revneuro.2003.14.1-2.195. [DOI] [PubMed] [Google Scholar]
- Leopold DA, Murayama Y, Logothetis NK. Very slow activity fluctuations in monkey visual cortex: implications for functional brain imaging. Cereb Cortex. 2003;13:422–433. doi: 10.1093/cercor/13.4.422. [DOI] [PubMed] [Google Scholar]
- Linkenkaer-Hansen K, Nikouline VV, Palva JM, Ilmoniemi RJ. Long-range temporal correlations and scaling behavior in human brain oscillations. J Neurosci. 2001;21:1370–1377. doi: 10.1523/JNEUROSCI.21-04-01370.2001. [DOI] [PMC free article] [PubMed] [Google Scholar]
- Linkenkaer-Hansen K, Nikulin VV, Palva S, Ilmoniemi RJ, Palva JM. Prestimulus oscillations enhance psychophysical performance in humans. J Neurosci. 2004;24:10186–10190. doi: 10.1523/JNEUROSCI.2584-04.2004. [DOI] [PMC free article] [PubMed] [Google Scholar]
- Miller KJ, denNijs M, Shenoy P, Miller JW, Rao RP, Ojemann JG. Real-time functional brain mapping using electrocorticography. Neuroimage. 2007a;37:504–507. doi: 10.1016/j.neuroimage.2007.05.029. [DOI] [PubMed] [Google Scholar]
- Miller KJ, Leuthardt EC, Schalk G, Rao RP, Anderson NR, Moran DW, Miller JW, Ojemann JG. Spectral changes in cortical surface potentials during motor movement. J Neurosci. 2007b;27:2424–2432. doi: 10.1523/JNEUROSCI.3886-06.2007. [DOI] [PMC free article] [PubMed] [Google Scholar]
- Miller KJ, Weaver KE, Ojemann JG. Direct electrophysiological measurement of human default network areas. Proc Natl Acad Sci U S A. 2009;106:12174–12177. doi: 10.1073/pnas.0902071106. [DOI] [PMC free article] [PubMed] [Google Scholar]
- Nir Y, Mukamel R, Dinstein I, Privman E, Harel M, Fisch L, Gelbard-Sagiv H, Kipervasser S, Andelman F, Neufeld MY, Kramer U, Arieli A, Fried I, Malach R. Interhemispheric correlations of slow spontaneous neuronal fluctuations revealed in human sensory cortex. Nat Neurosci. 2008;11:1100–1108. doi: 10.1038/nn.2177. [DOI] [PMC free article] [PubMed] [Google Scholar]
- Papademetris X, Jackowski M, Rajeevan N, Okuda H, Constable RT, Staib LH. BioImage Suite: an integrated medical image analysis suite, Section of Bioimaging Sciences, Dept. of Diagnostic Radiology, Yale School of Medicine. 2006. http://www.bioimagesuite.org. [PMC free article] [PubMed]
- Raichle ME, MacLeod AM, Snyder AZ, Powers WJ, Gusnard DA, Shulman GL. A default mode of brain function. Proc Natl Acad Sci U S A. 2001;98:676–682. doi: 10.1073/pnas.98.2.676. [DOI] [PMC free article] [PubMed] [Google Scholar]
- Seidler GT, Solin SA. Non-Gaussian 1/f noise: experimental optimization and separation of high-order amplitude and phase correlations. Phys Rev B Condens Matter. 1996;53:9753–9759. doi: 10.1103/physrevb.53.9753. [DOI] [PubMed] [Google Scholar]
- Storey JD, Tibshirani R. Statistical significance for genomewide studies. Proc Natl Acad Sci U S A. 2003;100:9440–9445. doi: 10.1073/pnas.1530509100. [DOI] [PMC free article] [PubMed] [Google Scholar]
- Zhang D, Raichle ME. Disease and the brain's dark energy. Nat Rev Neurol. 2010;6:15–28. doi: 10.1038/nrneurol.2009.198. [DOI] [PubMed] [Google Scholar]