

Abstract
The human primary motor cortex (M1) is robustly activated during visually guided hand movements. M1 multivoxel patterns of functional MRI activation are more correlated during repeated hand movements to the same targets than to greatly differing ones, and therefore potentially contain information about movement direction. It is unclear, however, whether direction specificity is due to the motor command, as implicitly assumed, or to the visual aspects of the task, such as the target location and the direction of the cursor's trajectory. To disambiguate the visual and motor components, different visual-to-motor transformations were applied during an fMRI scan, in which participants made visually guided hand movements in various directions. The first run was the “baseline” (i.e., visual and motor mappings were matched); in the second run (“rotation”), the cursor movement was rotated by 45° with respect to the joystick movement. As expected, positive correlations were seen between the M1 multivoxel patterns evoked by the baseline run and by the rotation run, when the two movements were matched in their movement direction but the visual aspects differed. Importantly, similar correlations were observed when the visual elements were matched but the direction of hand movement differed. This indicates that M1 is sensitive to both motor and visual components of the task. However, repeated observation of the cursor movement without concurrent joystick control did not elicit significant activation in M1 or any correlated patterns of activation. Thus, visual aspects of movement are encoded in M1 only when they are coupled with motor consequences.
Introduction
Which parameters are encoded in the primary motor cortex (M1)? The initial findings in awake behaving monkeys (Evarts, 1968) suggested that M1 is mainly involved in encoding muscle force, that is, intrinsic parameters of movement. The seminal work of Georgopoulos and colleagues (1982) in later years indicated that M1 neurons are often tuned to the direction of limb movement in space and, therefore, encode extrinsic parameters. Since then, accumulating evidence has suggested that M1 encodes both intrinsic and extrinsic parameters of movement (Scott and Kalaska, 1997; Sergio and Kalaska, 1997, 2003; Kakei et al., 1999), and therefore is likely to be involved in a sensorimotor transformation. For example, using a visuomotor rotation task, which introduces a constant angular difference between the motor trajectory of the hand and its viewed trajectory on the screen, Alexander and colleagues showed that M1 neurons are sensitive to the target position on the screen (Alexander and Crutcher, 1990; Shen and Alexander, 1997a). Furthermore, the sensitivity of neurons in M1 to sensory stimuli often depends on their functional relevance: when the color of a visual cue carried crucial information to indicate the required hand movement, a considerable fraction of M1 neurons (20%) displayed color sensitivity (Zach et al., 2008).
We have previously shown, using event-related functional magnetic resonance imaging, that the multivoxel pattern of activation in human M1 conveys information about the direction of hand movement (Eisenberg et al., 2010). In that experiment, participants performed a “center–out” task in which they had moved a cursor to equidistant targets on the screen, using a joystick. The resulting multivoxel activation patterns in M1 were more correlated during similar direction movements than dissimilar ones. Note, however, that this sensitivity to the direction of movement may stem from the motor command to the hand, but it could also be due to the covarying visual (and attentive) aspects of the task, such as the target location or the cursor trajectory. To that end, following Shen and Alexander (1997a), we designed an fMRI experiment that allowed separation of the visual elements of the task from its motor aspects. First, participants completed a “baseline” center–out run, in which the visual and motor components matched. Next, they were introduced with a rotation perturbation, in which the observed cursor trajectory was consistently rotated 45° counterclockwise (CCW) with respect to the hand movement. After practicing the task for a few minutes, participants completed a full rotation run while being scanned. We then compared the elicited multivoxel pattern activations in M1 during the baseline run and the rotation run. We found that similar hand movements elicited positive correlations between the evoked multivoxel patterns, as expected. More important, conditions that shared the same cursor trajectory and target location but differed in their hand movements also elicited similar positive correlations. On the other hand, there was no evidence for sensitivity to cursor direction in M1 when participants passively viewed all visual aspects of the task (in the absence of joystick control). This suggests that the visual aspects of hand movement are encoded in M1 only when they are tightly coupled with motor consequences.
Materials and Methods
Participants.
Twenty-three right-handed volunteers with normal or corrected-to-normal visual acuity and no neurological or psychiatric history (13 women and 10 men, aged 18–35 years) participated in the present experiments. Five of the participants were excluded from further analysis for various reasons (see below). The experimental procedure was approved by the Hadassah Ein Kerem Medical Center Ethics Committee. Written informed consent was obtained from each participant before the scan.
MRI acquisition.
The BOLD fMRI measurements were performed in a whole-body 3T TRIO SIEMENS scanner. The fMRI protocols were based on a multislice gradient echo-planar imaging and a baseline head coil. The functional data were obtained using the following parameters: TR = 2000 ms, TE = 30 ms, flip angle = 90°, imaging matrix = 64 × 64, voxel size = 2.75 × 2.75 × 3.1 mm. The 30–35 slices (with gap of 0.3 mm) were oriented in the axial position. The scan covered the whole brain. Each of the two functional runs comprised 616 volumes and contained 250 trials.
Experimental paradigm.
The experimental design is the same as described in our previous study (Eisenberg et al., 2010). Seventeen participants were scanned while carrying out a center–out reaching task. Using an MRI-compatible joystick, they moved a cursor from the center toward five different targets located in the periphery. The baseline center–out reaching task was composed of 250 trials. Next, the participants practiced for ∼10 min (inside the scanner) on the visuomotor rotation task, in which the cursor was rotated by 45° CCW with respect to the hand movement. Thus, for the cursor to move toward the target, participants had to move the joystick toward the neighboring (clockwise) target without seeing their hand. The participants had adapted to this new mapping rule implicitly. After the participants reached the targets successfully, they were scanned again while carrying out another 250 “rotation” trials (Fig. 1). Each of the five movement directions (i.e., 0, 45, 90, 135, and 180°) was performed 50 times in each run during the course of two 20 min rapid event-related fMRI scans.
Figure 1.

Experimental design. Trial flow (left to right): each trial started with the presentation of a red circle at the center of a screen (“origin”). Then, 0.5 s later, five circles appeared in the periphery, four blue circles and one green circle, which indicated the future target position. The red “origin” changed its color to white 2 s later, instructing the participant to move the cursor (the white circle) toward the target (green circle). The participant had 1.5 s to complete the movement. In the baseline run (top), the cursor movements matched the joystick direction (joystick forward led to upward cursor movement, etc.). In the rotation run, however, to bring the cursor to the target (white line), participants had to move the joystick 45° to the right (dashed white line).
Each trial lasted 4 s. The trial began with a red circle at the center of the screen (“origin”) (Fig. 1). At this stage, the participants had to hold the MRI-compatible joystick still and make no hand movement. After an interval of 500 ms, five circles appeared at the upper half of the screen, spread around the center at equal distances, between 0° and 180°, at steps of 45°. Four of the circles were blue and one circle was green, signaling the required future direction of movement. The participants had to keep their hand still for 2 s until the red “origin” circle turned into a white cursor. They were instructed to respond by moving the cursor toward the green target using the joystick. Participants had 1.5 s to reach the target. Upon reaching the target, all circles disappeared. This served as a cue for the participants to release the joystick (by relaxing the spring), which resulted in the joystick returning to its starting position at the center. There was no explicit failure signal. If the participants did not reach the target within the 1.5 s time limit, all circles disappeared and the next trial began. There were also intermittent null trials (2–8 s long), in which the red origin and all five blue circles appeared on the screen (thus no target was distinctly marked for movement). These trials were obviously not followed by a “go” signal. During these null trials, the participants were instructed not to move the joystick until the next trial began.
The order of the movement trials in each run was counterbalanced (first order) and embedded with null trials of various lengths using OptSeq software. The different lengths of the null trials were used as jittered intertrial intervals to allow a more efficient estimation of activation (Dale, 1999). The total length of all null trials was equal to the total length of each of the five movement conditions (50 trials × 4 s each = 200 s). Each run began and ended with 16 s of a null event. The task was programmed with MATLAB version 7.1 (MathWorks), using Psychtoolbox (Brainard, 1997; Pelli, 1997).
Throughout the session, participants were lying in the supine position inside the scanner, holding the joystick with their right hand while the targets and cursor were projected onto a screen in front of them using a projector (Epson MP 7200). The screen was made visible to the participants through a tilted mirror above their faces. Due to their posture, participants were not able to see their hand or the joystick during the experiment. Note that in this setting, participants were moving the joystick in the horizontal plane, and the targets and the cursor were observed on the screen in the vertical plane. Therefore, the observed cursor movement was in a different location than the actual hand movement, even in the “baseline” condition. However, learning this mapping is almost immediate, as it is similar to our everyday experience, for example, moving the cursor on the computer screen using a mouse.
Observation paradigm.
We ran a control study on six naive participants, in which they only observed the cursor movements of a center–out task. The cursor movements toward the target were a recording of earlier joystick-induced movements made by the experimenter. During this task, participants were instructed not to move their hands, so that any BOLD activation would be due to mere observation. Participants were instructed to covertly rate the accuracy of the cursor movement on each trial (between 1 and 3, where 3 was most accurate) to require them to pay attention to the cursor movement while avoiding any motor actions. To ensure that they performed the task correctly and were indeed paying attention, two of the participants were scanned for an extra 4 min run, in which they performed the ranking by pushing buttons of an MRI-compatible response box. The two participants rated the accuracy of movement almost identically (r = 0.91, p < 0.0001), and their ratings were significantly negatively correlated with the angular error of movement trajectory [the angle between the actual movement direction at peak velocity and the required one; r (subject 1) = −0.47, r (subject 2) = −0.48, p < 0.005]. The session was composed of one observation run (125 trials), then a baseline run with the joystick (250 trials), followed by another observation run (125 trials).
MT localizer.
Three of the six control participants were scanned during an MT localizer task. The scan included “stationary” condition blocks, in which stationary concentric white rings were shown at a low contrast, and “motion” blocks, during which rings were alternately expanding and contracting (in 4 s cycles). The task began with a 33 s stationary block, followed by 12 interleaved “motion” and “stationary” blocks, each lasting 12 s. The scan ended with a 15 s stationary block. In total, the length of the scan was 5:24 min. Participants were instructed to maintain fixation on a red dot in the center of the screen throughout the scan.
Data analysis.
Preprocessing and defining regions of interest (ROIs) were done using Brain Voyager QX (Brain Innovation). The first two functional images of each run were discarded to allow for stabilization of the signal. The images were superimposed on two-dimensional anatomical images and incorporated into the three-dimensional datasets through trilinear interpolation. Before statistical analysis, head motion correction and high-pass temporal filtering in the frequency domain (three cycles/total scan time) were applied to remove drifts and to improve the signal-to-noise ratio. The complete dataset was transformed into Talairach space and Z-normalized.
Next, we applied the deconvolution method to extract the underlying BOLD response function (the deconvolution kernel, consisting of 10 β weights) for each condition from the acquired signal. This method is described in detail in our previous study (Eisenberg et al., 2010). Note that this method makes no a priori assumptions about the shape of the hemodynamic response function. This analysis resulted in an estimate of the kernel response amplitudes for 10 independent time points (2 before the trial, 2 during the trial, and 6 after each condition).
Regions of interest.
Cortical regions involved in the visuomotor reaching task were individually defined based on joint functional and anatomical criteria, applied separately in each participant. The functional criterion for each M1 voxel was the presence of significantly higher BOLD activation during the movement trials (regardless of direction) than during null trials [p < 0.01, false discovery rate (FDR) correction] in the baseline run for all participants (including both test and control groups) according to deconvolution analysis. Active voxels were included in the M1 ROI if they were within a spatially contiguous cluster in the anterior side of the central sulcus of the contralateral (left) hemisphere.
Voxels putatively belonging to the human medial temporal ROI (hMT+) were defined in the control group based on the “observation” run (GLM, observed cursor movements in all directions > rest; p < 0.01, FDR correction). The location of hMT+ was verified in three of the six participants by running an independent MT localizer, using a direct contrast between “movement” and “stationary” conditions (GLM, p < 0.01, FDR correction). The average Talairach coordinates of hMT+ ROI in the observation runs (across three participants) were as follows: X = 42, Y = 66, Z = −3. This corresponded well with its location during the hMT+ localizer scan in the same participants: X = 40, Y = −67, Z = −1.
Analysis of spatial patterns of fMRI response.
The criteria for inclusion of participants in further analysis were that they successfully reached the target in at least 80% of the trials and that the fMRI activation elicited in M1 was above threshold (p < 0.01 after FDR correction) in at least 50 functional voxels. Five of the participants were excluded from further analysis on these grounds (three failed to reach the target in >20% of the trials, and two elicited insufficient fMRI activation).
Further analysis was done using MATLAB R2007b (MathWorks). We applied the deconvolution method on each of the two runs separately and estimated the hemodynamic response (β weights) for each movement direction in each voxel separately. The activation level (per direction) was defined by the mean of the β weights 6 and 8 s after the beginning of the trials (4–6 s after movement initiation, which generally corresponded to the peak activation). Then, to remove activation differences between voxels that were unrelated to movement direction, in each dataset and for each voxel, we centered the extracted activation level for each direction by subtracting the voxel's mean activation level (across all directions). This analysis resulted in two matrices, one for each run. Each matrix consisted of five columns, one for each direction, with its length equal to the number of voxels in the ROI. The entries in each row of the matrices were the five centered activation values of a single voxel for the five directions of movement.
Next, we calculated the correlation coefficient (CC) between the columns of the baseline and the rotation run (each corresponding to the pattern of activation across all voxels for a given condition). If the estimated β weights contained information about the direction of movement, we expected to find a higher CC for vectors that represent movements to the same direction (in the two datasets) compared with the CC calculated for two different directions. Because the CCs were between baseline movements and rotated cursor movements, we could distinguish between conditions that shared the same hand movement and those with the same visual aspects (i.e., target location and cursor trajectory).
The CCs between compared movements typically drop with increased angular difference (Eisenberg et al., 2010). Because the rotation angle was rather small (45°), the positive CCs between trials of “same” target locations could be caused by the similar (although not identical) hand movements. To control for this possibility, we calculated the correlations between neighboring movement directions (−45°; CW instead of CCW) in which the visual aspects of the task (target location and cursor trajectories) differed by 90°. These CCs served as a “target control” group. Similarly (although highly unlikely), a positive CC between same hand movements could result from the fact that the two movements have similar target locations (separated by only 45°). The correlations between neighboring targets (−45°) with different hand movements (separated by 90°) served as “movement control.” To assess the statistical significance of the correlations, we applied the Fisher's z transformation to the CCs (thereby converting the CC values into a normally distributed variable amenable for parametric statistical testing) and then used paired t tests across participants to compare the visual and the motor CCs with their control CCs. Finally, in the separate “observation” scan, performed in a smaller control group (n = 6), the CCs between “observation” runs for same movements versus different movements were compared using the nonparametric Wilcoxon rank-sum test.
Analysis of accurate trajectories.
Despite some practice that participants had before the rotation run, trajectories in some rotation trials tended to be slightly curved. This could possibly lead to presumed visual correlations between a given rotation run and its corresponding baseline run, which are actually due to hand movement. To minimize these effects, we repeated the correlation analysis using only the more accurate trials. To that end, we divided the trials of each direction in the rotation run into two groups of 25 trials each according to their accuracy. Accuracy was determined by the angular error of movement trajectory at peak velocity. Trials were classified as “inaccurate” when the angular error was larger than the participant's median. Trials in which the target was not reached within the time limit were considered to have large angular errors regardless of actual trajectory curvature. The mean cutoff angular error was 11.4°. The baseline run was not divided into large and small errors because movements in this run were relatively straight. The β weights of the rotation run were estimated using the 25 most accurate movements of each participant in each direction.
Informativeness of voxels about motor and visual aspects of the reaching task.
Do the visual and motor correlations for similar movements largely result from the activation patterns of the same set of voxels, or are there two separate subgroups of voxels, one selective for visual components and the other for motor components? To study this, we calculated two measures for each voxel based on its sensitivity to the motor and visual aspects of the task. The motor informativeness (Im) measure was defined as
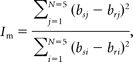 |
where bs denotes peak activation during the baseline run, br denotes peak activation during the rotation run, and i denotes the direction of hand movement. Thus, bsi − bri is the difference between activation values during the baseline run and the rotation run while making the same hand movement; j denotes direction of the “movement control” (45° CW from the target direction) such that bsj − brj is the difference in activation values for the control condition. Thus, if the direction of hand movement is the only factor determining the voxel's fMRI activation, the motor informativeness is maximal. Visual informativeness (Iv) was calculated in the same way:
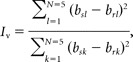 |
where k denotes target direction and l denotes the direction of “target control” (45° CCW from movement direction). Both measures were used to split the data into the more informative and less informative halves of the voxel population, in two different ways, according to the motor and visual criteria, respectively.
Results
Twelve participants were scanned while carrying out a center–out reaching task in an fMRI experiment. Using an MRI-compatible joystick, they moved a cursor from the center toward five different targets located in the periphery (between 0° and 180°). The baseline center–out reaching task comprised 250 trials (50 in each direction). Next, the participants practiced the visuomotor rotation task, in which the cursor was rotated 45° CCW with respect to the hand movement. After a short practice period, in which the participants learned to reach the targets successfully, they were scanned again while performing 250 “rotation” trials (Fig. 1). The target was reached successfully in 93.6% of the trials in the baseline run and in 92.9% in the rotation run. The mean absolute error at peak velocity was 8.4° for baseline runs and 11.7° for rotation runs.
Within each run, the time course of activation for each voxel in M1 was analyzed using the deconvolution method, allowing assessment of the activation profile (β weights) generated by each of the five directions of movements. For each voxel, the average of the β weights measured 6 s and 8 s after the beginning of the trial, which usually corresponded to the peak activation, served as the parameter of activation level for each direction. This activation level (per voxel, per direction) was centered by subtracting the voxel's mean response across directions.
Multivoxel pattern analysis
We have previously reported that M1 voxels typically display sensitivity to movement direction (Eisenberg et al., 2010). This selectivity could arise from the direction of hand movement, but it could also be due to the covarying visual elements of the task (i.e., the direction of the cursor trajectory and/or target location). To distinguish between these possibilities, we calculated the CC between the multivoxel activation patterns elicited by two movements, one from the “baseline” run and the other from the “rotation” run (Fig. 2a). The resulting correlation matrix is shown in Figure 2c. Note that in the “rotation” run, the visual attributes were rotated by 45° CCW compared with the hand movements. This allowed assessment of the effect of hand movement and visual attributes separately from one another. Specifically, entries along the main diagonal of the matrix (Fig. 2c, depicted in blue) represent the CCs between same target directions that differ in the directions of hand movement. The entries along the next diagonal (in green) specify the CCs between movements in the same direction that differ in their target position and cursor trajectories. In both cases, all entries are positive and the average CC (across participants and matching conditions) is significantly greater than zero (motor: t(11) = 3.34, p < 0.01; visual: t(11) = 4.3, p < 0.005) (Fig. 2d). This suggests that both motor and visual directional cues (in the context of the task) are encoded in the patterns of activation across M1 voxels. However, because the rotation angle was small (45°), the positive CCs between trials of “same” target locations may be caused by the similar (although not identical) hand movements. Indeed, we previously reported that the patterns of activation for hand movements separated by 45° are still positively correlated (Eisenberg et al., 2010). To control for this possibility, we calculated the correlations between neighboring movement directions (45° difference) that do not share the same target location and cursor trajectories (“target control”, compare with “target alignment” condition; Fig. 2a). A direct comparison between the CCs evoked by the visual match alignments (“target”) and the corresponding control alignment (“target control”) showed that the CC difference between the two alignments was indeed significant (paired t test; t(11) = 4.28, p < 0.005). Thus, M1 voxels contain genuine information about the visual components of the task.
Figure 2.

Multivoxel spatial patterns of activation contain information about target (and cursor) direction as well as hand movement direction. a, An example showing the procedure of alignment of movements in the baseline run (black arrows denote hand movement and cursor trajectory), with movements during the rotation run (green arrows denote hand movement, blue arrows denote cursor trajectory, and the gray circles denote target location). When the movements are aligned according to the direction of joystick movement (“movement alignment,” left), the baseline and rotation run share the motor component (green arrow) but differ in their visual components (target position and cursor direction). Similarly, during “target alignment” (third column), the two conditions share the same visual components but differ in their motor aspects (by 45°, shaded wedge). In the “movement control” alignment (second column), both visual and motor aspects were different in the two runs. Note, however, that the target position in the rotation run was displaced by 45° (CW) compared with its position in the baseline run, as in the “movement alignment” condition (45°, CCW). Similarly, in the “target control” alignment, the movements in the baseline and rotation runs differed by 45°, as in the target alignment condition (compare the wedges caused by the green arrows). b, Examples of the multivoxel activation patterns (see color code) in M1 (axial plane, Talairach coordinates: z = 54) during baseline trials (toward 135°; left) and during rotation trials in which movement was toward 135° (top right; CC between the two patterns was 0.32); the target was toward 135° (middle right; CC = 0.39), and the target was toward 90° (movement control; bottom right, CC= −0.25). c, Matrix of mean CCs (across participants) between multivoxel patterns of the “baseline” and “rotation” datasets for all possible direction combinations. The main diagonal (blue) shows the “target aligned” CC values, the green diagonal shows CCs between “movement aligned” conditions, the values in the purple diagonal are the “movement control” CCs, and the ones along the red diagonal are the “target control” CCs. d, Mean CCs across participants and across directions for the different conditions (same color coding as in a–c). “Movement aligned” CCs are significantly larger than the “movement control” CC values (p < 0.01) and “target aligned” CCs are significantly greater than “target control” values (p < 0.005). Error bars denote SEM over participants.
Similarly (although highly unlikely), a positive CC between same hand movements may result from the fact that the two movements have similar target locations (separated only by 45°). Not surprisingly, the CC for “movement” alignments was significantly higher than during “movement control” alignments (t(11) = 3.16, p < 0.01).
The effects of trial accuracy
Another issue of concern is that despite the practice in the “rotation” trials before the scan, participants may not be fully adapted and, therefore, might show a consistent bias toward the “baseline” movement direction. Indeed, the distribution of errors in the rotation trials (Fig. 3b) was slightly skewed toward positive errors (mean angular error ± mean SD across participants = 7.37 ± 13.57°). Although this effect is clearly minor compared with the 45° angle difference, it could still possibly lead to presumed visual correlations between a given rotation run and its corresponding baseline run, which are actually due to hand movement. To minimize these effects, we recalculated the CCs between baseline and rotation runs, taking into account only the 25 most accurate trials for each direction in the “rotation” run (now the mean angular error at peak velocity ± mean SD across participants was 2.78 ± 9.9°). The resulting multivoxel patterns in M1 still show significantly positive correlations when the rotation run matched the baseline run in both the motor (t(11) = 5.1, p < 0.0005) and visual (t(11) = 3.48, p < 0.01) alignments (“movement” and “target” comparisons in Fig. 3c, respectively). These correlations were also significantly greater than their corresponding control alignments (paired t test; motor: t(11) = 4.22, p < 0.005; visual: t(11) = 3.5, p < 0.005).
Figure 3.

Accurate and inaccurate movement trajectories. a, Example of cursor trajectories for the “baseline” (top) and “rotation” (bottom) conditions from one participant in all five directions. Gray trajectories denote trials that were labeled “inaccurate movements” (according to their angular error at peak velocity). Failed trials were excluded. b, Histogram of the angular errors made during rotation trials (collapsed across all directions and across all participants). Gray columns denote the angular errors of “inaccurate” trials. c, Mean CCs, computed for accurate trials only, across participants and across directions for the different conditions. Movement CCs are significantly larger than movement control values (p < 0.005). “Target aligned” CCs are still significantly higher than the “target control” values (p < 0.005). Error bars denote SEM across participants.
The sensitivity to visual aspects in M1
Having found that M1 voxels contain information about the visual aspects of the task, we were intrigued whether similar encoding of visual aspects would also occur in the absence of any hand movement, and whether the participants learn to associate the cursor movements with specific hand movements through prior visuomotor experience. To that end, we conducted a control experiment on six new participants, in which they passively observed the visual display of prerecorded cursor trajectories toward the target without making any hand movements. To ensure that participants paid attention to these cursor trajectories, they were instructed to judge the accuracy of the cursor movements. The session was composed of one “naive” observation run (125 trials, before the cursor–joystick associations were made), then a baseline run, during which participants used the joystick to move the cursor toward the targets (250 trials), followed by another (“postvisuomotor”) observation run (125 trials).
We found little evidence for significant M1 activation during either observation run (both before and after visuomotor training). Consequently, the signal-to-noise ratio of the individual voxels was very poor. Indeed, during observation runs, the time course of only 6% of the voxels in M1 was significantly correlated with the estimated time course (based on the extracted deconvolution kernels), compared with 89% of the voxels when the same procedure was applied during the baseline movement runs. Not surprisingly, therefore, the correlations between the observation runs and the corresponding baseline runs (when the matched conditions shared the same direction) were not different from zero according to a Wilcoxon rank-sum test (W(5) = 32, z = −1.12, p = 0.31), and neither were the CCs between the two observation runs (W(5) = 36, z = −0.48, p = 0.7) (Fig. 4b, solid line). In contrast, when the baseline run was divided into two datasets, CCs elicited by same-direction movements were significantly higher than during different-direction movements (W(5) = 21, z = −2.88, p = 0.002; Fig. 4b, dashed line). In visual motion sensitive hMT+, the voxels' BOLD activation in the two “observation” runs was statistically significant (Fig. 4c), and the patterns of multivoxel activations were significantly more correlated when the observed cursor trajectories were in the same direction than when they were in different directions (W(5) = 21, z = −2.88, p = 0.002; Fig. 4d). Together, these results indicate that the lack of correlation between observation runs in M1 was not due to inattention or lack of vigilance (for further information, see Materials and Methods section Observation paradigm). The mere presence of specific visual attributes (i.e., target location and cursor trajectory) is therefore not enough to generate the visual-based correlations between baseline and rotation runs. The visual attributes seem to be represented in M1 only when they are coupled to the movement itself. This may reflect aspects that are inherent to the visuomotor task (such as movement planning or online visual feedback) that are obviously essential during both baseline and rotation conditions but are absent in the observation task.
Figure 4.

The multivoxel patterns of activation during observation trials toward the same direction are correlated in hMT+, but not in M1. a, Example of one voxel's temporal course of activation (β values) for the five directions of hand movement in M1 (shown in dark arrows). The dashed lines denote “baseline” movement activation levels, and the solid lines denote activation elicited during “observation” trials. Black and gray colors denote the first and second dataset, respectively. Note the characteristic robust fMRI activation during movement trials that is totally lacking in the observation trials. b, The CCs between the patterns of activation in M1 elicited during the first and second datasets. The dashed line describes the CC as a function of the angular difference in the directions of movement, showing clear direction selectivity. In contrast, during the observation trials, the CCs are close to zero and independent of the angular difference between the directions of cursor trajectory (solid line). c, Example of a typical hMT+ voxel's activation time course (β values) for the five directions (denoted by dark arrows) during the first (black) and second (gray) observation runs. Note the robust fMRI response for the visual aspects of the task that are totally lacking in M1. d, The CCs between the first and second observation runs as a function of angular difference between the directions of cursor trajectory in hMT+. Unlike in M1 (solid line in b), we see clear direction tuning.
Voxel sensitivity measures for the visual and movement aspects are independent
Are individual voxels that carry information about the direction of movement more informative about the visual aspects as well? If so, this would suggest that M1 neurons may be sensitive to both aspects, or at least that the modality-exclusive neuronal populations that are sensitive to visual aspects are in close proximity to populations sensitive to movement (i.e., within a voxel). To that end, we selected half of the voxels that were more informative about movement direction and tested the degree to which their pattern of activation can convey information about the visual properties of the trial. The results are shown in Figure 5 (left panel). As expected, selection of the highly informative “motor” voxels increased the motor CCs (from 0.26 to 0.41; t(11) = 2.69, p < 0.0005), but importantly, it did not improve the visual CCs (0.21 vs 0.15; t(11) = 1.58, p > 0.1). Similarly, we selected the visually informative voxels and tested their sensitivity to the direction of hand movement (Fig. 5, right panel). Again, selection of voxels with a high measure of visual informativeness increased the visual CCs significantly (from 0.21 to 0.37; t(11) = 5.5, p < 0.05), but it did not affect motor CCs (0.26 vs 0.25; t(11) = 0.6, p > 0.5). Thus, whereas visual and motor directional aspects of visually guided reaching movements are represented in the multivoxel patterns of human M1, the visual and motor representations seem to be independent from one another.
Figure 5.

Motor and visually sensitive voxel populations within M1 are independent. The more selective voxels for movement and for the visual aspects of the task were independently chosen (see Materials and Methods). The resulting correlation coefficients (across all participants) between “baseline” and “rotation” sessions, using the motor-selective voxels (left panel) or the visually selective voxels (right panel), are depicted in light gray bars. Dark bars in both panels show the original results using all M1 voxels (as in Fig. 2d). Error bars denote SEM across participants. Notice the elevated correlation of the motor selective voxels in the movement-matched condition (“movement”; light gray), compared with the original results (“movement”; dark bar). Importantly, the correlation in the visually matched conditions (“target”; left panel) does not change significantly beyond its original value (compare “target” light and dark bars). Similarly, a higher correlation is seen during the visually matched trials (“target”) in the visually selective voxels (right panel), without a concomitant drop in the correlation during the movement matched trials (“movement”). The two voxel populations, therefore, do not entirely overlap, nor are they mutually exclusive.
Discussion
We found that the multivoxel patterns of activation in M1 during visually guided reaching movements carry information about both the direction of hand movement (as implicitly assumed; Eisenberg et al., 2010), as well as the visual elements of reaching. These findings are consistent with previous studies of single neurons in monkeys (Alexander and Crutcher, 1990; Lurito et al., 1991; Shen and Alexander, 1997a). The relevant visual aspects, however, are represented in M1 only when directly coupled with movement and do not play a role when the same viewed actions are passively seen (e.g., in the visual playback “observation” task).
A recent fMRI study (Dinstein et al., 2008) has demonstrated that multivoxel patterns of activation in M1 (during a rock–paper–scissors game) contain information about the executed hand configuration. The same voxels, however, do not contain information about observed hand configurations. This is also consistent with another study in M1 (Chouinard and Goodale, 2009), which found fMRI adaptation (repetition suppression) to movement but not to the features of the cue that were irrelevant to the required response.
However, our results are seemingly in contradiction with a couple of electrophysiological studies in monkeys: Merchant et al. (2001), who reported that M1 neurons modulated their activity in response to optic flow stimuli in different directions, and Suminski et al. (2009), who found that visual playback of reaching actions is enough to elicit directional tuning in M1 neurons. It is likely that the fMRI signal may be too crude to detect neuronal features that are seen in a minority of the neuronal population.
Ruling out alternative explanations
Humans tend to make eye movements toward the target during visually guided reaching movements (Gielen et al., 1984; Abrams et al., 1990; Ariff et al., 2002). Thus, the “visual” sensitivity of the multivoxel patterns to the target location may actually reflect an oculomotor sensitivity to the target-specific eye movements and not the target location itself. This is highly unlikely because the oculomotor regions are distinctly separate from the hand-related regions in M1: it is generally accepted that the primary areas of representation of eye movements are the frontal eye fields (Chen and Wise, 1995; Passingham, 1995). Indeed, the single neurons in monkey M1 that are sensitive to reaching direction (Mushiake et al., 1997) are not modulated by changes in gaze direction. Similarly, regions in human M1 whose BOLD activation is modulated by pointing are not sensitive to the direction of gaze (DeSouza et al., 2000). Still, to rule out this alternative, we analyzed data from a recent fMRI study by Pertzov et al. (2011), in which participants made saccades in various directions toward remembered targets. We found no significant saccade-induced activation or positive CCs for same-saccade directions in the hand-specific M1 (i.e., the current study ROI) in a participant who took part in both studies. We conclude that target-specific eye movements are unlikely to explain the visual selectivity of the multivoxel patterns to the target location.
What are the relevant visual features in the display driving M1?
The visual aspects that affect the pattern of activation across M1 voxels could be related either to target location or to the cursor trajectory. There is some evidence that neurons in monkey M1 are sensitive to the location (or other features) of the visual cue (Zhang et al., 1997; Zach et al., 2008; Saleh et al., 2010). However, previous fMRI studies in humans (Toni et al., 1999; Stark and Zohary, 2008; Chouinard and Goodale, 2009), which contained a visual target or a visual cue, did not show any visually induced M1 activation. Unlike these previous studies, our reaching task required continuous visual feedback in addition to the registration of target location. Perhaps the cursor feedback is more relevant than the target location to the visual representation within M1. Another explanation for this discrepancy could be that we used multivoxel pattern analysis, which can detect differences in representation that other methods (used in the past studies) that measure the mean activation or adaptation over all M1 voxels may miss.
Alternative interpretations
We stress that the online visual feedback and the cue are likely to affect the activation patterns in M1. However, another possibility is that because the baseline mapping is more intuitive than the rotation mapping, learning the rotated mapping does not totally abolish the baseline mapping but, rather, a novel mapping is established in parallel to the baseline mapping and overrides the existing default representation. If this is indeed the case, the activation elicited during rotation trials represents not only the newly acquired mapping but also the baseline (unperturbed) mapping. Thus, the visual correlations we observed may in fact stem from a subthreshold (unexecuted) retained motor program that is activated when the cue is presented. There is some evidence that M1 is in fact involved in the retention of the previous motor program. Activation of M1 using transcranial direct current stimulation (Galea et al., 2010) during rotation learning led to a slower rate of forgetting of the newly learned visuomotor transformation. Conversely, disruption of M1 activity using transcranial magnetic stimulation resulted in a faster rate of forgetting of the newly learned transformation (Hadipour-Niktarash et al., 2007). In any case, even if the visually induced correlations are in fact a result of a remnant motor program, it is important to stress that this program is activated by a visual cue, which is associated with a motor action.
The motor correlations seen in M1 may also stem from the proprioceptive reafferent signals rather than the afferent motor signals. Indeed, Rossetti et al. (1995) have shown that displacement of one's viewed finger location by the use of prisms biases pointing to visual targets by only a third of the true prismatic shift. This suggests that proprioception plays a role in planning movements as well as vision. In addition, Suminski et al. (2010) have shown that adding proprioceptive information (about the hand position), congruent with the visual information, improves the control of a cursor driven by activity of M1 neurons (in a brain–machine interface). Because we do not dissociate motor and proprioceptive components of the task, we cannot rule out the possibility that the proprioceptive signal contributes, at least in part, to the motor correlations in M1.
The sensitivity of other motor cortical areas
Previous studies in monkeys (Shen and Alexander, 1997b; Cisek et al., 2003) have shown that neurons in dorsal premotor cortex (PMd) were more sensitive to the visual aspects of the task than M1. We found no evidence for this is our study. There were no significant visual correlations in PMd (motor correlations were also much lower). One reason for this discrepancy may be that in our study M1 voxels displayed a much stronger BOLD activation than the other motor areas. The poor signal-to-noise ratio in other areas would clearly mask any possibility of observing strong motor or visual correlations in secondary motor areas. Therefore, the level of visual correlations does not necessarily reflect accurately the amount of “visual” neurons in each area. Indeed, Dinstein et al. (2008) found, using a similar multivoxel pattern analysis in a different motor task, that both motor and visual representations of the action can be found in the anterior intraparietal sulcus (IPS). Interestingly, as in our study, there seemed to be little correspondence between the two representations in anterior IPS: decoding level of the executed movements after training the classifier to distinguish between the observed movements was indistinguishable from chance.
Summary and future outlook
We have shown that both movement direction and visual aspects of the task are independently represented in regions encoding hand movements within M1.
It would be interesting to know whether this reflects a change in the single unit preference as the trial unfolds. Lurito et al. (1991) showed that at the population level, M1 neurons tend to change their tuning throughout the trial such that initially they are sensitive to the target location, and later they become sensitive to the direction of hand movement, as has been shown by Shen and Alexander (1997a). With the current temporal resolution of fMRI, we could not detect this temporal drift. This remains to be shown by separating different epochs of the trials, using paradigms that allow separation of movement planning from movement execution.
Footnotes
This research was supported by the Israel Science Foundation Grant 39/09 to E.Z. and the Maydan scholarship provided to M.E. We thank Eldad Assa for programming the task.
References
- Abrams RA, Meyer DE, Kornblum S. Eye-hand coordination: oculomotor control in rapid aimed limb movements. J Exp Psychol. 1990;16:248–267. doi: 10.1037//0096-1523.16.2.248. [DOI] [PubMed] [Google Scholar]
- Alexander GE, Crutcher MD. Neural representations of the target (goal) of visually guided arm movements in three motor areas of the monkey. J Neurophysiol. 1990;64:164–178. doi: 10.1152/jn.1990.64.1.164. [DOI] [PubMed] [Google Scholar]
- Ariff G, Donchin O, Nanayakkara T, Shadmehr R. A real-time state predictor in motor control: study of saccadic eye movements during unseen reaching movements. J Neurosci. 2002;22:7721–7729. doi: 10.1523/JNEUROSCI.22-17-07721.2002. [DOI] [PMC free article] [PubMed] [Google Scholar]
- Brainard DH. The psychophysics toolbox. Spatial Vis. 1997;10:433–436. [PubMed] [Google Scholar]
- Chen LL, Wise SP. Supplementary eye field contrasted with the frontal eye field during acquisition of conditional oculomotor associations. J Neurophysiol. 1995;73:1122–1134. doi: 10.1152/jn.1995.73.3.1122. [DOI] [PubMed] [Google Scholar]
- Chouinard PA, Goodale MA. fMRI adaptation during performance of learned arbitrary visuomotor conditional associations. Neuroimage. 2009;48:696–706. doi: 10.1016/j.neuroimage.2009.07.020. [DOI] [PubMed] [Google Scholar]
- Cisek P, Crammond DJ, Kalaska JF. Neural activity in primary motor and dorsal premotor cortex in reaching tasks with the contralateral versus ipsilateral arm. J Neurophysiol. 2003;89:922–942. doi: 10.1152/jn.00607.2002. [DOI] [PubMed] [Google Scholar]
- Dale AM. Optimal experimental design for event-related fMRI. Hum Brain Mapp. 1999;8:109–114. doi: 10.1002/(SICI)1097-0193(1999)8:2/3<109::AID-HBM7>3.0.CO;2-W. [DOI] [PMC free article] [PubMed] [Google Scholar]
- DeSouza JF, Dukelow SP, Gati JS, Menon RS, Andersen RA, Vilis T. Eye position signal modulates a human parietal pointing region during memory-guided movements. J Neurosci. 2000;20:5835–5840. doi: 10.1523/JNEUROSCI.20-15-05835.2000. [DOI] [PMC free article] [PubMed] [Google Scholar]
- Dinstein I, Gardner JL, Jazayeri M, Heeger DJ. Executed and observed movements have different distributed representations in human aIPS. J Neurosci. 2008;28:11231–11239. doi: 10.1523/JNEUROSCI.3585-08.2008. [DOI] [PMC free article] [PubMed] [Google Scholar]
- Eisenberg M, Shmuelof L, Vaadia E, Zohary E. Functional organization of human motor cortex: directional selectivity for movement. J Neurosci. 2010;30:8897–8905. doi: 10.1523/JNEUROSCI.0007-10.2010. [DOI] [PMC free article] [PubMed] [Google Scholar]
- Evarts EV. Relation of pyramidal tract activity to force exerted during voluntary movement. J Neurophysiol. 1968;31:14–27. doi: 10.1152/jn.1968.31.1.14. [DOI] [PubMed] [Google Scholar]
- Galea JM, Vazquez A, Pasricha N, Orban de Xivry JJ, Celnik P. Dissociating the roles of the cerebellum and motor cortex during adaptive learning: the motor cortex retains what the cerebellum learns. Cereb Cortex. 2010 doi: 10.1093/cercor/bhq246. [DOI] [PMC free article] [PubMed] [Google Scholar]
- Georgopoulos AP, Kalaska JF, Caminiti R, Massey JT. On the relations between the direction of two-dimensional arm movements and cell discharge in primate motor cortex. J Neurosci. 1982;2:1527–1537. doi: 10.1523/JNEUROSCI.02-11-01527.1982. [DOI] [PMC free article] [PubMed] [Google Scholar]
- Gielen CC, van den Heuvel PJ, van Gisbergen JA. Coordination of fast eye and arm movements in a tracking task. Exp Brain Res. 1984;56:154–161. doi: 10.1007/BF00237452. [DOI] [PubMed] [Google Scholar]
- Hadipour-Niktarash A, Lee CK, Desmond JE, Shadmehr R. Impairment of retention but not acquisition of a visuomotor skill through time-dependent disruption of primary motor cortex. J Neurosci. 2007;27:13413–13419. doi: 10.1523/JNEUROSCI.2570-07.2007. [DOI] [PMC free article] [PubMed] [Google Scholar]
- Kakei S, Hoffman DS, Strick PL. Muscle and movement representations in the primary motor cortex. Science. 1999;285:2136–2139. doi: 10.1126/science.285.5436.2136. [DOI] [PubMed] [Google Scholar]
- Lurito JT, Georgakopoulos T, Georgopoulos AP. Cognitive spatial–motor processes. Exp Brain Res. 1991;87:562–580. doi: 10.1007/BF00227082. [DOI] [PubMed] [Google Scholar]
- Merchant H, Battaglia-Mayer A, Georgopoulos AP. Effects of optic flow in motor cortex and area 7a. J Neurophysiol. 2001;86:1937–1954. doi: 10.1152/jn.2001.86.4.1937. [DOI] [PubMed] [Google Scholar]
- Mushiake H, Tanatsugu Y, Tanji J. Neuronal activity in the ventral part of premotor cortex during target-reach movement is modulated by direction of gaze. J Neurophysiol. 1997;78:567–571. doi: 10.1152/jn.1997.78.1.567. [DOI] [PubMed] [Google Scholar]
- Passingham RE. New York: Oxford UP; 1995. The frontal lobes and voluntary action: [Google Scholar]
- Pelli DG. The VideoToolbox software for visual psychophysics: transforming numbers into movies. Spatial Vis. 1997;10:437–442. [PubMed] [Google Scholar]
- Pertzov Y, Avidan G, Zohary E. Multiple reference frames for saccadic planning in the human parietal cortex. J Neurosci. 2011;31:1059–1068. doi: 10.1523/JNEUROSCI.3721-10.2011. [DOI] [PMC free article] [PubMed] [Google Scholar]
- Rossetti Y, Desmurget M, Prablanc C. Vectorial coding of movement: vision, proprioception, or both? J Neurophysiol. 1995;74:457–463. doi: 10.1152/jn.1995.74.1.457. [DOI] [PubMed] [Google Scholar]
- Saleh M, Reimer J, Penn R, Ojakangas CL, Hatsopoulos NG. Fast and slow oscillations in human primary motor cortex predict oncoming behaviorally relevant cues. Neuron. 2010;65:461–471. doi: 10.1016/j.neuron.2010.02.001. [DOI] [PMC free article] [PubMed] [Google Scholar]
- Scott SH, Kalaska JF. Reaching movements with similar hand paths but different arm orientations. 1. Activity of individual cells in motor cortex. J Neurophysiol. 1997;77:826–852. doi: 10.1152/jn.1997.77.2.826. [DOI] [PubMed] [Google Scholar]
- Sergio LE, Kalaska JF. Systematic changes in directional tuning of motor cortex cell activity with hand location in the workspace during generation of static isometric forces in constant spatial directions. J Neurophysiol. 1997;78:1170–1174. doi: 10.1152/jn.1997.78.2.1170. [DOI] [PubMed] [Google Scholar]
- Sergio LE, Kalaska JF. Systematic changes in motor cortex cell activity with arm posture during directional isometric force generation. J Neurophysiol. 2003;89:212–228. doi: 10.1152/jn.00016.2002. [DOI] [PubMed] [Google Scholar]
- Shen L, Alexander GE. Neural correlates of a spatial sensory-to-motor transformation in primary motor cortex. J Neurophysiol. 1997a;77:1171–1194. doi: 10.1152/jn.1997.77.3.1171. [DOI] [PubMed] [Google Scholar]
- Shen L, Alexander GE. Preferential representation of instructed target location versus limb trajectory in dorsal premotor area. J Neurophysiol. 1997b;77:1195–1212. doi: 10.1152/jn.1997.77.3.1195. [DOI] [PubMed] [Google Scholar]
- Stark A, Zohary E. Parietal mapping of visuomotor transformations during human tool grasping. Cereb Cortex. 2008;18:2358–2368. doi: 10.1093/cercor/bhm260. [DOI] [PubMed] [Google Scholar]
- Suminski AJ, Tkach DC, Hatsopoulos NG. Exploiting multiple sensory modalities in brain–machine interfaces. Neural Netw. 2009;22:1224–1234. doi: 10.1016/j.neunet.2009.05.006. [DOI] [PMC free article] [PubMed] [Google Scholar]
- Suminski AJ, Tkach DC, Fagg AH, Hatsopoulos NG. Incorporating feedback from multiple sensory modalities enhances brain–machine interface control. J Neurosci. 2010;30:16777–16787. doi: 10.1523/JNEUROSCI.3967-10.2010. [DOI] [PMC free article] [PubMed] [Google Scholar]
- Toni I, Schluter ND, Josephs O, Friston K, Passingham RE. Signal-, set- and movement-related activity in the human brain: an event-related fMRI study. Cereb Cortex. 1999;9:35–49. doi: 10.1093/cercor/9.1.35. [DOI] [PubMed] [Google Scholar]
- Zach N, Inbar D, Grinvald Y, Bergman H, Vaadia E. Emergence of novel representations in primary motor cortex and premotor neurons during associative learning. J Neurosci. 2008;28:9545–9556. doi: 10.1523/JNEUROSCI.1965-08.2008. [DOI] [PMC free article] [PubMed] [Google Scholar]
- Zhang J, Riehle A, Requin J, Kornblum S. Dynamics of single neuron activity in monkey primary motor cortex related to sensorimotor transformation. J Neurosci. 1997;17:2227–2246. doi: 10.1523/JNEUROSCI.17-06-02227.1997. [DOI] [PMC free article] [PubMed] [Google Scholar]