

Abstract
Human neuronal circuits undergo life-long functional reorganization with profound effects on cognition and behavior. Well documented prolonged development of anatomical brain structures includes white and gray matter changes that continue into the third decade of life. We investigated resting-state EEG oscillations in 1433 subjects from 5 to 71 years. Neuronal oscillations exhibit scale-free amplitude modulation as reflected in power-law decay of autocorrelations—also known as long-range temporal correlations (LRTC)—which was assessed by detrended fluctuation analysis. We observed pronounced increases in LRTC from childhood to adolescence, during adolescence, and even into early adulthood (∼25 years of age) after which the temporal structure stabilized. A principal component analysis of the spatial distribution of LRTC revealed increasingly uniform scores across the scalp. Together, these findings indicate that the scale-free modulation of resting-state oscillations reflects brain maturation, and suggests that scaling analysis may prove useful as a biomarker of pathophysiology in neurodevelopmental disorders such as attention deficit hyperactivity disorder and schizophrenia.
Introduction
Neuronal oscillations reflect a wide diversity of neuronal network functions and have been linked to perceptual and cognitive processing (Buzsáki, 2006; Kahana, 2006; Jokisch and Jensen, 2007; Palva and Palva, 2007). Under the task instruction of resting with eyes closed, the human brain generates complex patterns of oscillatory activity, which can be measured by electroencephalography (EEG). This simple experimental protocol is a standard in preclinical research and has been used to study developmental changes from early childhood and onwards (Thatcher et al., 2008). Previous research on developmental trends in EEG has focused on changes in peak frequency and power of the constituent oscillations, as well as (phase)-synchronization between spatially distinct neuronal populations (Thatcher et al., 2008; Uhlhaas et al., 2009, 2010; Smit et al., 2010). Recent data indicate that the amplitude modulation of these ongoing oscillations carries different (complementary) information about the functional state of the neuronal networks generating the EEG. Therefore, it may provide additional insight into the functional reorganization of the brain throughout life (Linkenkaer-Hansen et al., 2007).
The amplitude modulation of neuronal oscillations exhibits long-range temporal correlations (LRTC) with an autocorrelation function that decays according to a power-law: ρ(t) = t−γ, where γ is the power-law exponent and t is the time-delay in the autocorrelation (Linkenkaer-Hansen et al., 2001). Exponent γ can be estimated from the autocorrelation function or power spectrum of the time series, however, detrended fluctuation analysis (DFA) has proven to be a particularly robust and alternative method for studying LRTC in brain activity (Peng et al., 1995; Linkenkaer-Hansen et al., 2001). DFA analysis of resting state brain oscillations revealed that the strength of LRTC—reflected in γ—shows marked individual differences and has a strong genetic component (Linkenkaer-Hansen et al., 2007). In addition, the obtained exponents were shown to differ between controls and patients with depression (Linkenkaer-Hansen et al., 2005), epilepsy (Parish et al., 2004; Monto et al., 2007), or early-stage Alzheimer's disease (Montez et al., 2009). Importantly, in these previous studies on LRTC in normal subjects and patients, either no or very weak association between LRTC and power of oscillations has been observed. Thus, the power-law decay of temporal correlations in ongoing oscillations has become a candidate biomarker in preclinical research on altered brain dynamics in adults.
Here, we investigate whether LRTC provide a sensitive index of brain development in a large population-based sample of subjects. We analyzed scalp EEG from 1433 subjects, covering critical ages of childhood, adolescence, and adulthood. We observed that the power-law exponent shows marked changes until ∼25 years of age after which it stays relatively stable for at least another 25 years. Our findings indicate that the scale-free modulation of resting-state oscillations is sensitive to brain maturation, which suggests that scaling analysis may prove useful for studying pathophysiology in neurodevelopmental disorders such as attention deficit hyperactivity disorder (ADHD) and schizophrenia.
Materials and Methods
Subjects and conditions.
The studies were approved by the national medical ethical review board. Informed consent was obtained from all subjects (adults), or their parents. All experiments were conducted in accordance with the principles expressed in the Declaration of Helsinki.
Data were collected as part of an ongoing study into the genetics of brain development and cognition. A total number of 1675 individuals (twins and additional siblings) accepted an invitation for extensive EEG measurement and behavioral testing. For the present analyses, EEG data recorded during 3–4 min of eyes-closed rest were available from six measurement waves representing six age groups (mean ages ∼5, ∼7, ∼16, ∼18, ∼25, and ∼50 years; age range 4.9–71.0 years). For the childhood and adolescent age groups only twins participated. For the adult age groups singleton siblings were additionally invited. On average, 2.5 family members participated. Part of the data consisted of longitudinal measurements between 5 and 7 and between 16 and 18 years. In addition, some of the subjects aged 16/18 returned as part of age group 25. In total, this study analyzed 2540 EEG recordings. Table 1 shows the structure of the final subject set after data cleaning (n = 1433) used for the present study and the average ages for each age group. To test for significance of age effects on LRTC, we split the data into the six age groups based on age of the twins at time of measurement. These groups had average ages of 5.3, 6.8, 16.1, 17.6, 26.2, and 49.4, and were named 5, 7, 16, 18, 25, and 50.
Table 1.
Sizes and average age for each of the six age groups, and longitudinal overlap between the age groups
| Age group |
|||||||||
|---|---|---|---|---|---|---|---|---|---|
| 5 | 7 | 16 | 18 | 25 | 50 | ||||
| N | 366 | 378 | 426 | 387 | 396 | 356 | |||
| Overlap | 332 | 387 | 103 | ||||||
| Mean age (SD) | 5.27 (0.19) | 6.79 (0.19) | 16.06 (0.55) | 17.57 (0.55) | 26.18 (4.15) | 49.45 (7.20) | |||
N represents the total number of subjects with data available after EEG data cleaning. Overlap represents the number of subjects with data available at both ages. Age is in years.
EEG acquisition and preprocessing.
Due to the long time span of the project, three different EEG systems were used. The childhood (5 and 7) and adolescent (16 and 18) EEG were recorded with tin electrodes in an ElectroCap connected to a Nihon Kohden PV-441A polygraph with time constant 5 s (corresponding to a 0.03 Hz high-pass filter) and low-pass of 35 Hz, digitized at 250 Hz using an in-house built 12-bit A/D converter board and stored for offline analysis. Leads were Fp1, Fp2, F7, F3, F4, F8, C3, C4, T5, P3, P4, T6, O1, O2, and bipolar horizontal and vertical EOG derivations. Electrode impedances were kept below 5 kΩ. Following the recommendation by Pivik et al. (1993), tin earlobe electrodes (A1, A2) were fed to separate high-impedance amplifiers, after which the electrically linked output signals served as reference to the EEG signals. Sine waves of 100 μV were used for calibration of the amplification/AD conversion before measurement of each subject.
Young adult and middle-aged EEG was recorded with Ag/AgCl electrodes mounted in an ElectroCap. Signal registration was conducted using an AD amplifier developed by Twente Medical Systems for 657 subjects and NeuroScan SynAmps 5083 amplifier for 103 subjects. Standard 10–20 positions were F7, F3, F1, Fz, F2, F4, F8, T7, C3, Cz, C4, T8, T5, P3, Pz, P4, T6, O1 and O2. For subjects measured with NeuroScan also Fp1, Fp2, and Oz were recorded. The vertical electro-oculogram (EOG) was recorded bipolarly between two Ag/AgCl electrodes, affixed 1 cm below the right eye and 1 cm above the eyebrow of the right eye. The horizontal EOG was recorded bipolarly between two Ag/AgCl electrodes affixed 1 cm left from the left eye and 1 cm right from the right eye. An Ag/AgCl electrode placed on the forehead was used as a ground electrode. Impedances of all EEG electrodes were kept below 3 kΩ, and impedances of the EOG electrodes were kept below 10 kΩ. The EEG was amplified, digitized at 250 Hz, and stored for offline processing.
The overlapping set of 12 electrodes was selected for further analysis (F3, F4, F7, F8, C3, C4, P3, P4, T5, T6, O1, and O2). All EEG was individually inspected. Bad channels or channels with excessive artifacts were removed. Episodes with artifacts and suspected drowsiness (and sleep) were removed. Next, EEG signals were broadband filtered 1–37 Hz followed by an extended independent component analysis decomposition (Lee et al., 1999). Components reflecting blinks and eye movement were identified based on visual inspection of the trace, high loading onto frontal electrodes, and high correlation with EOG signal, and removed.
LRTC.
To study long-range temporal correlations in the amplitude modulation of ongoing oscillations, the data were preprocessed follows. First, the signals were bandpass filtered using a 6 dB roll-off zero phase shift FIR filter in the theta (3.0–5.7 Hz), alpha (6.0–13.0 Hz), and beta (15.0–25.0 Hz) bands. Note that the lower edge of the alpha band was chosen below the classical 8 Hz, because the average oscillation peak frequency showed an increase from childhood into adulthood from 8.1–9.8 Hz as determined from grand average power spectra for the left occipital electrode O1 (Boersma et al., 2011). A lower level of 6.0 Hz included all individual peak frequencies for the 5-year-olds. The amplitude envelope of the filtered oscillations was extracted using the Hilbert transform (Nikulin and Brismar, 2005).
The autocorrelation function provides a noisy estimate of the decay of correlations with increasing time scales compared with the DFA method (Kantelhardt et al., 2001), which was developed by Peng et al. (1995). Therefore, we used the DFA method as in most recent papers investigating the autocorrelation structure of amplitude fluctuations in ongoing oscillations (e.g., Linkenkaer-Hansen et al., 2001; Parish et al., 2004; Nikulin and Brismar, 2005; Monto et al., 2007; Poil et al., 2008; Berthouze et al., 2010). Figure 1A illustrates how the modulation of EEG alpha oscillations (∼10 Hz) with examples of weak, medium, and strong LRTC time series. Figure 1B illustrates the resulting DFA regression. More specifically, the DFA was implemented as follows. The mean of each signal was subtracted and the cumulative sum of the signals computed. For a window of specified size, the linear trends of the cumulative signal were removed by subtracting the least-squares regression line. Next, the root-mean-square (RMS) of these residuals was calculated and averaged across all adjacent nonoverlapping windows fitting the signal. This procedure was repeated for logarithmically and equidistantly increasing window sizes from 1.5 s to 20 s. The lower bound was chosen to avoid temporal correlations introduced by the filters. The upper bound was chosen to allow ∼10 independent samples for the upper RMS deviation score as is commonly used for DFA (Chen et al., 2002), including previous papers on LRTC in oscillations (e.g., Linkenkaer-Hansen et al., 2001; Nikulin and Brismar, 2005). The DFA exponent was defined as the slope of the linear regression line between the log10 transformed window sizes and the log10 transformed averaged RMS scores.
Figure 1.
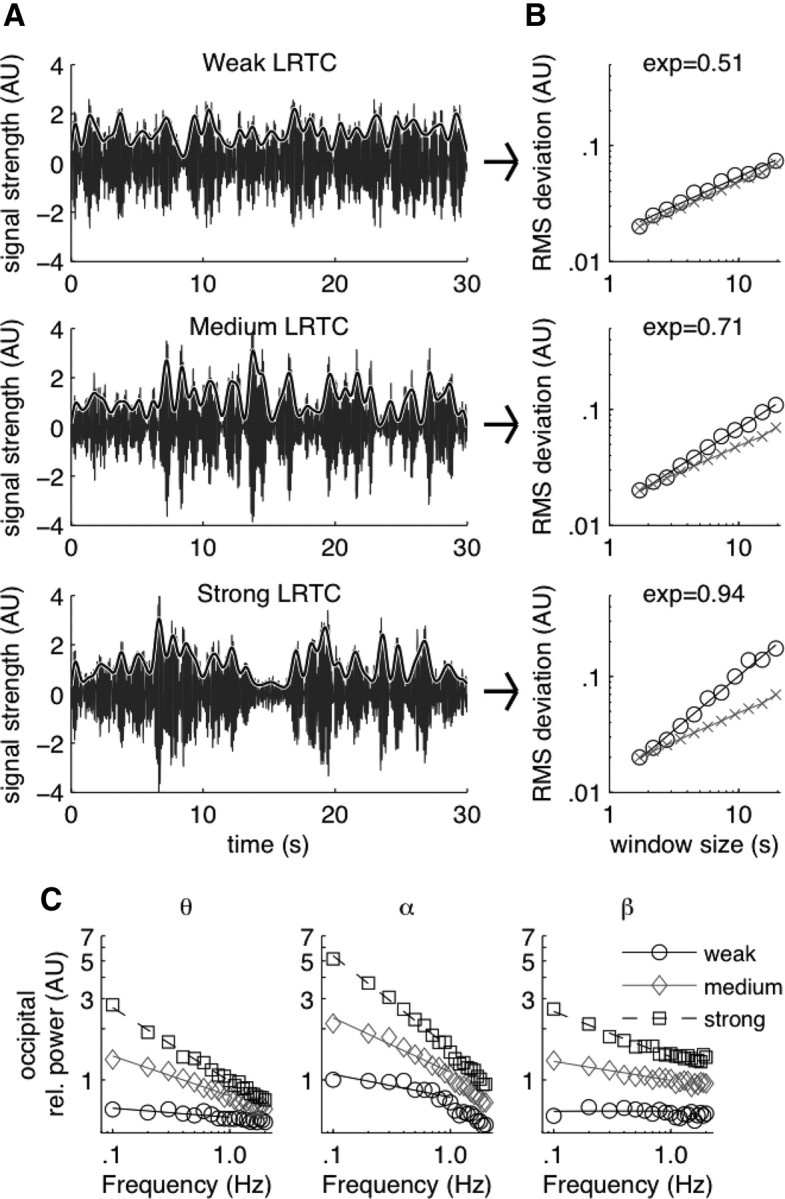
LRTC analysis with DFA provides a quantitative index of the scale-free modulation of the amplitude modulation of neuronal oscillations. A, To illustrate the sensitivity of DFA to the amplitude modulation of neuronal oscillations, we show examples of bandpass-filtered EEG signals (6–13 Hz), which have been normalized to unit variance of 1 and zero mean, for three subjects: weak (top), medium (middle), and strong (bottom) LRTC (representative samples from channel O2). To emphasize the difference in amplitude modulation on long time scales, the amplitude envelope is shown low-pass filtered at 1.0 Hz (gray lines). B, The fluctuation function in DFA is calculated from the amplitude envelope by computing the cumulative sum and subtracting linear trends (“detrending”) before calculating the root-mean-square (RMS) in a given window size. The DFA exponent is the slope of the line in log-log space of RMS deviation against window size, and varies between 0.5 (temporally uncorrelated fluctuations, or “white noise”) to 1.0 (highly autocorrelated fluctuations, or 1/f noise). C, To further illustrate the relation between DFA exponents and amplitude modulation, we calculated power spectra of the amplitude envelope (gray lines in A) around theta (left), alpha (middle) and beta (right) oscillations. The effects of filtering were removed by dividing each spectrum by the average obtained from 200 spectra of filtered random white noise. Subjects were aggregated into groups having weak (○), medium (◇), and strong (□) LRTC and the resulting grand-average spectra plotted in log-log space. To avoid clutter the weak, medium, and strong LRTC spectra are shifted vertically, which does not affect the following observations. A straight line regression for <1.0 Hz modulation reveals good linear fit illustrating the power-law nature of slow EEG modulation. The oscillations with high DFA exponents (i.e., strong LRTC) are associated with the steepest regression lines, which indicates that their amplitudes are more strongly modulated at low frequencies relative to high frequencies than it is the case for oscillations with lower DFA exponents.
Although reliability is hard to establish without retesting, the MZ correlation of DFA exponents may serve as a lower limit. In the 18-year-olds, this lower limit ranged from 0.33–0.60 for theta, alpha, and beta oscillations across the scalp (for details, see Linkenkaer-Hansen et al., 2007, their Table 1). The finite amount of data available is also a source of variation in DFA. Using simulated time series equivalent in length to those used here (3 min at 250 Hz or 45.000 samples), a SD in DFA exponents of ∼0.02 was reported (see Linkenkaer-Hansen et al., 2007, their Fig. 3). Important to note in this context, however, is that the source of variability originating from finite amount of data is approximately fivefold smaller than empirically observed for neuronal oscillations (for details, see Linkenkaer-Hansen et al., 2007, their Table 1).
Figure 3.
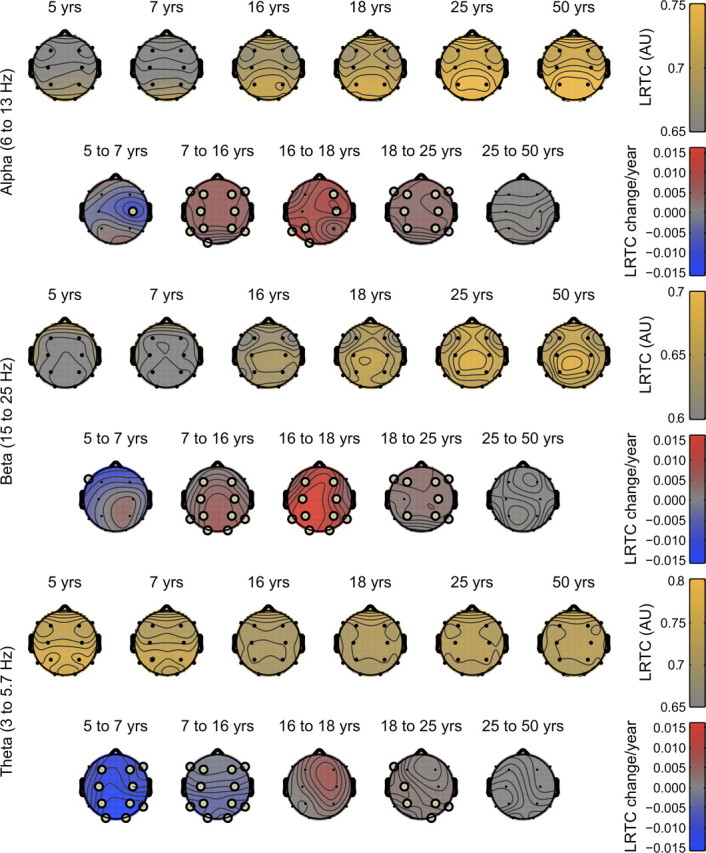
Lagging maturation of frontal areas and maximal growth during puberty. Yellow plots show the absolute LRTC levels for the 12 electrode positions with spline interpolation for each of the frequency bands. Alpha and beta oscillations show some weakening of LRTC near the frontal electrodes, and maximal values for parietal (beta) and occipital (alpha) areas, suggesting a maturational lag for the frontal lobes. The speed of increase (red) or decrease (blue) between adjacent age groups is shown in units per year with significant change indicated with gray circles at the electrode locations. All frequency bands showed maximal increases in LRTC during adolescence which reached significance in many areas for alpha and beta oscillations. Increases continued into adulthood at a much slower pace, yet reached significance for many brain locations and frequency bands. Adulthood was marked by highly stable LRTC scores.
The final data consisted of 12 DFA exponents for each subject when all EEG signals were available. One or more channels were missing in 270 measurements with on average 1.3 channel missing.
Modulation of the amplitude envelope.
To investigate qualitative differences in the modulation of the amplitude envelope of the oscillatory activity in the EEG signal, we calculated power spectral densities of the amplitude envelope of the (filtered) EEG data using Welch's method resulting in 0.1 Hz frequency bins ranging from 0.1–20 Hz. The spectral densities were normalized to unit area under the curve to remove interindividual differences in overall power of the modulation signal.
Spatial principal component analysis.
To explore age effects on the spatial distribution of LRTC we used principal component analysis (PCA) on the DFA exponents from the 12 scalp locations, where each of the scalp locations acted as a different variable. The PCA was performed for alpha oscillations only. To compare the loading distributions across age groups, the PCA was performed on each age group separately. Since no parametric test for significance of eigenvalues or components in a PCA exists, we obtained 99% confidence intervals for eigenvalues by bootstrap resampling from all families in the dataset and applying the bias corrected and accelerated method to estimate intervals (Efron, 1987). Note that sampling families rather than individuals keeps the within-family dependencies intact and effectively removes its effects on the confidence intervals.
Age group comparisons.
Age group effects were analyzed formally using Structural Equation Modeling (SEM) as implemented in Mx (Neale et al., 2003). Extended twin families and longitudinal data designs provide data characterized by families of variable size and missing data across occasions. Mx handles such unbalanced datasets via full information maximum likelihood, which uses the observed, raw data instead of variance covariance matrices. To evaluate how well the specified model fits the observed data, Mx calculates the negative Log-Likelihood (−LL) of the raw data for each family (Lange et al., 1976), as: −LL = −k log (2π) + log | Σ | + (yi − μi)′ Σ−1 (yi − μi), where k (k = 1, …, p) denotes the total number of observed variables within a family (and can vary over families), Σ (p × p) is the expected covariance matrix of family members, yi (for i = 1, …, p) is the vector of observed scores, μi is the column vector of the expected values of the variables, and | Σ | and Σ−1 are the determinant and inverse of matrix Σ, respectively. By organizing the data such that each row represents independent observations (viz., one family per row), and estimating the correlations between the multiple variables (viz., twin/sibling and longitudinal correlations), Mx accounts for these dependencies. In the current design, this means we (freely) estimated twin correlations, sibling correlations, and correlations across longitudinal measurements (correlations within individuals between 5 and 7, 16 and 18, 16 and 25, and 18 and 25), cross-twin cross-time (CTCT) correlations. Twin and CTCT correlations came in two flavors: monozygotic and dizygotic. Sibling correlations were equated to dizygotic correlations, and no further distinctions based on sex were made.
To test for effects across age groups, a linear regression model was used to include effects of sex on the observed scores: μi = β0 + β1 sexi, + β2 dummy1i + β3 dummy2i + β4 dummy3i + β5 dummy4i + β6 dummy5i where μi is the expected value of individual i, and sexi is the individual's sex (0 denotes female, 1 denotes male). β0 is the average LRTC in age group 5, β1 is the deviation of males from females, β2–6 are deviation of age groups 7–50 to age group 5. Group means were tested by equating estimations of group means and comparing the likelihood value to the one obtained in the unrestricted model. Twice the difference between the two nested models (−2{LLfull model − LLnested model}) is asymptotically distributed as χ2, with the difference in freely estimated parameters as degrees of freedom.
Effect sizes of age group effects.
Since standard effect sizes have no formal definition for complex dependent data, we estimated effect size r between pairs of age groups for the first-born twins only. The r is a generalization of the Pearson pmcc, has a similar interpretation, and can be calculated from the (paired on independent samples) t test (Rosnow et al., 2000). Effect sizes of the comparison between ages 5 and 7, and between 16 and 18 were based on a dependent t test since all subjects participated on both occasions. In all other cases an independent t test was used, thus effectively ignoring the small overlap in sample between 16 and 25 and 18 and 25.
Although no formal method for multiple testing issues were used, we did not use the conservative Bonferroni correction since it was expected that LRTC scores would highly correlate across frequency bands and scalp locations. Instead, we used a conservative p = 0.01 as cutoff for all significance tests.
Results
LRTC provide an index of amplitude modulation on long time scales
As shown previously, the amplitude modulation of resting-state oscillations exhibit a scale-free decay of autocorrelations (Fig. 1A), which can be reliably estimated using the DFA (Linkenkaer-Hansen et al., 2007; Fig. 1B). To illustrate how different strengths of LRTC relate to the amplitude modulation of ongoing oscillations, we divided subjects into those with weak, medium and strong LRTC (using the age group of 18 years; Table 1), and computed power spectral densities of the amplitude envelope of the oscillations. The spectra were normalized to unit area under the curve and divided by the average normalized spectra of 200 random white noise signals that were similarly filtered and Hilbert transformed. The resulting spectra (Fig. 1C) showed that oscillation amplitude of subjects with strong LRTC are more prominently modulated at low frequencies relative to higher frequencies than it is the case for subjects with weak LRTC (i.e., shallow slopes). Also note the good linear fit for <1.0 Hz amplitude modulation.
LRTC exhibit prominent developmental profiles distinct from EEG power
For alpha oscillations, the loess smoothed continuous plots revealed a strong increase of LRTC up to ∼25 years and a plateau throughout adulthood (Fig. 2A, top row). The increase was most prominent in central-frontal regions. Remarkably, the developmental changes in LRTC were not only significant between childhood and adolescence across all scalp locations (χ2(1) > 6.93, p < 0.008), but also during the short period from 16 to 18 years of age at occipital lead O1 (χ2(1) = 6.94, p = 0.008) and multiple other brain locations (right medial frontal and central: χ2(1) > 7.80, p < 0.005, left posterior: χ2(1) > 7.02, p < 0.008). In addition, increases in LRTC from 18 to 25 years were significant across the scalp (χ2(1) > 11.7, p < 0.001) and close to significant for lateral frontal and left temporal areas (χ2(1) > 3.2, p < 0.073). Theoretically, these observed changes in LRTC could be caused by developmental changes in oscillation power and the associated changes in signal-to-noise ratio (Linkenkaer-Hansen et al., 2007), but this is unlikely in view of the distinct developmental trajectories of alpha oscillation power (Fig. 2C, top row).
Figure 2.

LRTC exhibit prolonged development for all oscillation frequencies. LRTC and EEG power development for alpha (top row)-, beta (middle row)-, and theta (bottom row)-oscillations. Data for a typical region (right central C4) are shown. A, The developmental profile of LRTC is fitted with a loess smooth (linear, 37% window size) and shown superposed on the DFA exponents of individual subjects (n = 1433). LRTC for all three oscillation frequencies showed a steady increase from childhood up to adulthood reaching a plateau between 25 and 30 years. B, Age-group averages showed significant increases in LRTC from childhood to adolescence and adolescence to adulthood. Especially the alpha band oscillations showed significant increase between nearly all age groups (except between 5 and 7 years and 25 and 50 years), suggesting that LRTC reflect prolonged brain maturation in the third decade of life. C, Power showed developmental trends opposite to that of LRTC, which indicates that changes in LRTC cannot be explained by changes in signal-to-noise ratio. However, the decimation of EEG power (a 10 dB decrease) from childhood to adolescence may explain the strong decrease in theta LRTC.
The developmental profile of LRTC in beta oscillations was highly similar to that of alpha oscillations including the strong increase from childhood to adulthood and plateau at adult ages (Fig. 2A, middle graph). Age groups showed highly significant increases in LRTC for a majority of the scalp locations from childhood to adolescence (χ2(1) > 9.95, p < 0.002). Most notable exceptions were nonsignificant decreases in LRTC observed in the lateral frontal areas. LRTC significantly increased from 16 to 18 years in all brain regions (χ2(1) > 46.2, p < 1.0 · 10−11) except lateral frontal (χ2(1) < 3.1, n.s.). From 18 to 25 years increases were either significant (χ2(1) > 7.60, p < 0.006), close to significant (χ2(1) = 4.83, p = 0.028 for left central C3), or nonsignificant effects (occipital O1 and O2 and left temporal T5: χ2(1) < 2.1, n.s.). A concurrent decrease in beta band power was found between 5 and 25 (Fig. 2C, middle graph).
In contrast, theta oscillations were characterized by a decline in LRTC during childhood which was significant in most brain areas (between 5 and 7 years; χ2(1) > 4.29, p < 0.038). This decline continued into adolescence for central, posterior and temporal brain areas (between 7 and 16 years; χ2(1) > 9.6, p < 0.002). This decline concurred with a decline of theta power. During adolescence not significant differences were observed. After adolescence, LRTC increased between 18 and 25 (left hemispheric F7, C3, and P3: χ2(1) > 12.0, p < 0.001; and right posterior P4, T6, and O2: χ2(1) > 7.5, p < 0.007), and stabilized again during adulthood (all χ2(1) < 3.01, n.s.).
Figure 3 shows the headplots of absolute LRTC values. In addition, the figure summarizes the above results with headplots of LRTC change per year between adjacent age groups. These plots indicate that the temporal dynamics of ongoing oscillations were highly sensitive to the maturation of the brain during childhood and adolescence. For alpha and beta oscillations, maximal speed of LRTC increase was found between 16 and 18 and showed no systematic localization. The prolonged brain maturation (from 18 to 25 years) was found to be significant, and showed a somewhat anterior distribution, suggesting that occipital and left temporal areas finish maturation earlier than other areas. Theta oscillations showed a strong decrease of LRTC in childhood on most scalp locations. Later life (>25 years) shows remarkable absence of change with gray headplots for all scalp locations and frequency bands.
The DFA procedure includes a regression of log-RMS scores against log-window size. These regressions provided very good linear fits. After sampling a random 10% of the subjects, we observed very high r2 values (average r2 = 0.993, range .943 < r2 < 1.000 across individuals in all age groups and frequencies). No developmental trend was observed for r2 values (age group differences in average r2 < 0.001).
Table 2 shows the effects sizes r (Rosnow et al., 2000) of the age group comparisons for three representative scalp positions (F8, C4, and O2). Although the range around the estimated means is high for all age groups (Fig. 2A), some of the differences between age groups reflect moderate to strong effects. Strong effects were found in the comparison between childhood and older age groups. The strongest effects were found for comparing alpha-band LRTC of children to LRTC of the 50-year-olds at the frontocentral scalp locations with r ≧ 0.50.
Table 2.
Effect sizes r for age-related differences in LRTC
| Frequency | Lead | Age group comparison |
||||||||||||||
|---|---|---|---|---|---|---|---|---|---|---|---|---|---|---|---|---|
| 5–7* | 5–16 | 5–18 | 5–25 | 5–50 | 7–16 | 7–18 | 7–25 | 7–50 | 16–18* | 16–25† | 16–50 | 18–25† | 18–50 | 25–50 | ||
| Theta | F8 | −0.05 | −0.20 | −0.16 | −0.07 | −0.06 | −0.15 | −0.11 | −0.02 | −0.01 | 0.04 | 0.11 | 0.13 | 0.08 | 0.10 | 0.01 |
| C4 | −0.08 | −0.27 | −0.24 | −0.14 | −0.14 | −0.21 | −0.17 | −0.07 | −0.07 | 0.04 | 0.12 | 0.13 | 0.09 | 0.10 | 0.00 | |
| O2 | −0.25 | −0.39 | −0.39 | −0.20 | −0.26 | −0.20 | −0.21 | 0.01 | −0.05 | −0.02 | 0.20 | 0.14 | 0.22 | 0.16 | −0.06 | |
| Alpha | F8 | 0.03 | 0.31 | 0.30 | 0.47 | 0.53 | 0.32 | 0.31 | 0.48 | 0.54 | 0.05 | 0.25 | 0.30 | 0.20 | 0.24 | 0.03 |
| C4 | −0.12 | 0.27 | 0.29 | 0.42 | 0.50 | 0.36 | 0.37 | 0.48 | 0.55 | 0.07 | 0.23 | 0.30 | 0.17 | 0.23 | 0.04 | |
| O2 | 0.08 | 0.12 | 0.18 | 0.22 | 0.27 | 0.05 | 0.12 | 0.17 | 0.22 | 0.10 | 0.11 | 0.16 | 0.06 | 0.10 | 0.04 | |
| Beta | F8 | −0.10 | −0.15 | −0.13 | 0.05 | 0.02 | −0.05 | −0.02 | 0.16 | 0.13 | 0.06 | 0.21 | 0.18 | 0.19 | 0.16 | −0.03 |
| C4 | 0.02 | 0.35 | 0.40 | 0.48 | 0.47 | 0.31 | 0.36 | 0.45 | 0.44 | 0.13 | 0.25 | 0.22 | 0.17 | 0.13 | −0.05 | |
| O2 | 0.08 | 0.36 | 0.40 | 0.40 | 0.39 | 0.32 | 0.37 | 0.37 | 0.36 | 0.16 | 0.14 | 0.08 | 0.05 | −0.02 | −0.08 | |
Negative values reflect a decrease in LRTC with age. All age group comparison effect sizes were based on a between-group effect with sex covariate except: *effect sizes based on a repeated-measures ANOVA since all subjects were measured on both occasions.
†Based on between groups ANOVA since only a minority of the data consisted of repeated measures.
LRTC correlate marginally with alpha and beta oscillation power
Table 3 shows the maximum likelihood estimations of the partial correlations between LRTC and EEG power controlling for sex for a selection of representative leads. Since we expect the effect of age on LRTC, we did not regress out the effect of age for this analysis. Data for three representative scalp locations are shown.
Table 3.
Partial correlations (99% confidence intervals) between EEG power and LRTC scores
| Frequency | Lead | Age group |
|||||
|---|---|---|---|---|---|---|---|
| 5 | 7 | 16 | 18 | 25 | 50 | ||
| Theta | F8 | 0.59 (0.47, 0.69) | 0.47 (0.34, 0.57) | 0.22 (0.05, 0.40) | 0.22 (0.07, 0.35) | 0.42 (0.17, 0.51) | 0.44 (0.25, 0.51) |
| C4 | 0.62 (0.51, 0.71) | 0.52 (0.37, 0.61) | 0.12 (−0.02, 0.26) | 0.27 (0.12, 0.37) | 0.52 (0.28, 0.73) | 0.44 (0.13, 0.41) | |
| O2 | 0.44 (0.31, 0.56) | 0.41 (0.28, 0.50) | 0.20 (0.05, 0.36) | 0.15 (−0.02, 0.26) | 0.36 (0.04, 0.38) | 0.38 (0.06, 0.33) | |
| Alpha | F8 | 0.30 (0.18, 0.43) | 0.31 (0.20, 0.44) | 0.14 (0.00, 0.28) | 0.18 (0.04, 0.31) | 0.09 (−0.07, 0.22) | 0.06 (−0.20, 0.07) |
| C4 | 0.27 (0.15, 0.38) | 0.24 (0.11, 0.36) | 0.07 (−0.08, 0.22) | 0.23 (0.10, 0.36) | 0.15 (−0.03, 0.37) | 0.10 (−0.17, 0.10) | |
| O2 | 0.13 (0.02, 0.28) | 0.02 (−0.10, 0.18) | −0.10 (−0.22, 0.03) | −0.02 (−0.15, 0.13) | 0.12 (−0.13, 0.19) | 0.15 (−0.13, 0.16) | |
| Beta | F8 | 0.22 (0.09, 0.40) | 0.22 (0.08, 0.40) | 0.27 (0.12, 0.38) | 0.20 (0.03, 0.32) | 0.04 (−0.00, 0.28) | −0.01 (−0.11, 0.19) |
| C4 | 0.23 (0.12, 0.37) | 0.30 (0.15, 0.45) | 0.18 (0.06, 0.30) | 0.18 (0.04, 0.31) | 0.14 (0.06, 0.49) | 0.11 (−0.05, 0.24) | |
| O2 | 0.15 (0.04, 0.31) | 0.08 (−0.04, 0.22) | −0.00 (−0.15, 0.12) | 0.05 (−0.06, 0.18) | 0.10 (−0.02, 0.24) | 0.07 (−0.07, 0.18) | |
Correlations corrected for sex. Bias corrected and accelerated confidence intervals (Efron, 1987) accounted for all longitudinal (repeated) measurements by bootstrap resampling of families rather than individuals, thus keeping the family correlation structure intact.
The alpha band showed low correlations (−0.14 < r < 0.24 across all age groups). Frontal and central LRTC in the youngest age groups showed the strongest correlations, which were occasionally significant. EEG alpha power was nevertheless quite restricted in explaining variance in LRTC (r2 < 0.056). Beta oscillations showed a pattern similar to alpha oscillations (−0.01 < r < 0.31), with maximum explained variance for age group 5 at the frontal lead F8 (r2 < 0.099). Theta power, however, and LRTC were substantially and significantly correlated measures (0.12 < r < 0.63 across all age groups). Therefore, we cannot rule out that the stronger signal-to-noise ratio may have caused increased LRTC in the theta frequency band.
LRTC show increased spatial uniformity with age
We investigated whether the spatial distributions of LRTC are stable or show changes in the spatial correlation structure. For this, we performed a PCA on the 12 LRTC scores in the alpha-frequency band. Increasing age resulted in a more uniform distribution of LRTC as evidenced by the increasingly steeper eigenvalue distributions in the scree plot (Fig. 4. The 99% confidence intervals from bootstrap resampling (sampling families rather than individuals, thus keeping intact the family-based correlations present in the current data) revealed that the eigenvalue distribution was significantly different across age. Note that the largest eigenvalue was significantly different for all plotted age groups with values closer to random for the younger ages; shorter-range age comparisons, e.g., from 5 to 7 years, were not significant (data not shown).
Figure 4.

Age-related changes in the spatial distribution of LRTC reveal both functional-anatomical segregation and integration. Spatial PCA was based on the correlation matrix of LRTC scores on 12 scalp locations (alpha oscillations only). The scree plots of the five largest eigenvalues for three representative age groups (∼5, ∼16, and ∼25) are shown. The 99% confidence intervals were determined using bootstrap resampling and bias corrected and accelerated method (Efron, 1987). The plots revealed a significantly steeper eigenvalue distribution—i.e., an increasingly larger first eigenvalue—which is the result of overall lower spatial correlations at younger ages which systematically increase with age. This increased spatial uniformity suggests increased functional integration of distant brain areas with age.
Discussion
We investigated the developmental trajectories of long-range temporal correlations in resting-state neuronal oscillations in the theta, alpha and beta bands, using EEG recordings from 1433 subjects, which covered an age span of 5–71 years. We observed distinct developmental profiles for LRTC and power in the theta, alpha, and beta frequency bands with pronounced changes in LRTC not only from childhood to adolescence, but also during adolescence and continuing into young adulthood (∼25 years of age). Importantly, detecting some of the developmental changes in LRTC required a large population of subjects (Berthouze et al., 2010), because of the individual variation in LRTC (Linkenkaer-Hansen et al., 2007). During later adulthood (25–71 years), we observed only marginal changes in LRTC, which is in agreement with an earlier report based on a smaller sample of adult subjects (Nikulin and Brismar, 2005). However, other developmental trends, e.g., the increase in LRTC between childhood and adolescence, showed moderate effect sizes. Interestingly, principal component analysis of the spatial distribution of LRTC revealed functional-anatomical segregation between frontal, occipitotemporal and central regions, which became increasingly integrated during development.
LRTC and power are largely distinct properties of neuronal oscillations
Although LRTC estimation was found to be quite robust to the (simulated) addition of noise (Linkenkaer-Hansen et al., 2007), one may ask whether the developmental changes in LRTC were merely related to changes in EEG power and the corresponding changes in signal-to-noise ratio. For the alpha and beta oscillations, however, this is unlikely as the strength of LRTC increased with age while EEG power decreased. Lower oscillation power would be associated with decreased LRTC in case of a signal-to-noise ratio effect. In addition, and consistent with our previous report (Linkenkaer-Hansen et al., 2007), correlations between EEG power and LRTC were low and explained <10% of LRTC variance across all leads and age groups. In the theta band, on the other hand, we could not exclude a bias of signal-to-noise ratio, because childhood EEG is characterized by very strong theta activity and also strong LRTC, which both decrease into adolescence. Correlations were moderate to high, especially for the childhood and adult age groups. Nevertheless, the local minimum in LRTC for theta oscillations, which we identified at 16 and 18 years of age, may indicate weakly autocorrelated dynamics during late adolescence, because LRTC shows significant increase in the 25- and 50-year age groups, despite continuously declining EEG theta power.
LRTC development as a marker of brain maturation
The postnatal brain shows synaptogenesis via the outgrowth of axonal and dendritic branches (Huttenlocher, 1979; Casey et al., 2005; Kaiser et al., 2009). Although human postmortem results suggested that synaptic density peaks at different infant ages for different brain areas (Huttenlocher and Dabholkar, 1997), data from primates have suggested a more isochronic synaptogenesis across brain regions and layers (Rakic et al., 1986). Synaptic pruning—resulting in loss of gray matter—extends well into adolescence (Giedd et al., 1999; Sowell et al., 2003). A concurrent increase in white matter volume may indicate ongoing myelination processes and explain part of the gray matter volume loss (Paus, 2005). Many of these brain maturational processes persist into adulthood and even older age as evidenced by life-span changes in gray and white matter volume (Giedd et al., 1999; Sowell et al., 1999, 2003; Gogtay et al., 2004). Our results support the notion of brain developmental increases in spatial/anatomical integration (Fig. 4) (Paus, 2005; Fair et al., 2008), as well as increased temporal integration across brain states, as reflected in increased LRTC during adolescence and into young adulthood (Fig. 2B).
Computational studies have indicated that a balanced propagation of activity in neuronal networks is essential for the large variation in amplitude fluctuations that is characteristic of scale-free behavior and LRTC (Poil et al., 2008). Activity propagation necessarily depends on axonal and dendritic structures, which undergo pronounced developmental changes (Huttenlocher, 1979; Casey et al., 2005; Kaiser et al., 2009). The GABA system, however, also develops into adolescence (Lewis et al., 2004) and regulates both the ability of neurons to synchronize their activity and the spreading of this synchronized activity in neuronal networks (Beggs and Plenz, 2003; Uhlhaas et al., 2010). On the basis of the present data, we cannot deduce the relative importance of functional and structural changes during development for regulating LRTC; however, we speculate that they are both important. Because of the complexity of the problem, we believe that computational models generating neuronal oscillations with LRTC would be useful for addressing this question. Regardless of the factors involved, over findings point to the use of LRTC strength as a biomarker, which could help identify cortical regions and neuronal oscillations exhibiting abnormal brain development, as suspected for example in schizophrenia or ADHD.
The functional role of LRTC development
Power-law scaling of autocorrelations in brain signals has gained interest, because it may reflect emergent population dynamics in critical systems (Bak et al., 1987; Bak and Paczuski, 1995; Chialvo, 2007; Levina et al., 2007; Poil et al., 2008; Kello et al., 2010). Dynamical systems in a critical state are characterized by nonlinearly interacting elements that organize into meta-stable spatial and temporal patterns. This state is thought to provide an optimal compromise between uncorrelated neuronal activity (high flexibility but also highly random or “noisy”) and strongly correlated activity patterns (little flexibility and narrow dynamic range) (Chialvo and Bak, 1999; Linkenkaer-Hansen et al., 2001; Beggs and Plenz, 2003; Freeman, 2004; Kinouchi and Copelli, 2006; Plenz and Thiagarajan, 2007). The different levels of decay in LRTC as found in the DFA exponents may all reflect self-organized criticality (for exponents >0.5) (Bak et al., 1987), but it remains unclear what the functional role is of the magnitude of the exponents. We speculate that the strength of LRTC is the temporal integration span of brain activity and its information content—pivotal for cognitive functioning of the brain. Strong LRTC corresponds to larger integration times (Linkenkaer-Hansen et al., 2004; Monto et al., 2007), e.g., the ability to maintain transiently stable oscillations in support of active neuronal representations during working memory (Kahana, 2006; Jokisch and Jensen, 2007). This hypothesis is indirectly supported by the Alzheimer-associated decrease in the strength of LRTC in parietal alpha oscillations, which are known to exhibit sustained amplitude increases in normal subjects during mnemonic operations (Montez et al., 2009).
Even though the function of strong or weak LRTC in alpha oscillations is largely unknown, there is ample evidence that the modulation of these oscillations is related to behavioral performance (Linkenkaer-Hansen et al., 2004; Monto et al., 2008; Haegens et al., 2011). In addition, there is evidence that altered trial-to-trial modulation of alpha oscillations may be related to suboptimal performance in ADHD children in cued response tasks (Mazaheri et al., 2010). These results provide neurophysiological evidence that investigation of alpha modulation may be useful to predict both normal and aberrant performance.
Increased spatial uniformity of LRTC may reflect development in connectivity
The spatial PCA analysis of alpha oscillations revealed that increasing age results in more uniform spatial patterns of LRTC distributions, suggesting that brain areas become increasingly connected and functionally integrated, and thus show correlated LRTC. The generally lower spatial correlation at younger ages evidences relative independence in LRTC “tuning” in different brain areas, thus reflecting their modularity. This regional specificity decreased with age, suggesting that development in corticocortical connectivity (Supekar et al., 2009) contributes to increased uniformity of LRTC across the brain. A contribution of spatial smearing from the development of brain, skull, and skin tissue causing increased levels of volume conduction and corresponding increases in spatial correlations in DFA exponents cannot be ruled out, The current findings, however, are compatible with recent findings on the modularity of developing brain networks. Using fMRI and graph theory, Meunier et al. (2009) reported that functional connectivity between brain areas showed three main modules roughly corresponding to a frontal, a central, and a posterior module in a sample of young adults (mean = 24 years). In addition, an older age group (mean = 67 years) showed a higher degree of intermodular connectivity. Such an increased intermodular connectivity was also reported by Fair et al. (2008) and corresponds well with our finding of an increased spatial uniformity of LRTC scores.
In conclusion, normal brain maturation follows a clear path from temporally unstructured to temporally highly structured EEG signals, and marks a normal developmental curve with large effect sizes. Therefore, the findings suggest that LRTC may prove useful for studying deviance from normal development, neurodevelopmental disorders such as ADHD and schizophrenia. In addition, we speculate that the developmental increases in LRTC observed during adolescence and early adulthood are related to the maturation of different cognitive functions, such as the ability to sustain attention and maintain information in working memory (Smit et al., 2009). Future research may address these issues.
Footnotes
This work was funded by VU University Grant VU-USF 96/22 to D.I.B., Human Frontiers of Science Program RG0154/1998-B to D.I.B. and E.J.C.d.G., and Netherlands Organization for Scientific Research (NWO) Grants NWO/SPI 56-464-14192 to D.I.B. and NWO/MagW VENI-451-08-026 to D.J.A.S. K.L.-H. received funding from the NWO Innovative Research Incentive Schemes.
The authors declare no competing financial interests.
References
- Bak P, Paczuski M. Complexity, contingency, and criticality. Proc Natl Acad Sci U S A. 1995;92:6689–6696. doi: 10.1073/pnas.92.15.6689. [DOI] [PMC free article] [PubMed] [Google Scholar]
- Bak P, Tang C, Wiesenfeld K. Self-organized criticality: an explanation of the 1/f noise. Phys Rev Lett. 1987;59:381–384. doi: 10.1103/PhysRevLett.59.381. [DOI] [PubMed] [Google Scholar]
- Beggs JM, Plenz D. Neuronal avalanches in neocortical circuits. J Neurosci. 2003;23:11167–11177. doi: 10.1523/JNEUROSCI.23-35-11167.2003. [DOI] [PMC free article] [PubMed] [Google Scholar]
- Berthouze L, James LM, Farmer SF. Human EEG shows long-range temporal correlations of oscillation amplitude in theta, alpha and beta bands across a wide age range. Clin Neurophysiol. 2010;121:1187–1197. doi: 10.1016/j.clinph.2010.02.163. [DOI] [PubMed] [Google Scholar]
- Boersma M, Smit DJ, de Bie HM, Van Baal GC, Boomsma DI, de Geus EJ, Delemarre-van de Waal HA, Stam CJ. Network analysis of resting state EEG in the developing young brain: structure comes with maturation. Hum Brain Mapp. 2011;32:413–425. doi: 10.1002/hbm.21030. [DOI] [PMC free article] [PubMed] [Google Scholar]
- Buzsáki G. Rhythms of the brain. New York: Oxford UP; 2006. [Google Scholar]
- Casey BJ, Tottenham N, Liston C, Durston S. Imaging the developing brain: what have we learned about cognitive development? Trends Cogn Sci Regul Ed. 2005;9:104–110. doi: 10.1016/j.tics.2005.01.011. [DOI] [PubMed] [Google Scholar]
- Chen Z, Ivanov PCh, Hu K, Stanley HE. Effect of nonstationarities on detrended fluctuation analysis. Phys Rev E Stat Nonlin Soft Matter Phys. 2002;65 doi: 10.1103/PhysRevE.65.041107. 041107. [DOI] [PubMed] [Google Scholar]
- Chialvo DR. The brain near the edge. In: Marro J, Garrido PL, Torres JJ, editors. Cooperative behavior in neural systems: ninth Granada lectures. Melville, NY: American Institute of Physics; 2007. [Google Scholar]
- Chialvo DR, Bak P. Learning from mistakes. Neuroscience. 1999;90:1137–1148. doi: 10.1016/s0306-4522(98)00472-2. [DOI] [PubMed] [Google Scholar]
- Efron B. Better confidence intervals. J Am Stat Assoc. 1987;82:171–200. [Google Scholar]
- Fair DA, Cohen AL, Dosenbach NUF, Church JA, Miezin FM, Barch DM, Raichle ME, Petersen SE, Schlaggar BL. The maturing architecture of the brain's default network. Proc Natl Acad Sci U S A. 2008;105:4028–4032. doi: 10.1073/pnas.0800376105. [DOI] [PMC free article] [PubMed] [Google Scholar]
- Freeman WJ. Origin, structure, and role of background EEG activity. Part 2. Analytic phase. Clin Neurophysiol. 2004;115:2089–2107. doi: 10.1016/j.clinph.2004.02.028. [DOI] [PubMed] [Google Scholar]
- Giedd JN, Blumenthal J, Jeffries NO, Castellanos FX, Liu H, Zijdenbos A, Paus T, Evans AC, Rapoport JL. Brain development during childhood and adolescence: a longitudinal MRI study. Nat Neurosci. 1999;2:861–863. doi: 10.1038/13158. [DOI] [PubMed] [Google Scholar]
- Gogtay N, Giedd JN, Lusk L, Hayashi KM, Greenstein D, Vaituzis AC, Nugent TF, 3rd, Herman DH, Clasen LS, Toga AW, Rapoport JL, Thompson PM. Dynamic mapping of human cortical development during childhood through early adulthood. Proc Natl Acad Sci U S A. 2004;101:8174–8179. doi: 10.1073/pnas.0402680101. [DOI] [PMC free article] [PubMed] [Google Scholar]
- Haegens S, Händel BF, Jensen O. Top-down controlled alpha band activity in somatosensory areas determines behavioral performance in a discrimination task. J Neurosci. 2011;31:5197–5204. doi: 10.1523/JNEUROSCI.5199-10.2011. [DOI] [PMC free article] [PubMed] [Google Scholar]
- Huttenlocher PR. Synaptic density in human frontal cortex—developmental changes and effects of aging. Brain Res. 1979;163:195–205. doi: 10.1016/0006-8993(79)90349-4. [DOI] [PubMed] [Google Scholar]
- Huttenlocher PR, Dabholkar AS. Regional differences in synaptogenesis in human cerebral cortex. J Comp Neurol. 1997;387:167–178. doi: 10.1002/(sici)1096-9861(19971020)387:2<167::aid-cne1>3.0.co;2-z. [DOI] [PubMed] [Google Scholar]
- Jokisch D, Jensen O. Modulation of gamma and alpha activity during a working memory task engaging the dorsal or ventral stream. J Neurosci. 2007;27:3244–3251. doi: 10.1523/JNEUROSCI.5399-06.2007. [DOI] [PMC free article] [PubMed] [Google Scholar]
- Kahana MJ. The cognitive correlates of human brain oscillations. J Neurosci. 2006;26:1669–1672. doi: 10.1523/JNEUROSCI.3737-05c.2006. [DOI] [PMC free article] [PubMed] [Google Scholar]
- Kaiser M, Hilgetag CC, van Ooyen A. A simple rule for axon outgrowth and synaptic competition generates realistic connection lengths and filling fractions. Cereb Cortex. 2009;19:3001–3010. doi: 10.1093/cercor/bhp071. [DOI] [PubMed] [Google Scholar]
- Kantelhardt JW, Koscielny-Bunde E, Rego HHA, Havlin S, Bunde A. Detecting long-range correlations with detrended fluctuation analysis. Physica A. 2001;295:441–454. [Google Scholar]
- Kello CT, Brown GD, Ferrer-I-Cancho R, Holden JG, Linkenkaer-Hansen K, Rhodes T, Van Orden GC. Scaling laws in cognitive sciences. Trends Cogn Sci. 2010;14:223–232. doi: 10.1016/j.tics.2010.02.005. [DOI] [PubMed] [Google Scholar]
- Kinouchi O, Copelli M. Optimal dynamical range of excitable networks at criticality. Nat Phys. 2006;2:348–351. [Google Scholar]
- Lange K, Westlake J, Spence MA. Extensions to pedigree analysis. III. Variance components by the scoring method. Ann Hum Genet. 1976;39:485–491. doi: 10.1111/j.1469-1809.1976.tb00156.x. [DOI] [PubMed] [Google Scholar]
- Lee TW, Girolami M, Sejnowski TJ. Independent component analysis using an extended infomax algorithm for mixed subgaussian and supergaussian sources. Neural Comput. 1999;11:417–441. doi: 10.1162/089976699300016719. [DOI] [PubMed] [Google Scholar]
- Levina A, Herrmann JM, Geisel T. Dynamical synapses causing self-organized criticality in neural networks. Nat Phys. 2007;3:857–860. [Google Scholar]
- Lewis DA, Cruz D, Eggan S, Erickson S. Postnatal development of prefrontal inhibitory circuits and the pathophysiology of cognitive dysfunction in schizophrenia. Ann N Y Acad Sci. 2004;1021:64–76. doi: 10.1196/annals.1308.008. [DOI] [PubMed] [Google Scholar]
- Linkenkaer-Hansen K, Nikouline VV, Palva JM, Ilmoniemi RJ. Long-range temporal correlations and scaling behavior in human brain oscillations. J Neurosci. 2001;21:1370–1377. doi: 10.1523/JNEUROSCI.21-04-01370.2001. [DOI] [PMC free article] [PubMed] [Google Scholar]
- Linkenkaer-Hansen K, Nikulin VV, Palva S, Ilmoniemi RJ, Palva JM. Prestimulus oscillations enhance psychophysical performance in humans. J Neurosci. 2004;24:10186–10190. doi: 10.1523/JNEUROSCI.2584-04.2004. [DOI] [PMC free article] [PubMed] [Google Scholar]
- Linkenkaer-Hansen K, Monto S, Rytsälä H, Suominen K, Isometsä E, Kähkönen S. Breakdown of long-range temporal correlations in theta oscillations in patients with major depressive disorder. J Neurosci. 2005;25:10131–10137. doi: 10.1523/JNEUROSCI.3244-05.2005. [DOI] [PMC free article] [PubMed] [Google Scholar]
- Linkenkaer-Hansen K, Smit DJ, Barkil A, van Beijsterveldt TE, Brussaard AB, Boomsma DI, van Ooyen A, de Geus EJ. Genetic contributions to long-range temporal correlations in ongoing oscillations. J Neurosci. 2007;27:13882–13889. doi: 10.1523/JNEUROSCI.3083-07.2007. [DOI] [PMC free article] [PubMed] [Google Scholar]
- Mazaheri A, Coffey-Corina S, Mangun GRA, Bekker EM, Berry AS, Corbett BA. Functional disconnection of frontal cortex and visual cortex in attention-deficit/hyperactivity disorder. Biol Psychiatry. 2010;67:617–623. doi: 10.1016/j.biopsych.2009.11.022. [DOI] [PubMed] [Google Scholar]
- Meunier D, Achard S, Morcom A, Bullmore E. Age-related changes in modular organization of human brain functional networks. Neuroimage. 2009;44:715–723. doi: 10.1016/j.neuroimage.2008.09.062. [DOI] [PubMed] [Google Scholar]
- Montez T, Poil SS, Jones BF, Manshanden I, Verbunt JP, van Dijk BW, Brussaard AB, van Ooyen A, Stam CJ, Scheltens P, Linkenkaer-Hansen K. Altered temporal correlations in parietal alpha and prefrontal theta oscillations in early-stage Alzheimer disease. Proc Natl Acad Sci U S A. 2009;106:1614–1619. doi: 10.1073/pnas.0811699106. [DOI] [PMC free article] [PubMed] [Google Scholar]
- Monto S, Vanhatalo S, Holmes MD, Palva JM. Epileptogenic neocortical networks are revealed by abnormal temporal dynamics in seizure-free subdural EEG. Cereb Cortex. 2007;17:1386–1393. doi: 10.1093/cercor/bhl049. [DOI] [PubMed] [Google Scholar]
- Monto S, Palva S, Voipio J, Palva JM. Very slow EEG fluctuations predict the dynamics of stimulus detection and oscillation amplitudes in humans. J Neurosci. 2008;28:8268–8272. doi: 10.1523/JNEUROSCI.1910-08.2008. [DOI] [PMC free article] [PubMed] [Google Scholar]
- Neale MC, Boker SM, Xie G, Maes HH. Mx: statistical modeling. Ed 6. Richmond, VA: Virginia Commonwealth University, Department of Psychiatry; 2003. [Google Scholar]
- Nikulin VV, Brismar T. Long-range temporal correlations in electroencephalographic oscillations: relation to topography, frequency band, age and gender. Neuroscience. 2005;130:549–558. doi: 10.1016/j.neuroscience.2004.10.007. [DOI] [PubMed] [Google Scholar]
- Palva S, Palva JM. New vistas for [alpha]-frequency band oscillations. Trends Neurosci. 2007;30:150–158. doi: 10.1016/j.tins.2007.02.001. [DOI] [PubMed] [Google Scholar]
- Parish LM, Worrell GA, Cranstoun SD, Stead SM, Pennell P, Litt B. Long-range temporal correlations in epileptogenic and non-epileptogenic human hippocampus. Neuroscience. 2004;125:1069–1076. doi: 10.1016/j.neuroscience.2004.03.002. [DOI] [PubMed] [Google Scholar]
- Paus T. Mapping brain maturation and cognitive development during adolescence. Trends Cogn Sci. 2005;9:60–68. doi: 10.1016/j.tics.2004.12.008. [DOI] [PubMed] [Google Scholar]
- Peng CK, Havlin S, Stanley HE, Goldberger AL. Quantification of scaling exponents and crossover phenomena in nonstationary heartbeat time series. Chaos. 1995;5:82–87. doi: 10.1063/1.166141. [DOI] [PubMed] [Google Scholar]
- Pivik RT, Broughton RJ, Coppola R, Davidson RJ, Fox N, Nuwer MR. Guidelines for the recording and quantitative analysis of electroencephalographic activity in research contexts. Psychophysiology. 1993;30:547–558. doi: 10.1111/j.1469-8986.1993.tb02081.x. [DOI] [PubMed] [Google Scholar]
- Plenz D, Thiagarajan TC. The organizing principles of neuronal avalanches: cell assemblies in the cortex? Trends Neurosci. 2007;30:101–110. doi: 10.1016/j.tins.2007.01.005. [DOI] [PubMed] [Google Scholar]
- Poil SS, van Ooyen A, Linkenkaer-Hansen K. Avalanche dynamics of human brain oscillations: relation to critical branching processes and temporal correlations. Hum Brain Mapp. 2008;29:770–777. doi: 10.1002/hbm.20590. [DOI] [PMC free article] [PubMed] [Google Scholar]
- Rakic P, Bourgeois JP, Eckenhoff MF, Zecevic N, Goldman-Rakic PS. Concurrent overproduction of synapses in diverse regions of the primate cerebral cortex. Science. 1986;232:232–235. doi: 10.1126/science.3952506. [DOI] [PubMed] [Google Scholar]
- Rosnow RL, Rosenthal R, Rubin DB. Contrasts and correlations in effect-size estimation. Psychol Sci. 2000;11:446–453. doi: 10.1111/1467-9280.00287. [DOI] [PubMed] [Google Scholar]
- Smit DJ, Posthuma D, Boomsma DI, De Gues EJ. Phenotypic and genetic correlations between evoked EEG/ERP measures during the response anticipation period of a delayed response task. Psychophysiology. 2009;46:344–356. doi: 10.1111/j.1469-8986.2008.00777.x. [DOI] [PubMed] [Google Scholar]
- Smit DJ, Boersma M, Beijsterveldt CE, Posthuma D, Boomsma DI, Stam CJ, de Geus EJ. Endophenotypes in a dynamically connected brain. Behav Genet. 2010;40:167–177. doi: 10.1007/s10519-009-9330-8. [DOI] [PMC free article] [PubMed] [Google Scholar]
- Sowell ER, Thompson PM, Holmes CJ, Jernigan TL, Toga AW. In vivo evidence for post-adolescent brain maturation in frontal and striatal regions. Nat Neurosci. 1999;2:859–861. doi: 10.1038/13154. [DOI] [PubMed] [Google Scholar]
- Sowell ER, Peterson BS, Thompson PM, Welcome SE, Henkenius AL, Toga AW. Mapping cortical change across the human life span. Nat Neurosci. 2003;6:309–315. doi: 10.1038/nn1008. [DOI] [PubMed] [Google Scholar]
- Supekar K, Musen M, Menon V. Development of large-scale functional brain networks in children. PLoS Biol. 2009;7:e1000157. doi: 10.1371/journal.pbio.1000157. [DOI] [PMC free article] [PubMed] [Google Scholar]
- Thatcher RW, North DM, Biver CJ. Development of cortical connections as measured by EEG coherence and phase delays. Hum Brain Mapp. 2008;29:1400–1415. doi: 10.1002/hbm.20474. [DOI] [PMC free article] [PubMed] [Google Scholar]
- Uhlhaas PJ, Roux F, Singer W, Haenschel C, Sireteanu R, Rodriguez E. The development of neural synchrony reflects late maturation and restructuring of functional networks in humans. Proc Natl Acad Sci U S A. 2009;106:9866–9871. doi: 10.1073/pnas.0900390106. [DOI] [PMC free article] [PubMed] [Google Scholar]
- Uhlhaas PJ, Roux F, Rodriguez E, Rotarska-Jagiela A, Singer W. Neural synchrony and the development of cortical networks. Trends Cogn Sci. 2010;14:72–80. doi: 10.1016/j.tics.2009.12.002. [DOI] [PubMed] [Google Scholar]