

Abstract
Neural circuitry is a self-organizing arithmetic device that converts input to output and thereby remodels its computational algorithm to produce more desired output; however, experimental evidence regarding the mechanism by which information is modified and stored while propagating across polysynaptic networks is sparse. We used functional multineuron calcium imaging to monitor the spike outputs from thousands of CA1 neurons in response to the stimulation of two independent sites of the dentate gyrus in rat hippocampal networks ex vivo. Only pyramidal cells were analyzed based on post hoc immunostaining. Some CA1 pyramidal cells were observed to fire action potentials only when both sites were simultaneously stimulated (AND-like neurons), whereas other neurons fired in response to either site of stimulation but not to concurrent stimulation (XOR-like neurons). Both types of neurons were interlaced in the same network and altered their logical operation depending on the timing of paired stimulation. Repetitive paired stimulation for brief periods induced a persistent reorganization of AND and XOR operators, suggesting a flexibility in parallel distributed processing. We simulated these network functions in silico and found that synaptic modification of the CA3 recurrent excitation is pivotal to the shaping of logic plasticity. This work provides new insights into how microscopic synaptic properties are associated with the mesoscopic dynamics of complex microcircuits.
Introduction
In a simplified framework, the hippocampal network can be viewed as a hybrid circuit in which CA3 recurrent networks are intercalated between two relatively simple feedforward networks, i.e., the dentate gyrus (DG)-to-CA3 and CA3-to-CA1 projections (Amaral and Lavanex, 2007). Using this polysynaptic circuit, the hippocampus receives neural information from the entorhinal cortex and sends the calculation result back to the entorhinal cortex, during which the hippocampal network reorganizes itself through synaptic plasticity so as to generate more appropriate outputs. The input-output function and self-rewritability of the hippocampus are believed to underlie abstract representations, such as spatial mapping (O'Keefe and Dostrovsky, 1971), object identification (Quiroga et al., 2005), and learning and memory (Scoville and Milner, 1957).
Recent in vivo studies have highlighted the hippocampal formation as a kernel for pattern completion and separation (Guzowski et al., 2004; Leutgeb and Leutgeb, 2007). Pattern completion refers to the ability of a network to retrieve the entire previously stored output pattern from a partially presented input pattern, whereas pattern separation refers to the ability to differentiate the representations of two similar input patterns into more dissimilar patterns. To execute these abilities, the hippocampal network must be able to integrate and segregate neural information in parallel; however, it remains unclear how these distinct operation modes are achieved at the microcircuit level.
Functional multineuron calcium imaging (fMCI) is an optical technique that records the firing responses of large populations of neurons en masse with cellular resolution by taking advantage of the fact that action potentials are reflected in transient calcium elevations in neuronal cell bodies (Takahashi et al., 2007). fMCI can separate even synchronous action potentials without the need for spike-sorting algorithms, identify the location of individual neurons regardless of their spiking behavior, and indentify the cell types, including excitatory and inhibitory neurons, via post hoc histochemical labeling. In the present work, we used fMCI to capture the spike patterns of CA1 neurons (hippocampal outputs) in response to the stimulation of two different populations of DG neurons (hippocampal inputs) so as to examine how these two distinct inputs are combined and separated during polysynaptic network processing. In our experimental design, we considered hippocampal networks to act as a large-scale arithmetic operator that associates a given DG-input pattern with a specific CA1 output pattern. We found that the hippocampal polysynaptic pathway behaves like an integrated circuit unit that outputs a combination of Boolean AND/XOR-like outputs.
Materials and Methods
Animal experiment ethics.
The experiments were performed with the approval of the animal experiment ethics committee at the University of Tokyo (approval number 19-43) and according to the University of Tokyo guidelines for the care and use of laboratory animals.
Slice preparation.
Hippocampal slice cultures were prepared from postnatal day 7 Wistar/ST rats of either sex (SLC) as previously described (Koyama et al., 2007). Briefly, rats were deeply anesthetized by hypothermia and decapitated. The brains were removed and horizontally cut into 300-μm-thick slices using a DTK-1500 microslicer (Dosaka) in aerated, ice-cold Gey's balanced salt solution that had been supplemented with 36 mm glucose. The resultant hippocampal slices were placed on Millicell-CM culture wells (Millipore) or Omnipore membrane filters (Millipore) on plastic rings, and they were fed with 1 ml of a culture medium that consisted of 50% minimal essential medium, 25% Hanks' balanced salt solution, and 25% horse serum (Cell Culture Laboratory) that had been supplemented with 33 mm glucose and antibiotics consisting of 50 s/ml penicillin G (Meiji) and 100 μg/ml streptomycin (Meiji). The medium was changed every 3.5 d. The slices were cultivated at 37°C in a humidified atmosphere at 5% CO2 10–14 d before use.
Two-photon cell count.
A cultured slice was fixed overnight in 4% paraformaldehyde in 0.1 m PB that consisted of the following (in mm): 78 Na2HPO4 · 12 H2O and 19 NaH2PO4 · 2 H2O. After being washed in PBS, each slice was permeabilized with 0.3% Triton X-100, and nonspecific antibody binding was blocked with 5% goat serum for 60 min at room temperature. Then, each slice was treated with a primary mouse monoclonal antibody against neuronal-specific nuclear protein (NeuN) (1:400; MAB377, Millipore Bioscience Research Reagents) overnight for 24 h. After being washed with PBS, each slice was stained with secondary anti-mouse IgG Alexa Fluor 488 (1:400; A11001, Invitrogen) in 2% goat serum for 24 h at room temperature and then washed with PBS. Neurons were imaged in PBS using a two-photon laser microscope that was based on a mode-locked Ti:sapphire laser with a 100 fs pulse width, 80 MHz pulse frequency, and 920 nm wavelength (Maitai; Spectra Physics) that had been mounted on an upright microscope (BX61WI; Olympus). The excitation light was focused using a water-immersion objective [20×, 0.95 numerical aperture (NA), XLUMPlanFI/IR; Olympus]. The emitted fluorescence was captured through a 685 nm, short-pass barrier filter using a photomultiplier tube detector (r7862, Hamamatsu Photonics) that was controlled by FV10-ASW software, version 1.7 (Olympus). All images were collected using a 0.5 μm Z-step. The entire field that covered the entire slice was divided into 25 partly overlapping microscopic subfields of view. Neurons were identified by eye, manually counted, and verified twice.
Electrophysiological recording.
All electrophysiological and live-imaging experiments were performed in artificial CSF (aCSF) that consisted of the following (in mm): 127 NaCl, 26 NaHCO3, 1.6 KCl, 1.24 KH2PO4, 1.3 MgSO4, 2.4 CaCl2, and 10 glucose that had been aerated with 95% O2 and 5% CO2. Each slice was mounted in a recording chamber and perfused with aCSF at 25−27°C at a rate of 1.0–2.0 ml/min. This relatively low temperature was required so as to suppress spontaneous background activity and stimulus-evoked excessive synchronization, both of which might mask the true properties of network computation. CA1 and CA3 pyramidal cells (PCs) were visually identified using infrared differential interference contrast microscopy and randomly selected for patch-clamp recordings. Recordings were obtained using a Multiclamp 700B amplifier (Molecular Devices) and a DigiData 1321A digitizer (Molecular Devices). Cell-attached recordings were conducted under the voltage-clamped configuration (Sasaki et al., 2011). For cell-attached recording, borosilicate glass pipettes (4–6 MΩ) were filled with aCSF. For voltage-clamped recording, these pipettes were filled with the following (in mm): 120 K-gluconate, 10 KCl, 10 HEPES, 0.2 EGTA, 10 phosphocreatine, 4 MgATP, and 0.3 NaGTP. Signals were low-pass filtered at 2–6 kHz, digitized at 20 kHz, and analyzed with pCLAMP software, version 10.0 (Molecular Devices).
fMCI.
Each slice was transferred into a 35 mm dish that had been filled with 2 ml of dye solution and incubated for 60 min in a humidified incubator at 37°C in a 5% CO2 atmosphere (Takahashi et al., 2007). The dye solution consisted of aCSF that contained 0.0005% Oregon Green 488 BAPTA-1 AM (OGB1, Invitrogen), 0.005% Cremophor EL (Sigma-Aldrich), 0.01% Pluronic F-127 (Invitrogen), 100 μm sulfinpyrazone (Sigma-Aldrich), and 0.8% DMSO. After washing, each slice was incubated in aCSF at 25–27°C for at least 30 min, mounted in a recording chamber, and perfused with the same aCSF at 25–27°C at a rate of 1.0–2.0 ml/min. The imaging session was started >20 min after the stimulating electrodes were placed on the DG. Calcium activity was recorded from the CA1 PC layer. Images (653 × 492 pixels, 16-bit resolution) were captured at 10–30 frames/s for 3 s per stimulation via a Nipkow spinning-disk confocal microscope (CSU10; Yokogawa Electric), a cooled EM-CCD camera (iXon DU887, Andor), an upright microscope (AxioSkop2, Zeiss), a water-immersion objective (20×, 1.0 NA, Achroplan, Zeiss), and image-acquisition software (MetaMorph; Molecular Devices). Stimulation was applied 500 ms after the onset of each image acquisition period. The OGB1 was excited at 488 nm with an argon-krypton laser (641-YB-A01; Melles Griot) and visualized with a 507 nm, long-pass emission filter.
Stimulation protocol.
Two bipolar tungsten electrodes were placed in the infrapyramidal (stim A) and suprapyramidal (stim B) blades of the DG granular cell layer. To avoid a possible crossing of these stimulated pathways, three parts in each slice were carefully incised using a small surgical knife: (1) along the hippocampal fissure, (2) from the upper end of the hippocampal fissure to the granular cell layer, and (3) vertically across the DG in the middle of the sites of stim A and stim B (see Fig. 2A). This procedure not only made the two stimulation sites independent but also eliminated the undesired stimulation of the perforant or temporoammonic fibers. Single-pulse stimulation (a rectangular 50 μs pulse) was applied every 40 s in the order of no stimulation (i.e., at an intensity of 0 μA), stim A, a combination of stim A and stim B (stim A&B), and stim B. The stimulation intensity was set from 50 to 300 μA so that ∼15% of CA1 neurons fired action potentials. To obtain the mean firing probability, this stimulation cycle was repeated 10 times over a period of ∼27 min (4 stimulation types × 40 s intervals × 10 cycles). The same monitoring session was repeated from 30 to 57 min after the induction of plasticity. This long period of imaging (total 54 min) caused no significant photobleaching or photodamage (Sasaki et al., 2007). Plasticity was induced by pairing protocols in which stim A and stim B were paired at 0 or 10 ms intervals and repeatedly applied 20 times at 1 Hz.
Figure 2.

Spike responses of CA1 neuron populations to combinatorial DG inputs: calcium imaging. A, Experimental design to examine the activity flow through hippocampal polysynaptic networks. Two stimulating electrodes were placed on the infrapyramidal (stim A) and suprapyramidal blades (stim B) of the DG granule cell layer. An incision was made along the thick black lines to anatomically isolate the two stimulation sites. Stim A, stim B, and simultaneous stim A&B were given 10 times each, and the spikes of CA1 neurons were monitored using fMCI. B, Simultaneous cell-attached recording and calcium imaging revealed that spikes elicited transient calcium elevations in the soma. C, Representative spike responses of 67 CA1 neurons to a single stim A. Calcium traces were superimposed onto an OGB1 fluorescence image (top). Neurons that fired are indicated by red circles in the bottom cell map. D, Slices were post hoc immunolabeled with NeuN and GABA, and only PCs were analyzed. E, Firing patterns of 183 CA1 PCs in a slice in response to stim A (top), stim B (middle), and stim A&B (bottom) (10 trials each). The mean firing probability across 10 trials (mean) is shown in the bottom rastergrams and the right cell map in a pseudocolor scale.
Cell identification.
After the experiments, the slice were fixed overnight in 4% paraformaldehyde and 0.1 m PB. They were permeabilized with 0.3% Triton X-100, and nonspecific antibody binding was blocked by 5% goat serum for 60 min at room temperature. The slices were then treated with primary antibodies against NeuN (mouse, 1:400; MAB377, Millipore Bioscience Research Reagents) and GABA (rabbit, 1:1000; A2052, Sigma-Aldrich) overnight at 4°C and with secondary anti-mouse IgG Alexa Fluor 488 (1:400; A11001, Invitrogen) and anti-rabbit IgG Alexa Fluor 594 (1:400; A11012, Invitrogen) antibodies in 2% goat serum for 6 h at room temperature. The slices were imaged in PBS with a laser-scanning confocal microscope (MRC-1024; Bio-Rad). Inhibitory neurons were distinguished from excitatory PCs on the basis of GABA immunoreactivity.
Spike detection.
Regions of interest (ROIs, ϕ = ∼10 μm) were established on neuronal cell bodies by referring to measured OGB1 and NeuN signals. The time-series fluorescence intensity of each ROI was measured, and spikes were reconstructed using custom-written software in NIH ImageJ, MATLAB (The MathWorks), and Microsoft Visual Basic as previously described (Ikegaya et al., 2004; Sasaki et al., 2008). Briefly, the fluorescence Ft at time t was calculated as:
where Fraw is the raw fluorescence intensity in a given ROI at time t, Fbackground is the mean fluorescence intensity in the entire imaged field at time t, and Fpre_background is the mean fluorescence intensity in the entire imaged field that was averaged from −500 to 0 ms before stimulation. This background compensation was required to remove stimulation-evoked presynaptic and dendritic calcium signals, which occasionally led to false-positive spikes (Sasaki et al., 2006). The fluorescence change, ΔF/F, was calculated as (Ft − F0)/F0, where F0 is the mean Ft over a period of 500 ms before stimulation. A transient ΔF/F increase with a >3.5% amplitude and >10%/s maximal first derivative (Δt = 0.3 s) was automatically defined as a spike-triggered calcium signal (Sasaki et al., 2007) and then inspected by eye so as to remove any noise that was detected in error. Spikes were analyzed using custom-written software with MATLAB, Microsoft Visual Basic, and Visual Basic for Application Excel (Microsoft). Because patch-clamp analysis revealed that CA1 PCs fired action potentials within 100 ms after DG stimulation, calcium transients with latencies of <100 ms poststimulation were considered to be stimulation-evoked responses. Neurons that did not respond to any patterns of stimulation were excluded from the subsequent analyses because they might not be embedded in the activated network. To statistically control trial-to-trial variation in each cell, we considered the firing probability (P) to be the proportion of trials that evoked spikes in a total of 10 trials. Although the stimulation intensities of stim A and stim B were adjusted so as to induce ∼15% of the CA1 neurons to fire, the mean P values varied slightly from slice to slice and could not directly be compared among different slices. Thus the firing probability was standardized (Z score) to minimize the variability and facilitate mass statistics. For the firing probability (Pi) of the celli, the Zi score was defined as:
where Pall and σall are the mean and SD of the firing probability of all cells that were monitored in the slice that included the celli. After the induction of plasticity, the Zi score was calculated using Pall and σall before the induction of plasticity.
Data analysis.
For each cell, the firing probability P to stim A&B was statistically expected based on two experimentally obtained firing probabilities in reaction to either stim A and stim B (PA and PB) on the assumption that the activities that were evoked by either stim A and stim B were independent during propagation. The spontaneous spike rate, i.e., the firing probability by no stimulation (Pspont), was also considered so as to avoid the additional contributions of background activity to this calculation, although spontaneous activity was reduced under our experimental conditions as described above (thus, Pspont = 0 in most neurons). The expected firing probability by stim A&B (Pexp) is:
 |
Based on the bimodal distribution, the number of successful trials that evoke spikes (n) out of a total of 10 trials conforms to a probability mass function f(n):
 |
This expected distribution was compared with the experimentally observed firing probability in reaction to stim A&B (Preal). When Preal fell within the upper 5% or lower 5% of the distribution of f(n), the neuron was defined as an AND-like or XOR-like logical operator, respectively.
Repetitive paired stimulation-induced changes in the cell frequency were estimated as (Nafter − Nbefore)/(Nafter + Nbefore), where Nbefore and Nafter are the numbers of neurons in a given 1 × 1 square bin area in a two-dimensional space of the standardized firing probabilities ZA and ZB. This value was spatially Gaussian-filtered (σ = 1) and pseudocolored, with warmer colors indicating increases in frequency (see Figs. 5C,F, 6B). To depict the movement of neurons in the Z plot, vectors were calculated as the sums of all outgoing vectors from the bin areas and all incoming vectors to the bin areas.
Figure 5.
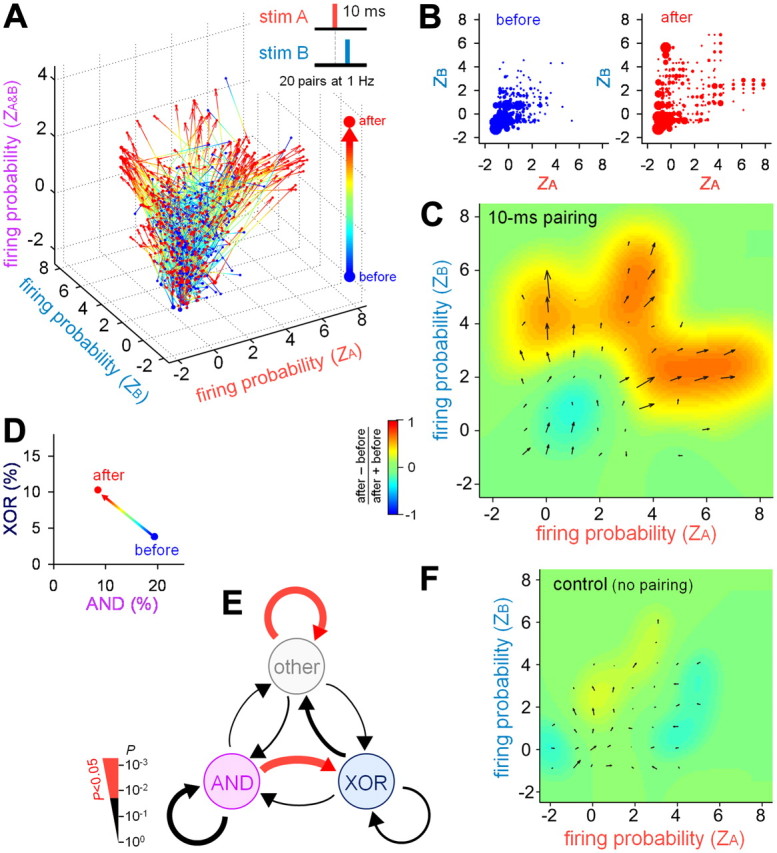
Repetitive paired stimulation-induced remodeling of the logical operation (10 ms interval). A, Standardized firing probability (Z score) of 680 PCs from 11 slices in response to stim A, stim B, and stim A&B before and after 20 10-ms-interval pairs of stim A and stim B at 1 Hz. B, A two-dimensional Z-score plot of stim A versus stim B before (left) and after (right) repetitive paired stimulation. C, Illustration of the changes in the CA1 firing properties. Each vector indicates the average Z-score movement (direction and distance), which is calculated as the sum of all outgoing vectors from a given area and all incoming vectors to the area. The background pseudocolor image indicates a relative change in the number of neurons, which is defined as (Nafter − Nbefore)/(Nafter + Nbefore), where N is the number of neurons in an area. D, Pairing-induced changes in the ratios of AND/XOR neurons. E, Pairing-induced switching in the AND/XOR properties. The thickness of the vectors indicates P values that were assessed by the χ2 test in which the trend to convert one operator to another was compared with the value that was expected under the null hypothesis of independence between the prior and posterior distributions. F, No significant changes in the CA1 firing properties occurred in the absence of repetitive paired stimulation. The illustration details are the same as in C. N = 1604 neurons from 15 slices.
Figure 6.

Repetitive paired stimulation-induced remodeling of logical operations (0 ms interval). A, The standardized firing probability (Z score) of 679 neurons from 11 slices in response to stim A, stim B, and simultaneous stim A&B before and 30 min after 20 pulses of simultaneous stim A&B at 1 Hz. B, Repetitive paired stimulation-induced changes of the CA1 firing properties. The Z-score movement vectors are superimposed onto the pseudocolor-scaled change in the number of neurons in a given area. C, Pairing-induced changes in the fractions of AND/XOR neurons. D, Pairing-induced AND/XOR switching. The vector thickness indicates P values that were assessed via the χ2 test.
Hippocampal network model.
All model neurons obeyed the Izhikevich's formulation (Izhikevich, 2004):
 |
where a = 0.02, b = 0.2, c = −65, and d = 8 for excitatory pyramidal neurons (Ex), whereas a = 0.1, b = 0.2, c = −65, and d = 2 for fast-spiking inhibitory interneurons (Inh). All neurons received a weak background input that can be represented as Gaussian white noise of mean 0 and a diffusion constant of 3.0 mV2/ms. Our hippocampal network model consisted of CA3 and CA1 layers, both of which had 400 excitatory and 100 inhibitory neurons with a total of ∼172,000 AMPA and ∼55,000 GABA synapses. Approximately 67% of the excitatory synapses were modifiable. Excitatory-to-excitatory and excitatory-to-inhibitory inputs were mediated by AMPA receptor-mediated glutamatergic synapses, whereas inhibitory-to-excitatory and inhibitory-to-inhibitory synaptic transmissions were mediated by GABAA receptors. Synaptic currents are described as:
 |
where the gating variables s(t) of AMPA and GABAA synapses were increased by 1.0 at the arrival of every presynaptic spike and then decayed following first-order kinetics with a decay constant of 5 ms. The reversal potentials of synaptic currents were set as EAMPA = 0 mV and EGABA = −70 mV, and the values of maximum conductance were gAMPA= [0.250, 0.275, 0.300, 0.325, 0.350] mS and gGABA = [0.8, 1.0, 1.2, 1.4, 1.6] mS, as depicted below in Figure 8, C and D, and gAMPA = 0.3 mS and gGABA = 1.2 mS, as depicted below in Figure 8E–I.
Figure 8.

Fitting a hippocampal network model to the experimental data: numerical simulation. A, Schematic illustration of the network organization model. The model consisted of the CA3 and CA1 layers, each of which contained 400 excitatory and 100 inhibitory neurons. The numbers near the arrows indicate the connectivity densities of the corresponding synaptic pathways. Stim A and stim B were set to activate mutually exclusive 20% CA3Ex neurons. B, Examples of the spiking of CA1 and CA3 neurons after four conditions of stimulation, i.e., no stimulation (background activity), stim A, stim B, and stim A&B. Stimulation was applied at the times that are indicated by the arrowheads. C, The fractions of AND (left) and XOR (right) neurons at various time differences (−30 ms to +30 ms) between stim A and stim B were calculated as dual functions of AMPA receptor-mediated (gAMPA) and GABAA receptor-mediated (gGABA) maximum conductances. Each box includes the fractions that were obtained from the experiment (gray line, the same as Fig. 4C) and the model (black line). The background color represents the mean Z scores of the AND or XOR ratios across different timings, i.e., the fitness to the model. D, Fitness of the model. The box color represents the mean Z scores (the fitness to the model) of the AND and XOR ratios at 0 ms, indicating that the difference between the experimental and modeling results was the lowest at gAMPA = 0.3 mS and gGABA = 1.2 mS. E, Comparison of the AND/XOR fractions at the optimized parameters gAMPA = 0.3 mS and gGABA = 1.2 mS. F–I, Synapse weights from stimulated (F) or nonstimulated (G) CA3Ex neurons and CA3Inh (H) or CA1Inh (I) neurons onto AND/XOR neurons. The mean weights were normalized to those of other (non-AND/XOR) neurons, which are shown by horizontal black bars (mean) and gray lines (SEM). Error bars are SEM. *p < 0.001 versus “other,” Welch's test.
The connectivity of CA3-to-CA3 synapses was 50%, and that of the other projections was 30%. These synaptic connections are not specific to the types of presynaptic and postsynaptic neurons. CA1-to-CA1 synaptic connections were randomly wired with a 30% connectivity, and CA1Ex-to-CA1Ex connections were eliminated because CA1 has very few recurrent excitatory connections (Deuchars and Thomson, 1996).
AMPA synapses at CA3Ex-to-CA3Ex and CA3Ex-to-CA1Ex projections were modifiable according to spike timing-dependent plasticity (STDP) (Bi and Poo, 1998; Abbott and Nelson, 2000; Song et al., 2000):
 |
where Δt is the relative time between presynaptic and postsynaptic spikes. The additive STDP was used, and the parameter values were set as A+ = 0.05, A− = 0.0525, and τ+ = τ− = 20 ms.
Recent experimental findings have shown that excitatory synapses onto CA1 interneurons are also plastic (Kullmann and Lamsa, 2007). CA3Ex-to-CA1Inh excitatory synapses have been shown to have Hebbian plasticity, in which the conductance of a synapse is modified whenever a presynaptic spike arrives at the synapse:
where a = 0.05, r0 = 20, T = 2.0, and b = |a|/2, and the instantaneous firing rate of a postsynaptic neuron is described as follows:
 |
CA1Ex-to-CA1Inh excitatory synapses obey anti-Hebbian plasticity, which is described by the same above equations but with a = −0.05. In all of the simulations with plastic synapses, the conductance of excitatory synapses was bounded to a value that was below twice gAMPA.
Two independent external inputs with Istim = 7.5 mA were applied to 20% of the CA3 pyramidal neurons. These inputs mimicked the DG stimuli in the experiments. The responses of pretrained and post-trained networks were tested in four different conditions (no stimulation, stim A, stim B, and stim A&B), each consisting of 10 trials (200 ms in length). All plasticity rules were turned off in these test simulations. For each combination of the four plasticity rules, we trained the network with stim A followed by stim B at an interval of 10 ms.
To classify neuronal responses, we examined whether each neuron fired impulses within 100 ms after the applied stimulus and calculated the response probability in each stimulus condition as the number of trials with spike responses divided by the total number of trials. Next, the logic operation of each neuron was determined from its firing probability according to the same criteria that were used in experiments. The index of the plasticity-induced activity change was defined as:
where Ppre_x and Ppost_x correspond to the firing probabilities of individual neurons in the condition X = [stim A, stim B, stim A&B] before and after the training session, respectively. In Figure 9C (see below), the abscissa indicates the average C values that were separately obtained for stim A and stim B.
Figure 9.

Plasticity rule-dependent AND/XOR reorganization: numerical simulation. A, Schematic illustration of the synaptic plasticity rule that was incorporated into our hippocampal network model. CA3Ex-to-CA3Ex and CA3Ex-to-CA1Ex synapses were equipped with STDP, whereas excitatory CA3Ex-to-CA1Inh and CA1Ex-to-CA1Inh synapses were equipped with Hebbian and anti-Hebbian synaptic plasticity rules, respectively. Four types (I–IV) of the network models were generated based on all of the possible combinations of the synaptic plasticity rules, which are shown in the bottom table, in which “on” and “off” indicate the implementation of the corresponding rule and the wildcard (*) allows either on or off. B, Repetitive paired stimulation-induced changes in the fractions of AND/XOR neurons in the four model types. Each type, except for type III, contains four datasets (mean ± SD), which correspond to four (= 22) possible on/off combinations of two rules that were applied to the CA3Ex-to-CA1Ex and CA3Ex-to-CA1Inh synapses. Three datasets are shown in the type III model, in which at least one of the CA3Ex-to-CA1Ex and CA3Ex-to-CA1Inh synapses are turned on (22 − 1 = 3). The error bars represent the SD of 10 trials with different random seeds. The closed squares represent experimental data before (blue) and after (red) the presentation of repeated stimuli. C, The normalized response change, which is defined as (Pafter − Pbefore)/(Pafter + Pbefore), was calculated for stim A or stim B (abscissa) and stim A&B (ordinary), where P is the firing probability of CA3Ex neurons before and after repetitive paired stimulation. Each dot indicates a single CA3Ex neuron.
The simulation software was written in C and MATLAB and executed on a Quad-core Xeon 3.2 GHz × 2 CPU personal computer.
Results
The total number of neurons in the hippocampal slice cultures
To estimate the network size that was studied in this work, we conducted two-photon reconstruction of all of the neurons in the hippocampal slice cultures. Neurons were identified based on NeuN immunoreactivity, which is a marker that is specific to the nuclei of neuronal cells (Fig. 1A). We selected a typical slice and counted the total number of neurons in each hippocampal subregion. The slice contained 8168 neurons in the DG, 4208 neurons in the CA3, and 4409 neurons in the CA1.
Figure 1.
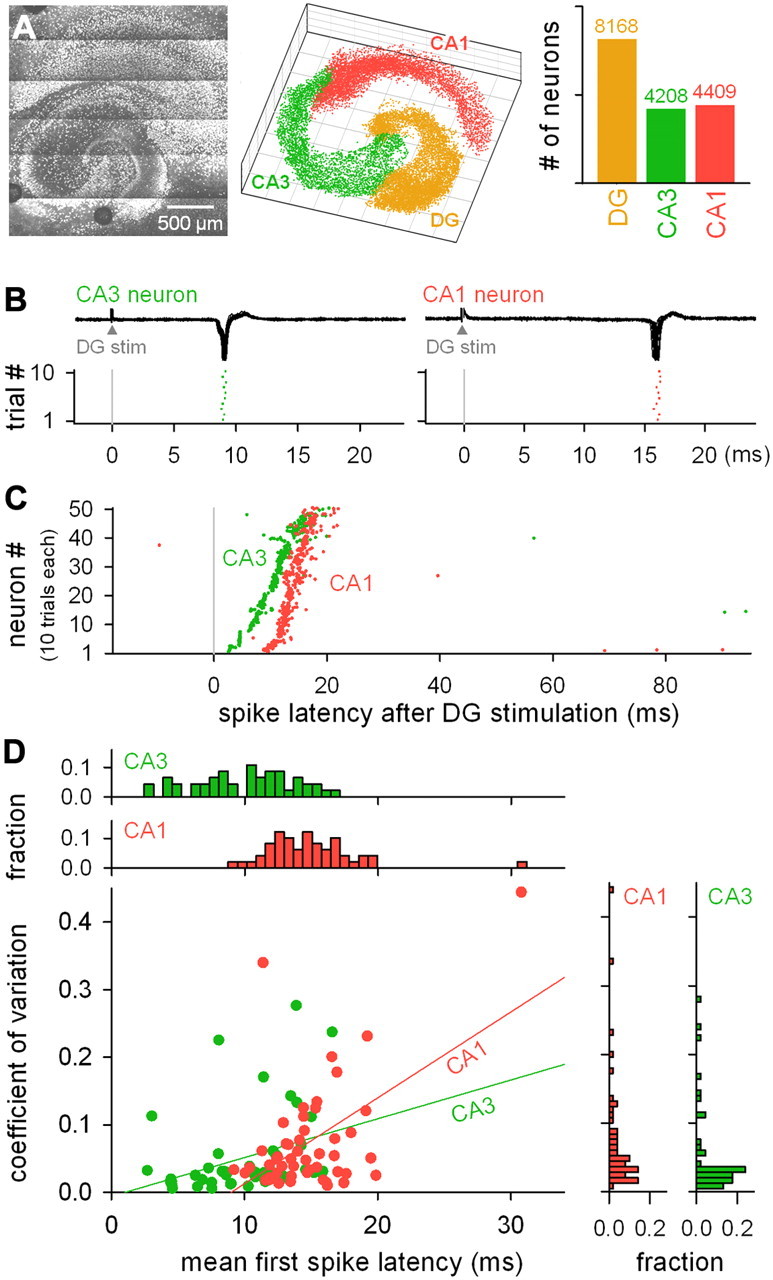
Characterization of DG stimulation-evoked action potentials in CA3 and CA1 neurons: patch-clamp recording. A, NeuN-positive neurons in the DG, CA3, and CA1 regions of a slice were two-photon imaged (left), and the locations (middle) of individual cells and their numbers (right) were measured. B, Representative cell-attached recordings (top) and spike timings (bottom) of CA3 and CA1 PCs after single-pulse stimulation of the DG granular cell layer. C, Raster plots of 50 responsive CA3 and CA1 neurons, each of which involves spikes in response to 10 trials of DG stimulation. Neurons were sorted via the mean first-spike latency. The distributions of the spike latency of the CA3 and CA1 neurons are significantly different (p < 0.01, two sample Kolmogorov–Smirnov test, N = 459 CA3 and 439 CA1 spikes that occurred at latencies ranging from 1 to 100 ms after DG stimulation). D, The CV of the first-spike latency of each individual neuron was plotted against the mean first-spike latency. Only neurons that showed spikes in more than two of 10 trials of stimulation are shown. Each dot represents a single neuron. The depicted lines represent the best linear fit (CA3, r = 0.33, p = 0.02; CA1, r = 0.53, p < 0.001). The top and right histograms indicate the mean spike latency and CV distributions, respectively.
The spike responses of CA3 and CA1 neurons to DG stimulation
The DG granular cell layer was single-pulse stimulated, and the evoked spikes were cell-attached recorded from the CA3 and CA1 PCs (Fig. 1B). The PCs responded typically with single spikes and very rarely with multiple or burst spikes (Fig. 1C). On average, the CA3 PCs responded significantly earlier than the CA1 PCs; the first-spike latency (mean ± SD) was 10.1 ± 3.8 ms in the CA3 PCs and 15.1 ± 6.8 ms in the CA1 PCs (Fig. 1D, p < 0.01, Kolmogorov–Smirnov test). In both the CA3 and CA1 PCs, the coefficient of variance (CV) of the spike latency positively correlated with the mean spike latency (Fig. 1D), and the correlation coefficient R was 0.33 and 0.53, respectively. Although some neurons had CVs of <0.05 even at a mean spike latency of >15 ms, these positive correlations imply that, as a whole, spike timings become less accurate during polysynaptic processing, consistent with a previous study using organotypic cultures of neocortical slices (Buonomano, 2003).
Logical operator-like CA1 output
Cultured slices were loaded with the fluorescent calcium indicator OGB1. DG stimulation-evoked calcium responses were imaged from 94 ± 36 CA1 neurons per slice (mean ± SD, 45–209 neurons, N = 58 slices) using fMCI (Fig. 2A). Two independent sites in the DG were alternatively (stim A or stim B) or concurrently (stim A&B) stimulated at an interval of 40 s. Cell-attached recordings revealed that transient calcium increases in the neuronal somata reflected action potentials (Fig. 2B). Consistent with this, the calcium responses of the CA1 neurons followed an all-or-none fashion. Thus, neurons that did or did not emit spikes were firmly identifiable (Fig. 2C). The stimulation intensity was set to evoke action potentials in ∼15% of the CA1 neurons. After imaging, the slices were processed for NeuN and GABA immunostaining (Fig. 2D), and PCs were selected for data analysis. Inhibitory interneurons were not analyzed in this study because the sample size was not large enough for population statistics.
Typical responses to stim A, stim B, and stim A&B in a slice culture are shown in Figure 2E. There was trial-to-trial variation in spike responses; hence, we calculated the mean firing probability (P) across 10 trials for individual cells. To pool data from different slices, we normalized P to the Z score, which was defined as Z = (P − Pall)/σall, where Pall and σall are the mean and SD of the mean firing probability of all of the neurons in the same slice. The Z value has mean = 0 and SD = 1, and higher firing probabilities score higher Z values. The Z scores in response to stim A, stim B, and stim A&B (ZA, ZB, and ZA&B, respectively) of 3466 neurons from 44 slices were plotted in two-dimensional spaces of ZA versus ZB, ZA versus ZA&B, and ZB versus ZA&B (Fig. 3A). These plots indicate a vast diversity of neuronal responses. For example, some neurons favored stim A over stim B, whereas other neurons exhibited the opposite preference. Some neurons responded more or less strongly to stim A&B compared with either stim A or stim B.
Figure 3.

Logical connective-like responses of CA1 pyramidal cells to combinatorial DG inputs. A, Standardized firing probability (Z score) is plotted in two-dimensional spaces of stim A versus stim B (left), stim A versus stim A&B (middle), and stim B versus stim A&B (right). The size of each dot indicates the number of neurons that fell into the corresponding data point. The top and right histograms indicate the distributions of the Z scores. B, The frequency of logical operator-like neurons. C, AND/XOR neurons are shown in a three-dimensional Z-score space of stim A, stim B, and stim A&B. D, Spatial distribution of AND/XOR neurons. CA1 PCs are superimposed into a single cell map after spatial adjustment by rotation or inversion of the CA1 PC layer so that the left-to-right direction represents the direction from the CA3 region to the subiculum, and top toward the stratum oriens. Data were obtained from 3466 neurons in 44 slices.
This diversity motivated us to classify the neuronal response profiles. Analogous to Boolean calculus, we defined logical conjunction-like responses (AND) and exclusive disjunction-like responses of individual neurons (XOR) as whether the firing probability to stim A&B (PA&B) is statistically larger or smaller than the combinatorial probability that was expected from PA and PB on the assumption of the independence of stim A and stim B (see Materials and Methods). Neurons that exhibit AND-like behaviors, which are termed AND neurons herein, may work to combine two DG inputs, whereas XOR neurons may function so as to avoid cross talk between two inputs. Of the 3466 neurons, 22.6% were AND neurons and 5.1% were XOR neurons (Fig. 3B,C). To compare these frequencies to statistical chance, we generated 1000 surrogates, in which spikes were randomly shuffled within a rastergram of stim A, stim B, and stim A&B each. The original datasets involved both AND and XOR neurons significantly more often than any of the 1000 surrogates (i.e., p < 0.001), indicating that the existence of AND/XOR neurons cannot be explained by mere chance. Interestingly, AND and XOR neurons coexisted in 37 (84%) of the 44 test slices, suggesting parallel integration and segregation. The distributions of AND/XOR neurons in the CA1 PC layer did not show a specific spatial pattern (Fig. 3D).
Of the remaining 72.3% neurons (non-AND/XOR type), 6.4% had ZA > 1 and ZB > 1 (OR-like responses), 9.1% neurons had ZA > 1 and ZB ≤ 1 (stim A-biased responses), and 9.4% neurons had ZA ≤ 1 and ZB > 1 (stim B-biased responses) (Fig. 3B).
In the above experiments, stim A&B was presented as a simultaneous (zero-time lag) application of stim A and stim B. To examine how the relative timing of stim A and stim B affects the observed AND/XOR responses, we applied stim A and stim B at time differences of −30, −10, −5, 0, 5, 10, and 30 ms (Fig. 4A). Different stimulation timings produced different firing probabilities and AND/XOR responses from individual neurons (Fig. 4B). The overall tendency of the AND/XOR ratios was obtained from 1182 neurons in 14 slices (Fig. 4C). Larger time differences resulted in a decrease in AND neurons and an increase in XOR neurons, although the total fraction of neurons exhibiting these logical properties was consistently ∼20%, regardless of the stimulation timings. For behaviors of individual neurons, a fraction of AND neurons at some stimulation timing exhibited XOR responses at other stimulation timings, and vice versa (Fig. 4D), indicating that their logical properties are switchable depending on the relative timing of the two inputs. We did not examine larger time differences, because our definition of AND/XOR responses was applicable to only spikes within a latency of 100 ms after stimulation; however, we expect that the interaction between stim A and stim B disappears for longer lags, because network responses to the stimulation are transient and typically terminate within 30 ms (Fig. 1C,D).
Figure 4.

Spike timing-dependent switch of logical operation. A, Schematic of combinatorial DG stimuli with different timings (Δt). Stim A and stim B were applied in pairs using time lags of −30, −10, 5, 0, −5, 10, and 30 ms. B, Representative cell maps of the firing probability (top) and AND/XOR neurons (bottom) in 113 CA1 PCs of a slice in response to paired DG stimuli. C, The ratios of AND/XOR neurons to the total 1182 neurons that were obtained from 14 slices as a function of the time interval between stim A and stim B. D, The ratio of the number of neurons that were XOR at Δt = ±30 ms and AND at Δt = ±10, ±5, and 0 ms to the total number of XOR neurons at Δt = ±30 ms (purple) and the ratio of the number of neurons that were AND at Δt = 0 ms and XOR at Δt = ±30, ±10, and ±5 ms to the total number of AND neurons at Δt = 0 ms (dark blue) are plotted.
The long-lasting plasticity of logical operations
To examine whether logical operator-like neurons can be remodeled in a use-dependent manner, we applied a repetitive paired stimulation of stim A and stim B (20 paired stimuli at 1 Hz). First, we used a 10 ms time lag between stim A and stim B that was analogous to STDP (Markram et al., 1997; Bi and Poo, 1998, 1999) and remonitored the responses from the same neuron populations after 30–60 min. The 0 ms lag was used as stim A&B. The repetitive paired stimulation induced a substantial change in the firing responses (Fig. 5A; N = 680 neurons from 11 slices). The Z scores before and after the pairings are shown in Figure 5B, and their average changes are illustrated in Figure 5C. The Z-score dynamics appeared to exhibit three streams: (1) more responsive to stim A only (rightward movement, Fig. 5C), (2) more responsive to stim B only (upward movement), and (3) more responsive to both stim A and stim B (diagonal right-up movement). Interestingly, this reorganization accompanied a decrease in the number of AND neurons and an increase in the number of XOR neurons (Fig. 5D). The changes between logical operators were evaluated using the χ2 test under the null hypothesis of independence between the prior and posterior distributions (Fig. 5E). Significant movement was found from AND neurons to XOR neurons, indicating that a portion of AND neurons switched their response properties to XOR. No remodeling occurred in the control experiments without a repetitive paired stimulation (Fig. 5F, N = 1604 neurons from 15 slices).
We next applied a repetitive paired stimulation of stim A and stim B with a time lag of 0 ms (20 stimuli at 1 Hz). This pairing protocol also induced a global change in firing responses (Fig. 6A); however, unlike the case of the 10-ms-lag pairing, the Z-score dynamics showed only diagonal movement toward the upper right (Fig. 6B). This reorganization was accompanied by a decrease in the number of AND neurons and an increase in the number of XOR neurons (Fig. 6C), although we detected no significant switching between logical operators (Fig. 6D).
This apparent inconsistency suggests that our parameters may not completely capture what occurred during the remodeling. We thus introduced a new index, similarity, which is defined as the product of the Z scores of a given neuron in response to stim A and stim B, i.e., ZA × ZB. The similarity index is a more positive value when the responsiveness to stim A and stim B is similar, regardless of whether each is weaker (Z < 0) or stronger (Z > 0) than the average. A responsiveness is more negative when a neuron responds strongly to one stimulation (Z > 0) and weakly to the other (Z < 0). The similarity index distributions were compared before and after repetitive paired stimulation (Fig. 7). The similarity index distribution was significantly changed in slices that received pairings at time lags of 10 ms (Fig. 7A) and 0 ms (Fig. 7B) but not in control slices that did not receive pairings (Fig. 7C, Kolmogorov–Smirnov test). The 10 ms and 0 ms pairings exerted different effects, particularly on negative values of the similarity index. The 0 ms pairing led to a unidirectional shift in the distribution toward an increase in similarity, whereas the 10 ms pairing led to a bidirectional shift with an increase and decrease in similarity.
Figure 7.
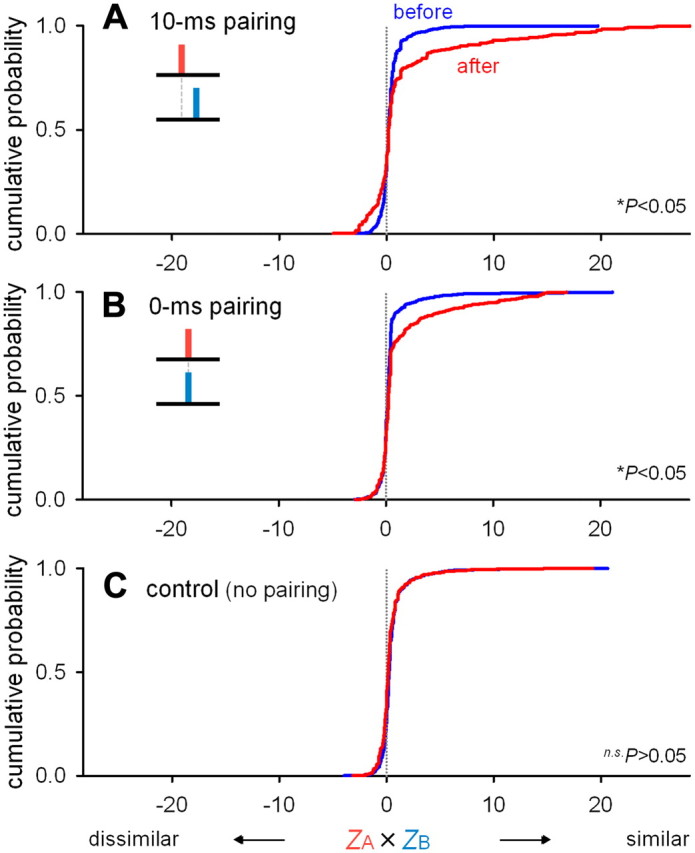
Plasticity-induced spike integration and segregation. A–C, Cumulative distributions of the similarity index in responses to stim A and stim B before and 30 min after repetitive paired stimulation at intervals of 10 ms (A) and 0 ms (B) and no paired stimulation (C). The similarity index in the abscissa is defined as the product of the standardized firing probability in stim A and stim B (ZA × ZB). A, *p < 0.05, before versus after, Kolmogorov–Smirnov test; N = 680 neurons from 11 slices. B, *p < 0.05, N = 679 neurons from 11 slices. C, n.s.p > 0.05, N = 1604 neurons from 15 slices.
Implications of the hippocampal network models
Recent experimental studies have revealed that hippocampal local circuits display a variety of Hebbian or anti-Hebbian synaptic plasticities (Kullmann and Lamsa, 2007). We constructed a computational model of hippocampal networks to test whether these plasticity rules can account for the observed changes in the neuronal responses (see Materials and Methods). The model consisted of the CA3 and CA1 layers. Each layer consisted of 400 excitatory and 100 inhibitory neurons (Fig. 8A). Stim A and stim B were set to exclusively activate 20% of the CA3Ex neurons.
A single neuron in this model does not necessarily represent a single biological neuron, but rather, corresponds to a single cell assembly, which is a group of neurons that show similar spiking behaviors. Likewise, a single synaptic weight in the model is not necessarily equivalent to a real unitary synaptic weight. Therefore, we first searched for AMPA (gAMPA) and GABA synapse (gGABA) weights that were suitable for replicating the experimental data. For this purpose, we referred to the fractions of AND and XOR neurons at various time differences between stim A and stim B (Fig. 4C). The strength of all of the synapses of the same type (AMPA or GABA) was set to be an identical value, and AND and XOR neurons were classified according to the same statistical criteria that were used in the experiments. The parameter fitting was separately conducted for AND neurons and XOR neurons, and the parameter values that were most consistent with the experimental results were identified (Fig. 8C,D). The interneurons were crucial for inhibiting runaway excitation of the CA3 recurrent network. Specifically, they were responsible for suppressing the responses to stim A&B and thereby realizing XOR-like operation. In contrast, the two stimuli only weakly recruited inhibitory neurons, in particular, when the two stimuli were presented alone or with a large time difference. As a result, the best fitting was given at gAMPA = 0.3 mS and gGABA = 1.2 mS (Fig. 8D,E).
We next analyzed synaptic connectivity in this optimized model network. AND neurons received significantly more numerous projections from the directly stimulated ensembles of CA3Ex neurons than XOR neurons (Fig. 8F); however, projections from the other nonstimulated CA3Ex neurons were not different between AND and XOR neurons (Fig. 8G). The inhibitory inputs from CA3Inh (Fig. 8H) and CA1Inh neurons (Fig. 8I) were stronger to XOR neurons than to AND neurons. Thus, the AND/XOR-like operations were identified to emerge, at least in part, from structurally defined neural connectivity.
Our experiments revealed that the repeated coapplication of stim A and stim B at a time difference of 10 ms induced a decrease in the number of AND neurons and an increase in the number of XOR neurons. We examined whether similar changes were replicable in our network model. Synaptic plasticity was now introduced at excitatory synapses. STDP was incorporated into CA3Ex-to-CA3Ex and CA3Ex-to-CA1Ex synapses, and Hebbian and anti-Hebbian synaptic plasticity was incorporated into CA3Ex-to-CA1Inh and CA1Ex-to-CA1Inh synapses, respectively (Fig. 9A; see Materials and Methods). For these four excitatory synaptic pathways, we tested all 15 (= 24-1, because all-off was not considered) possible on and off combinations for each synaptic plasticity rule. During these tests, we found that CA3Ex-to-CA1Ex STDP and CA3Ex-to-CA1Inh Hebbian plasticity had little effect; whether or not these two plasticity rules were embedded did not significantly affect AND/XOR remodeling (Fig. 9B). Therefore, we separated our models into four (= 22) types (type I–IV), depending on whether two other plasticity rules were incorporated, that is, type I: CA3Ex-to-CA3Ex STDP and CA1Ex-to-CA1Inh anti-Hebbian, type II: CA3Ex-to-CA3Ex STDP only, type III: none, and type IV: CA1Ex-to-CA1Inh anti-Hebbian only (Fig. 9A table). As shown in Figure 9B, our model best replicated the experimentally observed changes in the AND/XOR responses when STDP was on and anti-Hebbian was off (type II). This result is consistent with an experimental study reporting a lack of plasticity at excitatory synapses onto inhibitory postsynaptic neurons in cultured hippocampal neurons (Bi and Poo, 1998). The model that concurrently used STDP and anti-Hebbian (type I) was also consistent with the experimental observations, although the quantitative shift toward more XOR neurons exceeded the experimental data; however, we cannot exclude the type I model because the magnitude of the response shift may depend on the choice of the parameter values for modeling the synaptic plasticity. In contrast, the models that did not include STDP and anti-Hebbian (type III) did not show a significant shift. Finally, when STDP was off and anti-Hebbian was on (type IV), the responses shifted in the opposite direction so as to favor more AND neurons.
Because the above comprehensive analyses consistently underlined the importance of synaptic modification in CA3Ex-to-CA3Ex recurrent connectivity rather than a CA1 read-out from the CA3 neuron layer, we sought to compare the responsiveness of CA3Ex neurons to stim A, stim B, or stim A&B before and after the induction of plasticity (Fig. 9C). Although the responses of the directly stimulated CA3Ex neuron groups were not largely changed as a whole, the majority of the nonstimulated CA3Ex neurons became more strongly responsive than those previously to a single stimulus (stim A or stim B) without altering the responsiveness to stim A&B. Thus, the increase in XOR CA1 neurons seems to be primarily attributable to an acquired responsiveness of nonstimulated CA3Ex neurons to either stim A or stim B.
Experimental reconfirmation of the simulation results
Finally, we attempted an experimental confirmation for plastic changes in CA3 responses, which were predicted from our computational model. Specifically, if our model is correct, the intracellular responses in CA3 neurons to stim A or stim B must be enhanced after the induction of plasticity, whereas the responses to stim A&B was not altered. To confirm this prediction, we returned to electrophysiological recordings (Fig. 10A). CA3 PCs were voltage-clamped at −70 mV to monitor EPSCs evoked by stim A, stim B, and stim A&B (0 ms interval). To evaluate the total synaptic charge that involves the monosynaptic and polysynaptic components during network activation, we calculated the area under the EPSC curve. As expected by our simulation, we found a significant increase in the synaptic charge to either stim A or stim B (p = 0.038, t(9) = 2.437, paired t test), but not to stim A&B (p = 0.244, t(4) = 1.367), after application of 20 pairs of stim A&B at a time difference of 10 ms (Fig. 10B,C).
Figure 10.

Repetitive paired stimulation-induced alteration in CA3 responses. A, Experimental design. A CA3 PC was voltage-clamped at −70 mV, and the area under the curve (AUC) of an EPSC event was measured as a synaptic charge during network activation. Plasticity was induced by 20 pairs of stim A and stim B at an interval of 10 ms. B, Representative traces of EPSCs evoked by stim A, stim B, and stim A&B (0 ms interval) before (blue) and after (red) the plasticity induction. C, Summary of data obtained from 6 CA3 PCs in 6 slices. Single stimulation (stim A or stim B). Paired t test.
Discussion
We have demonstrated that hippocampal polysynaptic networks respond to combinatorial inputs with logical operator-like outputs, and that this computation is subject to use-dependent plasticity. This gross-scale flexibility may represent a circuit basis for parallel distributed processing through which learning embodies pattern completion and separation.
AND-like and XOR-like logical operators
The neuron is a nonlinear operator that acts as an integrate-and-fire unit. As it has a threshold that must be reached for it to emit an action potential, stronger synaptic inputs are more apt to make the neuron fire. Thus, a neuron typically behaves as an AND-like unit. Nonetheless, we found a significant fraction of XOR-like neurons. XOR is one of the fundamental connectives in the logic circuit and may contribute to the segregation of information into dissimilar patterns by routing it to different pathways; however, the so-called “XOR problem” exists in computational neuroscience, that is, an XOR function cannot be implemented by the perceptron, which is an artificial neural network that has no hidden layer (Rosenblatt, 1957). In general, the XOR operator requires a hidden layer, unlike AND/OR operators, which are possible via two simple layers that consist of an input layer and an output layer. In the hippocampus, the CA3 layer may work as a hidden layer to realize XOR-like operations. Consistent with this idea, our previous study using monosynaptic stimulation of Schaffer collaterals demonstrated that CA1 neurons responded simply to more synchronous inputs with higher firing probabilities, which is a sign of AND-like operation (Sasaki et al., 2006). Vogels and Abbott (2005) have detected XOR-like gating in the ongoing activity of a large-scale recurrent network model by specifically searching for a circuit motif in which two input layers drive excitatory and inhibitory neurons, with inhibitory neurons synapsing onto excitatory neurons in the hidden layer. This study emphasizes the role of inhibitory interneurons in creating XOR gates. Our computational model indicated that AND-like CA1 neurons tended to be more directly activated (i.e., bisynaptically) by DG inputs than XOR neurons, whereas XOR neurons received more inhibitory inputs via feedforward and feedback pathways. These inhibitory inputs may prevent the firing of XOR neurons when stim A and stim B were coapplied.
Simple recurrent networks
Previous studies on synaptic modifications have primarily focused on synapses that are made by a stimulated neuron. The present work was oriented toward more mesoscopic behaviors that are exhibited by neuron populations and designed to focus on the input-output relationship in hippocampal polysynaptic pathways that have been intercalated by a hidden CA3 layer. Because the CA3 layer is an auto-associative circuit, our preparations conceptually resemble artificial “simple recurrent networks” (McClelland and Rumelhart, 1989), such as an Elman-type network, a three-layer network in which a middle (hidden) recurrent layer is inserted between an input layer and output layer in a feedforward manner (Elman, 1990; Maass et al., 2002). The performance and capability of the Elman network has been exclusively addressed in silico. Thus, our work may be the first to provide biological evidence for this type of network.
We discovered that hippocampal circuits can discriminate the time difference between two inputs with a temporal resolution on the order of milliseconds by altering AND/XOR ratios. This is consistent with the ability of the Elman network to respond to a specific input sequence with a particular spatiotemporal output pattern. Hippocampal networks responded to two inputs with larger time differences with more XOR outputs, suggesting that temporally separated patterns are converted into more distinct patterns. Our cell-attached recordings indicated that CA3 spiking involved monosynaptic as well as delayed polysynaptic responses, suggesting that polysynaptic recurrent activation engages “unstimulated” CA3 PCs that are not directly innervated by stimulated DG neurons. This recurrent activity can serve as a memory trace of immediately preceding inputs and can be intermingled into subsequent inputs. This contributes to the temporal association of two inputs.
We also demonstrated activity-dependent modifications of the AND/XOR responses. Our computer simulation suggests that the central process that is responsible for transforming the logical operations is synaptic plasticity in the CA3 recurrent network, which causes a persistent change in the responsiveness of unstimulated CA3 PCs. After two different inputs were repeatedly presented with similar timings (0 ms pairing), the circuit shifted to produce more similar output patterns, whereas after two inputs were repeated at more different timings (10 ms paring), the resultant responses involved more dissimilar patterns, in addition to more similar patterns. This disparity in the “similar-get-more-similar” and “dissimilar-get-more-dissimilar” regimes helps adaptively increase contrast and sharpness in neural responses. Importantly, this adaptation autonomously occurred without any teacher or reinforcement. It resembles the ability of the Elman network to learn and predict temporal sequences in an unsupervised fashion (Elman, 1990).
The DG-CA3 network has been shown to mediate a dynamic competition between two complementary processes of associative memory networks (Hopfield, 1982), i.e., pattern completion (or association) and pattern separation (Guzowski et al., 2004; Lee et al., 2004; Leutgeb et al., 2004; Vazdarjanova and Guzowski, 2004; Leutgeb and Leutgeb, 2007). Pattern completion is the ability of a network to respond to a degraded input pattern with the previously memorized pattern. Pattern separation is the ability to make the stored representations of two input patterns more dissimilar to reduce errors in memory recall. Therefore, a network that is suitable for pattern completion tends to generate similar outputs to different input patterns, whereas a network that is suitable for pattern separation tends to produce dissimilar outputs to similar input patterns. Our findings on plasticity-induced changes in hippocampal output suggest that the temporal relationship between stimuli may be crucial for regulating the function of the DG-CA3 network between the two competing processes.
Ex vivo networks as an experimental model
Our findings were derived from experimentally designed ex vivo systems that used artificial stimulation and should be extrapolated to in vivo systems with caution because cultured networks may be subject to aberrant axonal regeneration and circuit reorganization during cultivation. Nonetheless, our findings are still valuable for outlining generic computational properties that could spontaneously emerge through self-organization. We believe that our ex vivo networks that consist of thousands of neurons provide a basic platform to address how microscopic synaptic properties bring about the mesoscopic dynamics of complex neuronal networks. Thus, this work presents an experimental framework to address such questions under more realistic conditions.
Footnotes
This work was supported in part by Grants-in-Aid for Science Research (nos. 18021008, 22115003, 22115013, 22650080, and 22680025) from the Ministry of Education, Culture, Sports, Science and Technology of Japan; the Suzuken Memorial Foundation; the Kanae Foundation for the Promotion of Medical Science; Sasakawa Scientific Research Grant 19-448 from The Japan Science Society; the Daiichi-Sankyo Foundation of Life Science; and the Funding Program for Next Generation World-Leading Researchers (no. LS023).
References
- Abbott LF, Nelson SB. Synaptic plasticity: taming the beast. Nat Neurosci. 2000;3:1178–1183. doi: 10.1038/81453. [DOI] [PubMed] [Google Scholar]
- Amaral D, Lavanex P. Hippocampal neuroanatomy. In: Andersen P, Morris R, Amaral D, Bliss T, O'Keefe J, editors. The hippocampus book. New York: Oxford UP; 2007. pp. 37–114. [Google Scholar]
- Bi G, Poo M. Distributed synaptic modification in neural networks induced by patterned stimulation. Nature. 1999;401:792–796. doi: 10.1038/44573. [DOI] [PubMed] [Google Scholar]
- Bi GQ, Poo MM. Synaptic modifications in cultured hippocampal neurons: dependence on spike timing, synaptic strength, and postsynaptic cell type. J Neurosci. 1998;18:10464–10472. doi: 10.1523/JNEUROSCI.18-24-10464.1998. [DOI] [PMC free article] [PubMed] [Google Scholar]
- Buonomano DV. Timing of neural responses in cortical organotypic slices. Proc Natl Acad Sci U S A. 2003;100:4897–4902. doi: 10.1073/pnas.0736909100. [DOI] [PMC free article] [PubMed] [Google Scholar]
- Deuchars J, Thomson AM. CA1 pyramid-pyramid connections in rat hippocampus in vitro: dual intracellular recordings with biocytin filling. Neuroscience. 1996;74:1009–1018. doi: 10.1016/0306-4522(96)00251-5. [DOI] [PubMed] [Google Scholar]
- Elman JL. Finding structure in time. Cogn Sci. 1990;14:179–211. [Google Scholar]
- Guzowski JF, Knierim JJ, Moser EI. Ensemble dynamics of hippocampal regions CA3 and CA1. Neuron. 2004;44:581–584. doi: 10.1016/j.neuron.2004.11.003. [DOI] [PubMed] [Google Scholar]
- Hopfield JJ. Neural networks and physical systems with emergent collective computational abilities. Proc Natl Acad Sci U S A. 1982;79:2554–2558. doi: 10.1073/pnas.79.8.2554. [DOI] [PMC free article] [PubMed] [Google Scholar]
- Ikegaya Y, Aaron G, Cossart R, Aronov D, Lampl I, Ferster D, Yuste R. Synfire chains and cortical songs: temporal modules of cortical activity. Science. 2004;304:559–564. doi: 10.1126/science.1093173. [DOI] [PubMed] [Google Scholar]
- Izhikevich EM. Which model to use for cortical spiking neurons? IEEE Trans Neural Netw. 2004;15:1063–1070. doi: 10.1109/TNN.2004.832719. [DOI] [PubMed] [Google Scholar]
- Koyama R, Muramatsu R, Sasaki T, Kimura R, Ueyama C, Tamura M, Tamura N, Ichikawa J, Takahashi N, Usami A, Yamada MK, Matsuki N, Ikegaya Y. A low-cost method for brain slice cultures. J Pharmacol Sci. 2007;104:191–194. doi: 10.1254/jphs.sc0070119. [DOI] [PubMed] [Google Scholar]
- Kullmann DM, Lamsa KP. Long-term synaptic plasticity in hippocampal interneurons. Nat Rev Neurosci. 2007;8:687–699. doi: 10.1038/nrn2207. [DOI] [PubMed] [Google Scholar]
- Lee I, Yoganarasimha D, Rao G, Knierim JJ. Comparison of population coherence of place cells in hippocampal subfields CA1 and CA3. Nature. 2004;430:456–459. doi: 10.1038/nature02739. [DOI] [PubMed] [Google Scholar]
- Leutgeb S, Leutgeb JK. Pattern separation, pattern completion, and new neuronal codes within a continuous CA3 map. Learn Mem. 2007;14:745–757. doi: 10.1101/lm.703907. [DOI] [PubMed] [Google Scholar]
- Leutgeb S, Leutgeb JK, Treves A, Moser MB, Moser EI. Distinct ensemble codes in hippocampal areas CA3 and CA1. Science. 2004;305:1295–1298. doi: 10.1126/science.1100265. [DOI] [PubMed] [Google Scholar]
- Maass W, Natschläger T, Markram H. Real-time computing without stable states: a new framework for neural computation based on perturbations. Neural Comput. 2002;14:2531–2560. doi: 10.1162/089976602760407955. [DOI] [PubMed] [Google Scholar]
- Markram H, Lübke J, Frotscher M, Sakmann B. Regulation of synaptic efficacy by coincidence of postsynaptic APs and EPSPs. Science. 1997;275:213–215. doi: 10.1126/science.275.5297.213. [DOI] [PubMed] [Google Scholar]
- McClelland JL, Rumelhart DE. Cambridge; MA: MIT; 1989. Explorations in parallel distributed processing—Macintosh version: a handbook of models, programs, and exercises. [Google Scholar]
- O'Keefe J, Dostrovsky J. The hippocampus as a spatial map. Preliminary evidence from unit activity in the freely-moving rat. Brain Res. 1971;34:171–175. doi: 10.1016/0006-8993(71)90358-1. [DOI] [PubMed] [Google Scholar]
- Quiroga RQ, Reddy L, Kreiman G, Koch C, Fried I. Invariant visual representation by single neurons in the human brain. Nature. 2005;435:1102–1107. doi: 10.1038/nature03687. [DOI] [PubMed] [Google Scholar]
- Rosenblatt F. New York: Cornell Aeronautical Laboratory; 1957. The Perceptron—a perceiving and recognizing automaton. Report No. 85-460-1. [Google Scholar]
- Sasaki T, Kimura R, Tsukamoto M, Matsuki N, Ikegaya Y. Integrative spike dynamics of rat CA1 neurons: a multineuronal imaging study. J Physiol. 2006;574:195–208. doi: 10.1113/jphysiol.2006.108480. [DOI] [PMC free article] [PubMed] [Google Scholar]
- Sasaki T, Matsuki N, Ikegaya Y. Metastability of active CA3 networks. J Neurosci. 2007;27:517–528. doi: 10.1523/JNEUROSCI.4514-06.2007. [DOI] [PMC free article] [PubMed] [Google Scholar]
- Sasaki T, Takahashi N, Matsuki N, Ikegaya Y. Fast and accurate detection of action potentials from somatic calcium fluctuations. J Neurophysiol. 2008;100:1668–1676. doi: 10.1152/jn.00084.2008. [DOI] [PubMed] [Google Scholar]
- Sasaki T, Matsuki N, Ikegaya Y. Action-potential modulation during axonal conduction. Science. 2011;331:599–601. doi: 10.1126/science.1197598. [DOI] [PubMed] [Google Scholar]
- Scoville WB, Milner B. Loss of recent memory after bilateral hippocampal lesions. J Neurol Neurosurg Psychiatry. 1957;20:11–21. doi: 10.1136/jnnp.20.1.11. [DOI] [PMC free article] [PubMed] [Google Scholar]
- Song S, Miller KD, Abbott LF. Competitive Hebbian learning through spike-timing-dependent synaptic plasticity. Nat Neurosci. 2000;3:919–926. doi: 10.1038/78829. [DOI] [PubMed] [Google Scholar]
- Takahashi N, Sasaki T, Usami A, Matsuki N, Ikegaya Y. Watching neuronal circuit dynamics through functional multineuron calcium imaging (fMCI) Neurosci Res. 2007;58:219–225. doi: 10.1016/j.neures.2007.03.001. [DOI] [PubMed] [Google Scholar]
- Vazdarjanova A, Guzowski JF. Differences in hippocampal neuronal population responses to modifications of an environmental context: evidence for distinct, yet complementary, functions of CA3 and CA1 ensembles. J Neurosci. 2004;24:6489–6496. doi: 10.1523/JNEUROSCI.0350-04.2004. [DOI] [PMC free article] [PubMed] [Google Scholar]
- Vogels TP, Abbott LF. Signal propagation and logic gating in networks of integrate-and-fire neurons. J Neurosci. 2005;25:10786–10795. doi: 10.1523/JNEUROSCI.3508-05.2005. [DOI] [PMC free article] [PubMed] [Google Scholar]