

Abstract
Reliable neuronal spiking is critical for a myriad of computations performed by neural circuits. This is particularly evident for sound localization cues in the auditory brainstem circuits that detect timing and intensity differences of sounds arriving at two ears. The calyx of Held–principal neuron synapse in the medial nucleus of the trapezoid body (MNTB) in this circuit is traditionally viewed as a reliable relay, which converts contralateral excitatory inputs to inhibitory outputs to ipsilateral superior olive neurons that code interaural timing and intensity differences. However, recent studies demonstrated large variability in the incidence of postsynaptic spike failures at this synapse, challenging the view that this synapse is a fail-safe relay. Using combined imaging and paired recordings in mature (P16–P19) mouse brainstem slices, we show that spike failure rates of MNTB neurons are strongly correlated with differences in gross morphology of the calyx terminal and quantal properties under standard in vitro- and in vivo-like conditions. MNTB neurons innervated by calyces with simple morphologies (mainly digits) express strong short-term synaptic depression and a high incidence of spike failures after high-frequency stimulation. Conversely, MNTB neurons innervated by structurally complex calyces (digits and numerous bouton-like swellings) exhibit initial facilitation followed by slow depression and very few spike failures. Our results indicate that the calyx of Held–MNTB synapse is likely organized as a structural and functional continuum, in that correlated heterogeneities in calyx morphology and short-term plasticity serve as a filter for regulating the inhibition delivered to superior olive neurons during sound localization.
Introduction
The calyx of Held is a large glutamatergic nerve terminal involved in sound localization that originates from globular bushy cells of the contralateral ventral cochlear nucleus (VCN) and innervates principal neurons of the medial nucleus of the trapezoid body (MNTB), which in turn project glycinergic inputs to the medial and lateral superior olive (MSO and LSO, respectively) (Grothe et al., 2010). Inhibitory inputs to MSO ensure that the maximal sensitivity of interaural timing differences (ITDs) occur within a physiologically relevant range (Brand et al., 2002; Pecka et al., 2008), whereas those to LSO combine with excitation from ipsilateral VCN to compute interaural level differences (ILDs) (Sanes, 1990; Tollin, 2003). Thus, reliable spiking of principal MNTB neurons to deliver precisely timed inhibition is critical for MSO and LSO neurons to encode ITDs and ILDs.
Because of its ability to fire at extraordinarily high rates (Schneggenburger and Forsythe, 2006), a predominant view is that the mature calyx of Held–MNTB synapse is a fail-safe relay (Mc Laughlin et al., 2008; Englitz et al., 2009). However, some studies show that this synapse fails under predepressed conditions as a result of spontaneous activity (Hermann et al., 2007), when decreases in postsynaptic excitability occur (Lorteije et al., 2009) or during high-frequency electrical or acoustic stimulation (Guinan and Li, 1990; Lorteije and Borst, 2011). Some also show that, during high-frequency acoustic stimulation, principal MNTB neuron spiking becomes entrained/phase-locked on alternate sinusoidal cycles, suggesting that synaptic failures may be functionally important for coding very high frequencies (Kopp-Scheinpflug et al., 2008). Although these differences can be partly explained by different experimental conditions, the critical factors regulating the fidelity of neurotransmission across the calyx of Held–MNTB synapse remain unclear.
In these previous studies, the reported incidence of spike failures in principal MNTB neurons is highly variable, suggesting that other mechanisms may contribute to heterogeneity in spiking reliability. At mature ages (>P14), the calyx of Held–MNTB expresses varying degrees of short-term depression (STD) and facilitation (STF) under both in vitro- and in vivo-like conditions (Taschenberger and von Gersdorff, 2000; Hermann et al., 2007; Müller et al., 2010). Furthermore, mature calyces of Held display variability in several anatomical specializations (Rowland et al., 2000; Felmy and Schneggenburger, 2004; Wimmer et al., 2006; Ford et al., 2009; Dondzillo et al., 2010). We asked whether the success or failure rate of excitatory input coupling to principal MNTB neuron spiking relates to heterogeneities in short-term plasticity (STP) and calyx terminal morphology.
Using three-dimensional rendering and paired recordings from mature mouse calyces of Held–MNTB synapse, we found that principal MNTB neurons innervated by calyces with simple morphologies express strong STD and exhibit a high incidence of postsynaptic failures during high-frequency stimulation, whereas those innervated by calyces with complex morphologies express STF followed by slow depression and show few postsynaptic failures at comparable frequencies. This diversity, which occurs under standard in vitro- and in vivo-like conditions, can be explained by differences in quantal parameters and residual Ca2+ buildup. We suggest that the innervation of principal MNTB neurons by morphologically diverse calyces may be designed to differentially code distinct sound localization cues.
Materials and Methods
Slice preparation.
Transverse auditory brainstem slices containing the MNTB were prepared from P16–P19 CD1/C57 mice of either sex in accordance with the Hospital for Sick Children animal care review committee. In a separate set of experiments, slices were collected from mice aged P25–P30. After decapitation, brains were rapidly immersed in oxygenated (95% O2 and 5% CO2) semifrozen artificial CSF (aCSF) (in mm: 125 NaCl, 2.5 KCl, 10 glucose, 1.25 NaH2PO4, 2 Na-pyruvate, 3 myo-inositol, 0.5 ascorbic acid, 26 NaHCO3, 1 MgCl2, and 2 CaCl2), and 200- to 250-μm-thick sections were collected using a vibratome (VT1000S; Leica). Slices were incubated in a warm bath (35°C) for 1 h before experimentation.
Anterograde tracing and immunohistochemistry.
Slices were transferred to a recording chamber and continuously perfused with oxygenated aCSF at room temperature. Boroscillate glass microelectrodes, with a tip diameter of 10–15 μm, containing 5% biotinylated dextran amine (BDA) (D1956; Invitrogen) in 0.4 m KCl were introduced at the midline with the aid of a microscope and differential interference contrast monitor, and axons giving rise to calyx of Held terminals were labeled by one to three iontophoretic injections (5 μA, 7 s on/off duty cycle, 5 min each; A.M.P.I.). After BDA injections, slices were incubated for 30 min at 35°C and 1 h at room temperature to allow for tracer transport. Slices were fixed overnight in 4% paraformaldehyde in PBS at 4°C. After several rinses in PBS, slices were incubated for 3 h at room temperature under gentle agitation with streptavidin coupled to Alexa Fluor 488 (S11223; Invitrogen) to visualize BDA-labeled calyces of Held under fluorescence. After several PBS rinses, slices were mounted and coverslipped with Vectashield (Vector Laboratories).
Image acquisition and analysis.
Confocal images of BDA-labeled calyces were acquired with a Carl Zeiss LSM 510 laser scanning microscope equipped with a 488 nm argon laser line for Alexa Fluor 488 excitation and 10× [0.5 numerical aperture (NA)] and 100× (1.4 NA, oil) objectives. High-resolution Z-stack images (0.5 μm steps) of individual calyces of Held were acquired, and three-dimensional (3D) reconstructions were rendered using Volocity (PerkinElmer Life and Analytical Sciences). Calyces that had low signal intensity, appeared damaged, or were located within 25 μm of the superficial edge of the tissue were not included in the study. Surface area and volume measurements were calculated using the region-of-interest function in Volocity. These measurements did not include the axon belonging to the calyx terminal. Visual inspection of 3D images of P16–P19 calyces was used to determine the number of swellings on each calyx. Elliptical structures connected to the stalk via a thin neck were considered “swellings” (see Fig. 3). To obtain unbiased measures of the structural complexity of mature calyces, the outline of 3D reconstructed calyces was measured (OpenLab; PerkinElmer Life and Analytical Sciences) to obtain the perimeter. Contrast and brightness were adjusted using Volocity.
Figure 3.
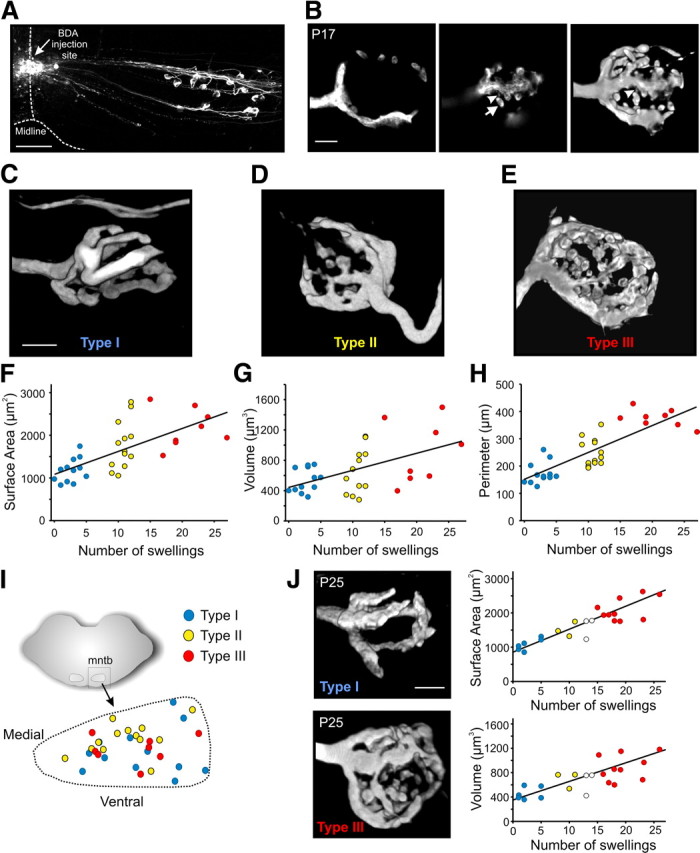
Mature calyces of Held display heterogeneities in their gross morphology allowing classification into distinct morphological phenotypes. A, Low-power confocal image of midline BDA injection site giving rise to well-labeled calyces of Held in a transverse brainstem slice. B, Left, Single optical scan of a BDA-labeled P17 calyx terminal. Middle, Different focal plane of same calyx showing elliptical-shaped swelling (arrow) connected to stalk by a thin neck (arrowhead). Right, 3D reconstruction of same calyx. Note corresponding swelling from middle figure connected to stalk (*). C–E, Sample 3D renderings of mature calyces of Held displaying strong differences in gross morphology. Calyces with five or more swellings were termed type I calyces. Those with ≥15 swellings were termed type III calyces. Calyces with 8–12 swellings were termed type II. F–H, Correlation between the number of swellings and the surface area, volume, and perimeter of calyx terminals (n = 33). Regression lines are shown, and calyces corresponding to the morphological phenotypes shown in C–E are indicated. Type I (blue), type II (yellow), and type III (red). No correlation was observed between the morphological parameters and age within the P16–P19 range. I, Positions of reconstructed type I, II, and III calyces within the MNTB region. J, Reconstructed type I and III calyces obtained from mice aged P25. Correlation between the number of swellings and the surface area and volume of calyx terminals (P25–P30) (n = 23). Regression lines are shown, and calyces corresponding to the morphological phenotypes shown in C–E are indicated and color coded accordingly. White circles are cells that fall between the color-coded regions. Scale bars: A, 100 μm; B, C, 5 μm (also applies to D, E, J).
3D-rendered calyces were arbitrarily divided into three classes based on the absence or presence of swellings (see Results). Those with zero to five swellings were termed type I calyces, those with >15 swellings were termed type III calyces, and those with an intermediate number of swellings, 8–12, were termed type II calyces. To ensure this arbitrary classification scheme was statistically valid, we performed a post hoc K-means cluster analysis (Systat Software). This analysis partitions all the 3D-rendered calyces (n = 33) into three groups based on surface area, volume, or perimeter and is designed to minimize the within-group variability and maximize the between-group variability. The three groups generated by the cluster analysis were termed Group I, II, and III (see Fig. 4D–F), and the mean surface area, volume, and perimeter from these calyces were then compared with the mean values from our arbitrarily classified type I, II, and III calyces (see Fig. 4A–C). The average number of swellings on calyces in Groups I, II, and III were also compared with those classified as types I, II, and III. For each brainstem slice that contained a reconstructed type I, II, or III calyx, low-power (10×) images were taken, and the region outlining the MNTB region was traced to determine whether different calyx types were organized tonotopically. The location of each calyx within the MNTB region was identified. These traces containing the location of identified calyces within the MNTB were then overlaid and superimposed to generate an average MNTB region (see Fig. 3I, dashed outline).
Figure 4.
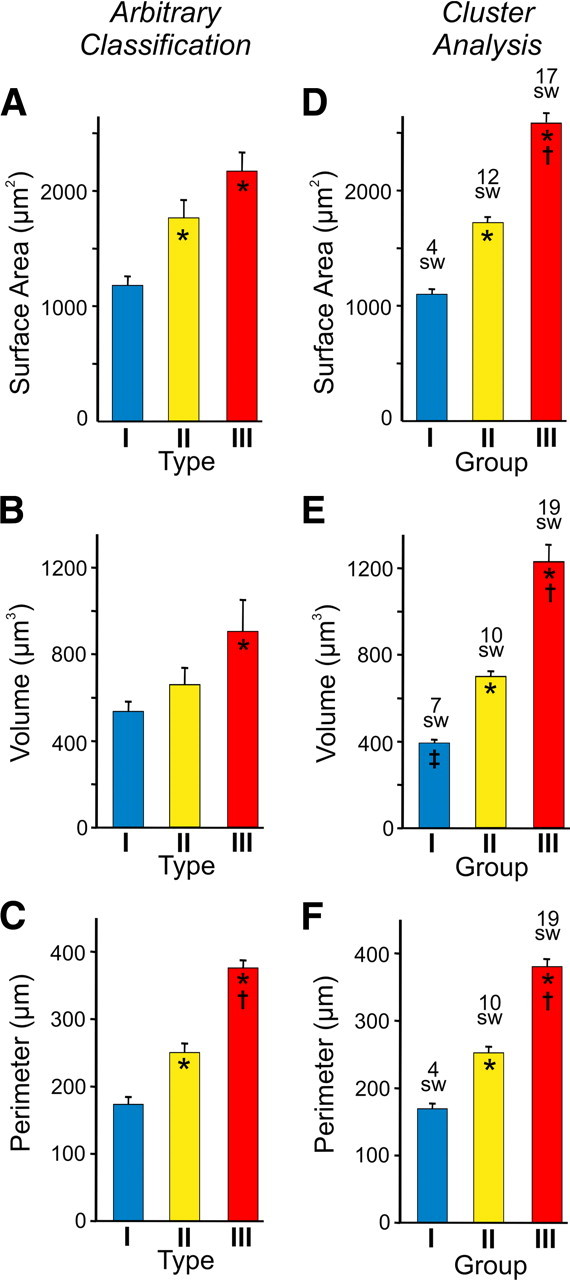
Comparison of the mean surface area, volume, and perimeter of calyces arbitrarily classified as type I, II, or III (A–C) versus calyces assigned to Groups I, II, and III after a cluster analysis (D–F). For A–C, Type I (n = 12), type II (n = 13), and type III (n = 8) calyces. For D–F, the n values per group varied depending on whether the cluster analysis was based on surface area, volume, or perimeter. For D, Groups I (n = 13), II (n = 13), and III (n = 7). For E, Groups I (n = 12), II (n = 15), and III (n = 6). For F, Groups I (n = 12), II (n = 11), and III (n = 10). Average number of swellings (Sw) in calyces assigned to Groups I, II, and III after cluster analysis indicated above bars. * indicates different from type I in A–C and different from Group I in D–F. † indicates different from type II in A–C and different from Group II in D–F. ‡ indicates different from type I in B.
Electrophysiology.
Recordings were made with a dual-channel amplifier (Multiclamp 700A; Molecular Devices) from slices in a chamber continuously perfused with oxygenated aCSF at room temperature and supplemented with bicuculline (10 μm) and strychnine (1 μm) to block inhibitory inputs. Afferent axons to calyx terminals were stimulated at the midline using a Master 8 stimulator (A.M.P.I.) coupled to a bipolar platinum electrode at two times above threshold. For whole-cell voltage-clamp postsynaptic recordings, patch electrodes with resistances of 2.5–3 MΩ containing the following (in mm) were used: 97.5 K-gluconate, 32.5 CsCl, 5 EGTA, 10 HEPES, 1 MgCl2, 30 tetraethylammonium (TEA), and 3 lidocaine N-ethyl bromide, pH 7.2. Holding potential was maintained at −60 mV. Series resistance ranged between 4 and 8 MΩ and was compensated to 90%. Presynaptic cell-attached recordings (voltage clamp) were performed to minimally disturb the presynaptic terminal and keep the calyx structure unrevealed until the recordings from postsynaptic neurons were complete. Presynaptic patch electrodes with resistance of 4–6 MΩ contained the following (in mm): 97.5 K-gluconate, 32.5 KCl, 0.5 EGTA, 40 HEPES, 1 MgCl2, and 0.25 Alexa Fluor 568 hydrazide (A10437; Invitrogen), pH 7.3. EPSCs (or IEPSCs) were recorded from principal MNTB neurons during 100, 200, and 300 Hz test trains (200 ms). In some cells, we also recorded these EPSC trains in 1 mm extracellular Ca2+. Multiple test trains at each frequency separated by at least 25 s were recorded. After the test trains, calyces were filled with Alexa Fluor 568 in <1 min via diffusion after membrane rupture. The presynaptic electrode was carefully withdrawn to allow resealing of the presynaptic membrane. High-resolution confocal Z-stack images (0.5 μm steps) (LSM 710; Carl Zeiss) of the recorded calyx were immediately taken with a 63× (1.0 NA) water-immersion objective to obtain the 3D structure. A 543 nm argon laser line was used for Alexa Fluor 568 excitation. Undamaged calyces containing obvious stalks and elliptical swellings attached to the stalk via a thin neck were included in the study.
For EGTA injection experiments (see Fig. 7), presynaptic electrodes contained the following (in mm): 97.5 K-gluconate, 32.5 KCl, 2 EGTA, 40 HEPES, and 1 MgCl2. EPSCs were recorded from principal MNTB neurons during 100 and 300 Hz test trains (200 ms). Multiple trains at each frequency separated by at least 25 s were recorded. After the test trains, calyx terminals were loaded with EGTA for 2 min via diffusion. The presynaptic electrode was carefully withdrawn to allow resealing of the presynaptic membrane, and the test trains were repeated to record EPSCs. In a subset of recordings, we also examined whether EGTA loading affected presynaptic Ca2+ currents. For these recordings, presynaptic electrodes contained the following (in mm): 110 CsCl2, 40 HEPES, 2 EGTA, 1 MgCl2, 2 ATP, 0.5 GTP, 12 phosphocreatine, and 20 TEA, pH adjusted to 7.3 with CsOH. To isolate presynaptic Ca2+ currents, TEA (10 mm), tetrodotoxin (0.5 μm), and 4-aminopyridine (0.3 mm) were added to block Na+ and K+ channels. We initially filled the tips of the patch electrodes with the solution described except that the EGTA was 0.5 mm. This allowed time to patch and stabilize the recording before the 2 mm EGTA diffused into the terminal. Series resistance ranged between 6 and 10 MΩ and was compensated to 90%. The holding potential was −80 mV, and the currents were evoked by an action potential (AP) template prerecorded from a mature calyx during axonal stimulation (Yang and Wang, 2006).
Figure 7.
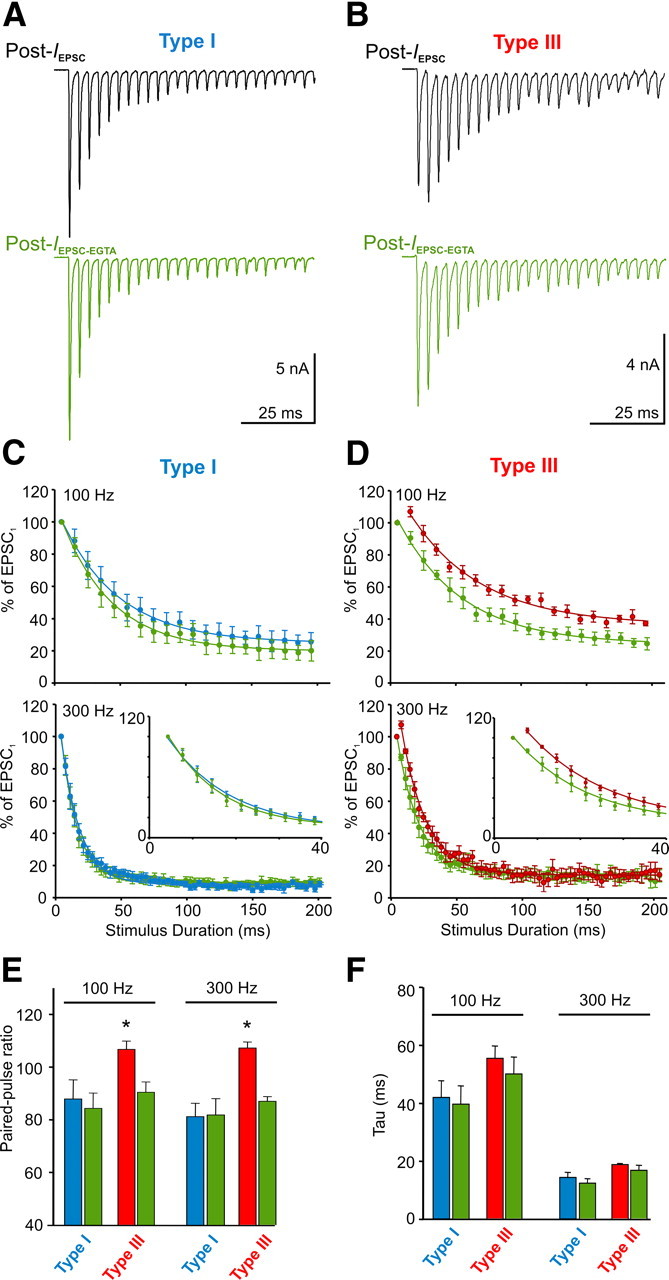
Morphology determines the form of STP expressed by influencing residual Ca2+ buildup. A, Raw EPSC trace (Post-IEPSC) recorded from a type I synapse during a 300 Hz test train before and after loading the calyx terminal with 2 mm EGTA (green trace below control trace, Post-IEPSC-EGTA). B, Same as A but for a type III synapse. Whole-cell voltage-clamp (VC) currents recorded at −60 mV holding potential. C, Plots summarize the rate of EPSC depression in MNTB neurons innervated by type I (n = 4) calyces before and after EGTA loading during 100 and 300 Hz test trains. Data normalized to first EPSC amplitude, averaged, and fit with a single exponential. Inset for 300 Hz shows first 40 ms. D, Same as C but for a type III (n = 4) calyx. E, Average paired-pulse ratios in MNTB neurons innervated by type I and type III calyces before and after EGTA loading. F, Average decay constant of EPSC depression in MNTB neurons innervated by type I and III calyces before and after EGTA loading. Calculated from single-exponential fits during 100 and 300 Hz trains. * indicates different from EGTA condition.
Cell-attached voltage-clamp recordings (>1 GΩ resistance) were made at −60 mV holding potential from principal MNTB cells during midline stimulation of calyceal axons (100–400 Hz test trains, 200 ms) at room temperature. This gives superior signal-to-noise ratio compared with typical extracellular recordings and is readily converted to establish whole-cell voltage-clamp configuration. Under such conditions, we registered inward and then outward compound currents (i.e., AP currents or IAP) attributable to action potential propagation into the calyx. Subsequently, membrane patches from the same cells were ruptured to allow whole-cell voltage-clamp recordings of EPSCs. In a subset of cells, we first recorded IAP at room temperature and raised the temperature to 35°C using an inline heater with a feedback thermistor (TC-324B; Warner Instruments). Because the fidelity of transmission is enhanced with increasing temperature (von Gersdorff and Borst, 2002), IAP were recorded at higher frequencies (100–500 Hz test trains and in some cases up to 600 Hz) to examine spike failures. To further mimic in vivo conditions in which spontaneous activity is usually present (Hermann et al., 2007), we recorded cell-attached IAP evoked by high-frequency test trains at 35°C after a conditioning train (4 s at 50 Hz). The conditioning frequency of 50 Hz was selected based on values in the in vivo study performed in mice by Lorteije et al. (2009), which reported an average spontaneous frequency of ∼70 Hz, and the studies by Kopp-Scheinpflug et al. (2008) and Sonntag et al. (2009), which reported an average spontaneous frequency of ∼30 Hz. After the recordings performed at 35°C, the bath temperature was once again reduced to room temperature, and EPSCs during 100–300 Hz trains were recorded. By recording these EPSCs at room temperature, we could determine the form of STP expressed under the same conditions for the data collected in Figures 1 and 5. Thus, we could report differences in the incidence of spike failures under in vivo-like conditions between principal MNTB cells innervated by morphologically distinct calyces of Held.
Figure 1.
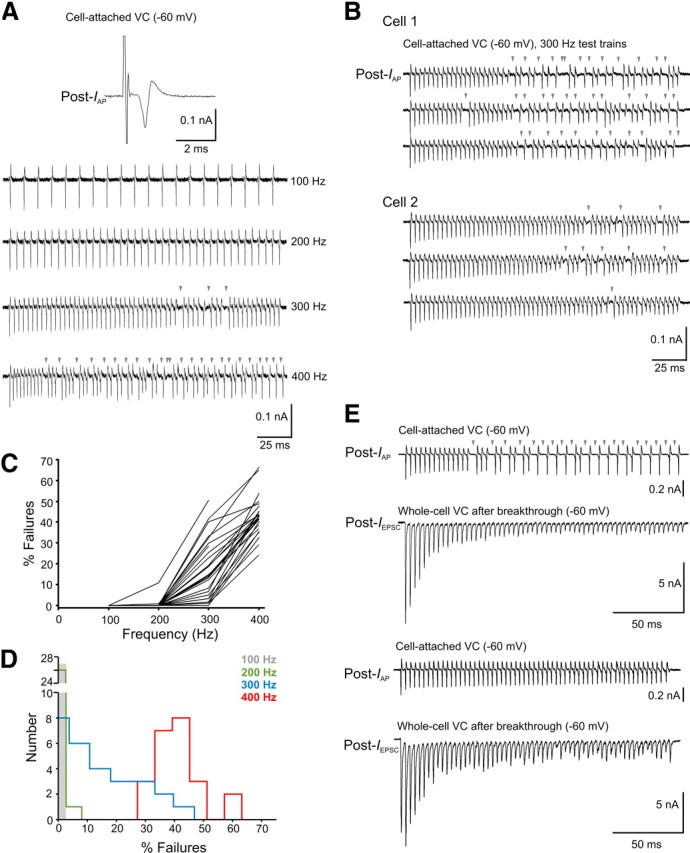
Spike failure variability in principal MNTB neurons recorded at room temperature. A, Sample cell-attached voltage-clamp (VC) traces of AP currents recorded from a principal MNTB neuron (Post-IAP) during 100–400 Hz test trains (holding potential, −60 mV). Postsynaptic spike failures are indicated by arrowheads. B, Sample cell-attached VC traces of Post-IAP from a principal MNTB neuron showing a large number of failures (Cell 1) versus one with few failures (Cell 2) during 300 Hz stimulation. Three traces from each cell are shown. C, Line plot depicting the incidence and variability of spike failures in principal MNTB neurons after 100–400 Hz test trains (n = 27). D, Histogram showing the distribution of spike failures for the cells shown in C. E, Top two traces, Sample Post-IAP recorded in cell-attached VC mode from a principal MNTB neuron during 300 Hz stimulation and EPSCs (Post-IEPSC) recorded during 300 Hz stimulation in whole-cell VC mode after membrane breakthrough. This synapse showed strong STD. Bottom two traces, Same as top 2 traces but for a synapse showing initial STF followed by slow STD.
Figure 5.
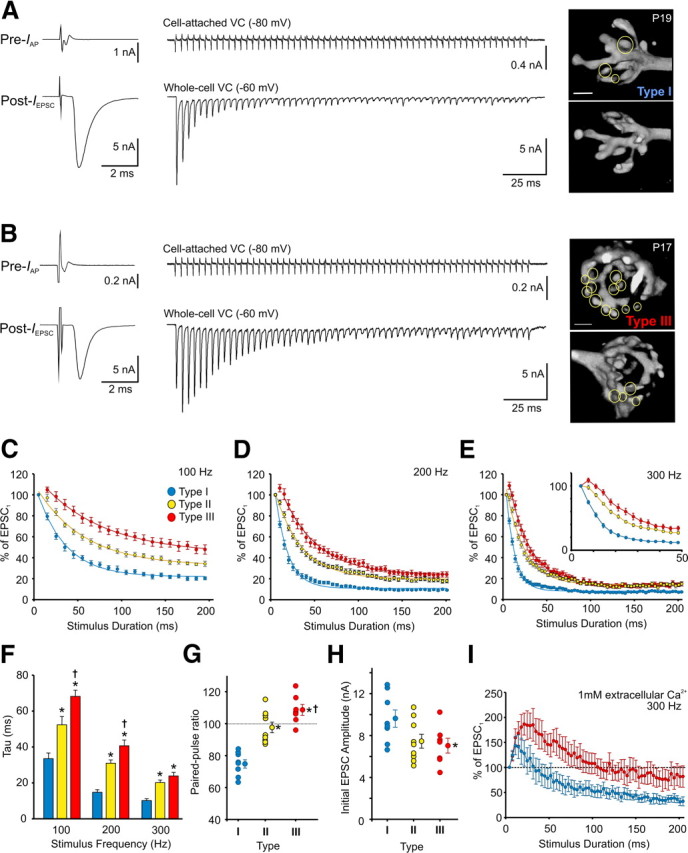
Functional correlates of calyx of Held morphology. A, B, Raw traces of single and test train (300 Hz) responses of presynaptic (cell-attached AP current at −80 mV, Pre-IAP) and postsynaptic (whole-cell current at −60 mV, Post-IEPSC) paired voltage-clamp (VC) recordings from two calyx of Held–MNTB synapses contrasting the strong STD phenotype (A) and the STF followed by slow depression phenotype (B). After recordings, calyces were filled with Alexa Fluor 568 to reveal its 3D structure, showing a type I and type III calyx (opposing views of same calyx shown to the right of the corresponding traces, circles identify different swellings). C–E, Plots summarize the rate of EPSC depression in MNTB neurons innervated by type I (n = 8) (blue), type II (n = 9) (yellow), and type III (n = 7) (red) calyces during 100 Hz (C), 200 Hz (D), and 300 Hz (E) test trains. Data are normalized to first EPSC and fit with a single exponential. Inset in E, data expanded to show first 50 ms. F, Average decay constant of EPSC depression in MNTB neurons calculated from the exponential fits in C–E for type I, II, and III calyces during 100, 200, and 300 Hz test trains. G, Paired-pulse ratios in MNTB neurons innervated by type I, II, and III calyces. Averages indicated. H, Initial EPSC amplitudes recorded from MNTB neurons innervated by different calyx types. Averages indicated. I, Average EPSC responses from type I (blue, n = 5) versus type III (red, n = 6) synapses during 300 Hz trains recorded in 1 mm extracellular Ca2+ solution. Data are normalized to first EPSC. * indicates different from type I. † indicates different from type II. Scale bars: (in A) A, B, 5 μm.
For whole-cell current-clamp (CC) postsynaptic recordings (see Fig. 9), electrodes with resistances of 2.5–3 MΩ containing the following were used (in mm): 97.5 K-gluconate, 32.5 KCl, 0.5 EGTA, 40 HEPES, and 1 MgCl2, pH 7.2. Resting membrane potential was held at approximately −70 mV. Previously recorded EPSCs (300 Hz trains, 200 ms) were used to generate current injection templates. These current injection templates (type I, type III, type III + type I hybrid, and type I + type III hybrid; see Fig. 9) were subsequently delivered to principle MNTB neurons to generate action potentials and determine the incidence of spike failures. For each cell, multiple spike trains separated by 25 s were recorded for each of the current injection templates.
Figure 9.
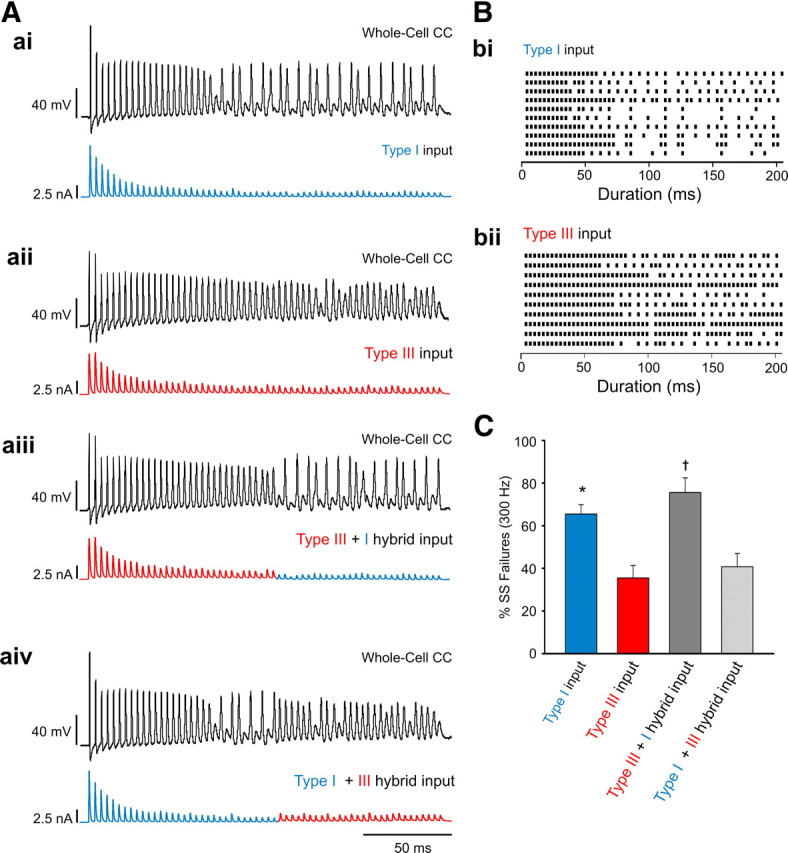
Steady-state synaptic current determines the incidence of postsynaptic spike failures. A, Whole-cell CC recordings made from the same principle MNTB neuron after current injections (300 Hz, 200 ms) mimicking synaptic input from type I and type III calyces. From top, Responses after input from type I template (blue) (ai), type III template (red) (aii), type III + type I hybrid template (aiii), and type I + type III hybrid template (aiv). B, Raster plots of postsynaptic spikes observed in principle MNTB neurons (n = 10) after current injections. bi, Sample raster plot generated from 10 different cells after the injection of the type I current template. bii, Same cells as in bi but after the injection of the type III current template. Row 1 from bi rasters and row 1 from bii rasters plots are the same cell. Rows 2 are the same cell, etc. C, Average number of postsynaptic failures (expressed as percentage) observed during the last 100 ms of the train (the steady-state portion of train) after the current injection templates shown in A. * and † indicate different from type III template and type I + type III hybrid template.
Data analysis.
Data were acquired online, digitized at 50 kHz, filtered at 4 kHz, and analyzed offline using the pClamp 8.2 software package (Molecular Devices), Excel 2002 (Microsoft), SigmaPlot 10.0 (Systat Software) and MiniAnalysis (Synaptosoft). EPSC amplitudes recorded during stimulus trains were measured and normalized to the first EPSC. Multiple traces acquired from each cell at each frequency were averaged. The rate at which EPSC amplitude depressed during stimulation trains was fit with a single-exponential functional to obtain the time constant. Paired-pulse ratios were calculated using the amplitudes of the first and second EPSC during 300 Hz stimulus trains (EPSC2/EPSC1 × 100). The size of the readily releasable pool (RRP) of synaptic vesicles was estimated from 300 Hz trains, which depletes the RRP, by back-extrapolating to time 0 from the steady-state portion of the cumulative EPSC amplitude curves (last 10 stimuli) (Schneggenburger et al., 1999). We also estimated RRP size based on methods outlined by Wesseling and Lo (2002), which accounts for the variable rate at which synaptic vesicles are recruited back into the releasable pool during a depleting train. This minimizes the counting of quanta from the reserve pool as those from the RRP. The following equations were first solved simultaneously:
 |
 |
where fe is the fusion frequency, r(1) is the amplitude of the first response, r(∞) is the amplitude of the steady-state response, α is the rate of pool filling, S is the number of stimuli in the train, and v is the frequency of stimulation. The following equation can then derive the total current from the readily releasable synaptic vesicles:
 |
where w(S) is the total current released from the reserve pool during the train. To estimate the release probability (Pr), we divided the amplitude of the first EPSC from the 300 Hz trains by the size of the RRP derived from the equations above. Presynaptic Ca2+ current was measured at various intervals after EGTA loading and normalized to the initial amplitude recorded immediately after breakthrough.
Postsynaptic spike failures during stimulation trains or current injection trains were identified by a clear absence of an AP current or spike, respectively. Spike failures were expressed as a percentage of the number of observed IAP/the number of expected IAP at the particular frequency × 100. In some cases, the inverse of percentage spike failures was calculated and expressed as percentage fidelity, in which 100% fidelity corresponds to no observed failures. Raster plots of postsynaptic cell-attached or current-clamp recordings were also generated (see Figs. 2, 8, 9), and each dot corresponds to an observed IAP. Stimulation artifacts from raw traces during stimulus trains were removed for clarity. Statistical significance was tested using two-tailed unpaired Student's t tests with a p value cutoff of <0.05. For correlation analysis, least-squares linear regression was performed using SigmaPlot 10.0. Data are expressed as the mean ± SEM from a population of n synapses.
Figure 2.
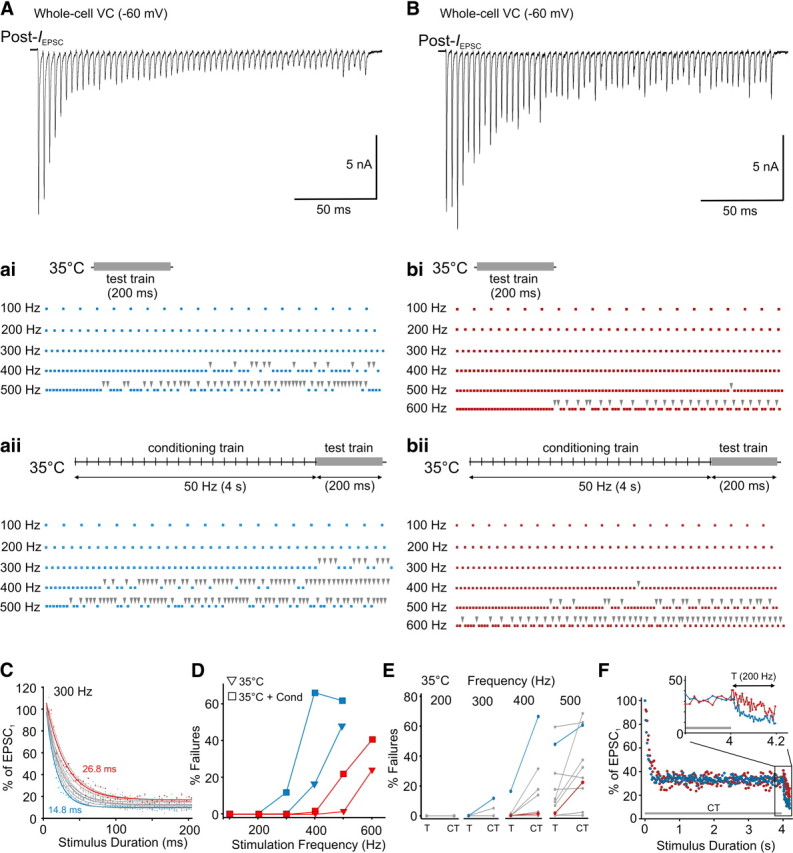
Differences in the incidence of postsynaptic spike failures between calyces of Held–MNTB synapses expressing different forms of STP under in vivo like conditions. A, EPSC train (Post-IEPSC) recorded at room temperature in whole-cell voltage-clamp (VC) mode showing strong STD at 300 Hz. Holding potential, −60 mV. ai, Raster plots of postsynaptic AP currents recorded during the test train (gray bar) from same cell when bath temperature increased to 35°C and when a 50 Hz conditioning train preceded the test train. aii, Each dot corresponds to the occurrence of an AP current waveform. Test train frequency indicated on left. Arrowheads indicate failures. B, Same conditions as in A but for a synapse showing initial STF followed by slow STD. C, Plots summarize the rate of EPSC depression at room temperature during 300 Hz trains in the MNTB neurons (n = 10) used to record spike failures at 35°C with and without conditioning trains. Data are normalized to first EPSC and fit with a single exponential. Blue and red plots correspond to the cells shown in A and B, respectively. Tau is indicated. D, Plot summarizing the percentage spike failures for cell depicted in A (blue) and B (red) during different stimulation frequencies recorded at 35°C (triangles) and at 35°C with a conditioning train (squares). E, Comparison of the change in percentage spike failures in individual MNTB neurons recorded at 35°C during test trains (T) at varying frequencies and when test trains were preceded by a conditioning train (CT). Blue and red plots correspond to the cells shown in A and B, respectively. F, Plots summarizing the changes in EPSC amplitude (normalized to initial EPSC amplitude) at 35°C during the 4 s conditioning train (predepressed synaptic state) immediately followed by the test train (200 Hz, 200 ms) in synapses that expressed strong STD (blue) or STF followed by slow STD (red) under standard recording conditions. Inset, Expanded region during test train to illustrate difference in STP between the different cells under in vivo-like conditions. Gray line indicates the duration of the conditioning train. Double arrow in inset indicates duration of the test train.
Figure 8.
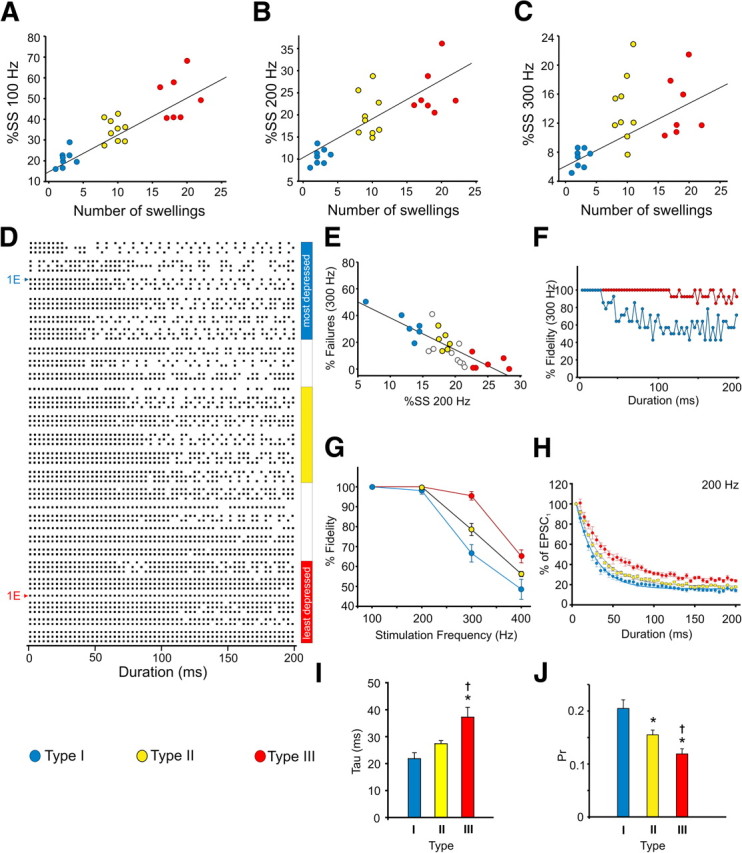
Organization of the MNTB as a morphological and functional continuum. A–C, Correlation between the number of swellings observed on calyx terminals and the percentage steady-state EPSC amplitude after 100, 200, and 300 Hz test trains, respectively. Data were from those in Figure 5C–E. Regression lines are shown. D, Raster plots (1–3 per cell) of postsynaptic AP currents recorded during 300 Hz test trains at room temperature (n = 27) in cell-attached voltage-clamp (VC) mode at −60 mV holding potential. Each dot represents a postsynaptic AP current. Arranged from most depressing to least depressing based on steady-state EPSC amplitudes recorded during 200 Hz test trains. Blue bar to right indicates raster plots are from cells that have a steady-state EPSC amplitude consistent with type I synapses (compare with Fig. 8B), yellow bar with type II synapses, and red bar with type III synapses. To the left, raster plots of the cells shown in Figure 1E. E, Correlation between postsynaptic spike failures during 300 Hz trains and steady-state (SS) EPSC amplitude at 200 Hz. Regression line shown. Blue, yellow, and red points are the cells in the corresponding color-coded regions in D. White circles are the cells that fall between the color-coded regions in D. F, Onset of postsynaptic spike failures in type I (blue) and III (red) synapses during 300 Hz test trains. Each trace is average of cells from the most depressed and least depressed region shown in D. G, Percentage fidelity (100% = no postsynaptic spike failures) in type I (blue), II (yellow), and III (red) synapses versus test train frequency. Each trace is average of five cells from the corresponding color-coded regions in D. H, Plots summarize the rate of EPSC depression in type I, II, and III synapses during 200 Hz trains in the synapses corresponding to the color-coded regions in D. Data normalized to first EPSC amplitude, averaged and fit with a single exponential. I, Average decay constant of EPSC depression for MNTB neurons during 200 Hz trains. Calculated from exponential fits in H. J, Pr in type I, II, and III synapses. Each bar is average of five cells from the corresponding color-coded regions in D. * indicates different from type I. † indicates different from type II.
Results
Incidence of spike failures is highly variable in principal MNTB neurons
To determine the incidence of spike failures in principal MNTB neurons, we initially performed cell-attached voltage-clamp recordings of compound currents attributable to action potential firing (IAP; for details, see Materials and Methods) during test trains at varying frequencies. Figure 1A shows sample traces of IAP recorded from a cell during midline stimulation at 100–400 Hz. In this example, no failures were observed during 100 and 200 Hz trains, but at 300 Hz, a small number of failures (5%) could be observed (arrowheads) and at 400 Hz, the incidence of failures increased to 30%. The occurrence of spike failures at 300 Hz was typical of many cells, but two striking features became immediately apparent among the cell population. First, the onset of spike failures in some cells occurred earlier during the test train compared with others (cell 1 vs cell 2 in Fig. 1B). Second, the failure rate between cells was highly variable. For example, in one cell, we recorded an average failure rate of 21% (Fig. 1B, top three traces) but only ∼3% in another cell (Fig. 1B, bottom three traces) after 300 Hz stimulation. In fact, variability in the incidence of spike failures among the cell population was uncovered only after 300 Hz stimulation or greater (Fig. 1C,D). Some could follow 300 Hz very reliably with no failures, whereas others displayed up to 50% failures. At 400 Hz, all cells displayed failures, but even at this frequency, there was a large degree of variability in the failure rate ranging from ∼25 to ∼65% (Fig. 1C,D). In the same cells, when we broke through the membrane patch (with Cs-based internal solution) and recorded EPSCs in response to the test trains, we found that principal MNTB neurons that showed an early onset and high incidence of spike failures at 300 Hz stimulation expressed strong STD (Fig. 1E), whereas those principal MNTB neurons that showed few to no spike failures typically expressed initial STF, followed by a slow rate of STD during 300 Hz (Fig. 1E). In addition, the steady-state EPSC amplitude (last 50 ms of train) in those cells with a high incidence of spike failures was usually much smaller compared with cells showing few to no spike failures. However, in a small number of instances, we observed small but fluctuating amplitude EPSCs during the steady-state portion of the train but no postsynaptic failures, suggesting that principal MNTB neurons may have subtle differences in intrinsic excitability. Alternatively, larger steady-state currents lead to a more depolarized plateau potential closer to the firing threshold, such that even small currents are sufficient to drive spiking. Knowing that postsynaptic desensitization in mature calyx of Held synapses plays a minor role in STP (Joshi and Wang, 2002; Taschenberger et al., 2002; Renden et al., 2005), we interpreted these observations such that differences in the pattern and extent of STF and STD among these synapses are primarily of presynaptic origin and directly contribute to the heterogeneity in postsynaptic spike failures.
The variability in spike failures was also present under more physiological conditions. We recorded IAP from principal MNTB neurons (n = 10) during test trains of varying frequencies at 35°C and when the trains were preceded by a 4 s 50 Hz conditioning train to consider the roles of temperature and spontaneously active afferent axons normally present in vivo (Taschenberger and von Gersdorff, 2000; Futai et al., 2001; Kushmerick et al., 2006; Yang and Wang, 2006; Fedchyshyn and Wang, 2007; Hermann et al., 2007; Kopp-Scheinpflug et al., 2008; Lorteije et al., 2009; Sonntag et al., 2009). When bath temperature was raised to 35°C, spike failures occurred at higher stimulation frequencies compared with room temperature independent of the form of STP expressed at the synapse. For example, in the cell shown Figure 2A, which expressed the strongest rate of depression among the cell population (Fig. 2C), spike failures began to occur at 400 Hz stimulation and at 500 Hz reached ∼47% (Fig. 2Aai,D). At room temperature, this cell began to fail at 300 Hz stimulation. For the cell shown in Figure 2B, which expressed initial STF followed by the slowest rate of depression among the cell population (Fig. 2C), almost no failures were observed until 600 Hz stimulation (1% at 500 Hz) (∼25% at 600 Hz) (Fig. 2Bbi, 2D). At room temperature, this cell had a small number of failures at 300 Hz stimulation. Importantly, the variability in spike failures between different cells that was typically observed during 300 Hz test trains at room temperature could now be observed during 500 Hz test trains at 35°C (Fig. 2E). When test trains were preceded by a conditioning train, the incidence of spike failures typically occurred at lower stimulation frequencies compared with the 35°C-only condition (Fig. 2A,B,D). In fact, the variability in spike failures between cells that was observed during 500 Hz test trains for the 35°C-only condition was now observed during 400 Hz test trains that were preceded by the conditioning train at 35°C (Fig. 2E). Similar to the standard recording conditions, the heterogeneity in spike failures observed during the test trains under in vivo-like conditions likely relate to the different forms of STP expressed. This is based on our observation that, despite the predepressed state of the synapse after the conditioning train (Fig. 2F), some synapses could express strong STD or STF, followed by slow STD during high-frequency stimulation. Together, this suggests that the variability in spike failures at high frequencies is intrinsic at the mature calyx of Held–MNTB synapse, regardless of in vitro or in vivo-like experimental conditions.
Mature calyces of Held display distinct gross morphological phenotypes
After hearing onset (∼P12), calyx of Held terminals transform from a spoon-shape to digitated structure characterized by stalks (digits) and numerous swellings emanating from the stalks (Kandler and Friauf, 1993). However, at ages when the calyx of Held–MNTB synapse is considered functionally mature (>P14), calyx terminals exhibit variability in subcellular parameters such as the size and number of active zones as well as gross morphological features such as surface area and volume (Taschenberger et al., 2002; Wimmer et al., 2006; Youssoufian et al., 2008; Dondzillo et al., 2010; Schwenger and Kuner, 2010). Thus, it is possible that some principal MNTB neurons are innervated by calyx terminals with unique structural characteristics. To address this, we examined the gross morphological features of mature calyx terminals.
We made midline injections of the anterograde tracer BDA, which led to well labeled calyces of Held (Fig. 3A). At P16–P19, calyces were digitated structures containing fenestrations, stalks, and elliptical swellings emanating from the stalks via a thin neck (Fig. 3B) typical of mature calyces in many species (Kandler and Friauf, 1993; Rowland et al., 2000; Wimmer et al., 2006; Ford et al., 2009; Dondzillo et al., 2010; Hermida et al., 2010). However, after 3D rendering, it became immediately apparent that calyces of Held were morphologically heterogeneous. Some appeared simple in structure and were composed mainly of stalks with few swellings (Fig. 3C), whereas others seemed highly complex with interconnected stalks and numerous swellings (Fig. 3E) or some had an intermediate degree of complexity (Fig. 3D).
To quantify this heterogeneity, we subdivided our dataset into a manageable form for the purposes of analyses. Given that the absence or presence of swellings was an obvious characteristic differentiating the morphologically simple versus complex calyces, we used this feature to arbitrarily assign calyces into one of three types. Calyces that contained zero to five swellings were termed type I, and those that contained >15 swellings were termed type III (Fig. 3C,E). An intermediate group, type II, contained 8–12 swellings (Fig. 3D). Under this classification scheme, we found that the number of swellings correlated well with other anatomical features, such as surface area (r = 0.68, p < 0.01), volume (r = 0.52, p < 0.01), and perimeter (r = 0.83, p < 0.01) of calyx terminals (Fig. 3F–H). In fact, for all three parameters, type III calyces were almost twofold larger compared with type I calyces (Fig. 4A–C) (surface area, 2170 ± 162 vs 1178 ± 80 μm2, p < 0.001; volume, 905 ± 145 vs 535 ± 45 μm3, p = 0.01; perimeter, 376 ± 11 vs 173 ± 11 μm, p < 0.001). In type II calyces, the measurements fell between those for type I and type III. In the present sample, the different calyces did not appear tonotopically arranged because type I, II, and III calyces were observed throughout the MNTB (Fig. 3I). Heterogeneity in calyx morphology was also observed in mice aged P25–P30. At this age, type I, II, and III calyces could be readily identified (Fig. 3J), and, similar to calyces in P16–P19 mice, the number of swellings was strongly correlated with surface area (r = 0.87, p < 0.0001) and volume (r = 0.72, p < 0.001) (Fig. 3J). This ruled out the possibility that heterogeneity in calyx morphology at P16–P19 is attributable to maturational differences.
To verify that our arbitrary classification scheme was statistically representative of the morphological heterogeneity observed, we performed a post hoc cluster analysis (see Materials and Methods) that partitions the reconstructed calyces into three groups based on morphological similarity. When the cluster analysis partitioned the calyces based on surface area, volume, or perimeter, we found that the group of calyces with the largest values (i.e., Group III in Fig. 4D–F) had means significantly larger compared with the Group I values in line with the differences between the arbitrarily classified type I and III calyces shown in Figures 4A–C. For example, the mean surface areas for the Group I and III calyces from the cluster analysis were 1094 ± 45.4 and 2565 ± 92.9 μm2, respectively (Fig. 4D). These were not different from the mean surface areas of type I and III calyces shown in Figure 4A. This similarity in mean values was also apparent when comparing the mean volume (Fig. 4B,E) and perimeter values (Fig. 4, compare C,F). Importantly, when the cluster analysis partitioned the calyces based on surface area, volume, or perimeter, the calyces in Group I always had the fewest swellings, and calyces in Group III always had the most. The average number of swellings for the calyces in Groups I, II, and III were well in line with the swelling number used to arbitrarily classify calyces as type I, II, or III (swelling number indicated in Fig. 4D–F). Together, these findings strongly validate that mature calyces of Held are heterogeneous in structure and can be classified into distinct morphological phenotypes based on the number of swellings, terminal size, and branching complexity.
Morphologically distinct calyces of Held display different forms of STP
To determine whether the morphology of synaptic terminals affects synaptic function, we performed paired voltage-clamp recordings on mature (P16–P19) calyx of Held–MNTB synapses. Axons giving rise to calyx of Held terminals were stimulated at the midline, and EPSCs were recorded during train stimuli. During these recordings, a presynaptic electrode containing the fluorochrome Alexa Fluor 568 hydrazide was sealed onto the presynaptic terminal to record IAP at a holding potential of −80 mV. After test trains, the presynaptic terminal was gently ruptured and filled with Alexa Fluor 568 to reveal its 3D morphology and determine whether the principal MNTB neuron was innervated by a type I, II, or III calyx. We found that principal MNTB neurons innervated by calyces with simple morphologies and less than five swellings, type I calyces, displayed strong STD after 100, 200, and 300 Hz test trains (Fig. 5A,C–E). In contrast, MNTB neurons innervated by calyces with complex morphologies and >15 swellings, type III calyces, displayed initial STF, followed by slow STD (Fig. 5B,C–E). MNTB neurons innervated by terminals with intermediate morphologies, type II calyces, showed a small degree of initial STF or STD, but the rates of depression for the duration of the train were between those observed for type I and III calyces (Fig. 5C–E). Regardless of stimulation frequency, the morphologically diverse calyces displayed different rates of depression, but the depression was faster and more severe at higher frequencies (Fig. 5F). Differences in the paired-pulse responses were also apparent between type I (74.8 ± 2.6%), II (97.6 ± 3.3%), and III (108.6 ± 3.4%) synapses (Fig. 5G). Initial EPSC amplitudes were slightly smaller in type III versus type I synapses (7.0 ± 0.7 vs 9.6 ± 0.8 nA, p = 0.04), but the range of initial EPSC amplitudes appeared to have a similar degree of variability between the different synapses (Fig. 5H). In a subset of these cells, we also recorded EPSCs during 300 Hz trains in low Ca2+ (1 mm) extracellular bath solution (Fig. 5I). In these recordings, all cells showed initial STF, followed by STD that is typical under conditions of low release probability (von Gersdorff and Borst, 2002). However, the initial STF in type III synapses (n = 6) was much greater compared with type I (n = 5) synapses, and the degree of synaptic depression was significantly less in type III synapses. The initial EPSC amplitude decreased in 1 mm Ca2+ conditions and averaged 2.4 ± 0.6 nA in type I synapses and 1.8 ± 0.3 nA in type III synapses. The EPSC responses for type II synapses (n = 5) fell between types I and III (data not shown). These results suggest that the form of STP expressed at calyx of Held–MNTB synapses is strongly related to the morphology of the calyx of Held terminal.
We also examined whether the morphology of calyx terminals relates to the quantal properties of transmitter release and consequently the heterogeneous forms of STP expressed. First, we estimated the size of the RRP in different calyx types by plotting the average cumulative EPSC amplitude during 300 Hz trains and back-extrapolating to time 0 (Fig. 6A) (Schneggenburger et al., 1999). Using this method, we found that the RRP was larger in type III versus type I calyces (60.1 vs 38.1 nA). Significant differences were found when our estimates considered the rate of synaptic vesicle replenishment (based on Wesseling and Lo, 2002; see Materials and Methods). Under these conditions, the RRP size estimate for type III calyces was 68.1 ± 6.2 nA, whereas for type I calyces, it was 40.9 ± 5.5 nA (Fig. 6A, plots with error bars) (p = 0.006). The RRP size estimate for type II calyces fell between these values (53.1 ± 3.3 nA). Second, we divided the initial EPSC amplitude (EPSC1) by the RRP to estimate the Pr. Type I calyces had a higher Pr compared with type III calyces (0.25 ± 0.02 vs 0.12 ± 0.01, p < 0.001), in line with the range estimated by others (Taschenberger et al., 2002) (Fig. 6B) and consistent with other synapses in that depressing synapses typically have a higher Pr compared with facilitating synapses that have a lower Pr (Xu-Friedman and Regehr, 2004). Importantly, the presynaptic waveforms of IAP throughout the stimulus trains did not differ between types I, II, and III calyces (Fig. 6C), indicating that the observed differences in STP are likely downstream from incoming action potentials. Thus, synaptic terminals with complex morphologies and larger volumes (i.e., type III calyces) may contain more synaptic vesicles (or RRP) compared with those with simple morphologies and smaller volumes (types I and II calyces). This indicates that the morphology of synaptic terminals plays a critical role in determining the polarity and extent of STP.
Figure 6.
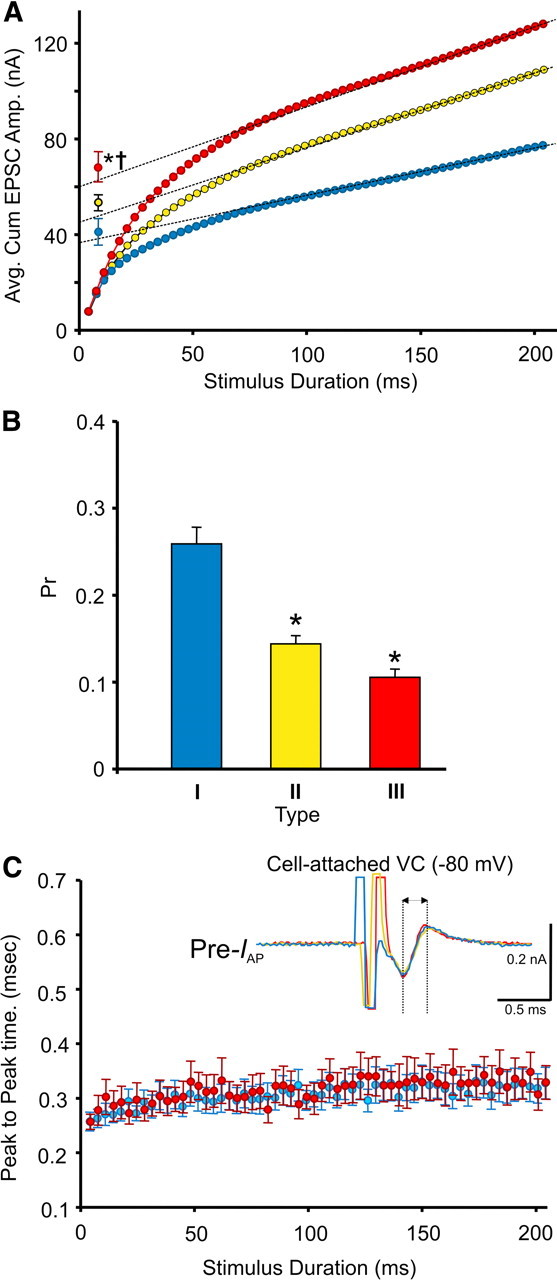
Quantal properties of transmitter release are related to the form of STP expressed and the morphology of calyx of Held terminals. A, Average cumulative EPSC amplitudes in MNTB neurons innervated by type I (n = 8) (blue), type II (n = 9) (yellow), and type III (n = 7) calyces calculated from 300 Hz test trains. Size of RRP estimated by back-extrapolating to time 0 (Schneggenburger et al., 1999). Average RRP size also estimated with synaptic vesicle replenishment considered (plots with error bars). B, Average Pr of synaptic vesicles in type I, II, and III calyces. C, Average peak-to-peak time differences [arrow in inset reflecting the half-widths of presynaptic action potential current (Pre-IAP) traces recorded during voltage-clamp (VC) from each calyx type at −80 mV] calculated from cell-attached recordings in type I, II, and III calyces during 300 Hz test trains. Type II data omitted for clarity but was not different from type I and III. * indicates different from type I. † indicates different from type II.
Heterogeneities in calyx morphology affects residual Ca2+ buildup leading to different forms of STP
Residual Ca2+ in synaptic terminals after high-frequency stimulation is thought to be a primary mechanism causing STF at synapses (Zucker and Regehr, 2002). Our findings suggest that the buildup of residual Ca2+ from incoming action potentials during train stimulation may be affected by calyx morphology. We reasoned that the swellings emanating from calyceal stalks, because of their attachment via a small neck, impose a geometrical constraint on the ability of incoming Ca2+ to rapidly diffuse. Consequently, the swellings, which contain many active zones (Wimmer et al., 2006), may compartmentalize Ca2+ transients during high-frequency activity, causing an enhancement of residual Ca2+ buildup and thus STF. Because type III calyces have numerous swellings, we hypothesized that manipulating the residual Ca2+ levels in these calyces by injecting the exogenous buffer EGTA would alter STP differentially for type I and III synapses. Using paired voltage-clamp recordings, we first recorded control EPSCs to determine whether synapses expressed STD similar to type I calyces, or whether synapses expressed STF followed by slow STD similar to type III calyces. After control EPSC trains, the presynaptic terminal was gently ruptured and 2 mm EGTA was allowed to diffuse throughout the terminal. The electrode was withdrawn to allow resealing of the membrane, and the trains were repeated in the same cell. In type I calyces, EGTA had little effect on the STD during both 100 and 300 Hz trains (Fig. 7A,C). However, in type III calyces, STF was eliminated after EGTA loading, essentially converting, acutely, a type III to a type I response with STD only (Fig. 7B,D). Changes in STP are also apparent in Figure 7E, which show no change in the paired-pulse ratio for type I calyces before and after EGTA loading (100 Hz, 88.1 ± 7.2 vs 84.6 ± 5.8%, p = 0.7; 300 Hz, 81.3. ± 5.1 vs 82.0 ± 6.2%, p = 0.9) but a switch from facilitation to depression for type III calyces (100 Hz, 106.8 ± 3.2 vs 90.5 ± 3.9%, p = 0.02; 300 Hz, 107.3 ± 2.3 vs 87.1 ± 1.8%, p < 0.001). Regardless of calyx type and stimulation frequency, there was no difference in the rate of depression before and after EGTA loading (Fig. 7F). We also observed a slight enhancement in the initial EPSC amplitude after EGTA loading, in sharp contrast to its effect in immature synapses in which EGTA potently attenuates transmitter release (Borst and Sakmann, 1996; Fedchyshyn and Wang, 2005). The precise mechanism underlying this enhancement is not known, but in a separate set of recordings (n = 5), we observed a slight increase in presynaptic Ca2+ current after EGTA loading (data not shown). Despite this, a change in STP after EGTA loading was only observed in type III synapses. Thus, the form of STP expressed by calyx of Held–MNTB synapses after bursts of activity is influenced by differences in residual Ca2+ buildup, which likely relates to the number of swellings present on calyx terminals.
Calyx morphology and form of STP determine spike output of principal MNTB neurons
An important physiological feature to distinguish type I, II, and III synapses was the difference in steady-state EPSC amplitude (last 50 ms of train) during stimulation trains. This is most apparent in Figure 5, C and D, for the 100 and 200 Hz test trains, which show type I synapses depressed to a greater degree compared with type III synapses but less so for the 300 Hz trains (Fig. 5E). In fact, when the data in Figure 5C–E are replotted to determine the relationship between steady-state EPSC amplitude (expressed as the percentage of the first EPSC) and the number of swellings on calyx terminals, we observed very strong correlations at 100 Hz (r = 0.87, p < 0.0001) and 200 Hz (r = 0.8, p < 0.0001) (Fig. 8A,B). At 300 Hz, this correlation was weaker (Fig. 8C, r = 0.56, p = 0.004) likely as a result of the depletion of the RRP. Given these findings and the differences in spike failures observed in Figure 1D, it is possible that the MNTB operates on a morphological and functional continuum. On one end of the continuum, the MNTB contains calyces, which are structurally simple, have small surface areas, volumes, and RRP sizes and a high Pr leading to strong STD and a high incidence of postsynaptic spike failures. Conversely, the MNTB contains calyces that are structurally complex, have large surface areas and volumes, a large RRP, but low Pr and consequently less synaptic depression and fewer postsynaptic spike failures. To explore this further, we generated raster plots of the postsynaptic spikes recorded at 300 Hz from all the cells used in Figure 1C (Fig. 8D), a frequency at which there was a high degree of variability in postsynaptic spike failures ranging from 0 to ∼50%. When arranged from most depressing (i.e., type I) to least depressing (i.e., type III), two features became immediately apparent in the raster plots (Fig. 8D). First, there was gradual decrease in the incidence of postsynaptic spike failures as the steady-state EPSC amplitude increased. This gradient is illustrated in Figure 8E, which shows a strong correlation (r = 0.83, p < 0.0001) between these two variables. Second, as the steady-state EPSC amplitude increased, the onset of failures began to occur much later in the train. This is also illustrated in Figure 8F in which we combined the spike failure data from five cells with a steady-state amplitude <15% (i.e., type I cells, compare with Fig. 8B) and compared it with spike failures from five cells with a steady-state amplitude >20% (i.e., type III cells). At 300 Hz, synapses expressing strong STD began to fail before 50 ms into the train, whereas the least depressing synapses began to show a small number of failures usually after 100 ms into the train. Synapses with an intermediate level of depression (steady-state amplitude between 15 and 20%) began to show failures between 50 and 100 ms into the train (see rasters in Fig. 8D). When we calculated the average spike failure rate for cells showing the most, intermediate, and least depression at different stimulation frequencies to determine differences in fidelity (Fig. 8G), an obvious gradient emerged at 300 Hz and remained at 400 Hz. Those synapses with the least amount of depression (Fig. 8H,I, red plots) had the fewest spike failures, and those with greatest amount of depression (Fig. 8H,I, blue plots) had the highest number of spike failures. Coincidently, the synapses expressing strong STD (Fig. 8D–I, blue plots) had a higher Pr (0.21 ± 0.02) compared with the least depressing synapses (0.12 ± 0.01; Fig. 8D–I, red plots) (Fig. 8J), which was in line with the Pr calculated for the type I and type III calyces, respectively, shown in Figure 6B. Those with an intermediate level of synaptic depression (Fig. 8D,E,G–I, yellow plots) had a Pr of 0.15 ± 0.01, which was in line with the Pr of type II calyces in Figure 6B. Collectively, these findings suggest that, under more physiological conditions when axonal inputs from calyces are brief and/or low in frequency, most, if not all, principal MNTB cells will discharge quite reliably regardless of calyx morphology, quantal parameters, and the form of STP expressed. This is in line with in vivo studies in which brief tone stimulation (50 ms) evokes few spike failures (Lorteije et al., 2009; Lorteije and Borst, 2011). However, when challenged physiologically with high-frequency stimuli (>400 Hz) that are relatively long in duration, our results predict that more spike failures are likely to occur, which agrees with the in vivo findings of Kopp-Scheinpflug et al. (2008) and Lorteije and Borst (2011). Thus, the principal MNTB cells likely to transmit reliably for long-duration stimuli are those innervated by morphologically complex calyces, which are more resistant to synaptic depression.
Recent studies using extracellular recording methods in vivo suggest that STD or STF may play a minor role in postsynaptic spike failures in principle MNTB neurons during acoustic stimulation. Rather, postsynaptic spike depression (Lorteije et al., 2009) or other upstream factors (Lorteije and Borst, 2011) contribute to the spike failures observed in principle MNTB neurons. To directly examine whether STD and/or STF contributes to spike failures, we performed whole-cell CC recordings from principle MNTB neurons. These experiments were specifically designed to determine (1) whether the same principle MNTB neuron would differentially generate spikes if it received input from a type I versus a type III calyx and (2) whether the steady-state EPSC amplitude plays a role in principle MNTB neuron spike failures. To mimic synaptic inputs from type I or III calyx, we generated current injection templates using actual EPSCs recorded from a principle MNTB neuron innervated by type I and III calyx synapses during a 300 Hz train (200 ms). The polarity of the recorded EPSC trace was reversed to evoke spikes from the same neurons near their resting membrane potentials (∼70 mV) (Fig. 9A). When injected with the type I template, principle MNTB neurons showed a large number of spike failures, typically occurring in the latter half of the train (Fig. 9Aai). In contrast, when the same MNTB cell was injected with a type III template (Fig. 9Aaii), the spike failures were essentially eliminated. In fact, for all cells (n = 10), the incidence of spike failures was higher when the type I template was injected versus the type III template (Fig. 9Bbi vs Bbii). Because the spike failures during the type I template injection typically occurred in the latter half of the train, we reasoned that the smaller steady-state EPSC amplitudes typical of type I synapses may underlie the increased spike failures observed in principle MNTB neurons innervated by type I calyces. To test this, we generated current injection template hybrids by swapping the first and last 100 ms of type I and type III templates. When the type III + type I hybrid template was injected (Fig. 9Aaiii), we observed very few spike failures in the first 100 ms of the train. However, in the last 100 ms of the train, there was a large increase in the number of spike failures compared with the type III template injection essentially rescuing the type I phenotype (Fig. 9Aai vs Aaiii, C). In contrast, current injection with type I + type III hybrid template (Fig. 9Aaiv) had little effects on the incidence of spike failures in the first 100 ms but significantly reduced spike failures for the last 100 ms compared with the type I template condition, essentially replicating the type III phenotype (Fig. 9Aaii vs Aaiv, C). Given that the same principle MNTB cell can undergo different spiking modalities depending on the type of STP expressed, in particular the magnitude of synaptic depression, our results strongly suggest that calyx morphology is a major determinant of the reliability of transmission at this synapse.
Discussion
We explored the possibility that anatomical specializations of synaptic terminals contribute to divergent forms of use-dependent changes in STP and consequently the fidelity of postsynaptic spiking. We show, for the first time at the mature calyx of Held–MNTB synapse, that the gross morphology of the synaptic terminal is tightly coupled to heterogeneities in STP and spike firing probability of principal MNTB neurons previously observed at this synapse. Our findings raise the possibility that principal MNTB neurons innervated by morphologically distinct calyces use different forms of STP to filter the level of inhibition delivered to other brainstem nuclei such as the MSO and LSO during sound localization.
Contribution of swellings to functional heterogeneity
In contrast to the conventional view that mature calyces of Held are homogeneous in structure, we identified three morphologically distinct calyx phenotypes based on the number of swellings observed after 3D rendering. Our arbitrary classification scheme, which was statistically validated using a post hoc cluster analysis, allows for relatively simple grouping of calyx terminals with similar morphologies to investigate their potential differences in synaptic function. Indeed, we discovered that structure and function are strongly correlated among different calyx types. However, we recognize that it is unlikely the MNTB contains only three morphologically distinct classes of calyces, with each showing a unique functional property. Rather, our data suggest that the MNTB is organized as a structural and functional continuum, with calyces tuned from very simple in structure (fewest swellings) expressing the strongest STD and innervating principal MNTB neurons with the highest probability for postsynaptic failures to more complex calyces (most swellings) exhibiting the least amount of STD and innervating principal MNTB neurons with the lowest probability for postsynaptic spike failures. This work, which offers a relatively simple method to classify different calyces based on anatomical and/or electrophysiological methods, lays a solid foundation for future studies to investigate mechanisms dictating calyx morphology, distinct forms of STP, their relation to postsynaptic discharges, and ultimately their computational role in sound localization.
Our results provide strong evidence that the number of swellings on calyx of Held terminals is functionally important. The upper limit for the number of swellings on mature calyces may be close to 30 based on our findings. This seems in line with the study performed in rats by Wimmer et al. (2006) but substantially lower than the number of synaptic vesicle clusters reported by the same group. Type III calyces contained the most swellings and also had the largest RRP size. More swellings may provide an anatomical substrate to increase the volume of calyx terminals and accommodate a larger absolute number of synaptic vesicles or synaptic vesicle clusters than calyces with fewer swellings. It is unclear what proportion of vesicles are docked and which are part of the reserve pool, but an increase in pool size may allow some calyces to transmit with high fidelity for prolonged periods as suggested previously (Taschenberger et al., 2002). Our data showing principal MNTB neurons innervated by type III calyces have fewer postsynaptic spike failures versus those innervated by type I calyces after high-frequency stimuli support this view.
It is also possible that swellings increase the surface area of calyces to accommodate more active zones and hence release sites, as implicated by the uniformly distributed active zone markers bassoon and piccolo (Dondzillo et al., 2010). The fact that swellings themselves contain five to nine active zones (Wimmer et al., 2006) suggests that calyces with multiple swellings (e.g., type III) are likely to have the most active zones. Having more active zones may ensure sufficient supply of synaptic vesicles and available release sites independent of their inactivation or refractory state during long stimulation periods. This may explain the larger steady-state EPSC amplitudes in type III versus the smaller type I calyces. Morphological analyses of active zone distribution and vesicles in different compartments of the three calyx types using electron microscopy are required to validate these ideas.
Previous work in many synapses has inevitably converged onto the central role of activity-dependent buildup of residual Ca2+ in mediating various forms of STP, facilitation in particular, but how Ca2+ exerts its action remains a matter of debate (Zucker and Regehr, 2002; Felmy et al., 2003). At mature calyces, it appears that the form of STP expressed is primarily dictated by the absence or presence of swellings attached to the stalks by a thin neck. However, in young calyces, this coupling between structure and the form of STP expressed is essentially absent (Schwenger and Kuner, 2010). The swellings, which were typically found in type II and III calyces, may present diffusion constraints and physically compartmentalize Ca2+ transients during repetitive activity and elevate residual Ca2+ concentration within swellings, leading to STF. In contrast, type I calyces, which were composed mainly of stalks, expressed only STD as a result of a depletion of the RRP, which may be attributed to more effective absorption and extrusion of residual Ca2+ possibly by endogenous buffers, internal stores, and pumps along the stalks that have limited diffusion barriers. This is supported by our observations that EGTA had no effect on STD in type I calyces but eliminated facilitation and converted STF to STD in type III calyces, presumably by buffering the residual Ca2+ buildup in swellings. Interestingly, Felmy and Schneggenburger (2004) demonstrate that the Ca2+ binding proteins, calretinin and parvalbumin, are heterogeneously expressed among calyces within the MNTB. Because these proteins have fast and slow Ca2+ binding kinetics, respectively, one could envisage that different expression levels of these endogenous buffers and their targeting to distinct calyx types, or even different compartments (stalks vs swellings) within the same calyx, introduce heterogeneities in Ca2+ buffering capacity and hence contribute to distinct forms of STP. Direct imaging of Ca2+ level and dynamics in different calyceal compartments during high-frequency trains is required to test these ideas in future studies. Together, our findings suggest that the structural heterogeneity of calyx terminals introduced by the absence or presence of swellings is highly related to the functional heterogeneities observed at the calyx of Held–MNTB synapse.
STP and postsynaptic spike failures
We demonstrated that principal MNTB neurons innervated by calyx terminals that are simple in structure, type I, express strong STD, which consequently lead to a large number of spike failures during high-frequency stimulation compared with those innervated by more structurally complex terminals expressing STF. In a subset of experiments, we mimicked in vivo-like conditions by recording at physiological temperature and incorporating spontaneous activity that is typically present in vivo (Hermann et al., 2007; Kopp-Scheinpflug et al., 2008; Lorteije et al., 2009; Sonntag et al., 2009). We found large variability in the incidence of postsynaptic failures except that the onset of the failure variability within the data occurred at higher stimulation frequencies compared with the standard conditions (i.e., room temperature) and that type III synapses again exhibited higher fidelity of firing than type I synapses. We suggest that calyx morphology, and in particular the extent of STD (i.e., level of steady-state depression), are key components determining the firing properties of principal MNTB neurons. This was confirmed in current-clamp recordings (Fig. 9) in which we could reproduce the variability in spike failures by directly injecting current mimicking either type I or type III synaptic into the same principle MNTB neurons. These results indicate that larger steady-state EPSC amplitudes associated with either more complex morphology or elevated experimental temperatures (Kushmerick et al., 2006) correlate well with fewer postsynaptic spike failures.
Recent work by Lorteije et al. (2009) suggests that spike depression rather than STD at the calyx of Held–MNTB synapse underlies postsynaptic spike failures in vivo. However, the wide range of spike failure rates (1.0–73.3%) among a limited number of recordings (i.e., n = 6) precludes us from making meaningful comparison. With a much larger sample size, detailed morphological analyses, and direct current-clamp recordings, we suggest that STD, and/or STF, also contributes to the large variability in spike failures in vivo. Different experimental conditions may also lead to the discrepancy between these two studies. The majority of our experiments were performed under standard slice conditions (i.e., room temperature and extracellular Ca2+ concentration of 2 mm), whereas tonic and phasic inhibition by GABA and/or glycine were blocked. Such inhibition in vivo may affect both excitatory inputs and intrinsic excitability of MNTB neurons in intact brainstem circuits in which exact extracellular Ca2+ concentration is likely lower. Despite these differences, our results imply that morphologically distinct calyces impart diverse firing modalities of principal MNTB neurons potentially important for coding sound signals.
Role in sound localization
Several studies demonstrate that heterogeneous forms of STP play a role in sound localization. Synapses with high Pr, small RRPs, and strong STD appear well-suited for coding ITDs (Kuba et al., 2002; Cook et al., 2003; Yang and Xu-Friedman, 2009; Couchman et al., 2010), whereas synapses with low Pr, large RRPs, and STF followed by slow depression are better tuned for coding ILDs (MacLeod et al., 2007;Yang and Xu-Friedman, 2009). Thus, it is tempting to speculate that calyces with simple morphologies filter timing information, those with complex morphologies filter intensity information, and those with intermediate morphologies filter a combination of both. Furthermore, it is possible that principal MNTB neurons innervated by calyces with distinct morphologies project to different brainstem nuclei involved in sound localization. In predominantly high-frequency hearing species (i.e., mouse), principal MNTB neurons innervated by different calyces may target different regions of the LSO given the structural heterogeneity of LSO dendrites in different tonotopic regions (Sanes et al., 1990). However, in light of previous hypotheses suggesting the MSO encodes ITDs and LSO encodes ILDs in animals with well-developed low- and high-frequency hearing (Tollin, 2003), future experiments examining the axonal projection of principal MNTB neurons innervated by different calyx types to these nuclei (i.e., MSO and LSO) may clarify the precise role of calyx morphology and STP in filtering timing and intensity cues during sound localization.
Footnotes
This work was supported by individual Operating Grants MOP-143867 and MOP-14692 from Canadian Institutes of Health Research and Canada Research Chair (L.-Y.W.), as well as a Restracomp Postdoctoral Fellowship from the SickKids Research Institute (G.G.). We thank Dr. Michael Fedchyshyn for program coding to estimate RRP, Dr. Yi-Mei (Amy) Yang and Dr. Myriam Lafreniere-Roula for critical inputs to a previous version of this manuscript, and other members of the Wang Laboratory for assistance and discussions.
References
- Borst JG, Sakmann B. Calcium influx and transmitter release in a fast CNS synapse. Nature. 1996;383:431–434. doi: 10.1038/383431a0. [DOI] [PubMed] [Google Scholar]
- Brand A, Behrend O, Marquardt T, McAlpine D, Grothe B. Precise inhibition is essential for microsecond interaural time difference coding. Nature. 2002;417:543–547. doi: 10.1038/417543a. [DOI] [PubMed] [Google Scholar]
- Cook DL, Schwindt PC, Grande LA, Spain WJ. Synaptic depression in the localization of sound. Nature. 2003;421:66–70. doi: 10.1038/nature01248. [DOI] [PubMed] [Google Scholar]
- Couchman K, Grothe B, Felmy F. Medial superior olivary neurons receive surprisingly few excitatory and inhibitory inputs with balanced strength and short-term dynamics. J Neurosci. 2010;30:17111–17121. doi: 10.1523/JNEUROSCI.1760-10.2010. [DOI] [PMC free article] [PubMed] [Google Scholar]
- Dondzillo A, Sätzler K, Horstmann H, Altrock WD, Gundelfinger ED, Kuner T. Targeted three-dimensional immunohistochemistry reveals localization of presynaptic proteins Bassoon and Piccolo in the rat calyx of Held before and after the onset of hearing. J Comp Neurol. 2010;518:1008–1029. doi: 10.1002/cne.22260. [DOI] [PubMed] [Google Scholar]
- Englitz B, Tolnai S, Typlt M, Jost J, Rübsamen R. Reliability of synaptic transmission at the synapses of Held in vivo under acoustic stimulation. PLoS One. 2009;4:e7014. doi: 10.1371/journal.pone.0007014. [DOI] [PMC free article] [PubMed] [Google Scholar]
- Fedchyshyn MJ, Wang LY. Developmental transformation of the release modality at the calyx of Held synapse. J Neurosci. 2005;25:4131–4140. doi: 10.1523/JNEUROSCI.0350-05.2005. [DOI] [PMC free article] [PubMed] [Google Scholar]
- Fedchyshyn MJ, Wang LY. Activity-dependent changes in temporal components of neurotransmission at the juvenile mouse calyx of Held synapse. J Physiol. 2007;581:581–602. doi: 10.1113/jphysiol.2007.129833. [DOI] [PMC free article] [PubMed] [Google Scholar]
- Felmy F, Schneggenburger R. Developmental expression of the Ca2+-binding proteins calretinin and parvalbumin at the calyx of held of rats and mice. Eur J Neurosci. 2004;20:1473–1482. doi: 10.1111/j.1460-9568.2004.03604.x. [DOI] [PubMed] [Google Scholar]
- Felmy F, Neher E, Schneggenburger R. Probing the intracellular calcium sensitivity of transmitter release during synaptic facilitation. Neuron. 2003;37:801–811. doi: 10.1016/s0896-6273(03)00085-0. [DOI] [PubMed] [Google Scholar]
- Ford MC, Grothe B, Klug A. Fenestration of the calyx of Held occurs sequentially along the tonotopic axis, is influenced by afferent activity, and facilitates glutamate clearance. J Comp Neurol. 2009;514:92–106. doi: 10.1002/cne.21998. [DOI] [PubMed] [Google Scholar]
- Futai K, Okada M, Matsuyama K, Takahashi T. High-fidelity transmission acquired via a developmental decrease in NMDA receptor expression at an auditory synapse. J Neurosci. 2001;21:3342–3349. doi: 10.1523/JNEUROSCI.21-10-03342.2001. [DOI] [PMC free article] [PubMed] [Google Scholar]
- Grothe B, Pecka M, McAlpine D. Mechanisms of sound localization in mammals. Physiol Rev. 2010;90:983–1012. doi: 10.1152/physrev.00026.2009. [DOI] [PubMed] [Google Scholar]
- Guinan JJ, Jr, Li RY. Signal processing in brainstem auditory neurons which receive giant endings (calyces of Held) in the medial nucleus of the trapezoid body of the cat. Hear Res. 1990;49:321–334. doi: 10.1016/0378-5955(90)90111-2. [DOI] [PubMed] [Google Scholar]
- Hermann J, Pecka M, von Gersdorff H, Grothe B, Klug A. Synaptic transmission at the calyx of Held under in vivo like activity levels. J Neurophysiol. 2007;98:807–820. doi: 10.1152/jn.00355.2007. [DOI] [PubMed] [Google Scholar]
- Hermida D, Mateos JM, Elezgarai I, Puente N, Bilbao A, Bueno-López JL, Streit P, Grandes P. Spatial compartmentalization of AMPA glutamate receptor subunits at the calyx of Held synapse. J Comp Neurol. 2010;518:163–174. doi: 10.1002/cne.22189. [DOI] [PubMed] [Google Scholar]
- Joshi I, Wang LY. Developmental profiles of glutamate receptors and synaptic transmission at a single synapse in the mouse auditory brainstem. J Physiol. 2002;540:861–873. doi: 10.1113/jphysiol.2001.013506. [DOI] [PMC free article] [PubMed] [Google Scholar]
- Kandler K, Friauf E. Pre- and postnatal development of efferent connections of the cochlear nucleus in the rat. J Comp Neurol. 1993;328:161–184. doi: 10.1002/cne.903280202. [DOI] [PubMed] [Google Scholar]
- Kopp-Scheinpflug C, Tolnai S, Malmierca MS, Rübsamen R. The medial nucleus of the trapezoid body: comparative physiology. Neuroscience. 2008;154:160–170. doi: 10.1016/j.neuroscience.2008.01.088. [DOI] [PubMed] [Google Scholar]
- Kuba H, Koyano K, Ohmori H. Synaptic depression improves coincidence detection in the nucleus laminaris in brainstem slices of the chick embryo. Eur J Neurosci. 2002;15:984–990. doi: 10.1046/j.1460-9568.2002.01933.x. [DOI] [PubMed] [Google Scholar]
- Kushmerick C, Renden R, von Gersdorff H. Physiological temperatures reduce the rate of vesicle pool depletion and short-term depression via an acceleration of vesicle recruitment. J Neurosci. 2006;26:1366–1377. doi: 10.1523/JNEUROSCI.3889-05.2006. [DOI] [PMC free article] [PubMed] [Google Scholar]
- Lorteije JA, Borst JG. Contribution of the mouse calyx of Held synapse to tone adaptation. Eur J Neurosci. 2011;33:251–258. doi: 10.1111/j.1460-9568.2010.07507.x. [DOI] [PubMed] [Google Scholar]
- Lorteije JA, Rusu SI, Kushmerick C, Borst JG. Reliability and precision of the mouse calyx of Held synapse. J Neurosci. 2009;29:13770–13784. doi: 10.1523/JNEUROSCI.3285-09.2009. [DOI] [PMC free article] [PubMed] [Google Scholar]
- MacLeod KM, Horiuchi TK, Carr CE. A role for short-term synaptic facilitation and depression in the processing of intensity information in the auditory brain stem. J Neurophysiol. 2007;97:2863–2874. doi: 10.1152/jn.01030.2006. [DOI] [PMC free article] [PubMed] [Google Scholar]
- Mc Laughlin M, van der Heijden M, Joris PX. How secure is in vivo synaptic transmission at the calyx of Held? J Neurosci. 2008;28:10206–10219. doi: 10.1523/JNEUROSCI.2735-08.2008. [DOI] [PMC free article] [PubMed] [Google Scholar]
- Müller M, Goutman JD, Kochubey O, Schneggenburger R. Interaction between facilitation and depression at a large CNS synapse reveals mechanisms of short-term plasticity. J Neurosci. 2010;30:2007–2016. doi: 10.1523/JNEUROSCI.4378-09.2010. [DOI] [PMC free article] [PubMed] [Google Scholar]
- Pecka M, Brand A, Behrend O, Grothe B. Interaural time difference processing in the mammalian medial superior olive: the role of glycinergic inhibition. J Neurosci. 2008;28:6914–6925. doi: 10.1523/JNEUROSCI.1660-08.2008. [DOI] [PMC free article] [PubMed] [Google Scholar]
- Renden R, Taschenberger H, Puente N, Rusakov DA, Duvoisin R, Wang LY, Lehre KP, von Gersdorff H. Glutamate transporter studies reveal the pruning of metabotropic glutamate receptors and absence of AMPA receptor desensitization at mature calyx of held synapses. J Neurosci. 2005;25:8482–8497. doi: 10.1523/JNEUROSCI.1848-05.2005. [DOI] [PMC free article] [PubMed] [Google Scholar]
- Rowland KC, Irby NK, Spirou GA. Specialized synapse-associated structures within the calyx of Held. J Neurosci. 2000;20:9135–9144. doi: 10.1523/JNEUROSCI.20-24-09135.2000. [DOI] [PMC free article] [PubMed] [Google Scholar]
- Sanes DH. An in vitro analysis of sound localization mechanisms in the gerbil lateral superior olive. J Neurosci. 1990;10:3494–3506. doi: 10.1523/JNEUROSCI.10-11-03494.1990. [DOI] [PMC free article] [PubMed] [Google Scholar]
- Sanes DH, Goldstein NA, Ostad M, Hillman DE. Dendritic morphology of central auditory neurons correlates with their tonotopic position. J Comp Neurol. 1990;294:443–454. doi: 10.1002/cne.902940312. [DOI] [PubMed] [Google Scholar]
- Schneggenburger R, Forsythe ID. The calyx of Held. Cell Tissue Res. 2006;326:311–337. doi: 10.1007/s00441-006-0272-7. [DOI] [PubMed] [Google Scholar]
- Schneggenburger R, Meyer AC, Neher E. Released fraction and total size of a pool of immediately available transmitter quanta at a calyx synapse. Neuron. 1999;23:399–409. doi: 10.1016/s0896-6273(00)80789-8. [DOI] [PubMed] [Google Scholar]
- Schwenger DB, Kuner T. Acute genetic perturbation of exocyst function in the rat calyx of Held impedes structural maturation, but spares synaptic transmission. Eur J Neurosci. 2010;32:974–984. doi: 10.1111/j.1460-9568.2010.07391.x. [DOI] [PubMed] [Google Scholar]
- Sonntag M, Englitz B, Kopp-Scheinpflug C, Rübsamen R. Early postnatal development of spontaneous and acoustically evoked discharge activity of principal cells of the medial nucleus of the trapezoid body: an in vivo study in mice. J Neurosci. 2009;29:9510–9520. doi: 10.1523/JNEUROSCI.1377-09.2009. [DOI] [PMC free article] [PubMed] [Google Scholar]
- Taschenberger H, von Gersdorff H. Fine-tuning an auditory synapse for speed and fidelity: developmental changes in presynaptic waveform, EPSC kinetics, and synaptic plasticity. J Neurosci. 2000;20:9162–9173. doi: 10.1523/JNEUROSCI.20-24-09162.2000. [DOI] [PMC free article] [PubMed] [Google Scholar]
- Taschenberger H, Leão RM, Rowland KC, Spirou GA, von Gersdorff H. Optimizing synaptic architecture and efficiency for high-frequency transmission. Neuron. 2002;36:1127–1143. doi: 10.1016/s0896-6273(02)01137-6. [DOI] [PubMed] [Google Scholar]
- Tollin DJ. The lateral superior olive: a functional role in sound source localization. Neuroscientist. 2003;9:127–143. doi: 10.1177/1073858403252228. [DOI] [PubMed] [Google Scholar]
- von Gersdorff H, Borst JG. Short-term plasticity at the calyx of held. Nat Rev Neurosci. 2002;3:53–64. doi: 10.1038/nrn705. [DOI] [PubMed] [Google Scholar]
- Wesseling JF, Lo DC. Limit on the role of activity in controlling the release-ready supply of synaptic vesicles. J Neurosci. 2002;22:9708–9720. doi: 10.1523/JNEUROSCI.22-22-09708.2002. [DOI] [PMC free article] [PubMed] [Google Scholar]
- Wimmer VC, Horstmann H, Groh A, Kuner T. Donut-like topology of synaptic vesicles with a central cluster of mitochondria wrapped into membrane protrusions: a novel structure-function module of the adult calyx of Held. J Neurosci. 2006;26:109–116. doi: 10.1523/JNEUROSCI.3268-05.2006. [DOI] [PMC free article] [PubMed] [Google Scholar]
- Xu-Friedman MA, Regehr WG. Structural contributions to short-term synaptic plasticity. Physiol Rev. 2004;84:69–85. doi: 10.1152/physrev.00016.2003. [DOI] [PubMed] [Google Scholar]
- Yang H, Xu-Friedman MA. Impact of synaptic depression on spike timing at the endbulb of Held. J Neurophysiol. 2009;102:1699–1710. doi: 10.1152/jn.00072.2009. [DOI] [PMC free article] [PubMed] [Google Scholar]
- Yang YM, Wang LY. Amplitude and kinetics of action potential-evoked Ca2+ current and its efficacy in triggering transmitter release at the developing calyx of held synapse. J Neurosci. 2006;26:5698–5708. doi: 10.1523/JNEUROSCI.4889-05.2006. [DOI] [PMC free article] [PubMed] [Google Scholar]
- Youssoufian M, Couchman K, Shivdasani MN, Paolini AG, Walmsley B. Maturation of auditory brainstem projections and calyces in the congenitally deaf (dn/dn) mouse. J Comp Neurol. 2008;506:442–451. doi: 10.1002/cne.21566. [DOI] [PubMed] [Google Scholar]
- Zucker RS, Regehr WG. Short-term synaptic plasticity. Annu Rev Physiol. 2002;64:355–405. doi: 10.1146/annurev.physiol.64.092501.114547. [DOI] [PubMed] [Google Scholar]