

Abstract
To sense myriad environmental odors, animals have evolved multiple, large families of divergent olfactory receptors. How and why distinct receptor repertoires and their associated circuits are functionally and anatomically integrated is essentially unknown. We have addressed these questions through comprehensive comparative analysis of the Drosophila olfactory subsystems that express the ionotropic receptors (IRs) and odorant receptors (ORs). We identify ligands for most IR neuron classes, revealing their specificity for select amines and acids, which complements the broader tuning of ORs for esters and alcohols. IR and OR sensory neurons exhibit glomerular convergence in segregated, although interconnected, zones of the primary olfactory center, but these circuits are extensively interdigitated in higher brain regions. Consistently, behavioral responses to odors arise from an interplay between IR- and OR-dependent pathways. We integrate knowledge on the different phylogenetic and developmental properties of these receptors and circuits to propose models for the functional contributions and evolution of these distinct olfactory subsystems.
Introduction
Animal olfactory systems have evolved to extract vital information from the vast universe of environmental volatiles with sensitivity, specificity, and short- and long-term flexibility. The challenges of odor detection are met by large repertoires of divergent odorant receptors (ORs) (Spehr and Munger, 2009; Touhara and Vosshall, 2009). In phylogenetically diverse species, individual olfactory sensory neurons (OSNs) generally express a single OR (Fuss and Ray, 2009), which is the primary determinant of odor response specificity. The axons of OSNs expressing the same receptor converge onto segregated regions of neuropil called glomeruli in the olfactory bulb (or antennal lobe in insects) (Hansson et al., 1992; Mombaerts et al., 1996; Zou et al., 2009). Here, OSNs synapse with projection neurons (PNs) that transmit odor-evoked signals to higher brain regions (Mori et al., 1999; Masse et al., 2009), as well as with local interneurons (LNs) that modulate OSN input and PN output activity within and between glomeruli (Christensen et al., 1993; Wachowiak and Shipley, 2006; Chou et al., 2010b).
Multiple families of olfactory receptors exist in diverse species, including five classes of olfactory G-protein-coupled receptors (GPCRs) in vertebrates: ORs, V1Rs, V2Rs, TAARs and FPRs (Spehr and Munger, 2009). These families are expressed in OSNs that are located in different peripheral olfactory organs and project to segregated brain regions, suggesting that they fulfill distinct functions such as food or pheromone detection. However, only a very small number of individual vertebrate olfactory receptors and circuits have been analyzed in vivo (Spehr and Munger, 2009; Touhara and Vosshall, 2009).
The olfactory system of adult Drosophila melanogaster has similar organizational principles to that of vertebrates, at a greatly reduced scale (∼45 ORs compared with >1300 in mice) (Vosshall and Stocker, 2007; Touhara and Vosshall, 2009). This numerical simplicity has permitted comprehensive characterization of the Drosophila olfactory pathways (Benton, 2007; Vosshall and Stocker, 2007; Su et al., 2009). However, these studies revealed a substantial gap in our knowledge, because ∼25% of OSNs do not express ORs (Couto et al., 2005; Fishilevich and Vosshall, 2005).
We recently described a second family of insect olfactory receptors called the ionotropic receptors (IRs), which are expressed in the complementary set of non-OR OSNs in the major olfactory organ, the antenna (Benton et al., 2009). In contrast to insect ORs, which define an insect-specific class of polytopic transmembrane proteins unrelated to GPCRs (Benton et al., 2006), IRs have derived from ionotropic glutamate receptors (iGluRs) and are found across the protostomian branch of the animal kingdom (Croset et al., 2010). Moreover, whereas OR repertoires are primarily species specific (Robertson and Wanner, 2006; Carey et al., 2010), many IRs are conserved in most or all insects (Croset et al., 2010). The distinct molecular, expression and evolutionary properties of ORs and IRs suggest that these repertoires may play different roles in olfactory detection. In this work, we present systematic analyses of the neuroanatomical and physiological properties of IR olfactory circuits, which provide insights into the contrasting origins, evolution, and function of these olfactory subsystems.
Materials and Methods
Drosophila genetics.
Drosophila stocks were maintained on conventional food medium under a 12 h light/dark cycle at 25°C (or 22°C for flies for imaging and behavioral analysis). The wild-type strain for the electrophysiological screen was the genome-sequenced strain (Bloomington Stock Center stock number 2057) (Adams et al., 2000) and an isogenized w1118 strain for the behavioral experiments. We used the following mutant and transgenic strains: IR8a1, IR8a–GAL4, IR25a–GAL4 (Abuin et al., 2011), IR25a2 (Benton et al., 2009), Orco1 (formerly OR83b1) (Larsson et al., 2004), OR35af02057 (Yao et al., 2005), IR64a–GAL4 (Ai et al., 2010), IR76a–GAL4 (Benton et al., 2009), OR35a–GAL4 (Fishilevich and Vosshall, 2005), GR28b.d–GAL4 (Thorne and Amrein, 2008), UAS–nls:GFP (Sachse et al., 2007), UAS–mCD8:GFP (Lee and Luo, 1999), UAS–nsyb:GFP (Vosshall et al., 2000), and UAS–DTI (diphtheria toxin) (Han et al., 2000).
New transgenic Drosophila strains were generated by standard procedures with either P-element-mediated transformation (most IR promoter-GAL4 lines) or, for all other transgenes, the phiC31-based integration system using attP-3B VK00038 (X chromosome), attP40 (second chromosome), or attP2 (third chromosome) landing sites (Bischof et al., 2007; Markstein et al., 2008) (Genetic Services).
Molecular biology.
For all plasmid constructs, desired products were amplified using the Expand High Fidelity PLUS PCR system (Roche) from Oregon-R genomic DNA, T:A cloned into pGEM-T Easy (Promega), sequenced, and subcloned—with restriction enzymes whose sites were incorporated into the PCR primers—into appropriate vectors as described below:
IR promoter–GAL4 transgenes.
For most IRs, the indicated length of DNA immediately upstream of the predicted IR start codon was cloned into pCaSpeR–AUG–Gal4 (Vosshall et al., 2000): IR31a–GAL4 (583 bp), IR40a–GAL4 (3011 bp), IR75d–GAL4 (1995 bp), IR76b–GAL4 (916 bp), IR84a–GAL4 (1964 bp), and IR92a–GAL4 (4113 bp). For IR75a–GAL4, 7833 bp immediately upstream and 1921 bp downstream of the predicted ORF were cloned 5′ and 3′ of GAL4 in pED36 (Demir and Dickson, 2005), respectively. For IR41a–GAL4, 2474 bp immediately upstream of the predicted start codon were cloned into pattB GAL4 (Croset et al., 2010).
UAS–gypsyGCaMP1.6gypsy.
To generate a more highly GAL4-inducible GCaMP1.6 transgene, we flanked the GCaMP1.6 coding sequence (Ohkura et al., 2005) with gypsy insulator sequences (Markstein et al., 2008) in pUAST attB (Bischof et al., 2007). Comparison of basal fluorescence levels of this transgene and a UAS–GCaMP1.6 transgene (Reiff et al., 2005) induced by Orco–GAL4 (Wang et al., 2003) indicated ∼2.5-fold higher expression levels (data not shown).
IR8a rescue transgene (IR8arescue).
The IR8a promoter (Abuin et al., 2011) was cloned directly upstream of the full-length IR8a cDNA (Abuin et al., 2011) in pattB (Bischof et al., 2007). Restoration of IR8a expression from this transgene was verified in an IR8a null mutant background (data not shown).
Orco rescue transgene (Orcorescue).
Because Orco–GAL4-driven UAS–Orco does not fully recapitulate wild-type levels of Orco expression (Larsson et al., 2004), we generated a rescue construct consisting of the bacterial artificial chromosome CH322–81L19, which carries a 20 Mb region of genomic DNA spanning the Orco locus (Venken et al., 2009) (BACPAC Resources Center, Children's Hospital Oakland Research Institute). Restoration of Orco expression from this transgene was verified in an Orco null mutant background (data not shown).
Electrophysiology.
Extracellular recordings in single sensilla of 1- to 14-d-old flies were performed essentially as described (Benton et al., 2007). Odors (Sigma and Fluka) were diluted to 1% (v/v) unless otherwise noted in the figures; l-glycine and l-glutamic acid were diluted to 1 m and gaseous carbon dioxide was used at 100%. CAS numbers, solvents, and purities for odorants will be provided on request. Coeloconic sensilla classes were identified by their characteristic morphology, their stereotypical distribution on the antennal surface, and their responses to one or more diagnostic odors (Yao et al., 2005; Benton et al., 2009).
Corrected responses were quantified by counting all spikes recorded from an individual sensillum [because of difficulties in reliably distinguishing spikes from individual neurons (Yao et al., 2005)] during a 0.5 s window starting 150–200 ms after the stimulus trigger. This period was defined precisely for each recording session with a control odor response and represents principally the time for the odor to reach the preparation. From this spike value, we subtracted the number of spontaneous spikes in a 0.5 s window before stimulation and doubled the result to obtain the odor-evoked spikes per second. To obtain a solvent-corrected response, we subtracted the spike frequency evoked by the corresponding solvent for each odor.
To compare OR and IR response profiles, we used a subset of data from our electrophysiological screen and that of a screen for OR ligands (Hallem and Carlson, 2006), corresponding to the 85 common odor stimuli. The shape of the tuning curves was quantified by calculating lifetime kurtosis (KL), using the following formula: KL = − 3, where M is the number of stimuli presented, r1 … rM are the sensillum responses, and r̄ and σr are the mean and the SD of the responses (Willmore and Tolhurst, 2001). We compared lifetime kurtosis values for IR sensilla with both individual ORs, as well as with OR sensilla, in which we summed the odor-evoked responses of all ORs expressed in neurons of each sensillum class according to published expression maps (Couto et al., 2005).
To compare the physicochemical properties of IR and OR ligands, we defined a set of the strongest agonists for IR and OR repertoires as those that provoked an increase of the spiking frequency of at least 35% of the increase provoked by the best IR or OR ligand, respectively. This threshold corresponded to 61 spikes/s for IR ligands (including 15 of 168 tested odors) and 100 spikes/s for OR ligands (including 68 of 110 tested odors). For these chemicals, we retrieved a set of 32 DRAGON descriptors (http://vcclab.org/lab/edragon/start.html), which are optimized for volatile odor ligands (Haddad et al., 2008). The descriptors were normalized for additional analyses using z-scores (raw score minus mean score, divided by the SD). Principal component analysis (PCA) and hierarchical cluster analysis of the DRAGON descriptors were performed using PAST (Hammer et al., 2001; Carey et al., 2010). PCA was performed using the correlation matrix, and Ward's method based on Euclidean distances was used to perform the hierarchical cluster analysis.
Histology.
We used the following primary antibodies: mouse monoclonal nc82 at 1:10 (provided by A. Hofbauer, University of Regensburg, Regensburg, Germany), rabbit α-GFP at 1:1000 (Invitrogen), mouse α-GFP at 1:500 (Invitrogen), rabbit α-Orco at 1:10,000 (Larsson et al., 2004), and guinea pig α-IR8a at 1:1000 (Abuin et al., 2011). Goat secondary antibodies—Alexa Fluor 488-, Cy3-, and Cy5-conjugated α-mouse, rabbit, and guinea pig IgG (Invitrogen; Jackson ImmunoResearch)—were used at either 1:1000 (for combined FISH/immunofluorescence on antennal sections) or 1:100 (for whole-mount brain immunofluorescence).
Immunofluorescence on whole-mount brains.
Flies, with appendages removed, were fixed for 40 min in 4% formaldehyde in PBS (all steps at room temperature unless otherwise stated), rinsed twice, and washed two times for 30 min in PBS plus 0.2% Triton X-100 (P/T). Brains were dissected in 5% heat-inactivated normal goat serum in P/T (P/T/S), blocked for at least an additional 30 min in P/T/S and incubated in primary antibodies diluted in P/T/S for 48 h at 4°C. After washing three times for 30 min in P/T, secondary antibodies diluted in P/T/S were applied and left overnight at 4°C. Brains were washed three times for 30 min in P/T and mounted on slides with bridge coverslips in Vectashield (Vector Laboratories).
Immunofluorescence on antennae.
Immunofluorescence on antennal cryosections was performed as described (Abuin et al., 2011). For visualization of endogenous nls:GFP fluorescence in whole-mount antennae, tissue was dissected from the head in P/T, fixed for 10 min with 4% formaldehyde in P/T, washed three times for 10 min in P/T, and mounted directly in Vectashield.
Combined fluorescent RNA in situ hybridization and immunofluorescence.
Fourteen micrometer antennal cryosections in OCT (Tissue-Tek) were collected on slides and fixed for 10 min in 4% formaldehyde in PBS. After washing three times for 3 min in PBS, sections were acetylated for 10 min (9.25 g of triethanolamine HCl and 1.12 ml of 10N NaOH in 500 ml of H2O), washed three times for 5 min in PBS, and incubated for 1 h at 65°C in hybridization solution (50% formamide, 5× SSC, 5× Denhardt's solution, 50 μg/ml yeast tRNA, 100 μg/ml herring sperm DNA, 50 μg/ml heparin, 2.5 mm EDTA, 0.1% Tween 20, and 0.25% CHAPS). Digoxygenin-labeled RNA probes for IR genes (Benton et al., 2009) were diluted in hybridization solution and applied to slides, which were overlaid with a coverslip to reduce evaporation and incubated in a humidified chamber for 16–24 h at 65°C. Coverslips were removed by soaking slides in 5× SSC prewarmed to 65°C and washed three times for 20 min in 0.2× SSC at 65°C. After 5 min rinsing in TN buffer (100 mm Tris-HCl, pH 7.5, 150 mm NaCl), sections were incubated for 30 min in 0.5% blocking reagent (PerkinElmer Life and Analytical Sciences) in TN (TNB). Primary antibodies (anti-DIG–peroxidase and anti-GFP) were diluted in TNB and incubated on slides overnight at 4°C. After three washes for 5 min in TN buffer plus 0.05% Tween-20 (TNT), FITC–tyramide diluted 1:50 in amplification reagent (TSA kit; PerkinElmer Life and Analytical Sciences) was incubated with slides for 10 min. Slides were washed three times for 5 min in TNT, and the secondary antibody diluted in TNB was applied and left for 2 h. Sections were washed three times for 5 min in TNT and mounted in Vectashield. All microscopy was performed using a Carl Zeiss LSM 510 Laser Scanning Confocal Microscope. The three-dimensional reconstruction of the antennal lobe and analysis of interglomerular distances were performed using Imaris version 6.4 (Bitplane Scientific Software).
Optical imaging.
Imaging experiments were performed essentially as described (Pelz et al., 2006; Silbering and Galizia, 2007). In brief, 1- to 3-week-old female flies were cold-anesthetized and fixed to Plexiglas chambers by their neck. Antennae were pulled forward using fine wire (Rediohm-800; H. P. Reid) to allow visual access to the antennal lobes. The head was covered by a thin foil held by a perforated plastic coverslip and sealed with two-component silicon to prevent leakage and keep the antennae dry (KwikSil; World Precision Instruments). A drop of Ringer's saline (in mm: 130 NaCl, 5 KCl, 2 MgCl2, 2 CaCl2, 36 saccharose, and 5 HEPES, pH 7.3) was placed on the head, a square region of cuticle between the eyes (to the sides) and the ocelli and antennae (to the back and front) was excised, and the air sacs and fat bodies removed. The preparation was rinsed several times with Ringer's solution and placed under a microscope for imaging.
Images were acquired with a CCD camera (CoolSNAP-HQ2 Digital Camera System) mounted on a fluorescence microscope (upright fixed stage Carl Zeiss Axio Examiner D1) equipped with a 20× water-immersion objective (W “Plan-Apochromat” 20×/1,0 M27 DIC). Excitation light of 470 nm was produced with a monochromator (VisiChrome). Light was guided through a filter block consisting of a 450–490 nm excitation filter, a dichroic mirror (T495LP), and a 500–550 nm emission filter (Chroma ET). Binned image size was 350 × 225 pixels on the chip, corresponding to 210 × 135 μm in the preparation. Exposure time varied between 40 and 100 ms to adjust for different basal fluorescence values across preparations. Ten-second films were recorded with an acquisition rate of 4 Hz. Metafluor software (Visitron) was used to control the camera, light, and data acquisition.
Odors were delivered with a custom-made olfactometer. A main air stream (1 L/min) was directed to the fly through a 0.4 mm inner diameter tubing, placed ∼0.5 cm from the fly head. At 27 cm upstream of the exit of the tubing, a secondary air stream (1 L/min) was added. Both air streams were generated by vacuum pumps (KNF Neuberger), and the flow rate was controlled by two independent rotameters (Analyt). The secondary air stream was guided either through an empty 2 ml syringe or through a 2 ml syringe containing 20 μl of odor (diluted 1% v/v, unless stated otherwise) or solvent on a small cellulose pad (Kettenbach) to generate 1 s odor pulses. To switch between control or odor stimulus application, a three-way magnetic valve (The Lee Company) was controlled by the acquisition software (Metafluor) via a VC6 valve controller unit (Harvard Apparatus). Odor stimulation occurred during frames 16 through 19 of the acquisition.
Data were processed using NIH ImageJ (with a Mac biophotonics plug-in; www.macbiophotonics.ca) and custom-written programs in Matlab and R. Time-series images corresponding to one experiment (∼25 measurements of 40 frames taken from one fly) were first aligned using StackReg/TurboReg (http://bigwww.epfl.ch/thevenaz/stackreg/) in NIH ImageJ. Raw images were then segmented in individual 40-frame measurements. Each measurement was bleach corrected by fitting a double-exponential function to the relative mean fluorescence in the labeled glomeruli over time, excluding the frames covering 5 s after stimulus onset.
We then calculated the relative change in fluorescence (ΔF/F) for each frame of each measurement as (Fi − F0)/F0 × 100, where F0 is the mean fluorescence value of frames 6–14 (before odor presentation), and Fi is the fluorescence value for the ith frame of the measurement. Activity traces were produced calculating the mean ΔF/F within a circular region of interest with a diameter of 10 pixels and transformed into heat maps using NIH ImageJ. The same region of interest was used for all measurements from the same animal.
Projection neuron analysis.
PN images from three different sources (Wong et al., 2002; Jefferis et al., 2007; Chiang et al., 2011) were brought into a common reference space for analysis. The common template (“Cell07”) was that of Jefferis et al. (2007), so 236 PN images from that study did not require additional processing. The anti-Discs large (anti-Dlg) channel of 35 confocal images from Chiang et al. (2011) was registered to a single female template brain (flycircuit id 6475, “FC6475”), chosen for good quality staining and imaging, using the CMTK toolkit (www.nitrc.org/projects/cmtk) as described previously (Cachero et al., 2010). The FC6475 template brain was then registered to the Cell07 brain using a landmarks registration based on 24 manually chosen anatomical landmarks visible in both anti-Dlg and nc82 staining. This landmarks registration used the pnreg command of the IRTK toolkit (www.doc.ic.ac.uk/∼dr/software), which uses nonlinear third-order B-spline registration (Rueckert et al., 1999). The per axis registration accuracy for independent landmarks (not used during the registration) was 3.3 μm, which is comparable with that of previous studies (Jefferis et al., 2007; Yu et al., 2010b).
Three VL2a projection neuron images from Wong et al. (2002) were each registered using 10–14 landmarks to the Cell07 template. Although those brains had weak nc82 staining, the only reliable marker was GH146–GAL4-driven expression of a CD2 reporter. We therefore used a two-channel confocal image of an nc82-stained brain containing GH146-driven mCD8:GFP expression that had been registered via its nc82 channel to the Cell07 template to help choose landmarks. Landmarks registration was again via the pnreg command of IRTK.
Neuronal tracing was performed in Amira (www.amira.com) with the hxskeletonize plugin (Evers et al., 2005). The 3D coordinates of neuronal tracings were then transformed from their respective original image coordinates using the CMTK gregxform tool (flycircuit images → FC6475 template) and the IRTK ptransform tool (FC6475 → Cell07, three VL2a images → FC6475). The underlying tools were called via custom code written in R (www.r-project.org), which was also used for 2D plots and 3D visualization of the transformed neuronal tracings using the AnalysisSuite R package (Jefferis et al., 2007). R source code, landmark files, and template brain images will be available on publication at http://flybrain.mrc-lmb.cam.ac.uk.
Behavioral analysis.
We adapted the T-maze olfactory choice assay (Helfand and Carlson, 1989). All mutant strains were backcrossed for five generations to our isogenic w1118 stock before behavioral analysis. Adult flies (2–8 d old) were starved in glass vials with humidified tissue paper for 24 h and transferred to empty 10 ml polystyrene assay tubes (Semadeni 2168) 2 h before the experiment.
Odors were diluted in distilled water or paraffin oil to 10% v/v, except phenylacetic acid, which was diluted to 15 g/L. Two hundred microliters of odor or solvent were loaded onto 4 × 3.5 cm filter papers and placed in 14 ml culture tubes (Falcon 352059, Milian), which were plugged onto polystyrene assay tubes with perforated bottoms and fitted on the side holes of the T-maze for odor delivery during the experiment. Odor delivery occurred by passive diffusion of the odor molecules into the tube, without additional airflow.
Twenty-five to 45 flies (median 33, q25 = 30, q75 = 36) were gently tapped into the elevator of a T-maze, which was then lowered to the choice point, offering flies the opportunity to select the arm containing an odor or the arm containing the solvent during 1 min. After this time, the elevator was lifted, and the flies in the three compartments (odor side, solvent side, and elevator) were quantified. The response index (RI) was calculated as follows: [(number of flies in the odor compartment) − (number of flies in the solvent compartment)]/total number of flies assayed (including those remaining in the elevator). All experiments were conducted under red light.
Data were analyzed using R software. The Mann–Whitney U test was used to compare the samples of the two genotypes for one odor. The Benjamini–Hochberg method was used to correct the p values for multiple comparisons. Differences were considered significant if the adjusted p value was <0.05.
Results
OR and IR sensory neurons are tuned to complementary chemical classes of odors
We first determined the odor response profile of IR-expressing OSNs by extending a previous electrophysiological screen of 45 odors (Yao et al., 2005) to a set of 168 structurally diverse chemicals (Fig. 1). Drosophila OSNs project their sensory dendrites into porous hairs called sensilla on the surface of the antenna (Benton, 2007; Vosshall and Stocker, 2007). Antennal sensilla comprise three morphological classes (Shanbhag et al., 1999): basiconic and trichoid, which are innervated by OR-expressing OSNs, and coeloconic sensilla, into which IR OSNs extend their dendrites (Stocker, 2001; Yao et al., 2005; Benton et al., 2009). There are four classes of coeloconic sensilla (ac1–ac4), which house two or three neurons each (Yao et al., 2005). We have previously defined nine classes of coeloconic neurons, which express distinct and stereotyped combinations of IR genes (Fig. 1) (Benton et al., 2009), as well as one or both of the broadly expressed coreceptors IR8a and IR25a (Abuin et al., 2011). Extracellular recordings from individual sensilla thus permit simultaneous analysis of the activities of several OSNs [reliable spike sorting to identify individual neurons is not possible (Fig. 1 legend) (Yao et al., 2005)]. In addition to the sensilla on the antennal surface, IRs are expressed in sensory neurons in two structures, the sacculus and arista, that are inaccessible to peripheral physiological recordings (see below) (Benton et al., 2009). Because ac3 sensilla contain a neuron also expressing a broadly tuned OR, OR35a (Yao et al., 2005), we performed our screen of this sensillum class in OR35a mutants to remove contributions of this receptor to the analyzed odor responses (Fig. 1).
Figure 1.

Odor response profiles of IR-expressing coeloconic sensilla neurons. Electrophysiological responses in the four antennal coeloconic sensilla classes (ac1–ac4) to 168 odors (mean ± SEM; n ≥ 4, mixed genders), representing the summed, solvent-corrected activities of the IR-expressing neurons they house, indicated in the diagrams at the top [the broadly expressed IR8a and IR25a coreceptors are not indicated (Abuin et al., 2011)]. We quantified summed responses because the small and overlapping spike amplitude of coeloconic neurons makes reliable spike sorting extremely difficult (Benton et al., 2009); a previous analysis was able to distinguish only two of the three neurons in ac1 and ac2 sensilla and was unable to discriminate the three OSNs in ac4 (Yao et al., 2005). Negative values indicate responses smaller than those evoked by the corresponding solvent, most likely attributable to suppression of basal activity in these neurons (Yao et al., 2005). Solvent responses are as follows: ac1, water, 19.69 ± 3.06; paraffin oil, 19.69 ± 3.25; ac2, water, 23.33 ± 4.79; paraffin oil, 28.22 ± 4.92; ac3, water, 14.39 ± 2.47; paraffin oil, 16.48 ± 2.16; ac4, water, 6.06 ± 1.91; paraffin oil, 1.56 ± 1.36. The summing of responses from neurons within a sensillum that display opposite changes in spike frequency will unavoidably lead to underestimations of evoked responses, but this is likely to affect only a very small minority of odor/neuron pairs. Odorants are color coded by functional group; chemicals containing multiple distinct functional groups were classified according to the IUPAC nomenclature of organic chemistry (Panico et al., 1993). We used a wild-type strain for all sensilla except for ac3, in which we recorded from a mutant line, OR35af02057, which lacks the function of this broadly tuned OR (Yao et al., 2005). Data for ac4 sensilla are in part adapted from our unpublished observations (Y.G., R.R., and R.B.).
Our screen confirmed and extended the previous smaller-scale analysis (Yao et al., 2005): robust odor responses (>50 spikes/s) were extremely sparse, encompassing <3% of odor–sensilla combinations (Figs. 1, 2A). Nevertheless, we identified several new agonists for IR neurons, including dimethylamine in ac1, 2,3-butanedione, acetic acid, and pyridine in ac2, 2-oxopentanoic acid in ac3, and phenylethylamine and phenylacetic acid in ac4. Notably, the vast majority of IR neuron agonists belong to two chemical classes: amines and carboxylic acids (Figs. 1, 2A). We also identified a number of antagonists, which reduce the spontaneous firing frequency of these neurons; the most potent of these were amines (Fig. 1).
Figure 2.
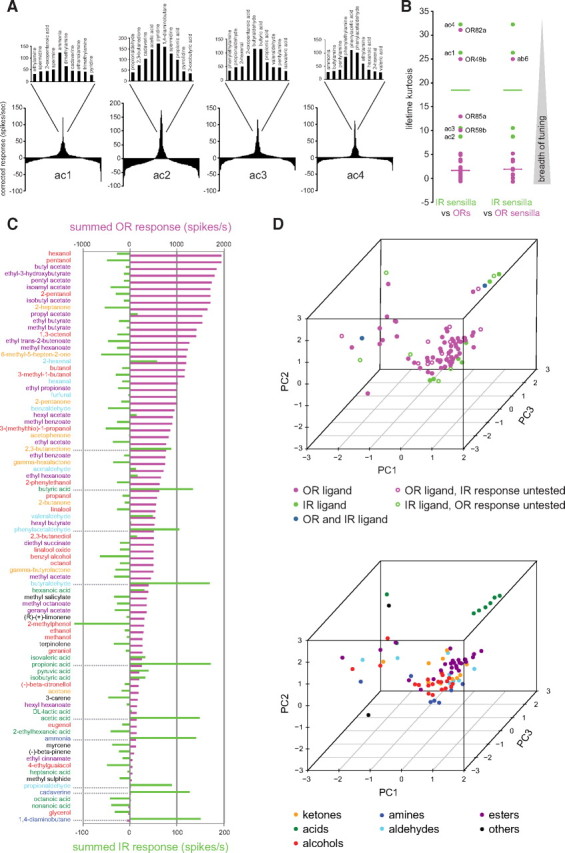
Comparison of the odor tuning properties of IR and OR repertoires. A, Tuning curves of coeloconic sensilla classes. The 168 odorants are displayed along the x-axis according to the magnitude of response they elicit, with the best agonists placed near the center of the distribution and the weakest agonists toward the edges. The top 10 odor ligands for each sensillum class are shown in the magnification of the central portion of the distribution. B, Lifetime kurtosis of the four classes of coeloconic sensilla (green) compared with that of individual ORs (magenta, left) and of the sensilla classes housing OR-expressing neurons (magenta, right), calculated from data in Figure 1 and the study by Hallem and Carlson (2006). Horizontal bars represent the median values. To calculate the response profiles of sensilla housing OR-expressing neurons, we summed the responses of all OR-expressing neurons housed in the same sensillum class (see Materials and Methods). The functional significance, if any, of the more narrowly tuned ORs (lifetime kurtosis values >10) is unknown; the high lifetime kurtosis value for the ab6 sensillum is likely an artifact because this value reflects the tuning of only one of two ORs in this sensillum [OR49b; the other has not been identified (Couto et al., 2005)]. C, Summed responses of OR (magenta) (Hallem and Carlson, 2006) and IR (green) OSNs to a set of odors common to both studies. Odor names are color coded by functional group as in Figure 1. D, PCA of the physicochemical properties of the best OR and IR ligands (see Materials and Methods). Top, Data points are colored according to the receptor family they activate; open circles indicate that the respective odor was present in only the IR or OR dataset. Bottom, Data points are colored according to their functional group. PC1, PC2, and PC3 explain 21, 18, and 14% of the variance, respectively.
To compare the odor response profiles of IR OSNs with those of ORs, we retrieved physiological data available for 24 of 39 antennal ORs (Hallem and Carlson, 2006; Vosshall and Stocker, 2007). We first compared the tuning profiles of these receptor repertoires by computing lifetime kurtosis for the subset of 85 odors common to these two datasets (see Materials and Methods) (Willmore and Tolhurst, 2001) (Fig. 2B). IR sensilla have higher lifetime kurtosis values—reflecting narrower tuning breadth—than the vast majority of ORs (Fig. 2B). This measure is likely to represent a significant underestimate of the higher selectivity of IR OSNs, because it reflects a comparison of IR sensilla, which contain one to three differently tuned neurons (see below), with responses of individual ORs (Hallem et al., 2004). Indeed, computation of lifetime kurtosis for OR sensilla (by summing the responses of all ORs within a common sensillum) further highlighted the distinction in tuning breadth compared with IR sensilla (Fig. 2B).
We next compared the identity of odor ligands recognized by IR and OR neurons through two different approaches. First, we generated a “summed response profile” of the ORs and IRs for the 85 common odor stimuli tested by adding together odor-evoked spike responses for all individual ORs and for all IR sensilla (Fig. 2C). Although absolute summed responses for individual odors are difficult to compare quantitatively because of the larger size of the OR repertoire, this analysis offers a qualitative view of ligand preferences for these different receptors. When ordered by descending OR response, we observed that the most potent ligands for this receptor class were esters, alcohols, and ketones, which evoke no or very low responses in IR sensilla (Fig. 2C). As described above, the best IR ligands were predominantly carboxylic acids and amines; notably, these chemical classes evoke little or no activity in the OR repertoire (Fig. 2C).
Second, we compared the distributions of OR and IR ligands in physicochemical space by using an odor metric of 32 optimized molecular descriptors (Haddad et al., 2008)—such as the aromaticity index and global topological charge—for the agonists of these receptor repertoires. The position of individual odors within this 32-dimensional coordinate system can be dimensionally reduced and visualized by PCA (Fig. 2D). Odors with similar physicochemical properties cluster more closely together than those that are dissimilar, providing an alternative to the International Union of Pure and Applied Chemistry (IUPAC) classification scheme (Fig. 1) (Panico et al., 1993), which might not take into account all relevant properties of odorants (see Materials and Methods). The majority of OR ligands cluster within a single region in the three-dimensional PC space, corresponding to esters and alcohols (Fig. 2D). In contrast, IR agonists are dispersed in this space, indicating that although these receptors recognize only a very small number of ligands, these odors have very diverse physicochemical properties. Similar conclusions were also made by an analysis using a larger set of 1664 molecular descriptors (Haddad et al., 2008) as well as an independent hierarchical cluster analysis of the same data (data not shown). Together, these analyses indicate that OR and IR repertoires have distinct physiological properties: although the former are generally broadly tuned to many esters and alcohols, IRs are narrowly tuned to select, but diverse, acids and amines.
Peripheral and central spatial maps of IR olfactory sensory neurons
To characterize the anatomy and function of individual populations of IR neurons and compare these properties with the organization of the OR sensory pathways, we generated and verified the fidelity of a panel of IR promoter–GAL4 driver transgenes for the antennal-expressed IRs (see Materials and Methods and data not shown) (Benton et al., 2009; Croset et al., 2010). IR-expressing coeloconic OSNs and OR-expressing basiconic and trichoid OSNs are highly intermingled in this peripheral sensory organ (Shanbhag et al., 1999). We visualized the distribution of different coeloconic sensilla classes (ac1–ac4) with a class-specific IR–GAL4-driven nuclear GFP reporter (Fig. 3A). As observed for OR sensilla (de Bruyne et al., 2001), we found that ac1–ac4 each occupy unique and stereotyped, but overlapping, regions of the antenna (Fig. 3A) (Benton et al., 2009).
Figure 3.

Peripheral and central spatial maps of IR olfactory sensory neurons. A, Peripheral distributions of coeloconic sensilla visualized by expression of a nuclear GFP reporter under the control of a sensillum class-specific driver: ac1 (IR92a–GAL4;UAS–nlsGFP); ac2 (IR41a–GAL4;UAS–nlsGFP); ac3 (OR35a–GAL4;UAS–nlsGFP); ac4 (IR84a–GAL4;UAS–nlsGFP). Scale bar, 20 μm. A schematic representation of these distributions is shown on the left. B–D, Antennal lobes expressing a UAS–mCD8:GFP reporter (or UAS–nsyb:GFP for IR25a) under the control of distinct IR–GAL4 driver transgenes, stained for GFP (green) and the general neuropil marker mAb nc82 (magenta). Scale bar, 20 μm. The images are grouped by coeloconic sensilla uniglomerular projections (B), sacculus neuron projections (C), and multiglomerular projection of neurons expressing reporters for IR coreceptors (D). E, Antennal lobe projections of IR neurons, visualized as in B–D, in animals subject to unilateral (left) deafferation 10 d before staining. Scale bar, 20 μm. F, Three-dimensional reconstruction of a female left antennal lobe, orientated from different viewpoints, illustrating segregation of OR (purple) and IR (green) OSN-innervated glomeruli. G, Posterior view of the 3D reconstruction shown in F in which glomeruli innervated by neurons housed in the same antennal structure are highlighted. H, Distribution of antennal lobe glomeruli receiving bilateral (cyan) or exclusively ipsilateral (yellow) sensory input, as determined by the unilateral deafferation experiments shown in E. D, Dorsal; L, lateral; M, medial; V, ventral.
Previous analysis of IR OSNs demonstrated that one (IR76a) projects to one glomerulus, whereas another (IR64a), unusually, innervates two glomeruli (Benton et al., 2009; Ai et al., 2010). To determine the global anatomical organization of this olfactory subsystem, we traced the axons of each individual population of IR-expressing OSN class using a GAL4-responsive membrane-targeted mCD8:GFP reporter. Seven types of coeloconic OSNs, expressing different IRs, were identified that innervate single, morphologically distinct glomeruli (Fig. 3B, Table 1) (Laissue et al., 1999). Although most receptors are expressed in a unique coeloconic sensillum class, IR75d is expressed in OSNs housed in ac1, ac2, and ac4 (Fig. 1). The convergence of IR75d neurons to a single glomerulus suggests that all neurons have the same sensory function, despite their segregated peripheral expression. IR75a is expressed in neurons in two sensilla classes: ac2, in which it appears to be the unique odor-specific receptor, and ac3, in which it is coexpressed with IR75b and IR75c (Fig. 1) (Benton et al., 2009). Our IR75a–GAL4 driver appears to reproduce expression only in ac2 sensilla, because it labels IR75a-positive neurons that do not express IR75b (data not shown); subsequent optical imaging experiments indicated that IR75a/IR75b/IR75c neurons in ac3—for which we do not have a specific driver—are likely to target the distinct DL2 glomerulus (see below).
Table 1.
Pharmacological, molecular, evolutionary, and anatomical properties of the IR olfactory pathways

aSensory channels are ordered by the approximate time of their evolution, as predicted by the conservation across Protostomia of the receptors they express. Data for the sole member of the OR family expressed in coeloconic sensilla, OR35a, are also shown (Yao et al., 2005). Unless otherwise indicated, all data come from this work or from Benton et al. (2009). Presence of putative receptor orthologs in a species is indicated by a shaded cell. Bioinformatic data is taken from Croset et al. (2010) and Smith et al. (2011). Dmel, Drosophila melanogaster; Dgri, Drosophila grimshawi; Agam, Anopheles gambiae; Cqui, Culex quinquefasciatus; Bmor, Bombyx mori; Tcas, Tribolium castaneum; Amel, Apis mellifera; Nvit, Nasonia vitripennis; Apis, Acyrthosiphon pisum; Pbar, Pogonomyrmex barbatus; Phum, Pediculus humanus humanus; Dpul, Daphnia pulex; Isca, Ixodes scapularis. Note that the absence of certain genes in inner insect lineages (e.g., AmelIR40a and NvitIR40a) may reflect either loss of these genes or simply gaps in the available genome sequence.
bData from Endo et al. (2007).
cData from Chou et al. (2010a).
dData from Marin et al. (2002), Wong et al. (2002), Jefferis et al. (2007), and Chiang et al. (2011). PNs arising from anterodorsal and lateral neuroblasts project their axons via the inner antennocerebral tract (iACT), sending collaterals to the mushroom body calyx and terminating in the lateral horn. Axons of PNs arising from the ventral neuroblast project via the middle antennocerebral tract (mACT) directly to the lateral horn, bypassing the mushroom body completely (Fig. 6A).
eIR41a was not detected by RNA in situ hybridization in our previous analysis (Benton et al., 2009), but reannotation of the gene structure (Croset et al., 2010) and subsequent RNA probe redesign revealed coexpression of IR41a with IR76b in ac2 neurons (data not shown).
fIR64a is necessary for responses of DC4 neurons to acid stimuli (free protons) but is not sufficient to confer acid responses when misexpressed (Ai et al., 2010), suggesting the existence of an additional receptor.
gData from Couto et al. (2005), Fishilevich and Vosshall (2005), and Yao et al. (2005).
hAristal neurons have been shown to function as thermosensors (Gallio et al., 2011), but the role of IR21a in mediating physiological responses to temperature changes, if any, is unknown.
iThe coreceptor IR25a, but not IR8a, is robustly expressed in these populations of neurons (Benton et al., 2009), suggesting that it may act as a coreceptor for these sacculus and aristal IRs.
jVP1 was originally described, through cobalt backfill analysis, as one of the five glomeruli receiving unilateral input located between VP2 and VP3 (Stocker et al., 1983). The complete morphology of this glomerulus has not been reported, however, and the inability to visualize this neuropil with nc82 staining has led to subsequent antennal lobe maps either excluding VP1 (Laissue et al., 1999; Couto et al., 2005) or presenting different representations of its position (Chou et al., 2010a; Yu et al., 2010a). The location and unilateral innervation of the column part of the IR40a axonal arbors in the antennal lobe suggests that a subset of these neurons could correspond to the “VP1 neurons” described by Stocker et al. (1983) but that IR40a-expressing OSNs comprise a heterogeneous population with more extensive and novel innervations in the antennal lobe. Although a faithful GAL4 reporter for IR93a is not available, coexpression of endogenous IR93a and IR40a in the sacculus (Benton et al., 2009) allows us to infer the central projections of IR93a neurons.
kAristal neurons were shown to innervate VP2 and VP3 glomeruli by cobalt backfill analysis (Stocker et al., 1983). A GAL4 reporter for GR28b.d is expressed in a subpopulation of aristal neurons and innervates the medial VP2 glomerulus (Thorne and Amrein, 2008). We found that IR21a mRNA is expressed in the complementary set of aristal neurons to this reporter line (data not shown), suggesting that IR21a neurons correspond to those innervating the lateral VP3 glomerulus.
lIR41a projections may correspond to the novel glomerulus described by Endo et al. (2007).
mThe innervation of IR75a/IR75b/IR75c ac3 neurons was deduced by correlation of peripheral electrophysiological and central optical imaging data (Figs. 1, 4) but could not be verified by a specific GAL4 line.
nIpsilateral projections of aristal neurons were demonstrated in cobalt backfill analysis (Stocker et al., 1983).
oSeveral analyses divide the DL2 glomerulus morphologically into dorsal (d) and ventral (v) compartments (Laissue et al., 1999), although their functional distinction, if any, is unknown. ? and — indicate when data are unavailable or inapplicable, respectively.
Two receptors, IR40a and IR64a, are expressed in neurons that extend dendrites to the sacculus, a multichamber internal pocket with putative functions in chemosensation, hygrosensation, and thermosensation (Shanbhag et al., 1995). As shown previously (Ai et al., 2010), IR64a neurons project to two glomeruli, DC4 and DP1m (Fig. 3C). IR40a neurons have a complex innervation pattern, consisting of a dorsoventral “column” in the center of the antennal lobe and a mediolateral “arm” at the posterior (Fig. 3C). IR40a OSNs also very weakly express IR93a (Benton et al., 2009), but we did not obtain a faithful reporter for this gene (data not shown). Similarly, our attempts to construct a functional reporter for IR21a, which is expressed in neurons in the arista and sacculus (Benton et al., 2009), were unsuccessful (data not shown). However, these cells may correspond to those labeled by an enhancer trap near the brivido1 gene [encoding a transient receptor potential (TRP) channel] that—consistent with previous backfill studies (Stocker et al., 1983)—project to the VP3 glomerulus at the posterior of the antennal lobe (also referred to as the proximal antennal protocerebrum) (Gallio et al., 2011). Finally, the neurons expressing two IR coreceptors, IR8a and IR25a, as well as IR76b, which is expressed in one cell in each coeloconic sensillum class (Fig. 1), innervate multiple glomeruli (Fig. 3D), consistent with their coexpression with more selectively expressed IRs in multiple classes of antennal OSNs (Benton et al., 2009; Abuin et al., 2011).
Like OR OSNs, the expression and innervation pattern of IR OSNs were comparable in both sexes (data not shown), and all were bilaterally symmetric. In contrast, although all OR OSNs have bilateral projections (i.e., neurons from one antenna project to both left and right antennal lobes) (Vosshall et al., 2000; Couto et al., 2005), we identified—through a series of unilateral antennal deafferation experiments—a subset of IR OSNs that exclusively project ipsilaterally (Fig. 3E). These include IR75d (VL1), consistent with previous cobalt backfill analyses (Stocker et al., 1983), and the IR40a axons innervating the column but not most of the arm (Fig. 3E). Aristal neurons are also strictly ipsilateral (Stocker et al., 1983).
Knowledge of these IR projections, together with previous maps of OR innervations (Couto et al., 2005; Fishilevich and Vosshall, 2005), essentially complete the molecular atlas of antennal lobe sensory input (Fig. 3F, Table 1). Importantly, we observed no convergence of OR and IR neurons on common glomeruli. Moreover, in contrast to the intermingling of OSN somata in the antenna, OR and IR glomeruli are spatially segregated to anterior and posterior zones in the antennal lobe, respectively (Fig. 3F). IR OSNs housed in the same sensillum class project to fairly dispersed glomeruli in the antennal lobe (Fig. 3G). Sacculus and aristal neuron projections appear, however, to cluster within a large posterior–central zone (Fig. 3G). Glomeruli receiving exclusively ipsilateral input, including the V glomerulus innervated by GR21a/GR63a neurons (Stocker et al., 1983; Scott et al., 2001; Couto et al., 2005; Jones et al., 2007; Kwon et al., 2007), are also grouped together in a posterior–ventral portion of the lobe (Fig. 3H). Notably, the set of IR glomeruli in the Drosophila antennal lobe may represent a homologous compartment to a putatively conserved and segregated cluster of glomeruli present in the antennal lobes of honeybees (T4 glomeruli), cockroaches (T10 glomeruli), and ants (T7 glomeruli) (Zube et al., 2008; Nishino et al., 2009; Galizia and Rössler, 2010; Watanabe et al., 2010).
Definition of IR neuron odor specificity
To assign odor ligands identified in our electrophysiological screen to specific IR OSNs, we performed a series of functional imaging experiments in the antennal lobe (Fig. 4). We expressed the genetically encoded fluorescent calcium sensor GCaMP1.6 (Ohkura et al., 2005) in defined subpopulations of IR OSNs using IR–GAL4 drivers. For each IR population, we screened the subset of odors shown to evoke electrophysiological activity in the corresponding sensillum class in the antenna (Figs. 1, 2A).
Figure 4.

Definition of IR neuron odor specificity. Odor-evoked calcium responses in axon termini in the antennal lobe (AL) of individual populations of IR OSNs were visualized with UAS–GCaMP1.6 expressed under the control of the indicated IR–GAL4 lines. IR OSNs are organized by coeloconic sensilla class (ac1–ac4). The schematic at the top left shows the view of the antennal lobes in the in vivo preparation. For each IR neuron population, a raw fluorescence image shows the position in the antennal lobe of the corresponding glomerulus. The responses to the best ligands (color coded by chemical class as in Fig. 1) of each sensillar class, together with solvent controls, are shown as heat maps. Each box represents the relative changes in fluorescence measured in seven flies during 10 s recordings. The black line under the boxes indicates the stimulation time (1 s). The range of the color scale was adjusted for each OSN type and is indicated within the scale bar, with the vertical white or black line showing the position of zero fluorescence change. Responses in the DL2 glomerulus (red oval), presumed to be innervated by ac3 IR75a/IR75b/IR75c neurons, were visualized using the IR8a–GAL4 driver. For ammonia responses in ac1 IR92a neurons and pyrrolidine responses in ac2 IR41a neurons, the standard 1% stimulus concentration appeared to cause sensory adaption, and the strongest odor-evoked responses in these cases was observed at 0.1 and 0.01% stimulus concentrations, respectively (data not shown). Certain IR75d OSN response data are replicated across ac1, ac2, and ac4—in which this receptor is expressed—for ease of comparison of different neural responses within sensillum types.
Overall, we found excellent correspondence between odor-evoked peripheral electrophysiological responses in OSN dendrites (Figs. 1, 2A) and calcium responses in axon termini (Fig. 4). In ac1, IR31a neurons responded to 2-oxopentanoic acid, whereas IR92a neurons were stimulated, albeit somewhat variably, by ammonia, pyrrolidine, and dimethylamine. IR75d neurons, which are common to ac1, ac2, and ac4 sensilla, responded to pyrrolidine, consistent with responses to this odor in all three of these sensillum classes (Fig. 1). In ac2, IR41a neurons were activated by all amine ligands (pyridine, 1,4-diaminobutane, cadaverine, spermidine, and pyrrolidine). In contrast, IR75a neurons responded robustly to the acid ligands (acetic acid and propionic acid) as well as to 2,3-butanedione.
We imaged the activity of ac3 IR75a/IR75b/IR75c neurons, for which we lack a GAL4 line, using the driver line for IR8a, which is an essential coreceptor in these neurons (Abuin et al., 2011). Among the ∼10 glomeruli expressing GCaMP, we identified one displaying physiological responsiveness that is distinct from ac2 IR75a (DP1l) neurons and concordant with peripheral responses of the ac3 neuron, with strong activation by propionic acid, butyric acid, and butyraldehyde (Fig. 4). The position of this glomerulus suggested that this corresponds to DL2 (Laissue et al., 1999), although unequivocal morphological demarcation from its immediate neighbors was not possible. Finally, in ac4, we observed responses of IR76a neurons to several amines (including pyrrolidine and phenylethylamine) and responses of IR84a neurons to phenylacetic acid and phenylacetaldehyde (Fig. 4), consistent with our previous functional analysis of this receptor (Benton et al., 2009; Abuin et al., 2011).
We confirmed these ligand/OSN assignments by targeted cell ablation, in which we used IR drivers to express the cell-autonomous diphtheria toxin in select IR populations and examined the corresponding loss of peripheral electrophysiological responsiveness (data not shown). The only exception was observed in ac1 sensilla in flies expressing diphtheria toxin under the control of IR92a–GAL4, in which responses to ammonia persisted (data not shown), suggesting either incomplete ablation of these neurons or the existence of an unidentified ammonia-responsive cell in this sensillum.
For sacculus IR OSNs, which are inaccessible for electrophysiological recordings at the periphery, we confirmed that IR64a neurons comprise two physiologically distinct populations: one is responsive to many organic acids and other odors and projects to DP1m, and the other is selective for free protons and projects to DC4 (Ai et al., 2010) (data not shown). Although several other IR neurons respond to carboxylic acids (Figs. 1, 4), only IR64a DC4 neurons display strong responses to the inorganic acid hydrogen chloride, confirming their special role as an olfactory proton sensor (Fig. 1) (Ai et al., 2010). Stimuli for IR40a or the aristal-expressed IR21a are unknown. Recent physiological experiments have found that aristal neurons respond to either increases or decreases in temperature (Gallio et al., 2011); cooling responses, at least, depend on TRP channels (Gallio et al., 2011), and the contribution of IR21a to thermosensation, if any, is unclear.
Functional and developmental organization of IR sensory input
With knowledge of odor ligands for nearly all IR OSN populations, we generated a functional map of IR sensory representation in the antennal lobe (Fig. 5A). This map revealed a notable chemotopic organization of this olfactory subsystem, in which acid-responsive glomeruli were clustered in the dorsal–posterior region, whereas amine-responsive glomeruli were located more ventrally (Fig. 5B). Furthermore, the dorsal group of IR glomeruli appeared to correspond closely with the subset innervated by neurons strongly expressing the IR8a coreceptor (Fig. 3D). Indeed, genetic analysis of IR8a mutants has shown that IR64a, IR75a, and IR84a acid-sensing receptors depend on this IR8a for their localization and/or function (Abuin et al., 2011). We additionally confirmed that IR31a neuron responses to the newly identified ligand, 2-oxopentanoic acid, are also dependent on IR8a (data not shown). Thus, IR8a appears to be a dedicated coreceptor for acid-sensitive IRs, and the corresponding OSNs project to a cluster of glomeruli in the antennal lobe (Fig. 5B,C).
Figure 5.

Evolutionary, developmental, and functional organization of IR sensory input. A, A functional map of the antennal lobe summarizing the principal ligands and receptors corresponding to each IR glomerulus. B, Distribution of target glomeruli receiving input from acid-sensitive (red) and amine-sensitive (blue) OSNs. Dark gray glomeruli, in this and subsequent panels, represent IR glomeruli for which data is unavailable; light gray glomeruli correspond to those innervated by OR-expressing OSNs. C, Distribution of target glomeruli receiving input from IR8a-dependent (red) and IR25a-dependent (blue) OSNs. The innervations of IR40a neurons are shown in light blue because these neurons robustly coexpress IR25a, but not IR8a, although their function and coreceptor dependency is unknown. D, Distribution of target glomeruli receiving input from OSNs in which Notch signaling is inactive (Notch OFF) (red) or active (Notch ON) (blue), based on data from Endo et al. (2007). E, Distribution of target glomeruli receiving input from OSNs in which a Patched (magenta) or Engrailed (green) reporter is active, representing proteins that receive or regulate Hedgehog signals, respectively, based on data from Chou et al. (2010a). F, Phylogenetic tree of antennal IRs and selected iGluRs. The sequences were aligned with ProbCons (Do et al., 2005). The tree was built using PhyML (Guindon and Gascuel, 2003) based on a manually cleaned alignment with 1000 bootstrap replicates. Filled circles indicate a bootstrap support of >90, open circles indicate a bootstrap support between 70 and 90. iTOL (Letunic and Bork, 2007) was used to view and graphically edit the tree. The phylogeny was rooted using the iGluRs. The scale bar represents the expected number of substitutions per site. G, Scatter plot of glomerular separation (distance between geometric centers) versus molecular distance (a measure of primary sequence divergence) for all 36 pairwise combinations of uniglomerular IRs. The sequences were aligned using ProbCons (probabilistic consistency), and the JTT (Jones, Taylor, and Thornton) method as implemented in MEGA (Tamura et al., 2007) was used to calculate the pairwise molecular distances. D, Dorsal; L, lateral; M, medial; V, ventral.
Conversely, we showed previously that the second coreceptor, IR25a, is essential for 1,4-diaminobutane responses in ac2 (here shown to correspond to IR41a neurons) and phenylethylamine responses of IR76a neurons in ac4 (Abuin et al., 2011). Moreover, we also established that IR75d neuron pyrrolidine responses in ac4 are also IR25a dependent (data not shown). IR25a thus may represent a universal coreceptor for amine-sensing IRs, possibly in collaboration with IR76b, which is coexpressed in all of these IR subpopulations (Benton et al., 2009; Abuin et al., 2011) (Fig. 1). The corresponding IR25a-dependent neurons target a ventral group of glomeruli within the antennal lobe (Fig. 5C).
In addition to the spatial and functional dichotomy of these two groups of IR neurons, we noticed that they are also distinguished developmentally by their requirement for the activity of Notch signaling. The Notch pathway is required to differentiate the receptor expression profile and glomerular projections of OSNs derived from the two daughter cells of a common precursor (Endo et al., 2007); this occurs through a process of lateral inhibition, in which one daughter acquires a high level of Notch activity and thereby suppresses Notch activity in its sibling (Rodrigues and Hummel, 2008). We observed that, when data is available, all IR25a-dependent OSNs (four of four populations) correspond to those deriving from a daughter cell with high Notch activity (“Notch ON”), whereas all IR8a-dependent OSNs (five of five populations) derive from the daughter with low Notch activity (“Notch OFF”) (Fig. 5D, Table 1) (Endo et al., 2007). Thus, within IR OSNs, Notch signaling may serve to distinguish acid-sensing/IR8a-dependent and amine-sensing/IR25a-dependent OSNs in several different lineages. The Notch-dependent functional diversification of IR OSNs may provide a simple developmental mechanism to couple pharmacologically distinct OSNs within individual sensilla and so offer a potential means to increase the dynamic range of individual neurons (Vermeulen and Rospars, 2004). Indeed, agonists for one neuron in a sensillum often antagonize activity in another [e.g., in ac4, amine ligands for IR76a/IR76b strongly reduce calcium signals in IR84a neurons (Fig. 4)]. Such an “opponent signaling” strategy may also enhance odor discrimination (French et al., 2011).
Other mechanisms must presumably exist to control the selection and glomerular targeting of the precise odor-specific IR in each sensillar class. These may include Hedgehog signaling, which is required in a mosaic (but stereotyped) set of glomeruli that do not correlate with the acid/IR8a amine/IR25a groups (Fig. 5E) (Chou et al., 2010a).
Evolutionary insights into the functional and anatomical diversification of the IR olfactory subsystem
In contrast to OR repertoires, which are highly divergent across even phylogenetically close families of insects, such as fruit flies and mosquitoes (Hill et al., 2002), the deeper conservation of IRs offers a possibility to consider how the stepwise expansion of this receptor repertoire during evolution is linked to the functional and anatomical diversification of this olfactory subsystem (Table 1). We first mapped the defined ligand specificities onto a phylogenetic tree of antennal IRs and iGluRs (Fig. 5F) (Croset et al., 2010). This revealed an intimate relationship between receptor evolution and function: IR8a/IR25a coreceptor, acid-sensing, and amine-sensing (except IR75d) IRs belong to three distinct clades (Fig. 5F), suggestive of their derivation from ancestral IRs that already exhibited this functional specialization.
Although the molecular basis of IR ligand specificity remains essentially uncharacterized, we previously demonstrated that IR84a ligand responses depend on an arginine residue, R317, which aligns with the conserved arginine in iGluR ligand-binding domains that contacts the α-carboxyl group of glutamate (Armstrong et al., 1998; Benton et al., 2009; Abuin et al., 2011). Notably, this arginine is conserved in all acid-sensing IRs (IR31a, IR64a, IR75a, IR75b, IR75c, IR84a) but divergent in the amine-sensing IRs (IR41a, IR76a, IR92a) (Benton et al., 2009). This observation hints at a conserved ligand binding mechanism between iGluRs and acid-sensing IRs in which this arginine conjugates the carboxyl group of the ligands of both of these receptor types.
Because the evolution of a new odor-specific IR gene is necessarily ultimately coupled to the evolution of a new glomerulus, we asked whether the extant spatial organization of IR glomeruli reflects the order in which they have evolved. We calculated the distance between the geometric centers of all pairs of IR glomeruli in the antennal lobe and plotted these values against a measure of sequence divergence between the corresponding pairs of odor-specific IRs (receptors in multiglomerular neuron classes—IR40a, IR64a, and IR coreceptors—were excluded from this analysis). Importantly, we observed a positive correlation between these properties (r = 0.62; Mantel test, p = 0.005, 10,000 permutations), that is, neurons expressing more similar receptors—which are presumed to arise from more recent common ancestral IR genes—tend to project to more closely positioned glomeruli (Fig. 5G). A similar relationship has been described for glomeruli innervated by basiconic sensilla ORs (Couto et al., 2005). These observations suggest a model in which new glomeruli arise from the segregation of axons of OSNs expressing recently duplicated receptor genes within a “parental” glomerulus (discussed in Ramdya and Benton, 2010).
Anatomy of processing and higher-order representations of IR and OR olfactory pathways
OSNs synapse with both LNs, whose processes are restricted to the antennal lobe, and PNs, which connect the primary olfactory center with the mushroom body (MB) and lateral horn (LH) of the protocerebrum (Fig. 6A) (Masse et al., 2009). Recent large-scale anatomical analyses of LNs and PNs (Wong et al., 2002; Jefferis et al., 2007; Lin et al., 2007; Chou et al., 2010b; Yu et al., 2010a; Chiang et al., 2011) allowed us to examine the organization of these elements of the olfactory circuits receiving input from IR-expressing OSNs and compare this with OR-dependent olfactory circuitry.
Figure 6.
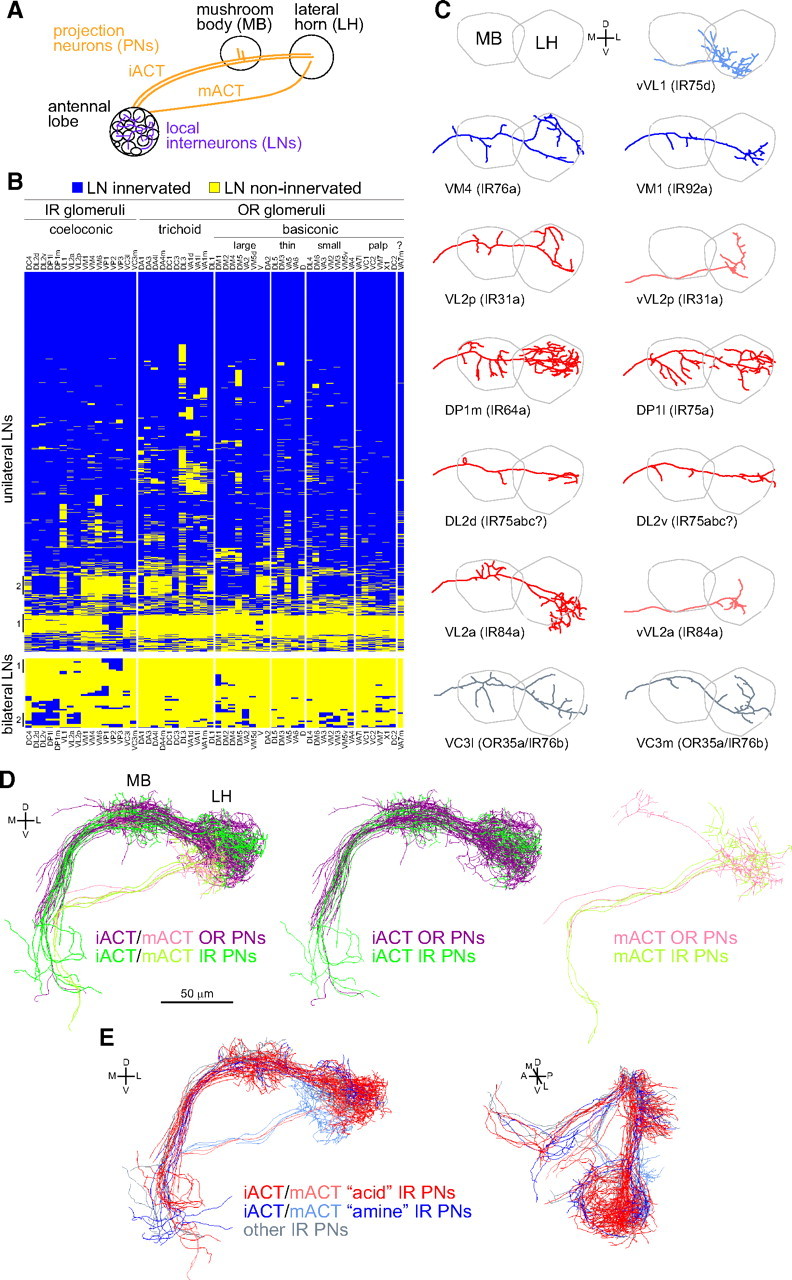
Neuroanatomy of processing and higher-order representations of IR-dependent odor stimuli. A, A schematic of higher olfactory brain center anatomy. PNs take one of two tracts to the higher centers, the inner antennocerebral tract (iACT) or mACT, depending on whether they derive from the anterodorsal/lateral neuroblasts or ventral neuroblast, respectively. B, Glomerular innervation patterns of 1489 singly labeled unilateral LNs (top) or 43 singly labeled bilateral LNs (bottom) organized by hierarchical clustering, using data from Chou et al. (2010b). Each row represents the innervation pattern of a single LN (blue, innervated; yellow, non-innervated). The columns represent 54 glomeruli, arranged by sensillar class to broadly demarcate the IR and OR olfactory subsystems. VA7m (marked with a “?”) is innervated by a molecularly undefined population of OSNs. Vertical lines to the left of the table mark subsets of LNs with notable glomerular innervations (see Results). Cluster analysis, using complete linkage and Euclidean distances, was performed using R software (www.r-project.org). C, Plots of single representative traced neurons, after registration, for 13 available PN classes innervating IR glomeruli. PN classes are ordered by putative functional classes (defined by corresponding IR OSN inputs) and then by IR gene name. VL2a and VL2p are innervated by PNs derived from both lateral and ventral neuroblasts that follow the iACT and mACT tracts, respectively; the “v” suffix denotes the latter type. PNs are colored according to the classes described in E. Raw image data for different PN classes are from the following sources: VL2a (Wong et al., 2002); vVL1, VL2p, VM1 (Jefferis et al., 2007); DL2d, DL2v, DP1l, VC3l, VC3m, vVL2a, vVL2p, VM1, VM4 (Chiang et al., 2011). D, 3D renderings of tracings for all registered OR (purple/pink) and IR (dark/light green) PN classes. Separate renderings for iACT and mACT PNs (in paler colors) are shown to the right. Data for OR PNs is adapted from Jefferis et al. (2007). E, 3D renderings of tracings for all registered IR PNs innervating IR8a-dependent/acid-responsive glomeruli (red: IR31a/VL2p, IR64a/DP1m, IR75a/DP1l, IR75abc/DL2, IR84a/VL2a), IR25a-dependent/amine-responsive glomeruli (blue: IR76b/VM4, IR75d/VL1, IR92a/VM1), and PNs innervating other IR-positive glomeruli (gray: IR76b/OR35a/VC3). Paler red and blue colors are used for mACT neurons. D, Dorsal; L, lateral; M, medial; V, ventral.
A minimum of 100 ipsilaterally and 100 bilaterally projecting LNs are estimated to innervate each antennal lobe (Chou et al., 2010b). The probable majority of these express the inhibitory neurotransmitter GABA, but a significant fraction are likely to be excitatory (either glutamatergic or cholinergic) (Olsen et al., 2007; Shang et al., 2007; Grosjean et al., 2008; Chou et al., 2010b). Detailed morphological analysis of individual LNs reveals considerable diversity in their glomerular innervation patterns (Chou et al., 2010b; Seki et al., 2010). We asked whether any LNs selectively discriminate between OR and IR glomeruli by repeating the hierarchical cluster analysis of glomerular innervation patterns for the set of 1489 single-labeled unilateral LNs and 43 single-labeled bilateral LNs (Chou et al., 2010b) and segregating these by OR and IR glomerular classes (Fig. 6B). The vast majority of LNs display broad innervation of many glomeruli in the antennal lobe and do not discriminate between the OR and IR glomerular domains. However, subsets of unilateral and bilateral LNs (labeled “1” in Fig. 6B) are almost exclusively restricted to the posteriormost glomeruli (VP1–VP3), which receive input from sacculus and aristal sensory neurons. Furthermore, we also note the existence of both unilateral and bilateral LNs that innervate known acid-sensing (DL2, DP1m, DP1l, VL2a, VL2p) but not amine-sensing (VL1, VM1, VM4) IR glomeruli (labeled “2” in Fig. 6B), suggesting the possibility for selective modulation within this functional class of glomeruli. However, these LNs also innervate many OR glomeruli. We conclude that, although OR and IR sensory inputs are spatially segregated in the antennal lobe (Fig. 3F), extensive lateral inhibitory and excitatory interactions mediated by LNs are likely to occur between OR and IR glomeruli.
Most PN dendrites, like OSN axons, innervate single glomeruli (Vosshall and Stocker, 2007; Masse et al., 2009). The axons of PNs innervating the same glomerulus (typically three to five neurons) display stereotyped innervations of the LH and/or MB (Marin et al., 2002; Wong et al., 2002; Jefferis et al., 2007). The map of odor representation in higher brain centers formed by PN axons receiving input from OR glomeruli is characterized by significant spatial convergence and divergence, which may reflect integration and segregation of olfactory information detected by distinct ORs (Marin et al., 2002; Wong et al., 2002). For example, within the LH, PN partners of OSNs expressing fruit odor-responsive ORs have clustered axonal projections, and these segregate from PNs receiving input from candidate pheromone-responsive OSNs (Jefferis et al., 2007). Optical imaging of PN responses suggest that OSN responses are generally faithfully transmitted to these second-order neurons (Ng et al., 2002; Wang et al., 2003), although electrophysiological analyses indicate that significant transformations occur in at least some OSN–PN synapses to increase reliability and separability of odor-evoked PN activity patterns (Wilson et al., 2004; Bhandawat et al., 2007).
Having defined novel IR-dependent sensory inputs to previously orphan glomeruli, we analyzed the spatial organization of their partner PNs in the MB and LH. We integrated data from Wong et al. (2002), Jefferis et al. (2007), and Chiang et al. (2011), which together allowed us to map 13 PN classes innervating 9 glomeruli that receive input from 9 of 13 IR-positive OSN classes (Fig. 6C), permitting broad comparison of their properties with PNs receiving input from OR glomeruli (Fig. 6D). Several polyglomerular PN classes that exclusively innervate IR glomeruli have also been identified (poly[L1–L4]) (Yu et al., 2010a), but the role of such neurons in olfactory processing is unknown, and we do not consider them further here.
Like OR PNs, IR PNs originating from the same glomerulus had very similar axon projection patterns in the LH (Wong et al., 2002; Jefferis et al., 2007) (data not shown), suggesting that they also provide anatomically stereotyped input to this olfactory center. Such morphological stereotypy may also exist in the MB but is harder to visualize (Jefferis et al., 2007). Importantly, axonal termini of IR and OR PNs are extensively interdigitated within both the MB and the LH (Fig. 6D). Thus, although IR- and OR-dependent sensory signals are initially physically segregated within the antennal lobe (Fig. 3F), this information is likely to be reintegrated in higher olfactory centers. We note, however, that some regions of the LH are spared by the IR PNs that we mapped, in particular the most dorsal part of this center.
We next asked whether functionally related subgroups of IR PNs might target discrete regions of the LH, revealing additional topography in this structure. We therefore examined the relative projection patterns of PNs connected to acid-sensing/IR8a-dependent and amine-sensing/IR25a-dependent glomeruli (Fig. 6E). Although there are too few PN classes for a formal statistical analysis, the terminals of amine-sensing IR PNs are primarily restricted to a posterior ventral region of the lateral horn. If this organization is confirmed, it may represent functional specialization of this region, or perhaps a relic of development or evolution.
We also note that several IR PN classes (vVL2a, vVL2p, vVL1) derive from the ventral neuroblast and therefore follow the medial antennocerebral axon tract (mACT) that bypasses the MB and targets directly the LH (Fig. 6A,C, Table 1). The pursuit of this tract may be behaviorally significant for the olfactory information these pathways transduce, because the MB is a locus of olfactory learning whereas the LH is generally considered to mediate innate odor-evoked behaviors (Heisenberg, 2003). Indeed, the only other known uniglomerular vPN classes, vDA1 and vVA1lm, are those implicated in regulation of the innate male courtship ritual (Stockinger et al., 2005; Jefferis et al., 2007). Thus, we speculate that these three IR circuits also control innate olfactory behaviors. VL2a and VL2p are also innervated by PNs that follow the inner antennocerebral tract and project to both the MB and LH, indicating that stimuli detected by these olfactory channels have two distinct neural representations in higher brain centers (Fig. 6C).
Behavioral integration of odor stimuli by OR and IR sensory channels
We investigated the contribution of IR circuits to odor-evoked behaviors by screening for innate responses of flies to IR odor ligands in a T-maze choice assay (Helfand and Carlson, 1989). To focus on responses potentially mediated by IR sensory input, we studied the behavior of flies mutant for the OR coreceptor Orco (formerly called OR83b), which lack the function of the entire OR repertoire (Larsson et al., 2004) and are often described as anosmic. These flies displayed responses to a number of IR ligands that varied both in magnitude and valence: for example, carboxylic acids evoked different degrees of behavioral aversion, whereas ammonia was moderately attractive (Fig. 7A). Thus, knowledge of ligands for the IR olfactory subsystem has allowed us to uncover significant olfactory capacity of animals that are devoid of OR sensory input. We note that the valence and magnitude of behavioral responses observed are very likely to depend on the olfactory assay and the animal's internal state; acids, for example, can be attractive in other experimental contexts (Becher et al., 2010; Ibba et al., 2010).
Figure 7.
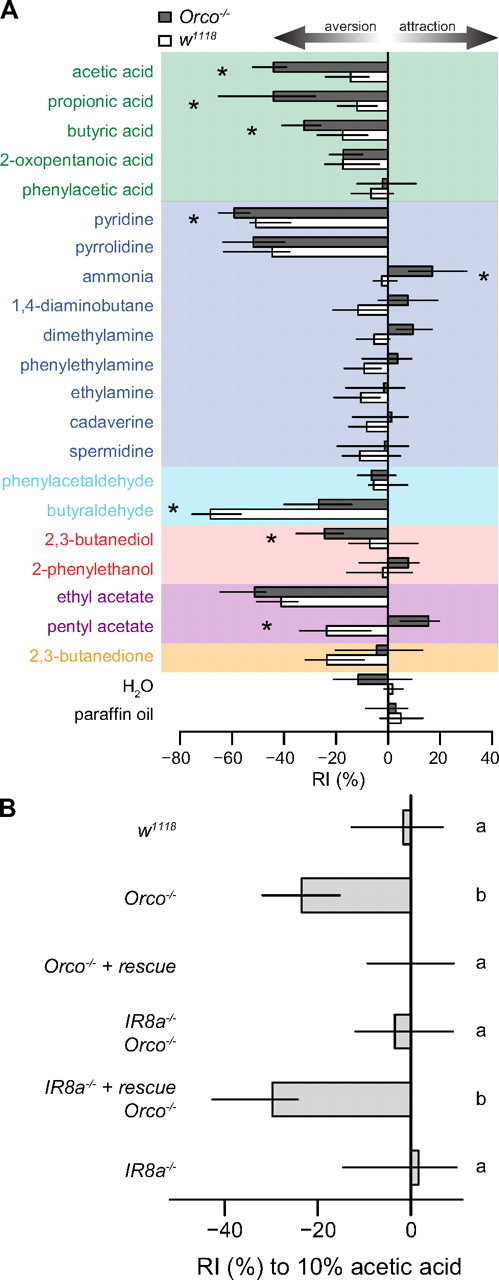
Behavioral integration of odor stimuli by OR and IR sensory channels. A, Response indices (RIs) of Orco1 mutant and wild-type (w1118) flies to a set of IR and OR odor ligands in a T-maze choice assay (see Materials and Methods). Bars indicate the median of 7–12 independent experiments and the first and third quartiles of the distribution. Asterisks indicate that the comparison between the two genotypes for a given odor resulted in an adjusted p value of <0.05 (Mann–Whitney U test, p values corrected with the Benjamini–Hochberg method for multiple comparisons). Ligands are colored according to their chemical class as in Figure 1. B, Response indices to 10% acetic acid in the T-maze of flies of the following genotypes (top to bottom): (i) w118, (ii) ORCO1, (iii) ORCO1, ORCOrescue, (iv) IR8a1; ORCO1, (v) IR8a1, IR8arescue; ORCO1 and (vi) IR8a1. Bars labeled with different letters are significantly different (adjusted p < 0.05, all pairwise comparisons with Mann–Whitney U test corrected with the Benjamini–Hochberg method for multiple comparisons, n = 15–16).
When odor-evoked responses of Orco mutants were compared with those of wild-type flies, we observed varying types of modifications to these behaviors (Fig. 7A). Some responses, such as those to pyrrolidine, were unchanged, suggesting no contribution of OR circuits to detection of this odor. In contrast, aversion to butyraldehyde in wild-type flies was higher than in Orco mutants, indicating a contribution of Orco to avoidance of this odor; we note that butyraldehyde weakly activates a number of different ORs (Hallem and Carlson, 2006; Galizia et al., 2010).
Surprisingly, avoidance responses to carboxylic acids were consistently smaller in control flies than in Orco mutants (Fig. 7A), suggesting that OR sensory channels may have antagonistic effects on acid avoidance behaviors. We explored this interaction by first confirming that the increased avoidance of acetic acid by Orco mutants is attributable to loss of function of OR sensory neurons, by restoring wild-type behavior with an Orco rescue transgene (Fig. 7B). To determine whether the avoidance behavior of Orco mutants was IR dependent, we used mutants of the coreceptor for all acid-sensing IRs, IR8a. Indeed, Orco,IR8a double mutants no longer avoided acetic acid, whereas avoidance was restored when we introduced an IR8a rescue transgene in this background (Fig. 7B). The role for IR circuits in acid avoidance may in large part be ascribed to IR64a, which comprises a subunit of a dedicated olfactory proton sensor (Ai et al., 2010), although other carboxylic acid-sensing IRs do exist (Figs. 1, 4).
These results confirm the role of IR8a-dependent pathways in mediating acetic acid avoidance but raise the question of how OR-dependent pathways act to suppress this avoidance in wild-type animals. One possibility is that a population of OR-expressing neurons mediates attraction to acetic acid, which may be integrated with aversive signals from IR pathways in higher centers to produce a behavioral decision. However, we and others have not found robust responses of any OR neurons to acetic acid (Hallem and Carlson, 2006; Galizia et al., 2010) (data not shown). Furthermore, IR8a mutant animals—which have intact OR sensory input—do not show attraction to acetic acid, as would be predicted by this hypothesis (Fig. 7B). We therefore currently favor a model in which transmission of acid-evoked IR signals are suppressed by basal, Orco-dependent activity of OR OSNs, perhaps through the LN network that bridges these olfactory subsystems in the antennal lobe (Fig. 6B).
Future studies using the genetic reporters for specific IR neuron populations will permit exploration of their individual and combined contributions to olfactory behavior and how the information they transmit is integrated with OR-dependent pathways. Moreover, distinct behavioral paradigms may reveal other functions of IR circuits, for example, those controlling social behaviors.
Discussion
The nose is a dynamically evolving sensory system that adapts to a constantly changing external world of odor stimuli. As such, olfactory systems provide attractive models to understand how novel neuronal pathways emerge. Although the timing of the origin of animal olfactory systems is unknown—and might reflect more than one independent evolutionary event (Strausfeld and Hildebrand, 1999; Benton, 2006) —we may reasonably assume that insect IR and OR olfactory circuits derive from a common chemosensory system in the ancestral insect. What insights can our physiological and anatomical analyses of these extant olfactory sensory pathways in Drosophila offer into how and why their spectacular functional diversity has arisen?
Ontogeny and phylogeny in olfactory system neuroarchitecture
The broad protostome conservation of IRs contrasts with the restriction of ORs to insect genomes and suggests that IRs were the first olfactory receptor repertoire in insects (Robertson et al., 2003; Croset et al., 2010). This hypothesis is further supported by developmental properties of these olfactory subsystems: IR (coeloconic + sacculus + arista) and OR (basiconic + trichoid) sensory structures in the antenna are specified independently by the related basic helix–loop–helix transcription factors Atonal and Amos, respectively (Gupta and Rodrigues, 1997; Goulding et al., 2000; zur Lage et al., 2003; Benton et al., 2009). Atonal is probably the ancestral olfactory proneural gene, because it has functional orthologs in mammals (Wang et al., 2002), whereas Amos appears to be the product of an insect-specific duplication event (Goulding et al., 2000; Maung and Jarman, 2007). Thus, the order of evolution of these upstream developmental regulators correlates with that of the sensory receptor repertoires they ultimately induce. The developmental timing of IR and OR circuit specification is also staggered: Atonal-expressing sensory organ precursors differentiate before those expressing Amos (zur Lage et al., 2003). This sequence may be important because Atonal (IR-expressing) OSNs are thought to pioneer glomerular formation in the adult antennal lobe (Jhaveri and Rodrigues, 2002). Although IRs, like ORs, are not themselves required for OSN axon guidance (Ai et al., 2010) (Y.G. and R.B., unpublished observations), the development of the peripheral olfactory system may be an example of “ontogeny recapitulating phylogeny” (Gould, 1977), that is, where more recently evolved structures—in this case, OR olfactory pathways—appear later in development. Such developmental properties may also exist in central olfactory circuit elements: PNs are born in a strictly defined order during embryonic and larval development (Jefferis et al., 2001; Yu et al., 2010a), and among the six PN classes innervating IR glomeruli for which birth time is known, five are specified in the earliest steps of this lineage in the embryo before the vast majority of OR PN classes (Yu et al., 2010a). The functional significance of the observed spatial separation of OR and IR olfactory subsystems, as well as the ipsilateral/bilateral innervation patterns are unknown; it is possible that these properties are simply a consequence of the developmental origins of the antennal lobe.
The “two noses” of the fly
What selective advantages have insects gained from evolving two independent olfactory subsystems? Although many anatomical properties of the circuits are conserved in these two subsystems, IR and OR sensory channels are most clearly distinguished by their ligand-tuning properties. The preferential recognition of water-soluble, hydrophilic acids and amines by IRs is consistent with these classes of molecules being the predominant chemical signals detected by the aquatic ancestor of protostomes, and many are metabolic derivatives of amino acids that are common chemosensory signals for extant aquatic animals (Derby and Sorensen, 2008). The tuning of IRs to volatile chemicals bearing amine and carboxyl side chains probably reflects the derivation of these chemosensory receptors from amino acid-binding iGluRs (Croset et al., 2010).
The distinction in ligand preferences of OR and IR repertoires is likely to be conserved in other insect species. For example, the OR repertoire of the malaria mosquito, Anopheles gambiae, is sensitive to many different chemical classes of odors but not carboxylic acids or amines (Carey et al., 2010). Mosquito antennae bear sensilla tuned to acids and amines (Qiu et al., 2006), and we suggest that these house neurons expressing mosquito IR orthologs (Croset et al., 2010; Liu et al., 2010). Although carboxylic acids and amines are critical for mammalian host-seeking behavior in mosquitoes (Smallegange et al., 2005), their ecological significance in Drosophila is less clear. Acids and amines may, for example, signal over-fermentation (Ai et al., 2010) or sources of proteins, respectively, in the food substrates of these flies. Alternatively, these odors—in contrast to their effect on mosquitoes—may repel insects from non-useful (and potentially dangerous) mammals (Hill et al., 2010).
ORs appear to have derived from the gustatory receptor family of contact chemosensors (Robertson et al., 2003), which have been identified in insects as well as in aquatic arthropods (Peñalva-Arana et al., 2009). One possible driving force for the evolution of this second family of olfactory receptors is the evolution of terrestrial insects from aquatic arthropod ancestors 400–450 million years ago (Robertson et al., 2003; Engel and Grimaldi, 2004). Such a dramatic change in environmental media would have exposed the insect ancestor to several new classes of chemicals, including those that are water insoluble. Many of these novel odors are likely to have been produced by plants, whose colonization of land at ∼450–500 million years ago may have just preceded the evolution of insects (Rubinstein et al., 2010). Indeed, the preferential ligands of most Drosophila ORs are hydrophobic esters and alcohols that are abundant in vegetal tissues (Nijssen, 2004; Hallem and Carlson, 2006).
Beyond the appearance of different olfactory receptor repertoires, our comparative genomics (Croset et al., 2010), molecular (Abuin et al., 2011), and present physiological and neuroanatomical studies provide a comprehensive view into the functional evolution of the IR repertoire itself. The clearer phylogenetic relationships of IR genes across divergent species allows predictions to be made about the precise order in which individual olfactory pathways have evolved and open the possibility for future comparative studies of “older” and “younger” olfactory pathways to define the genetic basis and functional significance of olfactory circuit evolution.
Footnotes
R.R. was funded by a Roche Research Foundation Fellowship, P.R. by a Human Frontier Science Program Long-Term Fellowship, and Y.G. by the Centre National de la Recherche Scientifique (France). G.S.X.E.J. is supported by the Medical Research Council and a European Research Council Starting Investigator Grant. Research in the laboratory of R.B. is supported by the University of Lausanne, a European Research Council Starting Independent Researcher Grant, and the Swiss National Science Foundation. We acknowledge Hubert Amrein and the Bloomington Stock Center for provision of Drosophila strains, Jing Wang, Allan Wong, and Richard Axel for raw image data, and Elissa Hallem for OR response data. We are grateful to Alexandre Wicky and Cristina Leoni for assistance in preliminary behavioral assays, Gilles Boss for valuable help in equipment construction, Frédéric Schütz for advice on statistics, and Tadeusz Kawecki for provision of facilities for behavioral experiments. We thank Giovanni Galizia, Sophie Martin, and members of the Benton laboratory for discussions and comments on this manuscript.
The authors declare no competing financial interests.
References
- Abuin L, Bargeton B, Ulbrich MH, Isacoff EY, Kellenberger S, Benton R. Functional architecture of olfactory ionotropic glutamate receptors. Neuron. 2011;69:44–60. doi: 10.1016/j.neuron.2010.11.042. [DOI] [PMC free article] [PubMed] [Google Scholar]
- Adams MD, Celniker SE, Holt RA, Evans CA, Gocayne JD, Amanatides PG, Scherer SE, Li PW, Hoskins RA, Galle RF, George RA, Lewis SE, Richards S, Ashburner M, Henderson SN, Sutton GG, Wortman JR, Yandell MD, Zhang Q, Chen LX, et al. The genome sequence of Drosophila melanogaster. Science. 2000;287:2185–2195. doi: 10.1126/science.287.5461.2185. [DOI] [PubMed] [Google Scholar]
- Ai M, Min S, Grosjean Y, Leblanc C, Bell R, Benton R, Suh GS. Acid sensing by the Drosophila olfactory system. Nature. 2010;468:691–695. doi: 10.1038/nature09537. [DOI] [PMC free article] [PubMed] [Google Scholar]
- Armstrong N, Sun Y, Chen GQ, Gouaux E. Structure of a glutamate-receptor ligand-binding core in complex with kainate. Nature. 1998;395:913–917. doi: 10.1038/27692. [DOI] [PubMed] [Google Scholar]
- Becher PG, Bengtsson M, Hansson BS, Witzgall P. Flying the fly: long-range flight behavior of Drosophila melanogaster to attractive odors. J Chem Ecol. 2010;36:599–607. doi: 10.1007/s10886-010-9794-2. [DOI] [PubMed] [Google Scholar]
- Benton R. On the ORigin of smell: odorant receptors in insects. Cell Mol Life Sci. 2006;63:1579–1585. doi: 10.1007/s00018-006-6130-7. [DOI] [PMC free article] [PubMed] [Google Scholar]
- Benton R. Sensitivity and specificity in Drosophila pheromone perception. Trends Neurosci. 2007;30:512–519. doi: 10.1016/j.tins.2007.07.004. [DOI] [PubMed] [Google Scholar]
- Benton R, Sachse S, Michnick SW, Vosshall LB. Atypical membrane topology and heteromeric function of Drosophila odorant receptors in vivo. PLoS Biol. 2006;4:e20. doi: 10.1371/journal.pbio.0040020. [DOI] [PMC free article] [PubMed] [Google Scholar]
- Benton R, Vannice KS, Vosshall LB. An essential role for a CD36-related receptor in pheromone detection in Drosophila. Nature. 2007;450:289–293. doi: 10.1038/nature06328. [DOI] [PubMed] [Google Scholar]
- Benton R, Vannice KS, Gomez-Diaz C, Vosshall LB. Variant ionotropic glutamate receptors as chemosensory receptors in Drosophila. Cell. 2009;136:149–162. doi: 10.1016/j.cell.2008.12.001. [DOI] [PMC free article] [PubMed] [Google Scholar]
- Bhandawat V, Olsen SR, Gouwens NW, Schlief ML, Wilson RI. Sensory processing in the Drosophila antennal lobe increases reliability and separability of ensemble odor representations. Nat Neurosci. 2007;10:1474–1482. doi: 10.1038/nn1976. [DOI] [PMC free article] [PubMed] [Google Scholar]
- Bischof J, Maeda RK, Hediger M, Karch F, Basler K. An optimized transgenesis system for Drosophila using germ-line-specific phiC31 integrases. Proc Natl Acad Sci U S A. 2007;104:3312–3317. doi: 10.1073/pnas.0611511104. [DOI] [PMC free article] [PubMed] [Google Scholar]
- Cachero S, Ostrovsky AD, Yu JY, Dickson BJ, Jefferis GS. Sexual dimorphism in the fly brain. Curr Biol. 2010;20:1589–1601. doi: 10.1016/j.cub.2010.07.045. [DOI] [PMC free article] [PubMed] [Google Scholar]
- Carey AF, Wang G, Su CY, Zwiebel LJ, Carlson JR. Odorant reception in the malaria mosquito Anopheles gambiae. Nature. 2010;464:66–71. doi: 10.1038/nature08834. [DOI] [PMC free article] [PubMed] [Google Scholar]
- Chiang AS, Lin CY, Chuang CC, Chang HM, Hsieh CH, Yeh CW, Shih CT, Wu JJ, Wang GT, Chen YC, Wu CC, Chen GY, Ching YT, Lee PC, Lin CY, Lin HH, Wu CC, Hsu HW, Huang YA, Chen JY, et al. Three-dimensional reconstruction of brain-wide wiring networks in Drosophila at single-cell resolution. Curr Biol. 2011;21:1–11. doi: 10.1016/j.cub.2010.11.056. [DOI] [PubMed] [Google Scholar]
- Chou YH, Zheng X, Beachy PA, Luo L. Patterning axon targeting of olfactory receptor neurons by coupled hedgehog signaling at two distinct steps. Cell. 2010a;142:954–966. doi: 10.1016/j.cell.2010.08.015. [DOI] [PMC free article] [PubMed] [Google Scholar]
- Chou YH, Spletter ML, Yaksi E, Leong JC, Wilson RI, Luo L. Diversity and wiring variability of olfactory local interneurons in the Drosophila antennal lobe. Nat Neurosci. 2010b;13:439–449. doi: 10.1038/nn.2489. [DOI] [PMC free article] [PubMed] [Google Scholar]
- Christensen TA, Waldrop BR, Harrow ID, Hildebrand JG. Local interneurons and information processing in the olfactory glomeruli of the moth Manduca sexta. J Comp Physiol A Neuroethol Sens Neural Behav Physiol. 1993;173:385–399. doi: 10.1007/BF00193512. [DOI] [PubMed] [Google Scholar]
- Couto A, Alenius M, Dickson BJ. Molecular, anatomical, and functional organization of the Drosophila olfactory system. Curr Biol. 2005;15:1535–1547. doi: 10.1016/j.cub.2005.07.034. [DOI] [PubMed] [Google Scholar]
- Croset V, Rytz R, Cummins SF, Budd A, Brawand D, Kaessmann H, Gibson TJ, Benton R. Ancient protostome origin of chemosensory ionotropic glutamate receptors and the evolution of insect taste and olfaction. PLoS Genet. 2010;6:e1001064. doi: 10.1371/journal.pgen.1001064. [DOI] [PMC free article] [PubMed] [Google Scholar]
- de Bruyne M, Foster K, Carlson JR. Odor coding in the Drosophila antenna. Neuron. 2001;30:537–552. doi: 10.1016/s0896-6273(01)00289-6. [DOI] [PubMed] [Google Scholar]
- Demir E, Dickson BJ. fruitless splicing specifies male courtship behavior in Drosophila. Cell. 2005;121:785–794. doi: 10.1016/j.cell.2005.04.027. [DOI] [PubMed] [Google Scholar]
- Derby CD, Sorensen PW. Neural processing, perception, and behavioral responses to natural chemical stimuli by fish and crustaceans. J Chem Ecol. 2008;34:898–914. doi: 10.1007/s10886-008-9489-0. [DOI] [PubMed] [Google Scholar]
- Do CB, Mahabhashyam MS, Brudno M, Batzoglou S. ProbCons: Probabilistic consistency-based multiple sequence alignment. Genome Res. 2005;15:330–340. doi: 10.1101/gr.2821705. [DOI] [PMC free article] [PubMed] [Google Scholar]
- Endo K, Aoki T, Yoda Y, Kimura K, Hama C. Notch signal organizes the Drosophila olfactory circuitry by diversifying the sensory neuronal lineages. Nat Neurosci. 2007;10:153–160. doi: 10.1038/nn1832. [DOI] [PubMed] [Google Scholar]
- Engel MS, Grimaldi DA. New light shed on the oldest insect. Nature. 2004;427:627–630. doi: 10.1038/nature02291. [DOI] [PubMed] [Google Scholar]
- Evers JF, Schmitt S, Sibila M, Duch C. Progress in functional neuroanatomy: precise automatic geometric reconstruction of neuronal morphology from confocal image stacks. J Neurophysiol. 2005;93:2331–2342. doi: 10.1152/jn.00761.2004. [DOI] [PubMed] [Google Scholar]
- Fishilevich E, Vosshall LB. Genetic and functional subdivision of the Drosophila antennal lobe. Curr Biol. 2005;15:1548–1553. doi: 10.1016/j.cub.2005.07.066. [DOI] [PubMed] [Google Scholar]
- French AS, Torkkeli PH, Schuckel J. Dynamic characterization of Drosophila antennal olfactory neurons indicates multiple opponent signaling pathways in odor discrimination. J Neurosci. 2011;31:861–869. doi: 10.1523/JNEUROSCI.5243-10.2011. [DOI] [PMC free article] [PubMed] [Google Scholar]
- Fuss SH, Ray A. Mechanisms of odorant receptor gene choice in Drosophila and vertebrates. Mol Cell Neurosci. 2009;41:101–112. doi: 10.1016/j.mcn.2009.02.014. [DOI] [PubMed] [Google Scholar]
- Galizia CG, Rössler W. Parallel olfactory systems in insects: anatomy and function. Annu Rev Entomol. 2010;55:399–420. doi: 10.1146/annurev-ento-112408-085442. [DOI] [PubMed] [Google Scholar]
- Galizia CG, Münch D, Strauch M, Nissler A, Ma S. Integrating heterogeneous odor response data into a common response model: a DoOR to the complete olfactome. Chem Senses. 2010;35:551–563. doi: 10.1093/chemse/bjq042. [DOI] [PMC free article] [PubMed] [Google Scholar]
- Gallio M, Ofstad TA, Macpherson LJ, Wang JW, Zuker CS. The coding of temperature in the Drosophila brain. Cell. 2011;144:614–624. doi: 10.1016/j.cell.2011.01.028. [DOI] [PMC free article] [PubMed] [Google Scholar]
- Gould SJ. Ontogeny and phylogeny. Cambridge, MA: Belknap Press of Harvard UP; 1977. [Google Scholar]
- Goulding SE, zur Lage P, Jarman AP. amos, a proneural gene for Drosophila olfactory sense organs that is regulated by lozenge. Neuron. 2000;25:69–78. doi: 10.1016/s0896-6273(00)80872-7. [DOI] [PubMed] [Google Scholar]
- Grosjean Y, Grillet M, Augustin H, Ferveur JF, Featherstone DE. A glial amino-acid transporter controls synapse strength and courtship in Drosophila. Nat Neurosci. 2008;11:54–61. doi: 10.1038/nn2019. [DOI] [PMC free article] [PubMed] [Google Scholar]
- Guindon S, Gascuel O. A simple, fast, and accurate algorithm to estimate large phylogenies by maximum likelihood. Syst Biol. 2003;52:696–704. doi: 10.1080/10635150390235520. [DOI] [PubMed] [Google Scholar]
- Gupta BP, Rodrigues V. Atonal is a proneural gene for a subset of olfactory sense organs in Drosophila. Genes Cells. 1997;2:225–233. doi: 10.1046/j.1365-2443.1997.d01-312.x. [DOI] [PubMed] [Google Scholar]
- Haddad R, Khan R, Takahashi YK, Mori K, Harel D, Sobel N. A metric for odorant comparison. Nat Methods. 2008;5:425–429. doi: 10.1038/nmeth.1197. [DOI] [PubMed] [Google Scholar]
- Hallem EA, Carlson JR. Coding of odors by a receptor repertoire. Cell. 2006;125:143–160. doi: 10.1016/j.cell.2006.01.050. [DOI] [PubMed] [Google Scholar]
- Hallem EA, Ho MG, Carlson JR. The molecular basis of odor coding in the Drosophila antenna. Cell. 2004;117:965–979. doi: 10.1016/j.cell.2004.05.012. [DOI] [PubMed] [Google Scholar]
- Hammer O, Harper DAT, Ryan PD. PAST: paleontological statistics software package for education and data analysis. Palaeontol Electronica. 2001;4:9. [Google Scholar]
- Han DD, Stein D, Stevens LM. Investigating the function of follicular subpopulations during Drosophila oogenesis through hormone-dependent enhancer-targeted cell ablation. Development. 2000;127:573–583. doi: 10.1242/dev.127.3.573. [DOI] [PubMed] [Google Scholar]
- Hansson BS, Ljungberg H, Hallberg E, Löfstedt C. Functional specialization of olfactory glomeruli in a moth. Science. 1992;256:1313–1315. doi: 10.1126/science.1598574. [DOI] [PubMed] [Google Scholar]
- Heisenberg M. Mushroom body memoir: from maps to models. Nat Rev Neurosci. 2003;4:266–275. doi: 10.1038/nrn1074. [DOI] [PubMed] [Google Scholar]
- Helfand SL, Carlson JR. Isolation and characterization of an olfactory mutant in Drosophila with a chemically specific defect. Proc Natl Acad Sci U S A. 1989;86:2908–2912. doi: 10.1073/pnas.86.8.2908. [DOI] [PMC free article] [PubMed] [Google Scholar]
- Hill CA, Fox AN, Pitts RJ, Kent LB, Tan PL, Chrystal MA, Cravchik A, Collins FH, Robertson HM, Zwiebel LJ. G protein-coupled receptors in Anopheles gambiae. Science. 2002;298:176–178. doi: 10.1126/science.1076196. [DOI] [PubMed] [Google Scholar]
- Hill SR, Zaspel J, Weller S, Hansson BS, Ignell R. To be or not to be. a vampire: a matter of sensillum numbers in Calyptra thalictri? Arthropod Struct Dev. 2010;39:322–333. doi: 10.1016/j.asd.2010.05.005. [DOI] [PubMed] [Google Scholar]
- Ibba I, Angioy AM, Hansson BS, Dekker T. Macroglomeruli for fruit odors change blend preference in Drosophila. Die Naturwissenschaften. 2010;97:1059–1066. doi: 10.1007/s00114-010-0727-2. [DOI] [PubMed] [Google Scholar]
- Jefferis GS, Marin EC, Stocker RF, Luo L. Target neuron prespecification in the olfactory map of Drosophila. Nature. 2001;414:204–208. doi: 10.1038/35102574. [DOI] [PubMed] [Google Scholar]
- Jefferis GS, Potter CJ, Chan AM, Marin EC, Rohlfing T, Maurer CR, Jr, Luo L. Comprehensive maps of Drosophila higher olfactory centers: spatially segregated fruit and pheromone representation. Cell. 2007;128:1187–1203. doi: 10.1016/j.cell.2007.01.040. [DOI] [PMC free article] [PubMed] [Google Scholar]
- Jhaveri D, Rodrigues V. Sensory neurons of the Atonal lineage pioneer the formation of glomeruli within the adult Drosophila olfactory lobe. Development. 2002;129:1251–1260. doi: 10.1242/dev.129.5.1251. [DOI] [PubMed] [Google Scholar]
- Jones WD, Cayirlioglu P, Kadow IG, Vosshall LB. Two chemosensory receptors together mediate carbon dioxide detection in Drosophila. Nature. 2007;445:86–90. doi: 10.1038/nature05466. [DOI] [PubMed] [Google Scholar]
- Kwon JY, Dahanukar A, Weiss LA, Carlson JR. The molecular basis of CO2 reception in Drosophila. Proc Natl Acad Sci U S A. 2007;104:3574–3578. doi: 10.1073/pnas.0700079104. [DOI] [PMC free article] [PubMed] [Google Scholar]
- Laissue PP, Reiter C, Hiesinger PR, Halter S, Fischbach KF, Stocker RF. Three-dimensional reconstruction of the antennal lobe in Drosophila melanogaster. J Comp Neurol. 1999;405:543–552. [PubMed] [Google Scholar]
- Larsson MC, Domingos AI, Jones WD, Chiappe ME, Amrein H, Vosshall LB. Or83b encodes a broadly expressed odorant receptor essential for Drosophila olfaction. Neuron. 2004;43:703–714. doi: 10.1016/j.neuron.2004.08.019. [DOI] [PubMed] [Google Scholar]
- Lee T, Luo L. Mosaic analysis with a repressible cell marker for studies of gene function in neuronal morphogenesis. Neuron. 1999;22:451–461. doi: 10.1016/s0896-6273(00)80701-1. [DOI] [PubMed] [Google Scholar]
- Letunic I, Bork P. Interactive Tree Of Life (iTOL): an online tool for phylogenetic tree display and annotation. Bioinformatics. 2007;23:127–128. doi: 10.1093/bioinformatics/btl529. [DOI] [PubMed] [Google Scholar]
- Lin HH, Lai JS, Chin AL, Chen YC, Chiang AS. A map of olfactory representation in the Drosophila mushroom body. Cell. 2007;128:1205–1217. doi: 10.1016/j.cell.2007.03.006. [DOI] [PubMed] [Google Scholar]
- Liu C, Pitts RJ, Bohbot JD, Jones PL, Wang G, Zwiebel LJ. Distinct olfactory signaling mechanisms in the malaria vector mosquito Anopheles gambiae. PLoS Biol. 2010;8:e1000467. doi: 10.1371/journal.pbio.1000467. [DOI] [PMC free article] [PubMed] [Google Scholar]
- Marin EC, Jefferis GS, Komiyama T, Zhu H, Luo L. Representation of the glomerular olfactory map in the Drosophila brain. Cell. 2002;109:243–255. doi: 10.1016/s0092-8674(02)00700-6. [DOI] [PubMed] [Google Scholar]
- Markstein M, Pitsouli C, Villalta C, Celniker SE, Perrimon N. Exploiting position effects and the gypsy retrovirus insulator to engineer precisely expressed transgenes. Nat Genet. 2008;40:476–483. doi: 10.1038/ng.101. [DOI] [PMC free article] [PubMed] [Google Scholar]
- Masse NY, Turner GC, Jefferis GS. Olfactory information processing in Drosophila. Curr Biol. 2009;19:R700–R713. doi: 10.1016/j.cub.2009.06.026. [DOI] [PubMed] [Google Scholar]
- Maung SM, Jarman AP. Functional distinctness of closely related transcription factors: a comparison of the Atonal and Amos proneural factors. Mech Dev. 2007;124:647–656. doi: 10.1016/j.mod.2007.07.006. [DOI] [PMC free article] [PubMed] [Google Scholar]
- Mombaerts P, Wang F, Dulac C, Chao SK, Nemes A, Mendelsohn M, Edmondson J, Axel R. Visualizing an olfactory sensory map. Cell. 1996;87:675–686. doi: 10.1016/s0092-8674(00)81387-2. [DOI] [PubMed] [Google Scholar]
- Mori K, Nagao H, Yoshihara Y. The olfactory bulb: coding and processing of odor molecule information. Science. 1999;286:711–715. doi: 10.1126/science.286.5440.711. [DOI] [PubMed] [Google Scholar]
- Ng M, Roorda RD, Lima SQ, Zemelman BV, Morcillo P, Miesenböck G. Transmission of olfactory information between three populations of neurons in the antennal lobe of the fly. Neuron. 2002;36:463–474. doi: 10.1016/s0896-6273(02)00975-3. [DOI] [PubMed] [Google Scholar]
- Nijssen LM, van Ingen-Visscher CA, Donders JJ, editors. Zeist, The Netherlands: TNO-CIVO Food Analysis Institute; 2004. Volatile compounds in food: qualitative and quantitative data. [Google Scholar]
- Nishino H, Nishikawa M, Mizunami M, Yokohari F. Functional and topographic segregation of glomeruli revealed by local staining of antennal sensory neurons in the honeybee Apis mellifera. J Comp Neurol. 2009;515:161–180. doi: 10.1002/cne.22064. [DOI] [PubMed] [Google Scholar]
- Ohkura M, Matsuzaki M, Kasai H, Imoto K, Nakai J. Genetically encoded bright Ca2+ probe applicable for dynamic Ca2+ imaging of dendritic spines. Anal Chem. 2005;77:5861–5869. doi: 10.1021/ac0506837. [DOI] [PubMed] [Google Scholar]
- Olsen SR, Bhandawat V, Wilson RI. Excitatory interactions between olfactory processing channels in the Drosophila antennal lobe. Neuron. 2007;54:89–103. doi: 10.1016/j.neuron.2007.03.010. [DOI] [PMC free article] [PubMed] [Google Scholar]
- Panico R, Powell WH, Richer J-C. A guide to IUPAC nomenclature of organic compounds. Oxford: Blackwell Scientific; 1993. [Google Scholar]
- Pelz D, Roeske T, Syed Z, de Bruyne M, Galizia CG. The molecular receptive range of an olfactory receptor in vivo (Drosophila melanogaster Or22a) J Neurobiol. 2006;66:1544–1563. doi: 10.1002/neu.20333. [DOI] [PubMed] [Google Scholar]
- Peñalva-Arana DC, Lynch M, Robertson HM. The chemoreceptor genes of the waterflea Daphnia pulex: many Grs but no Ors. BMC Evol Biol. 2009;9:79. doi: 10.1186/1471-2148-9-79. [DOI] [PMC free article] [PubMed] [Google Scholar]
- Qiu YT, van Loon JJ, Takken W, Meijerink J, Smid HM. Olfactory coding in antennal neurons of the malaria mosquito, Anopheles gambiae. Chem Senses. 2006;31:845–863. doi: 10.1093/chemse/bjl027. [DOI] [PubMed] [Google Scholar]
- Ramdya P, Benton R. Evolving olfactory systems on the fly. Trends Genet. 2010;26:307–316. doi: 10.1016/j.tig.2010.04.004. [DOI] [PubMed] [Google Scholar]
- Reiff DF, Ihring A, Guerrero G, Isacoff EY, Joesch M, Nakai J, Borst A. In vivo performance of genetically encoded indicators of neural activity in flies. J Neurosci. 2005;25:4766–4778. doi: 10.1523/JNEUROSCI.4900-04.2005. [DOI] [PMC free article] [PubMed] [Google Scholar]
- Robertson HM, Wanner KW. The chemoreceptor superfamily in the honey bee, Apis mellifera: expansion of the odorant, but not gustatory, receptor family. Genome Res. 2006;16:1395–1403. doi: 10.1101/gr.5057506. [DOI] [PMC free article] [PubMed] [Google Scholar]
- Robertson HM, Warr CG, Carlson JR. Molecular evolution of the insect chemoreceptor gene superfamily in Drosophila melanogaster. Proc Natl Acad Sci U S A. 2003;100(Suppl 2):14537–14542. doi: 10.1073/pnas.2335847100. [DOI] [PMC free article] [PubMed] [Google Scholar]
- Rodrigues V, Hummel T. Development of the Drosophila olfactory system. Adv Exp Med Biol. 2008;628:82–101. doi: 10.1007/978-0-387-78261-4_6. [DOI] [PubMed] [Google Scholar]
- Rubinstein CV, Gerrienne P, de la Puente GS, Astini RA, Steemans P. Early Middle Ordovician evidence for land plants in Argentina (eastern Gondwana) New Phytol. 2010;188:365–369. doi: 10.1111/j.1469-8137.2010.03433.x. [DOI] [PubMed] [Google Scholar]
- Rueckert D, Sonoda LI, Hayes C, Hill DL, Leach MO, Hawkes DJ. Nonrigid registration using free-form deformations: application to breast MR images. IEEE Trans Med Imaging. 1999;18:712–721. doi: 10.1109/42.796284. [DOI] [PubMed] [Google Scholar]
- Sachse S, Rueckert E, Keller A, Okada R, Tanaka NK, Ito K, Vosshall LB. Activity-dependent plasticity in an olfactory circuit. Neuron. 2007;56:838–850. doi: 10.1016/j.neuron.2007.10.035. [DOI] [PubMed] [Google Scholar]
- Scott K, Brady R, Jr, Cravchik A, Morozov P, Rzhetsky A, Zuker C, Axel R. A chemosensory gene family encoding candidate gustatory and olfactory receptors in Drosophila. Cell. 2001;104:661–673. doi: 10.1016/s0092-8674(01)00263-x. [DOI] [PubMed] [Google Scholar]
- Seki Y, Rybak J, Wicher D, Sachse S, Hansson BS. Physiological and morphological characterization of local interneurons in the Drosophila antennal lobe. J Neurophysiol. 2010;104:1007–1019. doi: 10.1152/jn.00249.2010. [DOI] [PubMed] [Google Scholar]
- Shanbhag SR, Singh K, Singh RN. Fine structure and primary sensory projections of sensilla located in the sacculus of the antenna of Drosophila melanogaster. Cell Tissue Res. 1995;282:237–249. doi: 10.1007/BF00319115. [DOI] [PubMed] [Google Scholar]
- Shanbhag SR, Muller B, Steinbrecht RA. Atlas of olfactory organs of Drosophila melanogaster. 1. Types, external organization, innervation and distribution of olfactory sensilla. Int J Insect Morphol Embryol. 1999;28:377–397. [Google Scholar]
- Shang Y, Claridge-Chang A, Sjulson L, Pypaert M, Miesenböck G. Excitatory local circuits and their implications for olfactory processing in the fly antennal lobe. Cell. 2007;128:601–612. doi: 10.1016/j.cell.2006.12.034. [DOI] [PMC free article] [PubMed] [Google Scholar]
- Silbering AF, Galizia CG. Processing of odor mixtures in the Drosophila antennal lobe reveals both global inhibition and glomerulus-specific interactions. J Neurosci. 2007;27:11966–11977. doi: 10.1523/JNEUROSCI.3099-07.2007. [DOI] [PMC free article] [PubMed] [Google Scholar]
- Smallegange RC, Qiu YT, van Loon JJ, Takken W. Synergism between ammonia, lactic acid and carboxylic acids as kairomones in the host-seeking behaviour of the malaria mosquito Anopheles gambiae sensu stricto (Diptera: Culicidae) Chem Senses. 2005;30:145–152. doi: 10.1093/chemse/bji010. [DOI] [PubMed] [Google Scholar]
- Smith CR, Smith CD, Robertson HM, Helmkampf M, Zimin A, Yandell M, Holt C, Hu H, Abouheif E, Benton R, Cash E, Croset V, Currie CR, Elhaik E, Elsik CG, Favé MJ, Fernandes V, Gibson JD, Graur D, Gronenberg W, et al. Draft genome of the red harvester ant Pogonomyrmex barbatus. Proc Natl Acad Sci U S A. 2011;108:5667–5672. doi: 10.1073/pnas.1007901108. [DOI] [PMC free article] [PubMed] [Google Scholar]
- Spehr M, Munger SD. Olfactory receptors: G protein-coupled receptors and beyond. J Neurochem. 2009;109:1570–1583. doi: 10.1111/j.1471-4159.2009.06085.x. [DOI] [PMC free article] [PubMed] [Google Scholar]
- Stocker RF. Drosophila as a focus in olfactory research: mapping of olfactory sensilla by fine structure, odor specificity, odorant receptor expression, and central connectivity. Microsc Res Tech. 2001;55:284–296. doi: 10.1002/jemt.1178. [DOI] [PubMed] [Google Scholar]
- Stocker RF, Singh RN, Schorderet M, Siddiqi O. Projection patterns of different types of antennal sensilla in the antennal glomeruli of Drosophila melanogaster. Cell Tissue Res. 1983;232:237–248. doi: 10.1007/BF00213783. [DOI] [PubMed] [Google Scholar]
- Stockinger P, Kvitsiani D, Rotkopf S, Tirián L, Dickson BJ. Neural circuitry that governs Drosophila male courtship behavior. Cell. 2005;121:795–807. doi: 10.1016/j.cell.2005.04.026. [DOI] [PubMed] [Google Scholar]
- Strausfeld NJ, Hildebrand JG. Olfactory systems: common design, uncommon origins? Curr Opin Neurobiol. 1999;9:634–639. doi: 10.1016/S0959-4388(99)00019-7. [DOI] [PubMed] [Google Scholar]
- Su CY, Menuz K, Carlson JR. Olfactory perception: receptors, cells, and circuits. Cell. 2009;139:45–59. doi: 10.1016/j.cell.2009.09.015. [DOI] [PMC free article] [PubMed] [Google Scholar]
- Tamura K, Dudley J, Nei M, Kumar S. MEGA4: molecular evolutionary genetics analysis (MEGA) software version 4.0. Mol Biol Evol. 2007;24:1596–1599. doi: 10.1093/molbev/msm092. [DOI] [PubMed] [Google Scholar]
- Thorne N, Amrein H. Atypical expression of Drosophila gustatory receptor genes in sensory and central neurons. J Comp Neurol. 2008;506:548–568. doi: 10.1002/cne.21547. [DOI] [PubMed] [Google Scholar]
- Touhara K, Vosshall LB. Sensing odorants and pheromones with chemosensory receptors. Annu Rev Physiol. 2009;71:307–332. doi: 10.1146/annurev.physiol.010908.163209. [DOI] [PubMed] [Google Scholar]
- Venken KJ, Carlson JW, Schulze KL, Pan H, He Y, Spokony R, Wan KH, Koriabine M, de Jong PJ, White KP, Bellen HJ, Hoskins RA. Versatile P[acman] BAC libraries for transgenesis studies in Drosophila melanogaster. Nat Methods. 2009;6:431–434. doi: 10.1038/nmeth.1331. [DOI] [PMC free article] [PubMed] [Google Scholar]
- Vermeulen A, Rospars JP. Why are insect olfactory receptor neurons grouped into sensilla? The teachings of a model investigating the effects of the electrical interaction between neurons on the transepithelial potential and the neuronal transmembrane potential. Eur Biophys J. 2004;33:633–643. doi: 10.1007/s00249-004-0405-4. [DOI] [PubMed] [Google Scholar]
- Vosshall LB, Stocker RF. Molecular architecture of smell and taste in Drosophila. Annu Rev Neurosci. 2007;30:505–533. doi: 10.1146/annurev.neuro.30.051606.094306. [DOI] [PubMed] [Google Scholar]
- Vosshall LB, Wong AM, Axel R. An olfactory sensory map in the fly brain. Cell. 2000;102:147–159. doi: 10.1016/s0092-8674(00)00021-0. [DOI] [PubMed] [Google Scholar]
- Wachowiak M, Shipley MT. Coding and synaptic processing of sensory information in the glomerular layer of the olfactory bulb. Semin Cell Dev Biol. 2006;17:411–423. doi: 10.1016/j.semcdb.2006.04.007. [DOI] [PubMed] [Google Scholar]
- Wang JW, Wong AM, Flores J, Vosshall LB, Axel R. Two-photon calcium imaging reveals an odor-evoked map of activity in the fly brain. Cell. 2003;112:271–282. doi: 10.1016/s0092-8674(03)00004-7. [DOI] [PubMed] [Google Scholar]
- Wang VY, Hassan BA, Bellen HJ, Zoghbi HY. Drosophila atonal fully rescues the phenotype of Math1 null mice: new functions evolve in new cellular contexts. Curr Biol. 2002;12:1611–1616. doi: 10.1016/s0960-9822(02)01144-2. [DOI] [PubMed] [Google Scholar]
- Watanabe H, Nishino H, Nishikawa M, Mizunami M, Yokohari F. Complete mapping of glomeruli based on sensory nerve branching pattern in the primary olfactory center of the cockroach Periplaneta americana. J Comp Neurol. 2010;518:3907–3930. doi: 10.1002/cne.22452. [DOI] [PubMed] [Google Scholar]
- Willmore B, Tolhurst DJ. Characterizing the sparseness of neural codes. Network. 2001;12:255–270. [PubMed] [Google Scholar]
- Wilson RI, Turner GC, Laurent G. Transformation of olfactory representations in the Drosophila antennal lobe. Science. 2004;303:366–370. doi: 10.1126/science.1090782. [DOI] [PubMed] [Google Scholar]
- Wong AM, Wang JW, Axel R. Spatial representation of the glomerular map in the Drosophila protocerebrum. Cell. 2002;109:229–241. doi: 10.1016/s0092-8674(02)00707-9. [DOI] [PubMed] [Google Scholar]
- Yao CA, Ignell R, Carlson JR. Chemosensory coding by neurons in the coeloconic sensilla of the Drosophila antenna. J Neurosci. 2005;25:8359–8367. doi: 10.1523/JNEUROSCI.2432-05.2005. [DOI] [PMC free article] [PubMed] [Google Scholar]
- Yu HH, Kao CF, He Y, Ding P, Kao JC, Lee T. A complete developmental sequence of a Drosophila neuronal lineage as revealed by twin-spot MARCM. PLoS Biol. 2010a;8:e1000461. doi: 10.1371/journal.pbio.1000461. [DOI] [PMC free article] [PubMed] [Google Scholar]
- Yu JY, Kanai MI, Demir E, Jefferis GS, Dickson BJ. Cellular organization of the neural circuit that drives Drosophila courtship behavior. Curr Biol. 2010b;20:1602–1614. doi: 10.1016/j.cub.2010.08.025. [DOI] [PubMed] [Google Scholar]
- Zou DJ, Chesler A, Firestein S. How the olfactory bulb got its glomeruli: a just so story? Nat Rev Neurosci. 2009;10:611–618. doi: 10.1038/nrn2666. [DOI] [PubMed] [Google Scholar]
- Zube C, Kleineidam CJ, Kirschner S, Neef J, Rössler W. Organization of the olfactory pathway and odor processing in the antennal lobe of the ant Camponotus floridanus. J Comp Neurol. 2008;506:425–441. doi: 10.1002/cne.21548. [DOI] [PubMed] [Google Scholar]
- zur Lage PI, Prentice DR, Holohan EE, Jarman AP. The Drosophila proneural gene amos promotes olfactory sensillum formation and suppresses bristle formation. Development. 2003;130:4683–4693. doi: 10.1242/dev.00680. [DOI] [PubMed] [Google Scholar]