

Abstract
The mesocorticolimbic dopamine (DA) system plays important roles in reward, motivation, learning, memory, and movement. This system arises from the A10 region, comprising the ventral tegmental area and three adjacent midline nuclei (caudal linear nucleus, interfascicular nucleus, and rostral linear nucleus of the raphe). DAergic and GABAergic neurons are intermingled in this region with recently discovered glutamatergic neurons expressing the vesicular glutamate transporter 2 (VGluT2). Here, we show by in situ hybridization and immunohistochemistry that there are two subpopulations of neurons expressing VGluT2 mRNA in the A10 region: (1) a major subpopulation that expresses VGluT2 but lacks tyrosine hydroxylase (TH; VGluT2-only neurons), present in each nucleus of the A10 region, and (2) a smaller subpopulation that coexpresses VGluT2 and TH (VGluT2-TH neurons). By quantitative real-time PCR, we determined the mRNA copy numbers encoding VGluT2 or TH in samples of individual microdissected TH immunoreactive (IR) neurons. Data from both in situ hybridization and from mRNA quantification showed that VGluT2 mRNA is not present in every TH-IR neuron, but restricted to a subset of TH-IR neurons located in the medial portion of the A10 region. By integration of tract tracing, in situ hybridization, and immunohistochemistry, we found that VGluT2-only neurons and VGluT2-TH neurons each innervate both the prefrontal cortex and the nucleus accumbens. These findings establish that in addition to the well-recognized mesocorticolimbic DA-only and GABA-only pathways, there exist parallel mesocorticolimbic glutamate-only and glutamate-DA pathways.
Introduction
The mesocorticolimbic dopamine (DA) system plays important roles in reward, motivation, learning, memory, and movement. This system arises from the A10 region that comprises two major nuclei of the ventral tegmental area (VTA), parabrachial pigmented (PBP) and paranigral (PN) nuclei, and three midline nuclei, the caudal linear nucleus (CLi), interfascicular nucleus (IF), and rostral linear nucleus of the raphe (RLi), that are not, strictly speaking, part of the VTA (Swanson, 1982). Within the VTA proper, DA neurons are interspersed with GABA neurons that establish local connections (Johnson and North, 1992; Omelchenko and Sesack, 2009) and innervate the prefrontal cortex (PFC) and the nucleus accumbens (nAcc) (Van Bockstaele and Pickel, 1995; Carr and Sesack, 2000) or both. Recent electrophysiological and anatomical findings indicate that glutamate signaling neurons are also present in the A10 region and that they too project to the nAcc (Chuhma et al., 2004; Hur and Zaborszky, 2005; Lavin et al., 2005; Kawano et al., 2006; Yamaguchi et al., 2007; Nair-Roberts et al., 2008; Dobi et al., 2010; Stuber et al., 2010; Tecuapetla et al., 2010).
Glutamate neurons can be identified through the detection of mRNA encoding vesicular glutamate transporters (VGluT1, VGluT2, and VGluT3), which transport glutamate into synaptic vesicles for release at presynaptic terminals. Detection of mRNA encoding these transporters is needed for the accurate labeling of cell bodies of glutamate neurons, as levels of the transporters are often undetectable with standard immunolabeling methods. Two subpopulations of neurons expressing VGluT2 mRNA are present in the A10 region (Kawano et al., 2006; Yamaguchi et al., 2007): (1) VGluT2-only neurons that express VGluT2 mRNA but lack tyrosine hydroxylase (TH) and GABA markers (Yamaguchi et al., 2007), and (2) VGluT2-TH neurons that coexpress VGluT2 mRNA and TH (Kawano et al., 2006). Whereas the subpopulation of VGluT2-only neurons is the prevalent cell population in the two nuclei of the VTA (PBP and PN) (Yamaguchi et al., 2007), a small subpopulation of VGluT2-TH neurons is found in the midline nuclei of the A10 region (Kawano et al., 2006).
A role for VGluT2-only neurons in VTA neurotransmission has been suggested from electrophysiological and anatomical findings showing that some of the VTA VGluT2 neurons establish local glutamatergic synapses on DA and non-DA neurons (Dobi et al., 2010). These studies indicate that VTA VGluT2 neurons provide excitatory local neurotransmission, contrary to the notion that all glutamatergic regulation to the A10 region is from extrinsic neurons.
To further explore the cellular heterogeneity of the A10 region, we used radioactive in situ hybridization together with immunohistochemistry to map the distribution of VGluT2-only, VGluT2-TH, and TH-only neurons in each subdivision of the A10 region. To quantify the levels of TH mRNA or VGluT2 mRNA present in individual TH cells in vivo, we used a single-cell quantitative real-time PCR (qRT-PCR) method involving microdissected cells. To investigate whether subpopulations of VGluT2-only or VGluT2-TH neurons target the nAcc or PFC, we implemented a combination of tract tracing, immunohistochemistry and in situ hybridization.
Materials and Methods
Tissue preparation for anatomical studies.
Nine adult male Sprague Dawley rats (300–350 g body weight) were anesthetized with chloral hydrate (35 mg/100 g) and perfused transcardially with 4% (w/v) paraformaldehyde (PFA) in 0.1 m phosphate buffer (PB), pH 7.3. Brains were left in 4% PFA for 2 h at 4°C, rinsed with PB, and transferred sequentially to 12, 14, and 18% sucrose solutions in PB. Coronal serial sections of 5 μm (four rats) or 12 μm (five rats) in thickness were prepared. All animal procedures were approved by the NIDA Animal Care and Use Committee.
Fluoro-Gold injections into the PFC or the nAcc.
Eight 300–330 g Sprague Dawley male rats (4 for PFC and 4 for nAcc) were anesthetized with chloral hydrate (3 ml/kg, i.p.) in a physiological saline solution. Deeply anesthetized rats were fixed in a stereotaxic apparatus, and the retrograde tracer Fluoro-Gold (FG; 1% in cacodylate buffer, pH 7.5) was delivered bilaterally into the PFC [3.0 mm anteroposterior (AP); 0.7 mm mediolateral (ML); and −4.6, −3.8, and −3.0 mm dorsoventral (DV)] or the nAcc (1.9 mm AP; 2.5 mm ML; −6.8 and −7.7 mm DV) with pipettes lowered at a 10° angle in the coronal plane. The FG was delivered iontophoretically through a stereotaxically positioned glass micropipette (inner tip diameter between 60–70 μm for PFC injections and 40 μm for nAcc injections) by applying 5 μA current in 5 s pulses at 10 s intervals for 20 min. The micropipette was left in place for an additional 10 min to prevent backflow of tracer up the injection track after each injection. One week after FG injections, the rats were perfused as indicated above.
Combination of in situ hybridization and TH immunolabeling.
Coronal free-floating sections (12 μm thick) or sections collected on glass slides (5 μm thick) were processed as described previously for free-floating sections (Wang and Morales, 2008) and for sections on glass slides (Morales and Wang, 2002). Sections were incubated for 10 min in PB containing 0.5% Triton X-100, rinsed two times for 5 min each with PB, treated with 0.2N HCl for 10 min, rinsed two times for 5 min each with PB, and then acetylated in 0.25% acetic anhydride in 0.1 m triethanolamine, pH 8.0, for 10 min. Sections were rinsed two times for 5 min each with PB and postfixed with 4% PFA for 10 min. Before hybridization and after a final rinse with PB, the free-floating sections were incubated in hybridization buffer (50% formamide, 10% dextran sulfate, 5× Denhardt's solution, 0.62 m NaCl, 50 mm DTT, 10 mm EDTA, 20 mm PIPES, pH 6.8, 0.2% SDS, 250 μg/ml salmon sperm DNA, 250 μg/ml tRNA) for 2 h at 55°C. Sections collected on glass slides were dehydrated through a series of graded ethanol (50, 70, and 95%, 5 min for each concentration). Sections were hybridized for 16 h at 55°C in hybridization buffer containing [35S]- and [33P]-labeled single-stranded antisense or sense of rat VGluT1 (nucleotides 53-2077; GenBank accession number NM-053859.1), VGluT2 (nucleotides 317-2357; GenBank accession number NM-053427), or VGluT3 (nucleotides 1-1729; GenBank accession number BC117229.1) probes at 107 cpm/ml. Plasmids that contained the VGluT1 and VGluT2 were generously provided by Dr. Robert H. Edwards (University of California, San Francisco). Sections were treated with 4 μg/ml RNase A at 37°C for 1 h, washed with 1× SSC, 50% formamide at 55°C for 1 h, and with 0.1× SSC at 68°C for 1 h. After the last SSC wash, sections were rinsed with PB and incubated for 1 h in PB supplemented with 4% bovine serum albumin and 0.3% Triton X-100. This was followed by the overnight incubation at 4°C with an anti-TH mouse monoclonal antibody (1:500; MAB 318; Millipore) for which specificity has been documented (Tagliaferro and Morales, 2008). After being rinsed three times for 10 min each in PB, sections were processed with an ABC kit (Vector Laboratories). The material was incubated for 1 h at room temperature in a 1:200 dilution of the biotinylated secondary antibody, rinsed with PB, and incubated with avidin-biotinylated horseradish peroxidase for 1 h. Sections were rinsed and the peroxidase reaction was then developed with 0.05% 3, 3-diaminobenzidine-4 HCl (DAB) and 0.03% hydrogen peroxide (H2O2). Free-floating sections were mounted on coated slides. Slides were dipped in Ilford K.5 nuclear tract emulsion (Polysciences; 1:1 dilution in double distilled water) and exposed in the dark at 4°C for 4 weeks before development.
Phenotypic characterization of retrograde labeled cells by combination of TH immunofluorescence, FG immunolabeling, and in situ hybridization.
Midbrain coronal free-floating sections (18 μm thick) were incubated for 2 h at 30°C with a mixture of rabbit anti-FG antibody (1:500; AB153; Millipore) and the mouse monoclonal anti-TH antibody (1:500) in antibody buffer (DEPC-treated PB with 0.5% Triton X-100) supplemented with RNasin (40 U/μl stock; 5 μl/ml of buffer; Promega). Sections were rinsed three times for 5 min each with DEPC-treated PB and incubated in biotinylated goat anti-rabbit antibody (1:200; Vector Laboratories) and fluorescein-conjugated donkey anti-mouse antibody (1:50; Jackson ImmunoResearch) in DEPC-treated PB supplemented with RNasin for 1 h at 30°C. Sections were rinsed three times for 5 min each with DEPC-treated PB, transferred to 4% PFA, and visualized by epifluorescence with a Leica DM LB microscope to identify FG- or TH-labeled neurons. Sections were rinsed three times for 5 min each with DEPC-treated PB, incubated for 10 min in PB containing 0.5% Triton X-100, rinsed two times for 5 min each with PB, treated with 0.2N HCl for 10 min, rinsed two times for 5 min each with PB, and then acetylated in 0.25% acetic anhydride in 0.1 m triethanolamine, pH 8.0, for 10 min. Sections were rinsed two times for 5 min each with PB, and postfixed with 4% PFA for 10 min. Before hybridization and after a final rinse with PB, the sections were incubated in hybridization buffer for 2 h at 55°C. Sections were hybridized for 16 h at 55°C in hybridization buffer containing [35S]- and [33P]-labeled single-stranded antisense or sense of rat VGluT2. Sections were treated with 4 μg/ml RNase A at 37°C for 1 h and washed with 1× SSC, 50% formamide at 55°C for 1 h and with 0.1× SSC at 68°C for 1 h. After the last SSC wash, sections were rinsed with PB and incubated for 1 h at room temperature in avidin-biotinylated horseradish peroxidase (ABC kit; Vector Laboratories). Sections were rinsed, and the peroxidase reaction was then developed with 0.05% DAB and 0.03% H2O2. Sections were mounted on coated slides. Slides were dipped in Ilford K.5 nuclear tract emulsion (Polysciences; 1:1 dilution in double distilled water) and exposed in the dark at 4°C for 4 weeks before development.
Tissue preparation for single-cell quantitative RT-PCR.
Four adult Sprague Dawley male rats (300–350 g body weight) were anesthetized with chloral hydrate (35 mg/100 g) and perfused transcardially with 10% RNAlater (Ambion) in 0.1 m PB, pH 7.4, as described previously (Sanna et al., 2005). Brains were immediately removed and frozen in isopentane at −40°C. Coronal cryosections (10 μm thick) through the midbrain (−5.04 mm to −5.40 mm from bregma) were collected onto polyethylene-naphthalene-membrane-coated microscope slides (Leica Microsystems) and stored at −80°C.
TH immunofluorescent labeling for laser microdissection and RNA extraction.
Coronal cryosections stored at −80°C were moved to −20°C and 30 min later were transferred to room temperature, air dried, and fixed with ice-cold acetone for 2 min. Fixed sections were rinsed twice in PB and incubated for 4 min with the mouse anti-TH antibody (1:40 dilution) in PB. Samples were rinsed twice with PB and incubated for 4 min with an Alexa Fluor 488-conjugated goat anti-mouse antibody (1:30 dilution; Invitrogen). Antibody solutions were supplemented with 0.1% Triton X-100 and 400 U/ml of an RNase inhibitor (RNasin; Promega). Sections were rinsed in PB, dehydrated in graded ethanol solution (70, 95, and 100%; 30 s each step), and air dried. Individual TH-positive cellular profiles were microdissected from the PBP, RLi, and IF. TH-positive cellular profiles were microdissected under a 40× objective lens and collected by gravity directly into a cap of a 0.5 ml PCR tube (Eppendorf) containing 20 μl of RNA extraction buffer. Total RNA was immediately extracted using the PicoPure RNA isolation kit (Molecular Devices). Genomic DNA was removed by DNase digestion using the DNA-free kit (Qiagen). Extracted RNA was stored at −80°C.
qRT-PCR with TaqMan primer/probes.
cDNA from extracted RNA was obtained by reverse transcription with the SuperScript III First-Strand Synthesis Super Mix (Invitrogen) and was brought to a final volume of 20 μl. For each assay, 5 μl was used. Quantification of VGluT2 or TH mRNA copy numbers from the cDNA was done using the Gene Expression Master Mix (Applied Biosystems) containing either VGluT2 or TH primers. Beta-actin (Applied Biosystems; catalog #4352931E) was amplified and used as an on-sample normalizing control. The primers were obtained from Applied Biosystems to span exons 1 to 2 of the rat VGluT2 (catalog #Rn00584780_m1) or exons 2 to 3 of the rat TH (catalog # Rn01451452_m1). The qRT-PCR was performed with the iCycler iQ Real-Time PCR Detection System (Bio-Rad Laboratories) with the following conditions: 50°C for 2 min, 95°C for 10 min, 50 cycles at 95°C for 15 s, and 60°C for 60 s. For TH and VGluT2 qRT-PCR assays, an external calibration curve was used based on a rat TH-plasmid or rat VGluT2-plasmid cDNA. For preparation of the calibration curve, samples were run in quadruplicates using serial dilutions of cDNA (5 to 105 copies). qRT-PCR results were analyzed using the iCycler iQ Real-Time PCR Detection System software and Excel software. The number of mRNA copies in each sample was interpolated from its detection threshold value using the TH- or rat VGluT2-plasmid cDNA.
Data analysis of cellular subpopulations.
Sections were viewed, analyzed, and photographed with bright-field or epiluminescence microscopy using a Nikon Eclipse E 800 microscope fitted with 4× and 20× objective lenses. Single- and double-labeled neurons were observed within each traced region at high power (20× objective lens) and marked electronically. Subdivisions of the midbrain dopamine system were traced according to Swanson (1982), Phillipson (1979a,b), Halliday and Törk (1986), German and Manaye (1993), and Paxinos and Watson (2007). TH/VGluT2 double-labeled material was analyzed using epiluminescence to increase the contrast of silver grains (neither dark-field nor bright-field optics allow clear visualization of silver grains when colocalized with high concentration of immunoproducts). A cell was considered to express VGluT2 mRNA when its soma contained concentric aggregates of silver particles above background level. A neuron was considered to express TH immunoreactivity when its soma was clearly labeled as brown. A TH-immunolabeled neuron was included in the calculation of total population of TH cells when the stained cell was at least 5 μm in diameter. The cells expressing VGluT2 mRNA, TH immunoreactivity, or both markers were counted separately. To determine cellular coexistence of VGluT2 mRNA and TH immunolabel, (1) silver grains corresponding to VGluT2 expression were focused under epiluminescence microscopy, (2) the path of epiluminescence light was blocked without changing the focus, and (3) bright-field light was used to determine whether a brown neuron, expressing TH in focus, contained the aggregates of silver grains seen under epiluminescence. Labeled cells were counted three times, each time by a different observer. The background was evaluated from slides hybridized with sense probes. For FG/TH/VGluT2 triple-labeled material, FG fluorescent cells containing or lacking TH fluorescent signal were photographed before processing for in situ hybridization (for detection of VGluT2 transcripts) and immunohistochemistry (for detection of FG in retrograde labeled cells, seen as brown because of the reaction of DAB). This FG/VGluT2 double-labeled material was analyzed following the procedure described above for the analysis of TH/VGluT2 double-labeled material. Pictures were adjusted to match contrast and brightness by using Adobe Photoshop (Adobe Systems).
Results
Within the A10 region, many neurons express VGluT2 mRNA, but none express VGluT1 or VGluT3 mRNAs
To determine whether glutamatergic neurons are present within the different subdivisions of the A10 region, we used radioactive in situ hybridization to identify cellular expression of transcripts encoding VGluT1, VGluT2, or VGluT3 (Fig. 1B′,F′, H′). We detected cells expressing VGluT2 mRNA (but not VGluT1 or VGluT3) intermingled with TH immunoreactive (TH-IR) cells in all subdivisions of the A10 region: PBP, PN, CLi, RLi, and IF (Figs. 2A–B′, 4, 11A). The specificity of the detection of VGluT2 mRNA was confirmed by the lack of signal when sections were hybridized with the VGluT2 radioactive sense riboprobe (Figs. 1C–D′). We next determined the distribution of neurons expressing VGluT2 mRNA within the different subdivisions of the A10. There is a general agreement that the PN and the PBP are part of the VTA (Phillipson, 1979a,b; Swanson, 1982; Halliday and Törk, 1986; German and Manaye, 1993; Paxinos and Watson, 2007). However, some investigators include the RLi (Phillipson, 1979a,b; German and Manaye, 1993), the CLi (Phillipson, 1979a,b), or the IF (Phillipson, 1979a,b) as part of the VTA. Here, we followed the nomenclature established by Swanson (1982) and considered the PN and the PBP as regions of the VTA that, together with the RLi, the CLi, and the IF, comprise the A10 region.
Figure 1.

Cellular expression of VGluT2 mRNA but lack of expression of either VGluT1 or VGluT3 mRNAs in the PBP, RLi, and the IF (radioactive in situ hybridization). A–H′, Coronal sections incubated with anti-TH antibodies and hybridized with either VGluT2 antisense (A–B′), VGluT2 sense (C–D′), VGluT1 antisense (E–F′), or VGluT3 antisense radioactive riboprobes (G–H′). A, C, Coronal sections at low magnification under bright-field microscopy showing TH immunoreactivity (dark brown label) in the A9 [substantia nigra compacta (SNC)] and the A10 regions (PBP, RLi, IF). Delimited areas in A and C are shown at higher magnification under bright-field microscopy for visualization of TH immunoreactivity (B, D) or under epiluminescence microscopy for visualization of cells expressing VGluT2 mRNA (silver white grains in B′). There are numerous cells expressing VGluT2 mRNA in the PBP, RLi, and IF at this rostral level (−5.04 mm from bregma). D′, Note lack of signal in the section hybridized with sense radioactive VGluT2 riboprobe. E, G, Coronal sections at low magnification under bright-field microscopy showing TH immunoreactivity (dark brown label) in the A9 and A10 regions. Delimited areas in E and G are shown at higher magnification under bright-field microscopy for visualization of TH immunoreactivity (F, H) or under epiluminescence microscopy for visualization of cells expressing VGluT1 mRNA (F′) or VGluT3 mRNA (H′). Note lack of detection of either VGluT1 mRNA (F′) or VGluT3 mRNA (H′) in the A9 or A10 region. High expression of VGluT1 mRNA is seen in the lateral–medial geniculata nucleus (E, arrow). fr, Fasciculus retroflexus. Scale bar: (in H′) A, C, E, G, 1100 μm; B, B′, D, D′, F, F′, H, H′, 165 μm. A, C, E, −5.04 mm from bregma; G, −5.28 mm from bregma.
Figure 2.

Two distinct subpopulations of neurons expressing VGluT2 mRNA in the A10 region (−5.28 mm from bregma). A, Low magnification of a 5-μm-thick coronal section with TH immunoreactivity in the A9 and A10 regions. B–C′ correspond to the same section at two different magnifications showing TH immunoreactivity under bright-field microscopy (B, C) or VGluT2 mRNA under epiluminescence microscopy (B′, C′) in the different divisions of the A10 region. In C and C′, the boxes delimit areas shown at higher magnification of the lateral parabrachial pigmental area [PBP(l)] in D and D′, medial PBP [PBP(m)] in E and E′, the RLi in F and F′, and the IF in G and G′. D–G′, TH-IR neurons coexpressing VGluT2 mRNA (thin arrows), examples of neurons expressing VGluT2 mRNA and lacking TH immunoreactivity (thick arrows), and examples of TH-IR neurons with background levels of silver grains (arrowheads). fr, Fasciculus retroflexus. Scale bar: (in G′) A, 393 μm; B, B′, 238 μm; C, C′, 145 μm; D–G′, 50 μm.
Figure 4.

Summary diagram of the cellular heterogeneity within the A10 region. Differential distribution of VGluT2-only neurons, VGluT2-TH neurons, and TH-only neurons within each subdivision of the A10 region. A–D, Distribution of VGluT2-only neurons (neurons expressing VGluT2 mRNA but lacking TH immunoreactivity). These VGluT2-only neurons are present throughout the rostrocaudal levels of each subdivision of the A10 region with a lateromedial increasing gradient of concentration. VGluT2-only neurons are infrequent in the most lateral region of the PBP, a region with a high concentration of TH-only neurons (A″, B″, C″). A′–D′, Distribution of VGluT2-TH neurons (neurons coexpressing VGluT2 mRNA and TH immunoreactivity). VGluT2-TH neurons are restricted to the most rostromedial aspects of the PBP and PN; however, they are present at all rostrocaudal and mediolateral levels of the RLi, CLi, and IF. A″–D″, Distribution of TH-only neurons (neurons lacking expression of VGluT2 mRNA but containing TH immunoreactivity). The TH-only neurons are present throughout the rostrocaudal levels of each subdivision of the A10 region, including the lateral aspects of the PBP. Each panel represents the average number of labeled neurons found in three sections, each section from a different rat. PIF, Parainterfascicular nucleus; mtg, mammillotegmental tract; fr, fasciculus retroflexus; mp, mammillary peduncle; RRF, retrorubral field.
Figure 11.

A10 region VGluT2 mRNA-expressing neurons: distribution, degree of colocalization with TH immunoreactivity, and projections. A, Incidence of VGluT2-only neurons, VGluT2-TH neurons, and TH-only neurons within each subdivision of the A10 region. VGluT2-only neurons (green) are prevalent in each subdivision of the A10 region. These neurons are more frequent than the TH-IR neurons in the medial PBP [PBP(m)], medial PN [PN(m)], lateral PN [PN(l)], and RLi. In contrast, the subpopulation of VGluT2-TH neurons (yellow) is a small fraction of the total population of neurons that expresses VGluT2 mRNA. These VGluT2-TH neurons are also a small fraction of the total population of TH-IR neurons. The TH-only neurons (pink) are prevalent in the lateromedial aspects of the PBP(t). For PBP(t) and PN(t), cells were counted from −5.28 to −5.64 mm from bregma. Total number of cells counted in the PBP [PBP(t)] or in the PN [PN(t)] from −5.28 to −5.64 mm from bregma. B, Four different phenotypes of neurons within the A10 region differentially innervate the PFC (mesocortical neurons) or the nAcc (mesoaccumbal neurons). The proportionality of neurons projecting to the PFC (left bar) or to the nAcc (right bar) is shown. The VGluT2-only neurons (green) are the largest subpopulation of neurons innervating the PFC, but the smallest innervating the nAcc. In contrast, most of the neurons projecting to the nAcc are TH-only neurons (pink). The subpopulation of VGluT2-TH-positive neurons (yellow), and the subpopulation of VGluT2-TH-negative neurons (gray) innervate with similar frequency the PFC and the nAcc (counted neurons are indicated in each bar).
Two types of VGluT2 mRNA-expressing neurons are present in the VTA
Using 5-μm-thick sections together with single in situ hybridization (for detection of VGluT2 mRNA) and TH immunolabeling, we found VGluT2 mRNA-expressing neurons throughout the rostrocaudal levels of the VTA intermingled with TH-IR neurons (Figs. 2–4). In the lateral portions of PBP and PN, the VGluT2 cells rarely coexpressed TH (Figs. 2–4). However, we did identify some neurons coexpressing VGluT2 mRNA and TH immunoreactivity (VGluT2-TH neurons) (Table 1) within the medial portion of the VTA at the level of −5.28 mm from bregma. These VGluT2-TH neurons were observed in a zone initiated at the border between the PBP and the RLi and expanding 400 μm laterally (medial PBP) (Figs. 2E,E′, 4A′, 11A), and in a zone initiated at the border between the PN and the IF and expanding 200 μm laterally (medial PN) (Figs. 4A′, 11A). In these medial zones, the VGluT2-TH neurons were a fraction of the total population of VGluT2-expressing neurons, in which their majority was VGluT2-only neurons (72–79%). However, these VGluT2-TH neurons represented about half of the total population of TH-IR neurons detected in these medial zones (Table 1). In summary, the cellular phenotyping of VTA neurons reveals an uneven cellular compartmentalization within the classically defined VTA. Whereas the lateral aspects of the VTA were comprised mostly of TH-only neurons, the medial aspects of the VTA were comprised mostly of VGluT2-only neurons with a few VGluT2-TH neurons.
Figure 3.
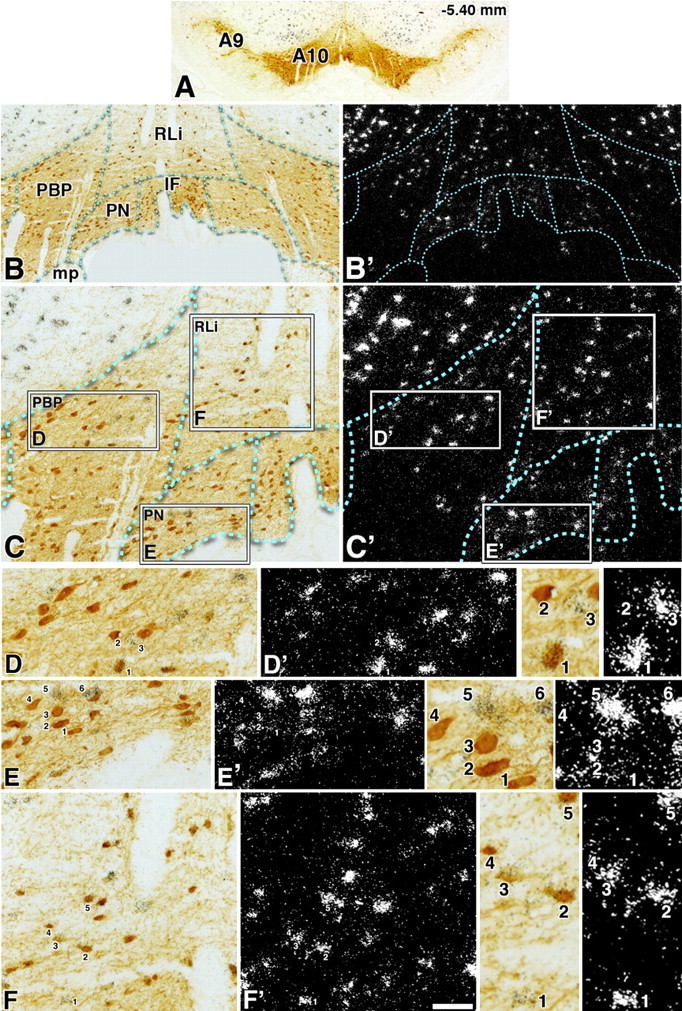
Two distinct subpopulations of neurons expressing VGluT2 mRNA in the A10 region (−5.40 mm from bregma). A, Low magnification of a 5-μm-thick coronal section with TH immunoreactivity in the A9 and A10 regions. B–C′ correspond to the same section at two different magnifications showing TH immunoreactivity under bright-field microscopy (B, C) or VGluT2 mRNA under epiluminescence microscopy (B′, C′) in the different divisions of the A10 region. In C and C′, the boxes delimit areas shown at higher magnification of the PBP in D and D′, the PN in E and E′, and the RLi in F and F′. D–F′, The numbers indicate different cells shown at higher magnification in the adjacent panels. In D, D′, and the two adjacent panels, the numbers indicate three different classes of neurons within the PBP (cell 1 shows coexpression of VGluT2 mRNA and TH immunoreactivity, cell 2 shows TH immunoreactivity with background levels of silver grains, and cell 3 shows expression of VGluT2 mRNA without TH immunoreactivity). At this level of the PBP, there are only few cells coexpressing VGluT2 mRNA and TH immunoreactivity, contrasting to the more rostral level of the PBP (Fig. 2) that contains many double-labeled neurons. In E, E′, and the two adjacent panels, the numbers indicate two different classes of neurons within the PN (cells 1–4 show TH immunoreactivity with background levels of silver grains, and cells 5 and 6 shows expression of VGluT2 mRNA without TH immunoreactivity). In F, F′, and the two adjacent panels, the numbers indicate three different classes of neurons within the RLi (cell 1 shows expression of VGluT2 mRNA without TH immunoreactivity; cells 2, 3 and 5 show coexpression of VGluT2 mRNA and TH immunoreactivity; cell 4 shows TH immunoreactivity with background levels of silver grains). Note that cells in the RLi (F) are smaller than those in either the PBP (D) or the PN (E). Scale bar: (in F′) A, 705 μm; B, B′, 220 μm; C, C′, 100 μm; D–F′, 50 μm; frames showing high magnification of selected cells, 25 μm.
Table 1.
Frequency of neurons expressing VGluT2 mRNA containing or lacking TH immunoreactivity in the PBP or the PNa
| Percentage of VGluT2-only neurons or VGluT2-TH neurons within the total population of VGluT2 mRNA-expressing neurons |
Percentage of TH-only neurons or VGluT2-TH neurons within the total population of TH-IR neurons |
|||
|---|---|---|---|---|
| VGluT2-only neurons | VGluT2-TH neurons | TH-only neurons | VGluT2-TH neurons | |
| PBP mediolateral distance from the RLib | ||||
| 0–200 μm | ||||
| Subject 1 | 78.8% (n = 53) | 21.2% (n = 13) | 44.2% (n = 10) | 55.8% (n = 13) |
| Subject 2 | 65.5% (n = 55) | 34.5% (n = 29) | 40.7% (n = 20) | 59.3% (n = 29) |
| Subject 3 | 72.7% (n = 40) | 27.3% (n = 15) | 11.8% (n = 2) | 88.2% (n = 15) |
| Mean ± SEM | 72.3 ± 3.2% (n = 148) | 27.7 ± 3.2% (n = 57) | 36.3 ± 6.4% (n = 32) | 63.6 ± 6.4% (n = 57) |
| 200–400 μm | ||||
| Subject 1 | 82.4% (n = 41) | 17.6% (n = 8) | 42.9% (n = 6) | 57.1% (n = 8) |
| Subject 2 | 70.6% (n = 36) | 29.4% (n = 14) | 34.1% (n = 7) | 65.9% (n = 14) |
| Subject 3 | 90.4% (n = 47) | 9.6% (n = 5) | 37.5% (n = 3) | 62.5% (n = 5) |
| Mean ± SEM | 79.3 ± 5.4% (n = 124) | 20.7 ± 5.4% (n = 27) | 38.3 ± 2.2% (n = 16) | 61.7 ± 2.2% (n = 27) |
| PN mediolateral distance from the IFc | ||||
| 0–200 μm | ||||
| Subject 1 | 74.6% (n = 47) | 25.4% (n = 16) | 47.9% (n = 15) | 52.1% (n = 16) |
| Subject 2 | 72.7% (n = 8) | 27.3% (n = 3) | 76.9% (n = 10) | 23.1% (n = 3) |
| Subject 3 | 80.0% (n = 12) | 20.0% (n = 3) | 40.0% (n = 2) | 60.0% (n = 3) |
| Mean ± SEM | 75.5 ± 1.5% (n = 67) | 24.5 ± 1.5% (n = 22) | 53.2 ± 8.3% (n = 27) | 46.8 ± 8.3% (n = 22) |
aVGluT2-only neurons (expressing VGluT2 mRNA but lacking TH immunoreactivity), VGluT2-TH neurons (coexpressing VGluT2 mRNA and TH immunoreactivity), or TH-only neurons (containing TH immunoreactivity but lacking VGluT2 mRNA) were counted in every 16th 5-μm-thick coronal section from three different rats (subjects 1–3) at the level of −5.28 mm from bregma. n, Number of counted neurons within each segment from a total of three sections, with each section from a different rat.
bNeurons were counted from the medial (border between the rostral linear nucleus, RLi, and the PBP) to the lateral aspects of the PBP within two segments (0–200 and 200–400 μm).
cNeurons were counted from the medial (border between the interfascicular nucleus, IF, and the PN) to the lateral aspects of the PN within a 0–200 μm segment.
Neurons expressing VGluT2 mRNA are present in each medial nuclei of the A10 region and most of them lack TH immunoreactivity
Neurons expressing VGluT2 mRNA were found in each medial nucleus of the A10 region (RLi, IF, and CLi). The VGluT2-only neurons constituted the major subpopulation of neurons expressing VGluT2 mRNA in each medial nucleus of A10 region (63–89% depending on the rostromedial level of the nucleus) (Tables 2–4; Fig. 4A–D). Conversely, the VGluT2-TH neurons were a minor neuronal subpopulation in the total population of VGluT2 mRNA-expressing neurons (12–37%) (Tables 2–4; Fig. 4A′–D′).
Table 2.
Frequency of neurons expressing VGluT2 mRNA containing or lacking TH immunoreactivity in the RLi
| Percentage of VGluT2-only neurons or VGluT2-TH neurons within the total population of VGluT2 mRNA-expressing neurons |
Percentage of TH-only neurons or VGluT2-TH neurons within the total population of TH-IR neurons |
|||
|---|---|---|---|---|
| VGluT2-only | VGluT2-TH neurons | TH-only neurons | VGluT2-TH neurons | |
| Bregma (in mm) | ||||
| −4.92 to −5.16 | ||||
| Subject 1 | 81.7% (n = 151) | 18.3% (n = 34) | 57.8% (n = 46) | 42.2% (n = 34) |
| Subject 2 | 76.0% (n = 178) | 24.0% (n = 56) | 32.9% (n = 29) | 67.1% (n = 56) |
| Subject 3 | 78.5% (n = 256) | 21.5% (n = 97) | 17.5% (n = 17) | 82.5% (n = 97) |
| Mean ± SEM | 78.7 ± 2.6% (n = 585) | 21.3 ± 2.6% (n = 187) | 36.1 ± 8.5% (n = 92) | 63.9 ± 8.5% (n = 187) |
| −5.28 to −5.52 | ||||
| Subject 1 | 71.0% (n = 230) | 29.0% (n = 91) | 38.7% (n = 58) | 61.3% (n = 91) |
| Subject 2 | 56.6% (n = 99) | 43.4% (n = 75) | 34.4% (n = 40) | 65.6% (n = 75) |
| Subject 3 | 65.0% (n = 89) | 35.0% (n = 48) | 40.1% (n = 35) | 59.9% (n = 48) |
| Mean ± SEM | 65.2% ± 3.6 (n = 418) | 34.8 ± 3.6% (n = 214) | 37.9 ± 4.4% (n = 133) | 62.1 ± 4.4% (n = 214) |
| −5.64 to −6.12 | ||||
| Subject 1 | 81.7% (n = 110) | 18.3% (n = 25) | 75.1% (n = 78) | 24.9% (n = 25) |
| Subject 2 | 74.0% (n = 114) | 26.0% (n = 42) | 62.8% (n = 63) | 37.2% (n = 42) |
| Subject 3 | 64.8% (n = 116) | 35.3% (n = 65) | 49.5% (n = 64) | 50.5% (n = 65) |
| Mean ± SEM | 73.5 ± 3.9% (n = 340) | 26.5 ± 3.9% (n = 132) | 62.5 ± 6.0% (n = 205) | 37.5 ± 6.0% (n = 132) |
VGluT2-only neurons (expressing VGluT2 mRNA but lacking TH immunoreactivity), VGluT2-TH neurons (coexpressing VGluT2 mRNA and TH immunoreactivity), or TH-only neurons (containing TH immunoreactivity but lacking VGluT2 mRNA) were counted in every 16th 5-μm-thick coronal section from three different rats (subjects 1–3). Cell counting was done at three different levels of the RLi: −4.92 to −5.16 mm from bregma (a total of 7 sections from 3 rats), −5.28 to −5.52 mm from bregma (a total of 7 sections from 3 rats), and −5.64 to −6.12 mm from bregma (a total of 9 sections from 3 rats). n, Counted neurons.
Table 3.
Frequency of neurons expressing VGluT2 mRNA containing or lacking TH immunoreactivity in the IF
| Percentage of VGluT2-only neurons or VGluT2-TH neurons within the total population of VGluT2 mRNA-expressing neurons |
Percentage of TH-only neurons or VGluT2-TH neurons within the total population of TH-IR neurons |
|||
|---|---|---|---|---|
| VGluT2-only neurons | VGluT2-TH neurons | TH-only neurons | VGluT2-TH neurons | |
| Bregma (in mm) | ||||
| −5.04 to −5.40 | ||||
| Subject 1 | 67.8% (n = 97) | 32.2% (n = 44) | 67.7% (n = 110) | 32.3% (n = 44) |
| Subject 2 | 58.7% (n = 66) | 41.3% (n = 46) | 55.3% (n = 58) | 44.7% (n = 46) |
| Subject 3 | 59.8% (n = 131) | 40.2% (n = 81) | 39.3% (n = 61) | 60.7% (n = 81) |
| Mean ± SEM | 63.1 ± 3.5% (n = 294) | 36.9 ± 3.5% (n = 171) | 55.5 ± 6.2% (n = 229) | 44.5 ± 6.2% (n = 171) |
| −5.52 to −5.88 | ||||
| Subject 1 | 80.2% (n = 133) | 19.8% (n = 45) | 84.5% (n = 207) | 15.5% (n = 45) |
| Subject 2 | 57.8% (n = 75) | 42.2% (n = 33) | 85.3% (n = 190) | 14.7% (n = 33) |
| Subject 3 | 81.6% (n = 165) | 18.4% (n = 36) | 87.9% (n = 241) | 12.1% (n = 36) |
| Mean ± SEM | 74.0 ± 5.8% (n = 373) | 26.0 ± 5.8% (n = 114) | 86.1 ± 2.8% (n = 638) | 13.9 ± 2.8% (n = 114) |
| −6.00 to −6.48 | ||||
| Subject 1 | 50.8% (n = 10) | 49.2% (n = 8) | 91.4% (n = 86) | 8.6% (n = 8) |
| Subject 2 | 71.3% (n = 26) | 28.7% (n = 11) | 91.0% (n = 98) | 9.0% (n = 11) |
| Subject 3 | 75.3% (n = 41) | 24.7% (n = 13) | 89.4% (n = 120) | 10.6% (n = 13) |
| Mean ± SEM | 67.7 ± 6.4% (n = 77) | 32.3 ± 6.4% (n = 32) | 90.5 ± 1.2% (n = 304) | 9.5 ± 1.2% (n = 32) |
VGluT2-only neurons (expressing VGluT2 mRNA but lacking TH immunoreactivity), VGluT2-TH neurons (coexpressing VGluT2 mRNA and TH immunoreactivity), or TH-only neurons (containing TH immunoreactivity but lacking VGluT2 mRNA) were counted in every 16th 5-μm-thick coronal section from three different rats (subjects 1–3). Cell counting was done at three different levels of the IF: −5.04 to −5.40 mm from bregma (a total of 11 sections from 3 rats), −5.52 to −5.88 mm from bregma (a total of 10 sections from 3 rats), and −6.00 to −6.48 mm from bregma (a total of 8 sections from 3 rats). n, Counted neurons.
Table 4.
Frequency of neurons expressing VGluT2 mRNA containing or lacking TH immunoreactivity in the CLi
| Percentage of VGluT2-only neurons or VGluT2-TH neurons within the total population of VGluT2 mRNA-expressing neurons |
Percentage of TH-only neurons or VGluT2-TH neurons within the total population of TH-IR neurons |
|||
|---|---|---|---|---|
| VGluT2-only neurons | VGluT2-TH neurons | TH-only neurons | VGluT2-TH neurons | |
| Bregma (in mm) | ||||
| −6.24 to −6.36 | ||||
| Subject 1 | 70.8% (n = 17) | 29.2% (n = 7) | 85.7% (n = 42) | 14.3% (n = 7) |
| Subject 2 | 77.8% (n = 35) | 22.2% (n = 10) | 81.1% (n = 43) | 18.9% (n = 10) |
| Subject 3 | 79.5% (n = 51) | 20.5% (n = 14) | 82.7% (n = 64) | 17.3% (n = 14) |
| Mean ± SEM | 76.9 ± 2.9% (n = 103) | 23.1 ± 2.9% (n = 31) | 83.0 ± 2.6% (n = 149) | 17.0 ± 2.6% (n = 31) |
| −6.48 | ||||
| Subject 1 | 74.5% (n = 41) | 25.5% (n = 14) | 82.5% (n = 66) | 17.5% (n = 14) |
| Subject 2 | 90.0% (n = 36) | 10.0% (n = 4) | 89.5% (n = 34) | 10.5% (n = 4) |
| Subject 3 | 82.1% (n = 32) | 18.0% (n = 7) | 86.3% (n = 44) | 13.7% (n = 7) |
| Mean ± SEM | 82.2 ± 4.5% (n = 109) | 17.8 ± 4.5% (n = 25) | 86.0 ± 2.0% (n = 144) | 14.0 ± 2.0% (n = 25) |
| −6.60 to −6.72 | ||||
| Subject 1 | 100% (n = 13) | 0% (n = 0) | 100% (n = 56) | 0% (n = 0) |
| Subject 2 | 86.7% (n = 65) | 13.3% (n = 10) | 91.0% (n = 101) | 9.0% (n = 10) |
| Subject 3 | 80.8% (n = 38) | 19.2% (n = 9) | 86.6% (n = 58) | 13.4% (n = 9) |
| Mean ± SEM | 88.5 ± 4.0% (n = 116) | 11.5 ± 4.0% (n = 19) | 92.2 ± 3.3% (n = 215) | 7.8 ± 3.3% (n = 19) |
VGluT2-only neurons (expressing VGluT2 mRNA but lacking TH immunoreactivity), VGluT2-TH neurons (coexpressing VGluT2 mRNA and TH immunoreactivity), or TH-only neurons (containing TH immunoreactivity but lacking VGluT2 mRNA) were counted in every 16th 5-μm-thick coronal section from three different rats (subjects 1–3). Cell counting was done at three different levels of the CLi: −6.24 to −6.36 mm from bregma (a total of 3 sections from 3 rats), −6.48 mm from bregma (a total of 3 sections from 3 rats), and −6.60 to −6.72 mm from bregma (a total of 4 sections from 3 rats). n, Counted neurons.
The VGluT2-TH neurons were also a minor neuronal subpopulation within the total population of TH-IR neurons (Tables 2–4) detected in the middle and caudal IF (10–14% VGluT2-TH; 86–90% TH only) and in the CLi (8–17% VGluT2-TH; 83–92% TH only). However, the VGluT2-TH neurons were a major neuronal subpopulation within the total population of TH-IR neurons found in the rostromedial aspects of the RLi (about 60% VGluT2-TH; 40% TH only) and at the rostral level of the IF (44.5% VGluT2-TH; 55.5% TH only). The differential distribution of VGluT2-only, VGluT2-TH, and TH-only neurons within each of the subdivisions of the A10 region (Figs. 4, 11A) underscores the cellular difference between the VTA proper (PBP and PN) and medial subdivisions of the A10 region.
Quantification of TH mRNA or VGluT2 mRNA present in individual microdissected TH-IR cells (qRT-PCR analysis)
To address whether lack of sensitivity by in situ hybridization could account for the lack of detection of VGluT2 mRNA in TH-IR cells within some subdivisions of the A10 region, we collected individual TH-IR cell profiles by UV-laser microdissection from coronal cryosections (Fig. 5A–B′). The copy numbers of either TH mRNA or VGluT2 mRNA were evaluated from every individual microdissected TH-IR cell profile using qRT-PCR amplification curves (Fig. 5C,D). Fifty TH-IR cell profiles were analyzed from the lateral portion of the PBP. All of them were confirmed to contain TH mRNA (142 ± 13 TH mRNA copy numbers) (Table 5), but coexpression of VGluT2 mRNA was detected in only three of these cells (14 ± 9 VGluT2 mRNA copy numbers). These findings confirmed the results obtained by in situ hybridization showing that the majority of TH cells within the lateral aspects of the PBP and PN do not coexpress VGluT2 mRNA.
Figure 5.

Quantification of the expression of TH or VGluT2 transcripts within individual TH-IR cells located in the A10 region (qRT-PCR analysis). A, A′, Low magnification of a 10-μm-thick coronal section incubated with anti-TH antibodies showing TH-IR cells before (A) or after (A′) microdissection. Rectangles in A and A′ indicate regions within the lateral PBP shown at higher magnification in B and B′, respectively. Arrows in B indicate the selected TH-IR neurons for microdissection, seen as black holes after microdissection (B′). Scale bar: (in B′) A, A′, 242 μm; B, B′, 50 μm. C, D, PCR amplification plots obtained for TH (C) or VGluT2 (D) detection from individual TH-IR neurons located in the lateral PBP. All single TH-IR cells in the lateral PBP (50 individual cells) showed detectable levels of TH mRNA (C). In contrast, most of these TH-IR cells lack VGluT2 mRNA amplification (D); VGluT2 mRNA was detected in only 3 of the 50 TH-IR tested cells. ΔRn, Changes in fluorescence.
Table 5.
Copy numbers of TH mRNA or VGluT2 mRNA present in individual TH-IR cell profiles distributed within the A10 regiona
| Coexpression of TH mRNA and VGluT2 mRNA in TH-IR microdissected cell profilesb | Percentage of neurons coexpressing VGluT2 mRNA and TH mRNA in the total population of TH-IR microdissected cell profiles (mean ± SEM) | TH mRNA copy numbers (mean ± SEM)c | VGluT2 mRNA copy numbers (mean ± SEM)d | |
|---|---|---|---|---|
| PBP(l) | Coexpression in 3 cells from a total of 50 TH-IR cells | 6.0 ± 2.8% | 142 ± 13 | 14 ± 9 |
| PBP(m) | Coexpression in 14 cells from a total of 32 TH-IR cells | 43.8 ± 2.5% | 222 ± 33 | 13 ± 1 |
| IF | Coexpression in 9 cells from a total of 38 TH-IR cells | 23.7 ± 2.1% | 96 ± 12 | 10 ± 2 |
| RLi | Coexpression in 18 cells from a total of 33 TH-IR cells | 54.5 ± 6.0% | 76 ± 12 | 8 ± 1 |
aTH-IR cell profiles from different subdivisions of the A10 region were microdissected from coronal cryosections (10 μm thick) from four rats. All cells collected from the medial region of the PBP [PBP(m)] were obtained at −5.28 mm from bregma. The copy numbers of TH mRNA or VGluT2 mRNA were evaluated by qRT-PCR for each microdissected TH-IR cell profile.
bThe coexpression of TH mRNA and VGluT2 mRNA was evaluated in each microdissected TH-IR cell profile confirmed to express TH mRNA.
cTH mRNA copy numbers were quantified by qRT-PCR using 5 μl of cDNA per assay from a total of 20 μl, obtained from each individual microdissected TH-IR cell profile. The average of TH mRNA copy numbers was calculated from the copy numbers detected in each individual assay, from a single cell profile.
dVGluT2 mRNA copy numbers were quantified by qRT-PCR using 5 μl of cDNA per assay from a total of 20 μl, obtained from each individual microdissected TH-IR cell profile. The average of VGluT2 mRNA copy numbers was calculated from the copy numbers detected in each individual assay, from a single cell profile. Note the large SEM in samples from the lateral portion of the PBP [PBP(l)] in which only 3 of 50 TH-IR cell profiles collected from four rats were found to coexpress TH mRNA and VGluT2 mRNA.
The qRT-PCR analysis further established that a population of TH-IR cells restricted to the medial subdivisions of the A10 region does coexpress VGluT2 mRNA. We analyzed 32 TH-IR cell profiles from the medial portion of the PBP (−5.28 mm from bregma); all of them contained TH mRNA (222 ± 33 TH mRNA copy numbers) (Table 5), and about half (43.8 ± 2.5%) coexpressed VGluT2 mRNA (13 ± 1 VGluT2 mRNA copy numbers). Thirty-eight TH-IR cell profiles were analyzed from the IF. All of them showed to contain TH mRNA (96 ± 12 TH mRNA copy numbers), but only a quarter coexpressed VGluT2 mRNA (10 ± 2 VGluT2 mRNA copy numbers). In contrast, about half of the TH-IR microdissected neurons from the RLi (54.5 ± 6.0%) coexpressed TH mRNA (76 ± 12 TH mRNA copy numbers) and VGluT2 mRNA (8 ± 1 VGluT2 mRNA copy numbers).
Therefore, within the total population of TH-IR neurons in the VTA and adjacent midline nuclei, the proportionality of VGluT2-TH neurons detected by qRT-PCR analysis of individual TH-IR microdissected neurons is similar to the proportionality of VGluT2-TH neurons found by in situ hybridization and immunohistochemistry.
The PFC and the nAcc receive inputs from VGluT2-only neurons and from VGluT2-TH neurons
As previous electrophysiological studies have shown that electrical stimulation of the VTA induces EPSCs in medium spiny neurons of the nAcc (Chuhma et al., 2009) or neurons in the PFC (Lavin et al., 2005), we next investigated whether either of the two subpopulations of VGluT2 neurons (VGluT2-only or VGluT2-TH neurons) within the A10 region innervate the PFC or the nAcc. Toward this end, we injected the retrograde tract tracer Fluoro-Gold into the PFC (Fig. 6A–E) or the nAcc (Fig. 6F–O) and used a combination of immunolabeling and in situ hybridization to phenotype the retrogradely labeled FG neurons.
Figure 6.

FG injection sites within the PFC or the nAcc. A–O, Schematic representation of FG injected sites within the PFC (four rats; A–E) or the nAcc (four rats; F–O). A–E are arranged rostrocaudally from 3.72 to 2.52 mm from bregma. F–O are arranged rostrocaudally from 2.52 to 1.28 mm from bregma. aca, Anterior commissure; Cg1, cingulate cortex area 1; CPu, caudate–putamen; fmi, forceps minor of the corpus callosum; IL, infralimbic cortex; PrL, prelimbic cortex.
FG-labeled cells from PFC injections were heterogeneously distributed within the A10 region (Table 6); most of them were located in the medial portions of the PBP (30.8%) and PN (14.5%) and in the IF (18.2%), with fewer cases in the RLi (8.9%) and the CLi (8.9%). We identified four different phenotypes of mesocortical neurons within the A10 region (Figs. 7, 8): mesocortical VGluT2-only neurons (FG-labeled cells expressing VGluT2 mRNA without TH immunoreactivity), mesocortical VGluT2-TH neurons (FG-labeled cells coexpressing VGluT2 mRNA and TH immunoreactivity), mesocortical TH-only neurons (FG-labeled cells lacking VGluT2 mRNA but expressing TH immunoreactivity), and mesocortical VGluT2-TH-negative neurons (cells lacking both VGluT2 and TH). The mesocortical VGluT2-only neurons were concentrated in the medial aspects of both the PBP and the PN, and in the IF (Fig. 8B); these areas had fewer mesocortical VGluT2-TH neurons (Fig. 8B′). The highest concentration of mesocortical VGluT2-TH neurons was in the caudal RLi (Fig. 8C). Within the total population of neurons from the A10 region targeting the PFC, 39.1% were VGluT2-only neurons, 27.1% were VGluT2-TH neurons, 24.1% were TH-only, and 9.7% were VGluT2-TH-negative neurons (Table 6; Fig. 11B). These results reveal a higher mesocortical input fromVGluT2-only neurons than from TH-only neurons.
Table 6.
Frequency of four different phenotypes of neurons within the A10 region projecting to either the PFC or the nAcca
| FG-IR neurons | VGluT2-only neurons | VGluT2-TH neurons | TH-only neurons | VGluT2-TH-negative neurons | |
|---|---|---|---|---|---|
| Phenotype of FG-IR neurons projecting to the PFC distributed in the different subdivisions of the A10 regionb | |||||
| VTAR | 11.3% (n = 68) | 9.1% (n = 55) | 0.3% (n = 2) | 0.7% (n = 4) | 1.2% (n = 7) |
| PBP | 30.8% (n = 187) | 9.1% (n = 55) | 8.2% (n = 50) | 9.4% (n = 57) | 4.1% (n = 25) |
| RLi | 8.9% (n = 54) | 4.1% (n = 25) | 4.0% (n = 24) | 0.8% (n = 5) | 0.0% (n = 0) |
| IF | 18.2% (n = 111) | 4.9% (n = 30) | 7.4% (n = 45) | 3.6% (n = 22) | 2.3% (n = 14) |
| PN | 14.5% (n = 88) | 9.4% (n = 57) | 2.3% (n = 14) | 2.0% (n = 12) | 0.8% (n = 5) |
| PIF | 7.4% (n = 45) | 2.0% (n = 12) | 1.6% (n = 10) | 3.5% (n = 21) | 0.3% (n = 2) |
| CLi | 8.9% (n = 54) | 0.5% (n = 3) | 3.3% (n = 20) | 4.1% (n = 25) | 1.0% (n = 6) |
| Total | 100% (n = 607) | 39.1% (n = 237) | 27.1% (n = 165) | 24.1% (n = 146) | 9.7% (n = 59) |
| Phenotype of FG-IR neurons projecting to the nAcc distributed in the different subdivisions of the A10 regionc | |||||
| VTAR | 1.6% (n = 126) | 0.3% (n = 26) | 0.3% (n = 20) | 0.9% (n = 72) | 0.1% (n = 8) |
| PBP | 35.4% (n = 2716) | 1.9% (n = 146) | 5.5% (n = 419) | 22.6% (n = 1736) | 5.4% (n = 415) |
| RLi | 7.4% (n = 566) | 2.1% (n = 162) | 3.5% (n = 265) | 1.3% (n = 101) | 0.5% (n = 38) |
| IF | 20.1% (n = 1546) | 2.6% (n = 198) | 8.9% (n = 686) | 7.3% (n = 561) | 1.3% (n = 101) |
| PN | 14.4% (n = 1105) | 0.7% (n = 54) | 3.8% (n = 293) | 8.6% (n = 660) | 1.3% (n = 98) |
| PIF | 16.5% (n = 1269) | 0.5% (n = 35) | 3.6% (n = 280) | 10.8% (n = 830) | 1.6% (n = 124) |
| CLi | 4.5% (n = 346) | 0.2% (n = 14) | 1.8% (n = 141) | 2.1% (n = 160) | 0.4% (n = 31) |
| Total | 100% (n = 7674) | 8.3% (n = 635) | 27.4% (n = 2104) | 53.6% (n = 4120) | 10.6% (n = 815) |
aCoronal sections (18 μm thick) from eight different rats injected with FG (4 rats injected in the PFC and 4 in the nAcc) were incubated with radioactive VGluT2 antisense riboprobe together with antibodies against FG or TH. Four different phenotypes of FG-immunoreactive (FG-IR) neurons were found: VGluT2-only neurons (expressing VGluT2 mRNA but lacking TH immunoreactivity), VGluT2-TH neurons (coexpressing VGluT2 mRNA and TH immunoreactivity), TH-only neurons (containing TH immunoreactivity but lacking VGluT2 mRNA), and VGluT2-TH negative neurons (lacking expression of both VGluT2 mRNA and TH immunoreactivity). n is the total number of FG neurons counted from four different rats.
bVentral tegmental area rostral (VTAR), 9 sections; PBP, 42 sections; RLi, 29 sections; IF, 36 sections; PN, 33 sections; parainterfascicular nucleus (PIF), 21 sections; CLi, 11 sections.
cVTAR, 6 sections; PBP, 57 sections; RLi, 43 sections; IF, 56 sections; PN, 52 sections; PIF, 35 sections; CLi, 15 sections.
Figure 7.
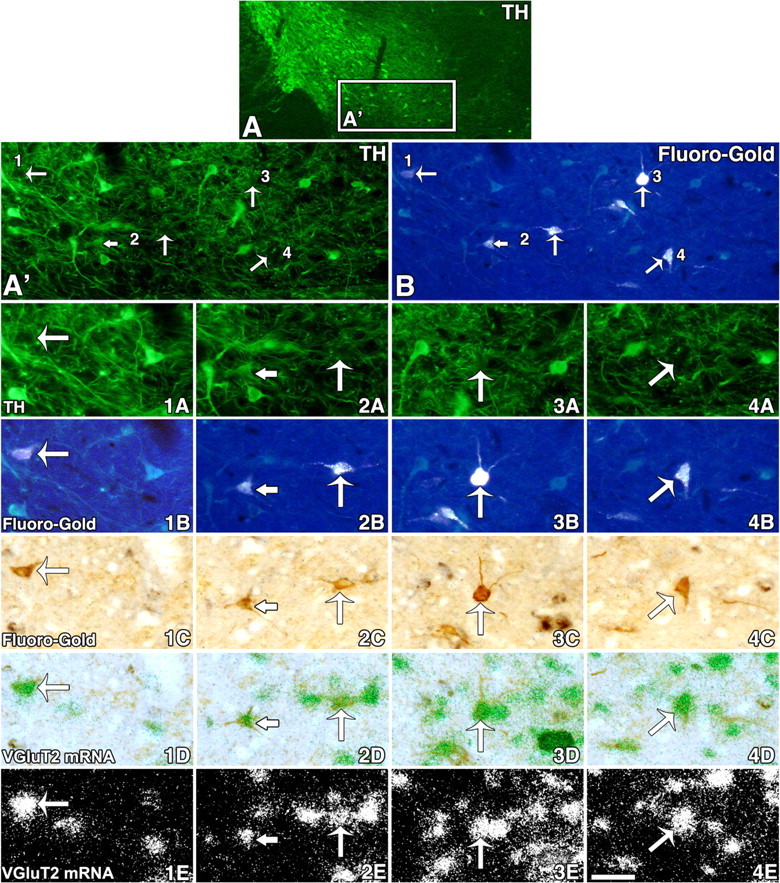
Two subpopulations of neurons expressing VGluT2 mRNA innervate the PFC. A, Low magnification of a coronal section (18 μm in thickness) from a rat injected with FG into the PFC. TH immunofluorescent is seen in cell bodies and fibers within the A10 region. A′ and B correspond to the same region delimited by a rectangle in A. The arrows in A′ (TH immunofluorescent) and B (fluorescent FG) indicate cells seen at higher magnification in 1A–4A (TH immunofluorescent), 1B–4B (fluorescent FG detection), 1C–4C (FG detection with an anti-FG antibody), 1D–4D (VGluT2 mRNA, aggregates of green grains), and 1E–4E (VGluT2 mRNA, aggregates of white grains). Long arrows in 1A–4E point to examples of four FG-labeled cells lacking TH immunoreactivity but containing VGluT2 mRNA. Note that in 2A the short arrow indicates a TH-IR neuron and the long arrow indicates a cell lacking TH; both cells contain FG (2B, 2C) and VGluT2 mRNA (2D, 2E). Scale bar: (in 4E) A, 275 μm; A′, B, 180 μm; 1A–4E, 40 μm.
Figure 8.
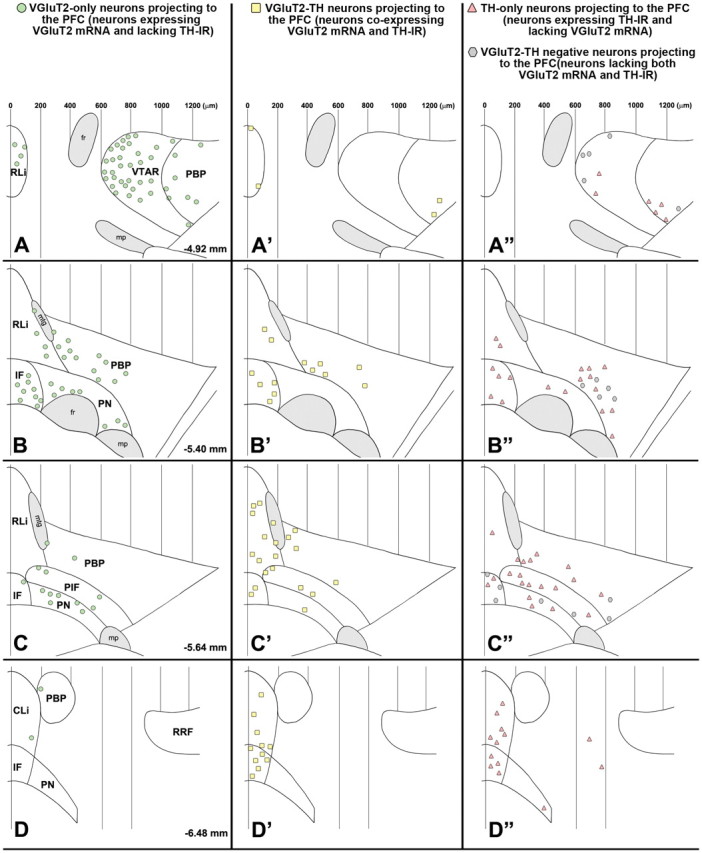
Summary diagram of the rostrocaudal and mediolateral distribution of four different phenotypes of mesocortical neurons. A–D, Mesocortical VGluT2-only neurons (FG-labeled neurons expressing VGluT2 mRNA but lacking TH immunoreactivity) with a decreasing rostrocaudal gradient of distribution. A′–D′, Mesocortical VGluT2-TH neurons (FG-labeled neurons coexpressing VGluT2 mRNA and TH immunoreactivity) are concentrated in the caudal aspects of both the RLi and the IF. A″–D″, Mesocortical TH-only neurons (FG-labeled neurons lacking expression of VGluT2 mRNA but containing TH immunoreactivity) are intermingled with mesocortical VGluT2-TH-negative neurons (FG-labeled neurons lacking both VGluT2 mRNA and TH immunoreactivity). The symbols in each panel represent the pool of FG-labeled neurons found in four brain sections, with each section selected from a different rat. mtg, Mammillotegmental tract; fr, fasciculus retroflexus; mp, mammillary peduncle; VTAR, ventral tegmental area rostral; RRF, retrorubral field.
FG-labeled neurons from nAcc injections were distributed in different subdivisions of the A10 region (Table 6). The highest concentration was in the PBP (35.4%), followed by the IF (20.1%) and the PN (14.4%). The lowest concentrations of FG-labeled cells were found in the RLi (7.4%) and the CLi (4.5%). In common with cells projecting to the PFC, we identified four different phenotypes of mesoaccumbal neurons (Figs. 9, 10): mesoaccumbal VGluT2-only neurons, mesoaccumbal VGluT2-TH neurons, mesoaccumbal TH-only neurons, and mesoaccumbal VGluT2-TH-negative neurons. The mesoaccumbal neurons expressing VGluT2 mRNA (with or without TH immunoreactivity) were clustered in the medial aspects of the A10 region (Fig. 10). In contrast, both the mesoaccumbal TH-only neurons and the mesoaccumbal VGluT2-TH-negative neurons had a mediolateral heterogeneous distribution in the A10 region (Fig. 10A″–D″). Within the total population of A10 region neurons targeting the nAcc (Table 6; Fig. 11B), half of them were mesoaccumbal TH-only cells (53.6%), about one-third were mesoaccumbal VGluT2-TH neurons (27.4%), less than one-tenth were mesoaccumbal VGluT2-only neurons (8.3%), and one-tenth were mesoaccumbal VGluT2-TH-negative neurons (10.6%). These results showed that most of the mesoaccumbal innervations were from TH neurons; these TH neurons had two different phenotypes.
Figure 9.

Two subpopulations of neurons expressing VGluT2 mRNA innervate the nAcc. A–D, Low magnification of coronal sections (18 μm thick) from a rat injected with FG into the nAcc. TH immunofluorescent in cell bodies and fibers (A, C) or FG-labeled cells (B, D). Boxed areas in A–D are shown in A′–D′, respectively, in which arrows indicate FG-labeled cells shown at higher magnification in 1A–6A (TH immunofluorescent), 1B–6B (FG fluorescent), 1C–6C (FG detection with an anti-FG antibody), 1D–6D (VGluT2 mRNA seen as aggregates of green grains), and 1E–6E (VGluT2 mRNA seen as aggregates of white grains). 1A–1E, A FG-labeled cell containing TH immunoreactivity and lacking VGluT2 mRNA (arrowheads). 2A–2E, A FG-labeled cell lacking TH immunoreactivity but containing VGluT2 mRNA (long arrows). 3A–3E, A FG-labeled cell lacking both TH and VGluT2 mRNA (double-headed arrows). 4A–4E, A FG-labeled cell with TH immunoreactivity and VGluT2 mRNA (short arrows). 5A–6E, FG-labeled cells lacking TH immunoreactivity but containing VGluT2 mRNA (long arrows). Scale bar: (in 6E) A–D, 258 μm; A′–D′, 80 μm; 1A–6E, 40 μm.
Figure 10.
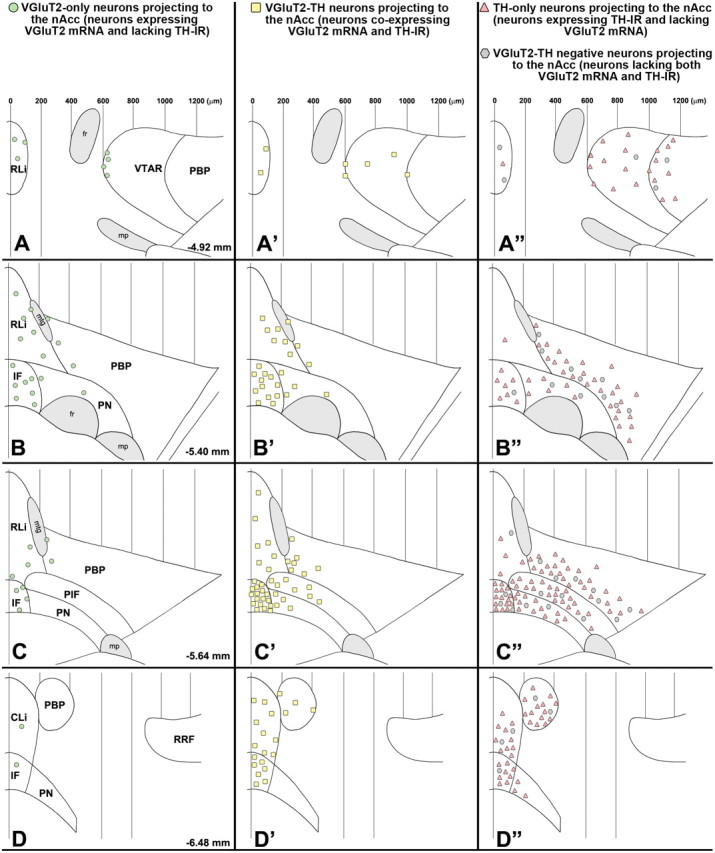
Summary diagram of the rostrocaudal and mediolateral distribution of four different phenotypes of mesoaccumbal neurons. A–D, Mesoaccumbal VGluT2-only neurons (FG-labeled neurons expressing VGluT2 mRNA but lacking TH immunoreactivity) are concentrated in the medial aspects of the A10 region. A′–D′, Mesoaccumbal VGluT2-TH neurons (FG-labeled neurons coexpressing VGluT2 mRNA and TH immunoreactivity) are clustered in the medial aspects of the A10 region, the RLi, CLi, and IF. A″–D″, Mesoaccumbal TH-only neurons (FG-labeled neurons lacking expression of VGluT2 mRNA but containing TH immunoreactivity) are intermingled with mesoaccumbal VGluT2-TH-negative neurons (FG-labeled neurons lacking both VGluT2 mRNA and TH immunoreactivity). The subpopulation of mesoaccumbal TH-only neurons has a more lateral distribution than the subpopulation of mesoaccumbal VGluT2-TH neurons. The symbols in each panel represent the average of cells found in brain sections of four different rats (8 sections for A, A″; 16 sections for B, B″; 22 sections for C, C″; 15 sections for D, D″). PIF, Parainterfascicular nucleus; mtg, mammillotegmental tract; fr, fasciculus retroflexus; mp, mammillary peduncle; VTAR, ventral tegmental area rostral; RRF, retrorubral field.
Discussion
This study identifies a glutamate mesocorticolimbic pathway—a pathway arising in the A10 region and projecting to the PFC and nAcc—that parallels the established DAergic and GABAergic pathways from the same region of origin to the same two major target regions. This glutamate pathway comprises two subpopulations of neurons: a subpopulation that expresses VGluT2 mRNA without TH (VGluT2-only neurons) and a subpopulation that coexpresses VGluT2 mRNA and TH (VGluT2-TH neurons). The PFC and the nAcc each receive inputs from VGluT2-only neurons and VGluT2-TH neurons from the VTA and midline A10 region.
We found a high prevalence of neurons expressing VGluT2 mRNA in each nucleus of the A10 region in mature rats. Neurons expressing VGluT2 mRNA are differentially distributed in the A10 region and fall into two neuronal subpopulations; a major subpopulation of neurons expressing VGluT2 mRNA but lacking TH (VGluT2-only neurons) with a lateromedial increasing gradient of distribution within the A10 region, and a smaller subpopulation of neurons coexpressing VGluT2 mRNA and TH (VGluT2-TH neurons) clustered in the medial aspects of the A10 region. Early findings indicated that with exception of the RLi, there is a low prevalence of VGluT2-TH neurons within the total population of TH neurons (Kawano et al., 2006). Unlike these early findings, we found by in situ hybridization and also by single-cell qRT-PCR that almost half of the TH neurons coexpress VGluT2 mRNA in the medial PBP, medial PN, RLi, and the rostral level of the IF. The differential distribution of VGluT2-only, VGluT2-TH, and TH-only neurons within the A10 region suggest (1) a differential compartmentalization of neurons with different signaling phenotype within the A10 region, (2) a major subpopulation of glutamate signaling neurons in the A10 region, and (3) a restricted high prevalence of TH neurons expressing VGluT2 in the medial aspects of the A10 region.
The roles of VGluT2-only neurons and VGluT2-TH neurons in brain function remain to be determined. A role for VGluT2 in vesicular DA filling in TH neurons has been proposed based on in vitro studies (Hnasko et al., 2010), and it has been suggested that lower levels of vesicular DA in knock-out mice depleted of VGluT2 in TH neurons might explain the attenuated locomotion induced by acute injections of cocaine or methamphetamine in these knock-out mice (Birgner et al., 2010; Hnasko et al., 2010). However, support for the coexistence of DA and VGLUT2 within the same synaptic terminal or within the same synaptic vesicle in vivo requires further investigation.
A mesocorticortical glutamate pathway from glutamate-only and glutamate-TH neurons
To successfully phenotype and quantify the glutamate-only and glutamate-TH neurons innervating the PFC or the nAcc, we implemented a novel multistep procedure that combined tracer deposit by iontophoretic application (to diminish tracer uptake by axons of passages or damage axons), use of radioactive riboprobes (to detect VGluT2 mRNA), and double immunohistochemistry (to detect TH neurons and be able to retrieve FG-containing cells after the loss of FG during the in situ hybridization procedure). By applying this experimental approach, we identified four classes of A10 neurons innervating the PFC and innervating the nAcc and found that the glutamatergic-only and the glutamatergic-DAergic neurons innervating the PFC or the nAcc are confined to the medial aspects of the A10 region. These results further support the view of neurochemical and functional differences between the lateral and medial aspects of the A10 region and strengthen the proposition that the PN and the PBP are regions of the VTA that, together with the RLi, the CLi, and the IF, comprise the A10 region (Swanson, 1982). An early study indicated the presence of VGluT2 neurons projecting to the PFC in the rat (Hur and Zaborszky, 2005). Here we show that two types of VGluT2 neurons (glutamate-only and glutamate-TH neurons) within the A10 region innervate the PFC. Thus, there exists a substantial mesocortical glutamate pathway in parallel to the well-known mesocortical DAergic and GABAergic pathways. Here, we show an unexpectedly higher mesocortical input from VGluT2-only neurons than from TH-only neurons. These anatomical findings together with previous findings showing EPSCs in the PFC after stimulation of the VTA (Lavin et al., 2005) indicate that in addition to the regulation of PFC activity by the DA mesocorticolimbic pathway, PFC activity is regulated by a glutamate mesocorticolimbic pathway from VGluT2 neurons distributed mostly in the medial aspects of the A10 region.
A mesolimbic glutamate pathway from glutamate-only and from glutamate-TH neurons
In common with the mesocortical pathway, we found that both glutamate-only and glutamate-TH neurons from the A10 region innervate the nAcc. However, most of the mesoaccumbal projections are from TH neurons, and as many as 34% of these TH neurons express VGluT2 mRNA. These findings, together with electrophysiological results showing EPSCs in nAcc spiny neurons after VTA electrical stimulation (Chuhma et al., 2009), provide evidence for a mesoaccumbal glutamatergic pathway that might be originated from VGluT2-only or VGluT2-TH neurons.
The glutamatergic signaling by TH neurons has been demonstrated recently by optogenetics methodology using transgenic mice (Stuber et al., 2010; Tecuapetla et al., 2010). In these optogenetic studies, the in vitro selective stimulation of afferents from TH neurons elicit EPSCs in all tested spiny neurons in nAcc slice preparations (Stuber et al., 2010; Tecuapetla et al., 2010); responses are no longer detected in slice preparations from conditional knock-out mice lacking VGluT2 in TH neurons (Stuber et al., 2010). The mechanism that mediates EPCS in all tested neurons in the nAcc slice preparations is unclear. Our findings from in vivo studies in the rat indicate that only a fraction of the TH mesoaccumbal neurons have VGluT2 mRNA. These findings, together with those from slice preparations, could be integrated by assuming that a single VGluT2-TH mesoaccumbal neuron affects multiple neurons in the nAcc. However, it remains to be determined whether (1) the VGluT2-TH mesoaccumbal pathway of the rat is similar to the one of the mouse; (2) a single VGluT2-TH mesoaccumbal neuron interacts with multiple neurons in the nAcc through highly arborized axons, as documented for nigrostriatal TH neurons (Matsuda et al., 2009); or (3) a single VGluT2-TH mesoaccumbal neuron interacts with a selective population of neurons in the nAcc that may affect the activation of other local neurons.
The corelease of glutamate and DA from TH neurons has been suggested from in vitro and in vivo findings (Sulzer et al., 1998; Bourque and Trudeau, 2000; Joyce and Rayport, 2000; Sulzer and Rayport, 2000; Chuhma et al., 2004, 2009; Stuber et al., 2010; Tecuapetla et al., 2010). However, anatomical evidence for the coexistence of glutamate neurotransmitter and DA at the synaptic level requires further investigation. For instance, ultrastructural studies have shown that VGLUT2-TH dual-labeled axon terminals, although present in the nAcc of immature rats, appear to be absent in the nAcc of adult rats (Bérube-Carriére et al., 2009). It remains uncertain whether this lack of TH/VGLUT2 terminals results from undetectable levels of TH in VGLUT2-positive terminals or undetectable levels of VGLUT2 in TH-positive terminals. In this regard, we found by qRT-PCR that TH-only neurons and VGluT2-TH neurons have similar amounts of TH mRNA. Thus, it seems unlikely that lack of TH detection in VGLUT2 terminals making asymmetric synapses, but not in TH terminals making symmetric synapses, results from lower levels of TH transcripts. Asymmetric synapses have been traditionally associated with excitatory synapses, and indeed almost all VGLUT2 terminals make asymmetric synapses in different brain areas. So, even though lower levels of VGLUT2 protein may exist in TH terminals in the nAcc, this does not necessary explain the well-documented infrequent occurrence of TH-asymmetric synapses in the rat nAcc (Arluison et al., 1984; Bouyer et al., 1984; Voorn et al., 1986). As an alternative, lack of coexistence of VGLUT2 and TH within the same axon terminal may be explained by a segregation of VGLUT2 terminals and TH terminals from a common VGluT2-TH neuron. A segregation of glutamatergic and DAergic terminals appears to occur in cultured DA neurons (Sulzer et al., 1998; Joyce and Rayport, 2000). We speculate that if VGluT2-TH neurons have the capability to segregate TH and VGluT2 into different processes, this may result in the dendritic production and release of DA within the VTA, but vesicular glutamate accumulation and synaptic release in target areas, such as the nAcc.
Conclusion
VGluT2 neurons are present in each subdivision of the A10 region and may provide fast non-DA excitatory mesocorticolimbic signaling. The A10 region contains two classes of VGluT2 neurons: VGluT2 neurons lacking TH (glutamate-only neurons), which are present in all subdivisions of the A10 region, and VGluT2 neurons coexpressing TH (glutamate-TH neurons), which are restricted to the medial portions of the A10 region. Both classes of A10-glutamate neurons innervate the PFC and the nAcc; thus, we propose that in addition to the well-recognized mesocorticolimbic DA-only and GABA-only pathways, there exist parallel mesocorticolimbic glutamate-only and glutamate-DA pathways. Our documentation of mesocorticolimbic glutamate pathways in the adult rat may provide the theoretical background to experimentally advance the suggestion that glutamatergic signaling from the VTA may play a role in a fast neurotransmission of salient stimuli (Lapish et al., 2006, 2007).
Footnotes
This work was supported by the Intramural Research Program of the National Institute on Drug Abuse. We thank Dr. Roy Wise for discussions.
References
- Arluison M, Dietl M, Thibault J. Ultrastructural morphology of dopaminergic nerve terminals and synapses in the striatum of the rat using tyrosine hydroxylase immunocytochemistry: a topographical study. Brain Res Bull. 1984;13:269–285. doi: 10.1016/0361-9230(84)90128-x. [DOI] [PubMed] [Google Scholar]
- Bérube-Carriére N, Riad M, Dal Bo G, Levesque D, Trudeau LE, Descarries L. The dual dopamine-glutamate phenotype of growing mesencephalic neurons regresses in mature rat brain. J Comp Neurol. 2009;517:873–891. doi: 10.1002/cne.22194. [DOI] [PubMed] [Google Scholar]
- Birgner C, Nordenankar K, Lundblad M, Mendez JA, Smith C, le Greves M, Galter D, Olson L, Fredriksson A, Trudeau LE, Kullander K, Wallen-Mackenzie A. VGLUT2 in dopamine neurons is required for psychostimulant-induced behavioral activation. Proc Natl Acad Sci U S A. 2010;107:389–394. doi: 10.1073/pnas.0910986107. [DOI] [PMC free article] [PubMed] [Google Scholar]
- Bourque MJ, Trudeau LE. GDNF enhances the synaptic efficacy of dopaminergic neurons in culture. Eur J Neurosci. 2000;12:3172–3180. doi: 10.1046/j.1460-9568.2000.00219.x. [DOI] [PubMed] [Google Scholar]
- Bouyer JJ, Joh TH, Pickel VM. Ultrastructural localization of tyrosine hydroxylase in rat nucleus accumbens. J Comp Neurol. 1984;227:92–103. doi: 10.1002/cne.902270110. [DOI] [PubMed] [Google Scholar]
- Carr DB, Sesack SR. GABA-containing neurons in the rat ventral tegmental area project to the prefrontal cortex. Synapse. 2000;38:114–123. doi: 10.1002/1098-2396(200011)38:2<114::AID-SYN2>3.0.CO;2-R. [DOI] [PubMed] [Google Scholar]
- Chuhma N, Zhang H, Masson J, Zhuang X, Sulzer D, Hen R, Rayport S. Dopamine neurons mediate a fast excitatory signal via their glutamatergic synapses. J Neurosci. 2004;24:972–981. doi: 10.1523/JNEUROSCI.4317-03.2004. [DOI] [PMC free article] [PubMed] [Google Scholar]
- Chuhma N, Choi WY, Mingote S, Rayport S. Dopamine neuron glutamate cotransmission: frequency-dependent modulation in the mesoventromedial projection. Neuroscience. 2009;164:1068–1083. doi: 10.1016/j.neuroscience.2009.08.057. [DOI] [PMC free article] [PubMed] [Google Scholar]
- Dobi A, Margolis EB, Wang HL, Harvey BK, Morales M. Glutamatergic and nonglutamatergic neurons of the ventral tegmental area establish local synaptic contacts with dopaminergic and nondopaminergic neurons. J Neurosci. 2010;30:218–229. doi: 10.1523/JNEUROSCI.3884-09.2010. [DOI] [PMC free article] [PubMed] [Google Scholar]
- German DC, Manaye KF. Midbrain dopaminergic neurons (nuclei A8, A9, and A10): three-dimensional reconstruction in the rat. J Comp Neurol. 1993;331:297–309. doi: 10.1002/cne.903310302. [DOI] [PubMed] [Google Scholar]
- Halliday GM, Törk I. Comparative anatomy of the ventromedial mesencephalic tegmentum in the rat, cat, monkey and human. J Comp Neurol. 1986;252:423–445. doi: 10.1002/cne.902520402. [DOI] [PubMed] [Google Scholar]
- Hnasko TS, Chuhma N, Zhang H, Goh GY, Sulzer D, Palmiter RD, Rayport S, Edwards RH. Vesicular glutamate transport promotes dopamine storage and glutamate corelease in vivo. Neuron. 2010;65:643–656. doi: 10.1016/j.neuron.2010.02.012. [DOI] [PMC free article] [PubMed] [Google Scholar]
- Hur EE, Zaborszky L. VGluT2 afferents to the medial prefrontal and primary somatosensory cortices: a combined retrograde tracing in situ hybridization study [corrected] J Comp Neurol. 2005;483:351–373. doi: 10.1002/cne.20444. [DOI] [PubMed] [Google Scholar]
- Johnson SW, North RA. Opioids excite dopamine neurons by hyperpolarization of local interneurons. J Neurosci. 1992;12:483–488. doi: 10.1523/JNEUROSCI.12-02-00483.1992. [DOI] [PMC free article] [PubMed] [Google Scholar]
- Joyce MP, Rayport S. Mesoaccumbens dopamine neuron synapses reconstructed in vitro are glutamatergic. Neuroscience. 2000;99:445–456. doi: 10.1016/s0306-4522(00)00219-0. [DOI] [PubMed] [Google Scholar]
- Kawano M, Kawasaki A, Sakata-Haga H, Fukui Y, Kawano H, Nogami H, Hisano S. Particular subpopulations of midbrain and hypothalamic dopamine neurons express vesicular glutamate transporter 2 in the rat brain. J Comp Neurol. 2006;498:581–592. doi: 10.1002/cne.21054. [DOI] [PubMed] [Google Scholar]
- Lapish CC, Seamans JK, Chandler LJ. Glutamate-dopamine cotransmission and reward processing in addiction. Alcohol Clin Exp Res. 2006;30:1451–1465. doi: 10.1111/j.1530-0277.2006.00176.x. [DOI] [PubMed] [Google Scholar]
- Lapish CC, Kroener S, Durstewitz D, Lavin A, Seamans JK. The ability of the mesocortical dopamine system to operate in distinct temporal modes. Psychopharmacology (Berl) 2007;191:609–625. doi: 10.1007/s00213-006-0527-8. [DOI] [PMC free article] [PubMed] [Google Scholar]
- Lavin A, Nogueira L, Lapish CC, Wightman RM, Phillips PE, Seamans JK. Mesocortical dopamine neurons operate in distinct temporal domains using multimodal signaling. J Neurosci. 2005;25:5013–5023. doi: 10.1523/JNEUROSCI.0557-05.2005. [DOI] [PMC free article] [PubMed] [Google Scholar]
- Matsuda W, Furuta T, Nakamura KC, Hioki H, Fujiyama F, Arai R, Kaneko T. Single nigrostriatal dopaminergic neurons form widely spread and highly dense axonal arborizations in the neostriatum. J Neurosci. 2009;29:444–453. doi: 10.1523/JNEUROSCI.4029-08.2009. [DOI] [PMC free article] [PubMed] [Google Scholar]
- Morales M, Wang SD. Differential composition of 5-hydroxytryptamine3 receptors synthesized in the rat CNS and peripheral nervous system. J Neurosci. 2002;22:6732–6741. doi: 10.1523/JNEUROSCI.22-15-06732.2002. [DOI] [PMC free article] [PubMed] [Google Scholar]
- Nair-Roberts RG, Chatelain-Badie SD, Benson E, White-Cooper H, Bolam JP, Ungless MA. Stereological estimates of dopaminergic, GABAergic and glutamatergic neurons in the ventral tegmental area, substantia nigra and retrorubral field in the rat. Neuroscience. 2008;152:1024–1031. doi: 10.1016/j.neuroscience.2008.01.046. [DOI] [PMC free article] [PubMed] [Google Scholar]
- Omelchenko N, Sesack SR. Ultrastructural analysis of local collaterals of rat ventral tegmental area neurons: GABA phenotype and synapses onto dopamine and GABA cells. Synapse. 2009;63:895–906. doi: 10.1002/syn.20668. [DOI] [PMC free article] [PubMed] [Google Scholar]
- Paxinos G, Watson C. The rat brain in stereotaxic coordinates. 6th Ed. Amsterdam: Academic/Elsevier; 2007. [Google Scholar]
- Phillipson OT. The cytoarchitecture of the interfascicular nucleus and ventral tegmental area of Tsai in the rat. J Comp Neurol. 1979a;187:85–98. doi: 10.1002/cne.901870106. [DOI] [PubMed] [Google Scholar]
- Phillipson OT. A Golgi study of the ventral tegmental area of Tsai and interfascicular nucleus in the rat. J Comp Neurol. 1979b;187:99–115. doi: 10.1002/cne.901870107. [DOI] [PubMed] [Google Scholar]
- Sanna PP, King AR, van der Stap LD, Repunte-Canonigo V. Gene profiling of laser-microdissected brain regions and sub-regions. Brain Res Brain Res Protoc. 2005;15:66–74. doi: 10.1016/j.brainresprot.2005.04.002. [DOI] [PubMed] [Google Scholar]
- Stuber GD, Hnasko TS, Britt JP, Edwards RH, Bonci A. Dopaminergic terminals in the nucleus accumbens but not the dorsal striatum corelease glutamate. J Neurosci. 2010;30:8229–8233. doi: 10.1523/JNEUROSCI.1754-10.2010. [DOI] [PMC free article] [PubMed] [Google Scholar]
- Sulzer D, Rayport S. Dale's principle and glutamate corelease from ventral midbrain dopamine neurons. Amino Acids. 2000;19:45–52. doi: 10.1007/s007260070032. [DOI] [PubMed] [Google Scholar]
- Sulzer D, Joyce MP, Lin L, Geldwert D, Haber SN, Hattori T, Rayport S. Dopamine neurons make glutamatergic synapses in vitro. J Neurosci. 1998;18:4588–4602. doi: 10.1523/JNEUROSCI.18-12-04588.1998. [DOI] [PMC free article] [PubMed] [Google Scholar]
- Swanson LW. The projections of the ventral tegmental area and adjacent regions: a combined fluorescent retrograde tracer and immunofluorescence study in the rat. Brain Res Bull. 1982;9:321–353. doi: 10.1016/0361-9230(82)90145-9. [DOI] [PubMed] [Google Scholar]
- Tagliaferro P, Morales M. Synapses between corticotropin-releasing factor-containing axon terminals and dopaminergic neurons in the ventral tegmental area are predominantly glutamatergic. J Comp Neurol. 2008;506:616–626. doi: 10.1002/cne.21576. [DOI] [PMC free article] [PubMed] [Google Scholar]
- Tecuapetla F, Patel JC, Xenias H, English D, Tadros I, Shah F, Berlin J, Deisseroth K, Rice ME, Tepper JM, Koos T. Glutamatergic signaling by mesolimbic dopamine neurons in the nucleus accumbens. J Neurosci. 2010;30:7105–7110. doi: 10.1523/JNEUROSCI.0265-10.2010. [DOI] [PMC free article] [PubMed] [Google Scholar]
- Van Bockstaele EJ, Pickel VM. GABA-containing neurons in the ventral tegmental area project to the nucleus accumbens in rat brain. Brain Res. 1995;682:215–221. doi: 10.1016/0006-8993(95)00334-m. [DOI] [PubMed] [Google Scholar]
- Voorn P, Jorritsma-Byham B, Van Dijk C, Buijs RM. The dopaminergic innervation of the ventral striatum in the rat: a light- and electron-microscopical study with antibodies against dopamine. J Comp Neurol. 1986;251:84–99. doi: 10.1002/cne.902510106. [DOI] [PubMed] [Google Scholar]
- Wang HL, Morales M. Corticotropin-releasing factor binding protein within the ventral tegmental area is expressed in a subset of dopaminergic neurons. J Comp Neurol. 2008;509:302–318. doi: 10.1002/cne.21751. [DOI] [PMC free article] [PubMed] [Google Scholar]
- Yamaguchi T, Sheen W, Morales M. Glutamatergic neurons are present in the rat ventral tegmental area. Eur J Neurosci. 2007;25:106–118. doi: 10.1111/j.1460-9568.2006.05263.x. [DOI] [PMC free article] [PubMed] [Google Scholar]