

Abstract
The degree to which spatial and feature-based attention are governed by similar control mechanisms is not clear. To explore this issue, I measured, during conditions of spatial or feature-based attention, activity in the human subcortical visual nuclei, which have precise retinotopic maps and are known to play important roles in the regulation of spatial attention but have limited selectivity of nonspatial features. Subjects attended to and detected changes in separate fields of moving or colored dots. When the fields were disjoint, spatially attending to one field enhanced hemodynamic responses in the superior colliculus (SC), lateral geniculate nucleus (LGN), and two retinotopic pulvinar nuclei. When the two dot fields were spatially overlapping, feature-based attention to the moving versus colored dots enhanced responses in the pulvinar nuclei and the majority of the LGN, including the magnocellular layers, and suppressed activity in some areas within the parvocellular layers; the SC was inconsistently modulated among subjects. The results demonstrate that feature-based attention operates throughout the visual system by prioritizing neurons encoding the attended information, including broadly tuned thalamic neurons. I conclude that spatial and feature-based attention operate via a common principle, but that spatial location is a special feature in that it is widely encoded in the brain, is used for overt orienting, and uses a specialized structure, the SC.
Introduction
Attention allows us to preferentially process visual stimuli in restricted regions of space or with specific features, such as orientation, direction of motion, or color (Maunsell and Treue, 2006). It is not known whether spatial location is fundamentally unique or is attended like other features via a common but independent mechanism (David et al., 2008; Hayden and Gallant, 2009). Unlike spatial attention, feature-based attention seems to be purely goal driven without a stimulus-driven component (Hayden and Gallant, 2005; Egner et al., 2008; Shibata et al., 2008), but distinct neural mechanisms have been difficult to distinguish. Spatial attention increases the response gain of all neurons encoding the attended location (McAdams and Maunsell, 1999; Treue and Martínez Trujillo, 1999), and feature-based attention likewise increases the response gain of neurons globally (Saenz et al., 2002, 2003; Boynton et al., 2006; Serences and Boynton, 2007) depending on their feature preferences (Treue and Martínez Trujillo, 1999). Transient activity in the same or neighboring regions of parietal cortex mediates the switching of attention between objects or spatial regions (Wojciulik and Kanwisher, 1999; Liu et al., 2003; Yantis and Serences, 2003), although spatial attention tends to dominate (Giesbrecht et al., 2003).
Because the frontoparietal network may generalize over multiple dimensions (Shulman et al., 2002), any distinct attentional mechanisms more likely would be observed in the feature-restricted subcortex. The retinotopic subcortical visual nuclei—the superior colliculus (SC), the lateral geniculate nucleus (LGN), and two pulvinar nuclei—are highly spatial selective (Allman et al., 1972; Cynader and Berman, 1972; Goldberg and Wurtz, 1972; Malpeli and Baker, 1975; Bender, 1981; Benevento and Standage, 1983; Cusick et al., 1993; Schneider et al., 2004; Schneider and Kastner, 2005, 2009), but their nonspatial feature selectivity varies: neurons in the superficial layers of the SC respond well to many stimuli largely independent of contrast, orientation, size, shape, or velocity (Humphrey, 1968; Schiller and Koerner, 1971; Cynader and Berman, 1972; Goldberg and Wurtz, 1972; Schiller and Stryker, 1972; Marrocco and Li, 1977); LGN neurons are segregated into layers of monochromatic and quickly adapting magnocellular neurons and chromatic and more sustained parvocellular neurons (Wiesel and Hubel, 1966; Dreher et al., 1976; Creutzfeldt et al., 1979; Shapley et al., 1981; Derrington and Lennie, 1984; Merigan and Maunsell, 1993; Schneider et al., 2004; Solomon et al., 2004); and pulvinar neurons encode features such as direction of motion and orientation (Mathers and Rapisardi, 1973; Gattass et al., 1979; Benevento and Miller, 1981; Bender, 1982; Petersen et al., 1985; Merabet et al., 1998; Casanova et al., 2001).
Spatial attention modulates activity in the SC (Robinson and Kertzman, 1995; Gattass and Desimone, 1996; Kustov and Robinson, 1996; Bell et al., 2004; Fecteau et al., 2004; Ignashchenkova et al., 2004; Lee and Keller, 2006; Schneider and Kastner, 2009), LGN (O'Connor et al., 2002; McAlonan et al., 2008; Schneider and Kastner, 2009) and pulvinar (LaBerge and Buchsbaum, 1990; Bender and Youakim, 2001; Kastner et al., 2004; Smith et al., 2009). Although feature-based attention has not been observed subcortically, it operates on feedforward information as early as does spatial attention (Zhang and Luck, 2009), which affects the earliest LGN responses (McAlonan et al., 2008). I hypothesized that attention to a feature should enhance the activity of subcortical neurons according to their selectivity for that feature; the SC should not be modulated by nonspatial attention.
Materials and Methods
Subjects.
Eleven subjects participated in the study, which was approved by the Research Subjects Review Board at the University of Rochester. The data from one additional subject could not be used because of excessive head motion that defeated the registration procedure. All subjects (19–23 years old, 6 men) were in good health with no past history of neurological disorders, gave their informed written consent, and were paid for their participation. Subjects had normal or corrected-to-normal visual acuity. Each subject participated in two scanning sessions, one for each experiment. In addition, eight of the subjects participated in a behavioral experiment to record their eye positions while performing the task from experiment 2.
Display and response hardware.
The stimuli were generated on a Macintosh Powerbook G4 computer (Apple) using Matlab software (The Mathworks) and Psychophysics Toolbox 3 functions (Brainard, 1997; Pelli, 1997) and were projected with a frame rate of 60 Hz from a JVC DLA-SX21 LCD projector (JVC Americas) outside the scanner room onto a translucent screen located at the end of the scanner bore. Subjects viewed the screen at a total path length of 85 cm through a mirror attached to the head coil. The screen subtended 37° of visual angle horizontally and 29° vertically. A Rowland USB response box system (Rowland Institute of Science) was used to collect subject responses. A trigger pulse from the scanner, which was translated into a key press by the response box, was used to synchronize the start of the stimulus presentation to the beginning of the image acquisition.
Visual stimuli and procedure.
Two separate experiments were conducted, each using stimuli consisting of two independent fields of dots, which were designed to evoke different levels of activation within each structure of interest. In experiment 1, the two dot fields were disjoint such that selection by spatial attention was possible; in experiment 2, the two dot fields overlapped such that spatial selection was not possible. One of the dot fields contained moving dots, a fraction of which moved coherently. The other dot field contained static dots, with each dot moving through color space. The task of the subjects was to detect intermittent events that occurred in the stimuli—a change in the direction of coherent motion or a convergence of some fraction of the dots to the same color.
In experiment 1, the dots were confined to two opposing angular segments of the visual field, comprising a bow tie-shaped pattern that rotated about the fixation point, as shown in Figure 1a. Together, the segments spanned approximately the central 30° of the visual field. The subjects were instructed to maintain fixation on a central fixation point for the duration of each scanning run. Subjects covertly tracked one of the two dot fields and detected the change event in that field while ignoring the other. This experiment was designed to measure the retinotopy, stimulus preferences, and modulations by spatial attention for each nucleus.
Figure 1.
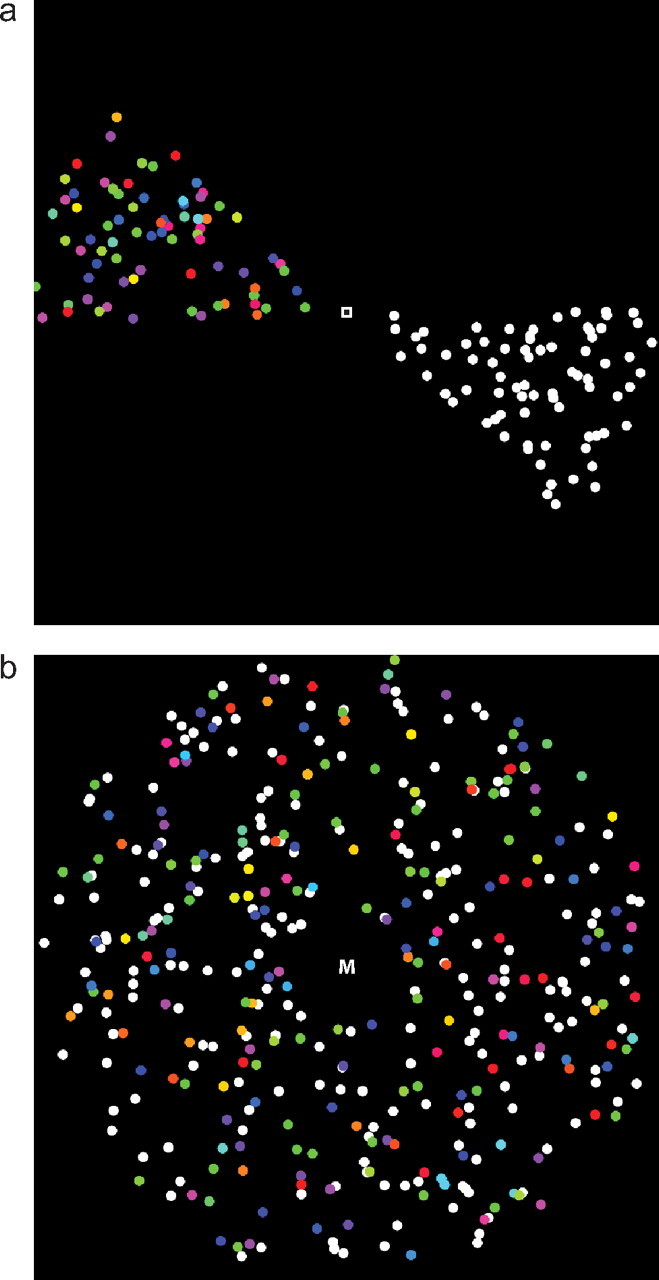
Visual stimuli. Single frames of the stimuli are shown. a, Experiment 1. The segments rotated clockwise around the fixation point with a period of 40 s. In one of the segments, the dots were white and moving, a fraction of the dots in a coherent direction. In the other segment, the dots were static but cycling through color space. The subjects fixated, covertly attended to one of the segments, and detected either changes in the coherence direction in the moving dot field or a convergence of the color of a fraction of the dots in the colored dot field. b, Experiment 2. The dot fields were the same as in experiment 1, but they overlapped in the visual field. The subjects fixated and performed the same detection task as in experiment 1 and were instructed which field to attend to by a character at fixation, which alternated between M (moving dots) and C (colored dots) every 20 s.
One of the two bow tie segments was composed of 500 0.1° white dots moving with a speed of 7°/s on a black background. On each video frame, 10% of the dots would disappear and be redrawn in a random location within the segment such that any dot had an average lifetime of 10 frames or 167 ms. A dot disappeared and was redrawn in a random position on reaching the boundaries of the segment. The segment boundaries were constantly changing as the segment rotated counterclockwise around the fixation point with a period of 40 s for seven cycles. A fraction of the dots was moving in a coherent direction, and the remaining dots moved in random directions. Every 3–4 s, the coherent dots would change directions by a random angle. The task of the subject, while fixating, was to press a key on detection of each change in the direction of coherence. The difficulty of the task was adjusted for each subject by varying the fraction of coherently moving dots; all subjects were scanned with a coherence of 50–90% to achieve a detection rate of ∼75%.
The second of the two bow tie segments consisted of 500 0.1° static dots appearing along the leading edge of the segment and disappearing along the trailing edge. They moved periodically through color space with a period of 1 s. The phases of the color oscillations were random such that no single color dominated. Every 3–4 s, the dots would begin to converge to a uniform color. This was accomplished by halting the color oscillation for dots that obtained the desired color. The uniform color was sustained for 350–800 ms, corresponding to a maximum color coherence of 35–80%, at which point the dots would reverse their color oscillations and diverge to their random phases. The task of the subject, while fixating, was to press a key on detection of a color convergence event. The difficulty of the task was adjusted on each scanning run for each subject and to achieve a detection rate of ∼75% by varying the duration of the sustained color period and thus the fraction of dots that would achieve the uniform color.
In experiment 2, the moving and static colored dots were overlapping (Valdés-Sosa et al., 2000; Reynolds and Desimone, 2003; Müller et al., 2006; Fallah et al., 2007; Liu et al., 2007; Wang et al., 2007; Shibata et al., 2008), randomly distributed throughout the visual field in an annulus ranging from 1° to 15° from fixation, as shown in Figure 1b. Each set consisted of 1800 dots, and the change events between the two fields were asynchronous. The fixation point was a letter M or C, directing the subjects to pay attention to the moving or colored dots, respectively, and the subjects were instructed to detect the changes in the attended dot field while ignoring the other. Key presses following a change within 1.5 s were recorded as correct; other key presses were recorded as false alarms. The letter at fixation alternated every 20 s for a total of seven cycles. For each subject, the difficulty of the detection tasks for the color and motion blocks was independently adjusted on each scanning run as in the spatial experiment to achieve a detection rate of ∼75%; across subjects, the motion coherence was 15–85% and the color coherence was 30–90%. To compute the mean detection probability across subjects (Fig. 2), I folded the times of each of the stimulus events into a single stimulus period, and I smoothed the associated binary hit and miss data with a polynomial.
Figure 2.

Detection probability. The probability of detection of an event in experiment 2 at a given time during the stimulus cycle is plotted as a mean across subjects. During the first 20 s of each cycle, subjects attended to the moving dots and detected changes in the direction or motion coherence. During the second 20 s of each cycle, subjects attended to the colored dots and detected color convergences.
Eye tracking.
In a behavioral control experiment, eye movements were monitored outside the scanner during five runs of the stimuli used in experiment 2. The stimuli were displayed on a ViewSonic P220 CRT monitor with a refresh rate of 85 Hz. While the subjects performed the task, their horizontal and vertical eye positions and pupil diameter were measured at 60 Hz with an ASL 501 eye tracker with a Series 6000 control unit (Applied Science Laboratories). This system has a relative resolution better than 1°. The correspondence between eye position and location on the screen was calibrated at the start of the experiment using nine known locations. Eye blinks were inferred from the characteristic periods of pupil data loss, and the eye position data surrounding blinks and other signal dropouts were excluded from the analysis. I calculated mean eye velocity by adding the distance between the recorded eye positions at each sequential pair of nonblink sampling points and dividing by the total time. This measurement is therefore very sensitive to high-frequency instrumental noise.
Data acquisition.
Data were acquired with a 3 T Trio MRI scanner (Siemens) using an eight-channel phase-array coil. Ten series of 140 volumes each were acquired during each session. In experiment 1, the run types were interleaved, with the subjects attending to the moving dot field in five of the runs and the colored dot field in the other five runs. Each volume was composed of 18 interleaved coronal slices (2 mm thick with no gap between slices) sampled with a gradient echo, echo-planar sequence with a 128 square matrix and 192 mm FOV leading to an in-plane resolution of 1.5 mm × 1.5 mm (TR = 2 s, TE = 42 ms, flip angle = 90°, bandwidth = 752 Hz/pixel). A partial Fourier factor of 7/8 was used to acquire an asymmetric fraction of k-space to reduce the acquisition time, and parallel imaging (GRAPPA) was used with an acceleration factor of 2×. The posterior edge of the acquisition volume was aligned in the midsagittal plane several slices behind the posterior edge of the SC to cover the posterior thalamus. Echo-planar images were compared with a coaligned high-resolution (1 mm3) anatomical scan of the same subject's brain taken at the beginning of the session (spin echo, TR = 685 ms, TE = 8.6 ms, flip angle = 75°, 256 × 256 matrix, 2 averages, acceleration factor = 2×). The subjects' heads were restrained with padded pistons to reduce movements.
Data analysis.
To compensate for subject head movement and scanner drift during and among the different scanning runs and sessions, I registered all volumes acquired in each experiment and scanning run (Jenkinson et al., 2002) to the same volume acquired at the beginning of the spatial experiment. I was careful to position the acquisition FOV in very similar locations across different scanning sessions to facilitate intersession registration; when necessary, an initial estimate was provided to the registration algorithm through registration of the intersession structural images. During the registration procedure, each volume was upsampled to twice the resolution in each spatial dimension. For each voxel in the volume, the linear trend in the fMRI time series was subtracted and the time series was divided by its mean intensity, converting the data to units of percentage signal modulation. The images obtained during the first cycle of visual stimulation (40 s) were discarded to allow the hemodynamics to reach a steady state. Therefore, the time series of each voxel contained 120 time points.
To identify the regions of interest containing voxels activated by the stimulus, I averaged the time series of each voxel across the 10 scanning runs in the spatial experiment and performed a Fourier analysis (Bandettini et al., 1993; Engel et al., 1997). For each voxel, the amplitude and phase of the harmonic at the stimulus frequency were determined by a Fourier transform of its mean time series. The correlation coefficient r between the harmonic and the time series was computed as the amplitude of the harmonic component divided by the square root of the time series power. Because the bow tie stimuli contain two frequency components—the main rotation frequency plus double that frequency—computed r using the maximum of the two harmonics, and the phase was computed modulo 180°. Statistical maps were thresholded at r ≥ 0.25, corresponding to an uncorrected p < 0.0038. Regions of interest (ROIs) for each LGN, SC, lateral pulvinar (LP), and inferior pulvinar or intergeniculate nucleus (IP) were identified as contiguously activated voxel clusters in their anatomical locations, as determined from registered high-resolution structural images of each subject.
To compute volumetric variation as a function of polar angle, I divided the visual field into 16 22.5° sectors, with the starting bin centered at 0° (right horizontal meridian). Voxels from each subject and nucleus were sorted into these bins on the basis of the phase of their responses, with those in the right hemisphere advanced 180°—because the stimulus was biphasic, contralaterality was assumed. The bins centered on the upper and lower vertical meridians contained voxels from both the left and right nuclei. The volume of voxels within each sector were totaled and averaged across subjects, and the mean polar angle representation was calculated as the volume representing each sector divided by the area of the sector.
To estimate the responses to the attended and unattended moving dot fields and colored dot fields in experiment 1, I computed a mean time series for each voxel for one stimulus period from all of the stimulus cycles in each of the scanning runs in which the same stimulus type was attended. Three identical mean period time series were concatenated and smoothed with a 5-point moving average, and then the middle of the three series was extracted to obtain a smoothed mean time series without any edge effects from the smoothing. This smoothed single-period mean time series was then deconvolved from the hemodynamic response by fitting to a generative response model. The model consisted of two square wave sources, each with the same variable width w but different variable amplitudes a1 and a2. The two sources were always out of phase by one-half stimulus period, but their absolution phase position ϕ was free to vary. This response model was then convolved with the standard hemodynamic response function (mixture of gammas) to yield the convolved response model. This model and procedure have been described previously (Schneider and Kastner, 2009). The convolved model response was converted to percentage change, and the best-fitting parameters (a1, a2, w, and ϕ) were obtained through an optimization procedure. The parameters a1 and a2 represent the response amplitude to the attended and unattended sectors, respectively, which were assigned to the moving or colored dot field depending on the run type; w represents the duration of the response to each sector and therefore the size of the receptive field of the voxel; ϕ indicates the response delay, which was converted to the angular polar coordinate of the receptive field location of the voxel within the visual field, and was corrected on the basis of the hemispheric location of each voxel to ensure that a1 always corresponded to the attended segment of the stimulus. The attended and unattended amplitudes for each stimulus type were collected from different runs (an attended moving dot field segment was always paired with an unattended colored dot field segment, and vice versa), and averaged across all of the voxels within an ROI, including both left and right hemispheres.
In experiment 2, a grand mean time series was calculated in each ROI from all 10 of the runs in each subject and then averaged across subjects. Correlation coefficients were calculated between these mean time series and the harmonic f0 with a 40 s period, to detect any response differentiating between attention to the moving dot field and attention to the colored dot field, and the harmonic f1 with a 20 s period, to detect activity related to the transitions between the attentional conditions. The mean phase-amplitude responses across the population of voxels (see Fig. 9) were calculated by smoothing the population of phase-amplitude vectors for each harmonic in each ROI with a polar Gaussian that had a SDof 1/50 of a full cycle.
Figure 9.

Experiment 2 response phases. The mean response amplitudes over all voxels in all subjects at f0, the fundamental frequency of the motion vs color attention cycle (red lines), or f1, the frequency of attentional switches (green lines), are plotted as a function of response phase in polar coordinates in the left two plots and in Cartesian coordinates in the right two plots. The upper two plots are for the LGN and the lower two the SC.
Results
Behavioral results
In experiment 1, there was an average of 79.7 motion events in each run, of which the subjects correctly detected a mean (± SEM) of 69.2 ± 3.3%. There was an average of 79.5 color events, of which the subjects correctly detected a mean (± SEM) of 79.9 ± 2.0%. The difficulty of each task was adjusted on each run with a goal of ∼75% correct; the actual rates were not grossly different from this, although significantly fewer motion events were detected overall (paired two-tailed t test, t(10) = 3.80, p = 0.0035).
In experiment 2, it was more critical that the difficulty rates were comparable between the motion and color tasks so that any differences in activation during the two feature attention conditions could not be attributed merely to nonspecific arousal. There was an average of 39.4 motion events during the motion-attention blocks and 40.2 color events during the color-attention blocks. As in experiment 1, the difficulty of the two tasks was adjusted on each run with a goal of 75% correct detection. Subjects correctly detected 78.3 ± 1.9% of the motion events, which was marginally significantly larger than the 75.4 ± 1.6% of the color events that were correctly detected (t(10) = 2.14, p = 0.058). There were few false alarms, 1.64 ± 0.45 per run during the motion blocks and 1.71 ± 0.45 during the color blocks; the false alarm rates were not significantly different (t(10) = 0.13, p = 0.90). The small number of false alarms confirms that the subjects were performing the detection tasks and not simply responding haphazardly. Across subjects, the probability of detecting an event was relatively constant throughout each block, with brief decreases in performance between ∼1 s before and 2 s after the transitions between the blocks (Fig. 2). Given that subjects had 1.5 s to respond to a preceding event, and that there were 3–4 s between events of each type, this indicates that the subjects transitioned between tasks with minimal anticipation or delay.
fMRI results
Retinotopic activation
In addition to the LGN and SC, whose structures have been described previously (Schneider et al., 2004; Schneider and Kastner, 2005, 2009), two pulvinar nuclei were activated in experiment 1. The retinotopic nucleus in the LP is located slightly superior to the LGN, with its anterior edge beginning around Talairach coordinates (21, 2, 30) (Talairach and Tournoux, 1988; Mai et al., 2008) and extending several millimeters posterior to the LGN (Fig. 3a). The anterior surface of the IP begins between the LGN and medial geniculate nucleus (MGN), medial to the LGN and lateral to the MGN, at approximately Talairach coordinates (19, −1, 29), and the nucleus extends, generally in the same superior–inferior plane as the LGN, several millimeters beyond the posterior edge of the LGN (Fig. 3b). These two retinotopic pulvinar nuclei also have been described previously as activated by contralateral visual stimuli in recent human neuroimaging studies (Cotton and Smith, 2007; Smith et al., 2009) and compare with those described in the macaque (Bender, 1981), although the human LP extends more superior and less medial relative to the LGN.
Figure 3.
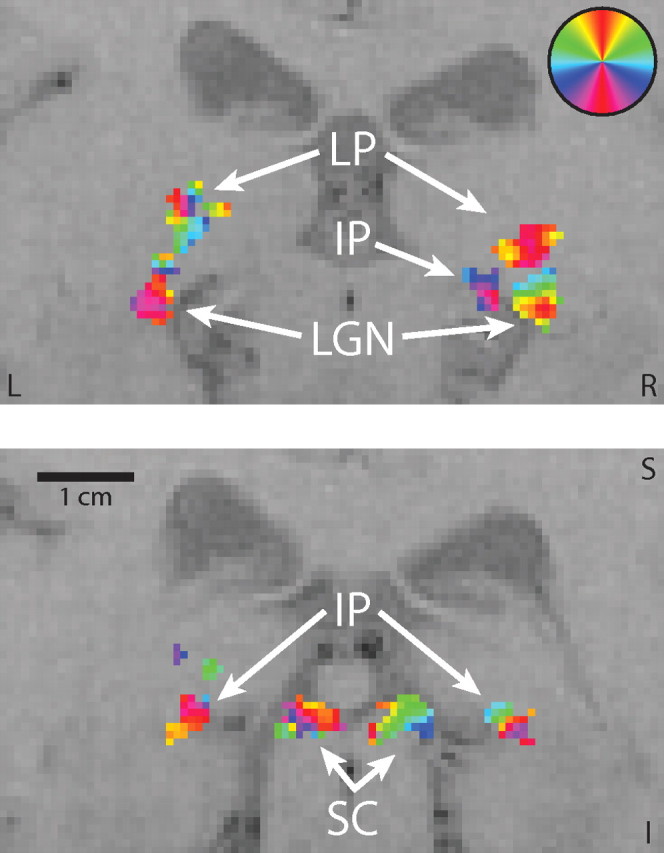
Regions of interest. Two coronal slices are shown from experiment 1 in the same well activated subject, zoomed to show the detail in the subcortex. The second slice is 4 mm posterior to the first. ROIs are shown for the LGN, LP, SC, and IP. The circular color legend in the upper right indicates the locations in the visual field to which voxels of a given color best responded. Left (L), right (R), superior (S), and inferior (I) directions are labeled.
The LGN, SC, and IP were activated bilaterally in all subjects, and the LP was activated bilaterally in 10 of the 11 subjects. (The 11th, behaviorally normal, subject had unusually large ventricles with a distorted subcortex and exhibited bilateral retinotopic activation in an area along the medial edge of the thalamus, which I could not be certain corresponded to LP. The subject's brain was determined by a radiologist to be within the range of normal variation; however, in the analyses below, this subject exhibited an unusual pattern of activity compared with the other subjects.) Each nucleus was retinotopic, consisting of voxels that responded to limited portions of the visual field. The polar angle to which each voxel responded best was determined from the phase of its response. Given the variability of the responses among the subjects, it was difficult to determine a general pattern of the retinotopic organization of LP. IP was more regular, with the upper visual field represented inferior and laterally, and the lower visual field represented superior and medially. Regions of interest were composed for each nucleus from the clusters of voxels in the correct anatomical location that were significantly responsive to the fundamental stimulus frequencies in the spatial experiment. In some cases, the pulvinar nuclei and LGN activities were contiguous and the boundaries were conservatively chosen and were informed by deviations from the well known and consistent retinotopic organization of the LGN. The activated volumes among the subjects with bilateral activations are shown in Table 1. The volumes of the nuclei were not significantly different between hemispheres. For the subjects who activated each nucleus bilaterally, I determined the average volume that represented each segment of the visual field (see Materials and Methods section and Fig. 4). For each nucleus, the two hemispheres together represented the entire visual field, with a larger fraction of the volume representing the horizontal than vertical meridian.
Table 1.
The mean volumes activated by the retinotopic stimuli in experiment 1 for the left and right LGN, SC, LP, and IP
| Left (mm3) | Right (mm3) | |
|---|---|---|
| LGN | 188 ± 23 | 176 ± 26 |
| SC | 113 ± 19 | 100 ± 19 |
| LP | 73 ± 15 | 76 ± 12 |
| IP | 87 ± 12 | 74 ± 12 |
Figure 4.

Volumetric distribution of the retinotopic visual field representation. Each point in the polar plots indicates the average volume of each nucleus, across bilaterally activated subjects in experiment 1, representing a 22.5° segment of the visual field at the given polar angle. Abbreviations are as defined in Figure 3; the scales differ among the nuclei. The shaded areas indicate the extent of the SEM. The direction terms orient the plots to locations in the visual field.
Spatial attention
For each of the voxels in each ROI, the response amplitudes evoked by the attended and unattended portions of the stimuli were determined by fitting a response model (see Materials and Methods) to the mean raw time series across the scanning runs. In each run, the attended portion of the stimulus was either the motion or colored dot field, and the unattended portion was the other type of field. Therefore, the attended and unattended amplitudes for each field were gathered from separate runs. The mean response amplitudes were computed across all voxels in each bilateral ROI for each subject, attentional condition, and stimulus. These mean amplitudes in each ROI were then analyzed across subjects with a repeated-measures general linear model using SPSS software (version 16.0.1). The cell means and results of the t tests comparing the effect of attention on the response amplitudes for each stimulus are shown in Figure 5a. In each ROI, the responses to the attended stimuli were significantly larger than those to the unattended stimuli: LGN, 1.041 ± 0.018% vs 0.932 ± 0.020% (F(1,10) = 18.3, p = 0.0016); SC, 1.353 ± 0.047% vs 0.864 ± 0.042% (F(1,10) = 67.7, p = 0.0000091); LP, 1.056 ± 0.030% vs 0.884 ± 0.036% (F(1,9) = 60.0, p = 0.000029); and IP, 1.138 ± 0.030% vs 0.977 ± 0.042% (F(1,10) = 25.4, p = 0.00051). In the LGN but not the other ROI, the moving dot stimuli evoked a significantly larger response than did the colored dot stimuli, 1.071 ± 0.020% vs 0.902 ± 0.017% (F(1,10) = 51.7, p = 0.000030); there was no significant interaction between attention and stimulus type.
Figure 5.
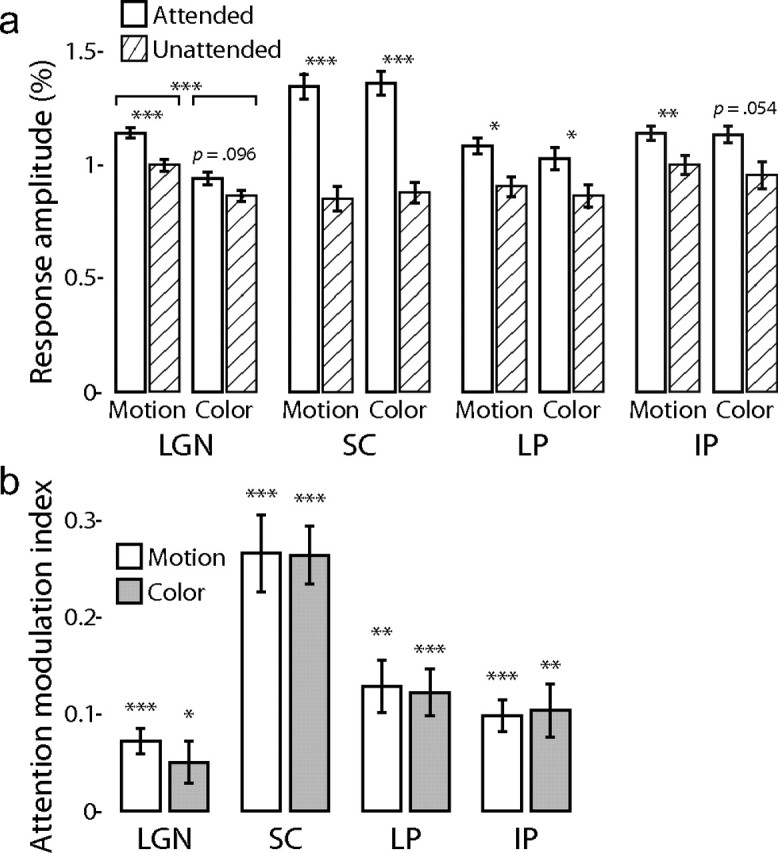
Spatial attention. a, The mean response amplitudes across subjects are shown for each nucleus (abbreviations are as defined in Fig. 3) for the moving and colored dot stimuli during the attended (white bars) and unattended (hatched bars) conditions in experiment 1. Error bars indicate the SEM over the subjects. The p value is shown for the two-tailed t test between the attentional conditions for each nucleus and stimulus: *p < 0.05, **p < 0.01, ***p < 0.001. In addition, in the LGN, the mean response to the moving dot fields was significantly greater than that to the colored dot fields. b, The mean AMIs are shown for the moving dot (white bars) and colored dot (shaded bars) fields in each nucleus. The p values indicate deviance from zero. Conventions are as in a.
To more clearly quantify the effects of attention, I computed an attention modulation index (AMI) for each voxel as AMI = (a1 − a2)/(a1 + a2), where a1 is the response amplitude evoked by the stimulus when it was attended and a2 is the response when unattended. As shown in Figure 5b, the AMIs across subjects were significantly greater than zero (two-tailed t test), indicating attentional enhancement: LGN, 0.072 ± 0.013 (t(10) = 5.6, p = 0.00023) for the motion stimulus and 0.050 ± 0.022 for the color stimulus (t(10) = 2.3, p = 0.043); SC, 0.266 ± 0.039 (t(10) = 6.8, p = 0.000050) for the motion stimulus and 0.264 ± 0.030 for the color stimulus (t(10) = 8.8, p = 0.0000051); LP, 0.128 ± 0.027 (t(9) = 4.8, p = 0.0010) for the motion stimulus and 0.122 ± 0.024 for the color stimulus (t(9) = 5.1, p = 0.00064); and IP, 0.098 ± 0.016 (t(10) = 6.0, p = 0.00013) for the motion stimulus and 0.104 ± 0.027 for the color stimulus (t(10) = 3.8, p = 0.0036). There were no significant differences in the AMI between stimuli in any of the ROIs.
Feature-based attention
In experiment 2, subjects viewed an overlapping set of moving and colored dot fields and periodically alternated their attention between them. For 20 s, subjects attended to and detected changes in the moving dot field, at which time the letter at fixation changed to direct them to attend to the colored dot field for 20 s. A mean time series was calculated for each ROI identified in the spatial experiment across subjects and scanning runs. These time series are shown averaged over one stimulus period in Figure 6. The thalamic nuclei exhibited greater activation during attention to the moving dot fields than to the colored dot fields. The SC apparently exhibited different behavior, responding primarily somewhat before and during the transition between the two attentional states.
Figure 6.
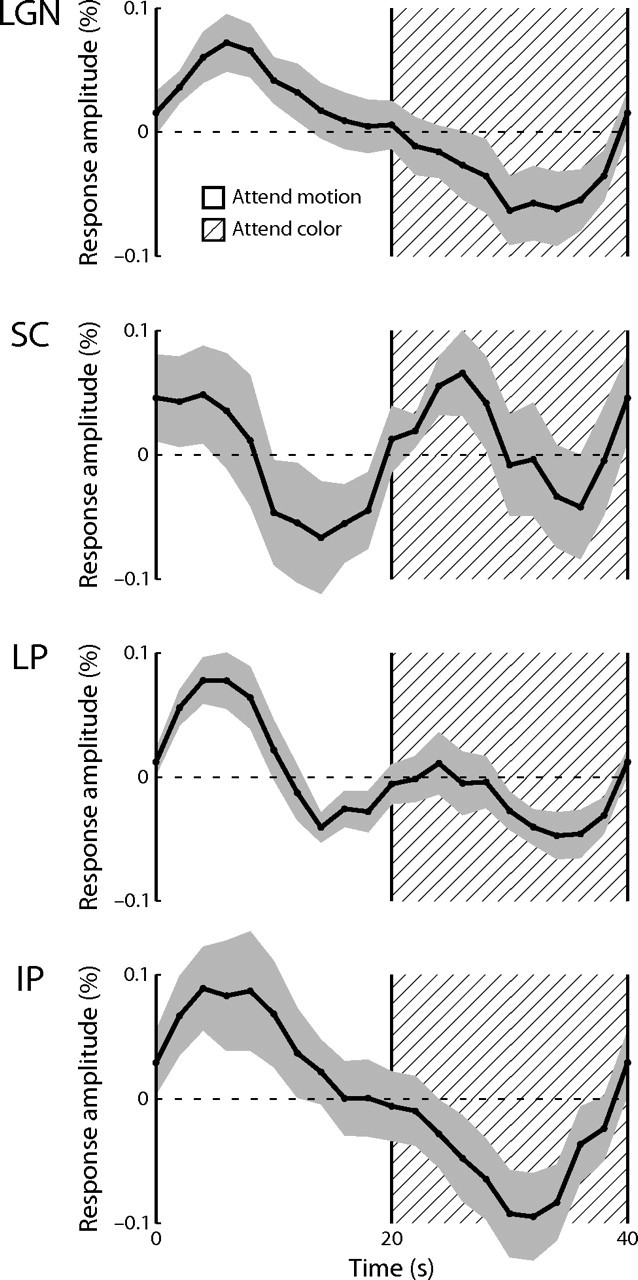
Experiment 2 mean time series. The mean response over subjects in each nucleus (abbreviations are as defined in Fig. 3) during one stimulus period is shown. The shaded area indicates the extent of the SEM over subjects. During the first half of each stimulus period, the subjects attended to the moving dot field. The hatched region indicates the second half of the stimulus period during which the subjects attended to the colored dot field.
To quantify these two response modes, one at the fundamental stimulus frequency f0 corresponding to a difference in activation during the two attentional states, and the second to double that frequency, the first harmonic f1, corresponding to attentional switching, I performed a Fourier analysis of the mean time series for each ROI. The results of this analysis are shown in Figure 7. All three of the thalamic nuclei were significantly activated at the stimulus fundamental frequency f0 and were more active during the attention to the moving dots; this was most prominent in the LGN and IP. The difference in response amplitudes for the two attentional conditions was 0.070% for the LGN (r = 0.39, p = 0.0000043), 0.032% for the LP (r = 0.19, p = 0.017), and 0.081% for the IP (r = 0.37, p = 0.000012). The activation at the fundamental frequency f0 for the SC was marginally significant, 0.031% (r = 0.13, p = 0.077), although this was likely incidental, as the amplitude of this component could not be readily distinguished from the noise in the power spectrum (Fig. 8). All four nuclei exhibited significant activity at the switching frequency f1, although this was more prominent in the SC and LP than in the LGN or IP: 0.047% for the LGN (r = 0.26, p = 0.0017), 0.084% in the SC (r = 0.35, p = 0.000032), 0.062% in the LP (r = 0.37, p = 0.000013), and 0.065% in the IP (r = 0.29, p = 0.00047).
Figure 7.

Experiment 2 response modes. The mean time series in each nucleus (abbreviations are as defined in Fig. 3) across all scanning runs and all subjects was correlated with two frequencies: f0, the fundamental stimulus frequency (motion vs color, white bars), a period of 40 s corresponding to one stimulus cycle between attending to the moving dots and colored dots; and f1, double the fundamental frequency (attention switching, shaded bars), a period of 20 s corresponding to changes in the attentional state. The dashed lines indicate the significance levels of the correlation coefficients.
Figure 8.

Experiment 2 power spectra. Each graph shows the power spectra of the mean response across subjects in each ROI during experiment 2. The open circle marks the power at six cycles/scan, which was the fundamental frequency of the experiment, corresponding to the difference between the attention conditions. The closed circle marks 12 cycles/scan, which was the frequency of the switches between the attentional conditions.
Given that the LGN and SC have known laminar substructure, I sought to describe their activity more completely by investigating the responses of the population of individual voxels across subjects. I found that the distribution of response phases among the voxels in the SC was strongly bimodal for both the fundamental frequency f0 and switching frequency f1, whereas the LGN exhibited a main peak with a broad shoulder for f0 (Fig. 9). I first examined whether these features of the phase distributions could be explained by variations among the subjects. In Figure 10, the vector averages of the voxel responses in each ROI at each frequency are plotted by subject. The results show that the SC responded robustly at the fundamental frequency f0, but that the responses were out of phase among the subjects. That is, in some subjects, the SC responded more strongly when subjects attended the moving dots; in other subjects, the SC responded more strongly when the subjects attended the colored dots. Therefore, the lack of power at the fundamental frequency f0 in the mean time series was not due to weak general preferences of the SC to the two different stimuli, but rather due to inconsistencies among the subjects that canceled themselves out. In contrast, the responses at the switching frequency f1 in the SC and at both frequencies in the LGN were generally consistent among subjects; therefore, their observed response phase distributions among voxels were due to variations among the voxels within each ROI.
Figure 10.

Experiment 2 responses by subject. The gray circles plot for each subject the phases and amplitudes of the responses in experiment 2 as a vector average of the responses of all of the individual voxels in each ROI. The black circles plot the vector average over all subjects. The left two plots indicate the responses at the fundamental frequency, f0, which is the frequency of one motion vs color attention cycle. The right two plots indicate the responses at the first harmonic, f1, which is the frequency of the switches between attentional states. The upper two plots are for the LGN and the lower two the SC.
To examine the responses of individual voxels in the LGN and SC and to compare them with known structural features of these nuclei, I divided the response phases into two groups: ϕ < π, that is, those voxels that responded more strongly at f0 when the subject attended to the moving dots, or more strongly during transitions between the attentional states at f1; and ϕ ≥ π, that is, those voxels that responded more strongly at f0 when the subject attended to the colored dots, or were suppressed during transitions between the attentional states at f1. Results from two subjects are shown in Figure 11. The two groups of voxels in the ROIs are colored white and black, respectively. In this way, even though the phase responses of the noisy voxels were not individually robust, general trends could be observed in clusters of voxels sharing similar phases.
Figure 11.

Experiment 2 response phases by voxel. The voxels in each ROI are colored according to their response phases in experiment 2. Black voxels responded with a phase ϕ < π, for f0, the fundamental frequency of the motion vs color attention cycle (left two images), or f1, the frequency of attentional switches (right two images), and white voxels responded with a phase ϕ ≥ π. The two top (coronal) images show the LGN ROI in one subject (only the left LGN is visible in this plane), and the two bottom images show the SC ROI in a different subject.
In the LGN, the majority of voxels responded more strongly when the subject attended to the moving dots. However, in the LGN of many subjects, a substantial cluster of voxels was present that responded more strongly when the subject attended to the colored dots. Although most of the subjects did not exhibit the apparently clean separation of the parvocellular and magnocellular layers that is shown in the intriguing example in Figure 11, the smaller clusters that were present in other subjects were typically located dorsolaterally. It should be noted that although neither the experimental paradigm nor the analyses were optimized to distinguish the parvocellular from the magnocellular layers—this was not an original aim of the study—the clustering of voxel responses is readily apparent. The locations of these clusters are consistent with their being located in the parvocellular layers, and their responses are also consistent with parvocellular neurons being less heavily recruited than magnocellular neurons for motion stimuli. Although the parvocellular layers occupy the majority of the volume of the LGN, the individual layers were unresolved and therefore the voxels that were relatively suppressed during attention to motion might be those distant enough from the magnocellular layers to be free from any hemodynamic influence. The parvocellular layers of the LGN certainly also respond to motion (Schneider and Kastner, 2005), whereas the magnocellular layers are achromatic and might be metabolically more active and more strongly modulated by attention (Vanduffel et al., 2000; Schneider and Kastner, 2009). Given these considerations it is therefore not surprising that voxels preferring attention to motion would make up the majority of the LGN volume.
The responses of the majority of voxels in the LGN were enhanced in anticipation of and during the transitions between attentional states. However, in many subjects, a thin layer of voxels, usually on the dorsal and lateral surfaces of the LGN, was suppressed during the transitions. These clusters were thinner than the parvocellular clusters and could possibly contain portions of the adjacent thalamic reticular nucleus (Mai et al., 2008).
In the SC, in each subject, most voxels responded more strongly to either the moving or colored dots, but which stimulus this was varied among subjects. In contrast, the vast majority of SC voxels among subjects were consistently enhanced in anticipation of and during the attentional state transitions. In most subjects, there were substantial clusters of voxels, generally confined to the superficial portions of the SC, that were suppressed during the transitions.
To eliminate the possibility that the different responses in the two feature-based attention conditions in experiment 2 could be explained by differential allocation of spatial attention throughout the stimulus cycle (Huk and Heeger, 2000), I examined the 25% most posterior and the 25% most anterior voxels of each LGN ROI in each subject. These sub-ROIs corresponded to the most foveal and most peripheral portions of the LGN, respectively (Schneider et al., 2004). The time mean time series were similar to the whole LGN ROI at all phases of the response, and I therefore concluded that the allocation of spatial attention did not periodically vary between the fovea and periphery, and that differential spatial attention could not explain the results of the feature-based attention experiment. I repeated this procedure in the SC, where the representation of the periphery is in the posterior portions and the representation of the fovea is anterior (Cynader and Berman, 1972), and I similarly concluded that the observed responses of the SC in experiment 2 could not be explained by differences in the allocation of spatial attention.
Eye movements
To rule out the possibility that different patterns of eye movements between the two blocks in experiment 2 could have caused the activity differences, I tracked the eye position of eight subjects outside the scanner while they performed the feature-based attention task. The mean distance of the gaze position from the fixation point across subjects and runs was 0.768 ± 0.033° and 0.786 ± 0.033° for the motion and color blocks, respectively, which were not significantly different (t(39) = 0.90, p = 0.37). The fraction of gaze positions within 1° of the fixation point was 76.8 ± 2.4% for the motion block and 77.1 ± 2.2% for the color blocks, and the fractions within 2° were 97.1 ± 0.6% and 97.3 ± 0.4%, respectively. Neither measurement was significantly different between the blocks (t(39) = 0.23, p = 0.82, and t(39) = 0.38, p = 0.71, respectively). I calculated eye velocity to test the possibility that subjects could have maintained fixation on average but tracked the motion stimulus with small periodic movements and corrections. The mean eye velocity was 35.5 ± 1.3°/s for the moving blocks which was significantly slower than 36.2 ± 1.3°/s for the static blocks (t(39) = 3.14, p = 0.0032). Although significant, the difference is small and in the opposite direction than the observed activity, which was larger during the moving blocks. Overall, the measurements indicate that eye movements were unlikely to have been responsible for any differences in activity observed in experiment 2.
Discussion
The LGN, SC, and the LP and IP nuclei of the pulvinar can be modulated by spatial attention in a retinotopically specific manner. The strong modulations in the SC contrasted with the rather weak modulations in the LGN, and the pulvinar nuclei exhibited modulations of intermediate strength. The responses in the three thalamic nuclei were clearly modulated by feature-based attention, stronger during periods of attention to the moving dot field than to the spatially coincident colored dot field, whereas the responses in the SC were inconsistent among subjects. In the LGN, clusters of dorsolateral voxels, consistent with locations within the parvocellular layers, responded more strongly when the colored dots were attended. The observed hemodynamic activity in the SC, especially, but also in the thalamus, increased in anticipation of the regular transitions between the attentional states, whereas thin layers of voxels, perhaps corresponding to the thalamic reticular nucleus and superficial layers of the SC, were suppressed during the transitions.
Previous studies have compared spatial and feature-based attention in the cortex and found that spatial selection evoked stronger modulations than did feature-based selection (Giesbrecht et al., 2003; Stoppel et al., 2007). Due to the different experimental paradigms, it is not possible to directly compare the modulation strengths of spatial and feature-based attention in the present study. However, it is remarkable that the SC, which was strongly modulated by spatial attention, exhibited inconsistent modulation by feature-based attention across subjects. It is not clear whether this is because the SC did not exhibit any preference for the two different feature stimuli as did the LGN, which preferred the moving to the colored dot fields, and thus would not be expected to show consistent differential activation, or whether the SC is not in general modulated by feature-based attention and strictly operates in the spatial domain. In comparison, the IP also did not exhibit a preference for either of the two features in the spatial experiment but nonetheless was modulated by feature-based attention between them. It is therefore likely that the feature-based activity observed in the SC was not due to recruitment of sensory feature-selective neurons in the SC, such as that likely observed in the LGN, but rather strategic differences among subjects.
Although the SC was not consistently modulated by feature-based attention, it, along with the other nuclei, did exhibit anticipatory (preceding the actual transition) attention-switching activity in the feature-based attention experiment. The origin and function of this switching signal are unknown and could not be attributed to changes in the allocation of spatial attention because these signals were not reflected in the behavioral performance and did not differentially activate the foveal and peripheral regions of the LGN or SC. The change in the fixated cue that instructed subjects to switch attention between the features was salient and predictable and did not likely require the devotion of significant attentional resources. The anticipatory activity might reflect a control signal, or, less interestingly, hemodynamics not directly caused by local neural activity (Sirotin and Das, 2009). Transient signals perhaps controlling shifts of attention between color and motion features have been observed previously in the precuneus, precentral gyrus, and intraparietal sulcus cortical areas (Liu et al., 2003), but such signals have not been investigated in the subcortex. The possibility that this activity is a control signal is supported by the suppression activity observed along the lateral boundaries of the LGN and in the superficial layers of the SC. In the SC, occulomotor and attention control signals might be expected in the intermediate but not superficial layers (Kustov and Robinson, 1996). Such suppressive activity in the vicinity of the LGN would make sense whether it could be attributed to the function of the thalamic reticular nucleus, which wraps the external thalamus. The reticular nucleus has an inhibitory relationship with the LGN (McAlonan et al., 2008), such that decreased activity in the reticular nucleus releases inhibition in the LGN, causing an increase in activity, as is observed during the transitions between attentional states.
Some cortical areas contain large fractions of neurons that are tuned to particular features, for example, area MT for motion and area V4 for color. It has been found that when attending to one of these feature dimensions, the activity in the corresponding cortical area, but not lower level areas, was enhanced (McMains et al., 2007; Schoenfeld et al., 2007; Shibata et al., 2008). However, I observed feature-based attention in the LGN, with the magnocellular layers preferentially activated by attention to motion and regions within the parvocellular layers preferentially activated by attention to color. It is therefore possible that activity in lower level cortical areas would be observed if measurements were sampled at a fine enough spatial scale. Baseline increases that correspond to attentional anticipation of a stimulus were found only for spatial attention and not anticipation of a feature (McMains et al., 2007). Although such baseline increase may reflect hemodynamics that are not related to neuronal activity (Sirotin and Das, 2009), it is logical that they would be observed for spatial but not feature-based selection, as the scale of the retinotopic organization of the visual areas is much coarser than the columnar feature-based organization (Hubel and Wiesel, 1963; Albright et al., 1984; Mountcastle, 1997).
Feature-based attention is different from object-based attention, in which all of the components of a surface or object are selected (Valdés-Sosa et al., 2000; Reynolds et al., 2003) and all its features are enhanced (Katzner et al., 2009). In experiment 2, the moving and colored dot fields could be viewed as separate surfaces, and because the two surfaces are composed of different single features, feature- and surface-based selections are indistinguishable. Whether the differential attentional selection of the motion and color stimuli was accomplished by selecting the features directly or by selecting objects containing those features, the attended content is, by design, identical. The most important finding of the present study is the unprecedented observation of modulation in the thalamus by nonspatial attentional selection in experiment 2. In the subcortical visual nuclei or low-level visual areas where the receptive fields of neurons encode only very simple features, we would expect the responses of singles neurons to be enhanced via feedback by object-based attention in proportion to the degree to which those neurons participate in the encoding of the object. Unless the objects differed in their feature content, attention to one of multiple objects might have no effect in low-level visual structures, as their neurons would not differentially participate in the encoding of one object versus another (Mitchell et al., 2003). However, it is possible that subsets of subcortical neurons could be preferentially used to construct more complicated features. For example, even though magnocellular neurons in the LGN are not selective for orientation, they could be used preferentially over the parvocellular neurons to calculate orientation at a later stage of processing (Vanduffel et al., 2000).
In addition to the distinction between feature- and object-based attention, another important consideration when interpreting the results of this study is that the feature-based selection occurred between disjoint feature dimensions (e.g., motion and color) rather than within a single feature dimension (e.g., different directions of motion), as is commonly done in electrophysiology experiments (e.g., Treue and Martínez Trujillo, 1999). Given that feature encoding is multiplexed in the cortex such that a single neuron might have preferences for particular features among many different feature dimensions (e.g., Friedman et al., 2003), it is not clear that a different mechanism would be expected to operate for selection within a single feature dimension as opposed to selection among feature dimensions. The receptive field structure of the LGN neurons with limited ability to discriminate within feature dimension might restrict feature-based attentional effects there to categorical selections that engage the different attributes that are preferentially encoded in its magnocellular and parvocellular subdivisions.
The magnitudes of the attentional effects in the LGN and SC in experiment 1 were similar to previous reports of spatial attention, with response amplitudes for the attended versus unattended stimuli increasing ∼10% in the LGN and > 50% in the SC (O'Connor et al., 2002; Schneider and Kastner, 2009), as are the attentional effects in LP and IP, with ∼20% increases (Smith et al., 2009). I did not observe any activity in the dorsomedial pulvinar, which is also modulated by attention in humans (Kastner et al., 2004), but because this nucleus has only a crude retinotopic organization (Petersen et al., 1985), I did not expect it to be localized by the periodic spatial attention stimuli. I also did not observe any retinotopic activity in the dorsolateral pulvinar, which has been reported to encode visual position (Fischer and Whitney, 2009) but has no primate analog.
I have demonstrated that all of the retinotopic visual nuclei in the thalamus can be modulated by both feature-based and spatial attention. Conversely, although the SC was strongly modulated by attention to spatial location, it was not consistently modulated by attention to other features. These results are compatible with the operation of feature-based attention through the enhancement of neural activity in accordance with the role of each neuron in encoding the attended information. Spatial attention may also operate according to this common principle, yet seem unique, because space is referenced to the body and is used for covert orienting unlike other features and is more widely encoded in the visual system, including in specialized structures such as the SC.
Footnotes
I thank Mario Kleiner for his work on the Psychophysics Toolbox 3.
References
- Albright TD, Desimone R, Gross CG. Columnar organization of directionally selective cells in visual area MT of the macaque. J Neurophysiol. 1984;51:16–31. doi: 10.1152/jn.1984.51.1.16. [DOI] [PubMed] [Google Scholar]
- Allman JM, Kaas JH, Lane RH, Miezin FM. A representation of the visual field in the inferior nucleus of the pulvinar in the owl monkey (Aotus trivirgatus) Brain Res. 1972;40:291–302. doi: 10.1016/0006-8993(72)90135-7. [DOI] [PubMed] [Google Scholar]
- Bandettini PA, Jesmanowicz A, Wong EC, Hyde JS. Processing strategies for time-course data sets in functional MRI of the human brain. Magn Reson Med. 1993;30:161–173. doi: 10.1002/mrm.1910300204. [DOI] [PubMed] [Google Scholar]
- Bell AH, Fecteau JH, Munoz DP. Using auditory and visual stimuli to investigate the behavioral and neuronal consequences of reflexive covert orienting. J Neurophysiol. 2004;91:2172–2184. doi: 10.1152/jn.01080.2003. [DOI] [PubMed] [Google Scholar]
- Bender DB. Retinotopic organization of macaque pulvinar. J Neurophysiol. 1981;46:672–693. doi: 10.1152/jn.1981.46.3.672. [DOI] [PubMed] [Google Scholar]
- Bender DB. Receptive-field properties of neurons in the macaque inferior pulvinar. J Neurophysiol. 1982;48:1–17. doi: 10.1152/jn.1982.48.1.1. [DOI] [PubMed] [Google Scholar]
- Bender DB, Youakim M. Effect of attentive fixation in macaque thalamus and cortex. J Neurophysiol. 2001;85:219–234. doi: 10.1152/jn.2001.85.1.219. [DOI] [PubMed] [Google Scholar]
- Benevento LA, Miller J. Visual responses of single neurons in the caudal lateral pulvinar of the macaque monkey. J Neurosci. 1981;1:1268–1278. doi: 10.1523/JNEUROSCI.01-11-01268.1981. [DOI] [PMC free article] [PubMed] [Google Scholar]
- Benevento LA, Standage GP. The organization of projections of the retinorecipient and nonretinorecipient nuclei of the pretectal complex and layers of the superior colliculus to the lateral pulvinar and medial pulvinar in the macaque monkey. J Comp Neurol. 1983;217:307–336. doi: 10.1002/cne.902170307. [DOI] [PubMed] [Google Scholar]
- Boynton GM, Ciaramitaro VM, Arman AC. Effects of feature-based attention on the motion aftereffect at remote locations. Vision Res. 2006;46:2968–2976. doi: 10.1016/j.visres.2006.03.003. [DOI] [PubMed] [Google Scholar]
- Brainard DH. The psychophysics toolbox. Spat Vis. 1997;10:433–436. [PubMed] [Google Scholar]
- Casanova C, Merabet L, Desautels A, Minville K. Higher-order motion processing in the pulvinar. Prog Brain Res. 2001;134:71–82. doi: 10.1016/s0079-6123(01)34006-2. [DOI] [PubMed] [Google Scholar]
- Cotton PL, Smith AT. Contralateral visual hemifield representations in the human pulvinar nucleus. J Neurophysiol. 2007;98:1600–1609. doi: 10.1152/jn.00419.2007. [DOI] [PubMed] [Google Scholar]
- Creutzfeldt OD, Lee BB, Elepfandt A. A quantitative study of chromatic organisation and receptive fields of cells in the lateral geniculate body of the rhesus monkey. Exp Brain Res. 1979;35:527–545. doi: 10.1007/BF00236770. [DOI] [PubMed] [Google Scholar]
- Cusick CG, Scripter JL, Darensbourg JG, Weber JT. Chemoarchitectonic subdivisions of the visual pulvinar in monkeys and their connectional relations with the middle temporal and rostral dorsolateral visual areas, MT and DLr. J Comp Neurol. 1993;336:1–30. doi: 10.1002/cne.903360102. [DOI] [PubMed] [Google Scholar]
- Cynader M, Berman N. Receptive-field organization of monkey superior colliculus. J Neurophysiol. 1972;35:187–201. doi: 10.1152/jn.1972.35.2.187. [DOI] [PubMed] [Google Scholar]
- David SV, Hayden BY, Mazer JA, Gallant JL. Attention to stimulus features shifts spectral tuning of V4 neurons during natural vision. Neuron. 2008;59:509–521. doi: 10.1016/j.neuron.2008.07.001. [DOI] [PMC free article] [PubMed] [Google Scholar]
- Derrington AM, Lennie P. Spatial and temporal contrast sensitivities of neurones in lateral geniculate nucleus of macaque. J Physiol. 1984;357:219–240. doi: 10.1113/jphysiol.1984.sp015498. [DOI] [PMC free article] [PubMed] [Google Scholar]
- Dreher B, Fukada Y, Rodieck RW. Identification, classification and anatomical segregation of cells with X-like and Y-like properties in the lateral geniculate nucleus of old-world primates. J Physiol. 1976;258:433–452. doi: 10.1113/jphysiol.1976.sp011429. [DOI] [PMC free article] [PubMed] [Google Scholar]
- Egner T, Monti JM, Trittschuh EH, Wieneke CA, Hirsch J, Mesulam MM. Neural integration of top-down spatial and feature-based information in visual search. J Neurosci. 2008;28:6141–6151. doi: 10.1523/JNEUROSCI.1262-08.2008. [DOI] [PMC free article] [PubMed] [Google Scholar]
- Engel SA, Glover GH, Wandell BA. Retinotopic organization in human visual cortex and the spatial precision of functional MRI. Cereb Cortex. 1997;7:181–192. doi: 10.1093/cercor/7.2.181. [DOI] [PubMed] [Google Scholar]
- Fallah M, Stoner GR, Reynolds JH. Stimulus-specific competitive selection in macaque extrastriate visual area V4. Proc Natl Acad Sci U S A. 2007;104:4165–4169. doi: 10.1073/pnas.0611722104. [DOI] [PMC free article] [PubMed] [Google Scholar]
- Fecteau JH, Bell AH, Munoz DP. Neural correlates of the automatic and goal-driven biases in orienting spatial attention. J Neurophysiol. 2004;92:1728–1737. doi: 10.1152/jn.00184.2004. [DOI] [PubMed] [Google Scholar]
- Fischer J, Whitney D. Precise discrimination of object position in the human pulvinar. Hum Brain Mapp. 2009;30:101–111. doi: 10.1002/hbm.20485. [DOI] [PMC free article] [PubMed] [Google Scholar]
- Friedman HS, Zhou H, von der Heydt R. The coding of uniform colour figures in monkey visual cortex. J Physiol. 2003;548:593–613. doi: 10.1113/jphysiol.2002.033555. [DOI] [PMC free article] [PubMed] [Google Scholar]
- Gattass R, Desimone R. Responses of cells in the superior colliculus during performance of a spatial attention task in the macaque. Rev Bras Biol. 1996;56(Suppl 1):257–279. [PubMed] [Google Scholar]
- Gattass R, Oswaldo-Cruz E, Sousa AP. Visual receptive fields of units in the pulvinar of cebus monkey. Brain Res. 1979;160:413–430. doi: 10.1016/0006-8993(79)91070-9. [DOI] [PubMed] [Google Scholar]
- Giesbrecht B, Woldorff MG, Song AW, Mangun GR. Neural mechanisms of top-down control during spatial and feature attention. Neuroimage. 2003;19:496–512. doi: 10.1016/s1053-8119(03)00162-9. [DOI] [PubMed] [Google Scholar]
- Goldberg ME, Wurtz RH. Activity of superior colliculus in behaving monkey. I. Visual receptive fields of single neurons. J Neurophysiol. 1972;35:542–559. doi: 10.1152/jn.1972.35.4.542. [DOI] [PubMed] [Google Scholar]
- Hayden BY, Gallant JL. Time course of attention reveals different mechanisms for spatial and feature-based attention in area V4. Neuron. 2005;47:637–643. doi: 10.1016/j.neuron.2005.07.020. [DOI] [PubMed] [Google Scholar]
- Hayden BY, Gallant JL. Combined effects of spatial and feature-based attention on responses of V4 neurons. Vision Res. 2009;49:1182–1187. doi: 10.1016/j.visres.2008.06.011. [DOI] [PMC free article] [PubMed] [Google Scholar]
- Hubel DH, Wiesel TN. Shape and arrangement of columns in cat's striate cortex. J Physiol. 1963;165:559–568. doi: 10.1113/jphysiol.1963.sp007079. [DOI] [PMC free article] [PubMed] [Google Scholar]
- Huk AC, Heeger DJ. Task-related modulation of visual cortex. J Neurophysiol. 2000;83:3525–3536. doi: 10.1152/jn.2000.83.6.3525. [DOI] [PubMed] [Google Scholar]
- Humphrey NK. Responses to visual stimuli of units in the superior colliculus of rats and monkeys. Exp Neurol. 1968;20:312–340. doi: 10.1016/0014-4886(68)90076-9. [DOI] [PubMed] [Google Scholar]
- Ignashchenkova A, Dicke PW, Haarmeier T, Thier P. Neuron-specific contribution of the superior colliculus to overt and covert shifts of attention. Nat Neurosci. 2004;7:56–64. doi: 10.1038/nn1169. [DOI] [PubMed] [Google Scholar]
- Jenkinson M, Bannister P, Brady M, Smith S. Improved optimisation for the robust and accurate linear registration and motion correction of brain images. Neuroimage. 2002;17:825–841. doi: 10.1016/s1053-8119(02)91132-8. [DOI] [PubMed] [Google Scholar]
- Kastner S, O'Connor DH, Fukui MM, Fehd HM, Herwig U, Pinsk MA. Functional imaging of the human lateral geniculate nucleus and pulvinar. J Neurophysiol. 2004;91:438–448. doi: 10.1152/jn.00553.2003. [DOI] [PubMed] [Google Scholar]
- Katzner S, Busse L, Treue S. Attention to the color of a moving stimulus modulates motion-signal processing in macaque area MT: evidence for a unified attentional system. Front Syst Neurosci. 2009;3:12. doi: 10.3389/neuro.06.012.2009. [DOI] [PMC free article] [PubMed] [Google Scholar]
- Kustov AA, Robinson DL. Shared neural control of attentional shifts and eye movements. Nature. 1996;384:74–77. doi: 10.1038/384074a0. [DOI] [PubMed] [Google Scholar]
- LaBerge D, Buchsbaum MS. Positron emission tomographic measurements of pulvinar activity during an attention task. J Neurosci. 1990;10:613–619. doi: 10.1523/JNEUROSCI.10-02-00613.1990. [DOI] [PMC free article] [PubMed] [Google Scholar]
- Lee KM, Keller EL. Symbolic cue-driven activity in superior colliculus neurons in a peripheral visual choice task. J Neurophysiol. 2006;95:3585–3595. doi: 10.1152/jn.01071.2005. [DOI] [PMC free article] [PubMed] [Google Scholar]
- Liu T, Slotnick SD, Serences JT, Yantis S. Cortical mechanisms of feature-based attentional control. Cereb Cortex. 2003;13:1334–1343. doi: 10.1093/cercor/bhg080. [DOI] [PubMed] [Google Scholar]
- Liu T, Larsson J, Carrasco M. Feature-based attention modulates orientation-selective responses in human visual cortex. Neuron. 2007;55:313–323. doi: 10.1016/j.neuron.2007.06.030. [DOI] [PMC free article] [PubMed] [Google Scholar]
- Mai JK, Paxinos G, Voss T. Atlas of the human brain. Ed 3. New York: Elsevier; 2008. [Google Scholar]
- Malpeli JG, Baker FH. The representation of the visual field in the lateral geniculate nucleus of Macaca mulatta. J Comp Neurol. 1975;161:569–594. doi: 10.1002/cne.901610407. [DOI] [PubMed] [Google Scholar]
- Marrocco RT, Li RH. Monkey superior colliculus: properties of single cells and their afferent inputs. J Neurophysiol. 1977;40:844–860. doi: 10.1152/jn.1977.40.4.844. [DOI] [PubMed] [Google Scholar]
- Mathers LH, Rapisardi SC. Visual and somatosensory receptive fields of neurons in the squirrel monkey pulvinar. Brain Res. 1973;64:65–83. doi: 10.1016/0006-8993(73)90171-6. [DOI] [PubMed] [Google Scholar]
- Maunsell JH, Treue S. Feature-based attention in visual cortex. Trends Neurosci. 2006;29:317–322. doi: 10.1016/j.tins.2006.04.001. [DOI] [PubMed] [Google Scholar]
- McAdams CJ, Maunsell JH. Effects of attention on orientation-tuning functions of single neurons in macaque cortical area V4. J Neurosci. 1999;19:431–441. doi: 10.1523/JNEUROSCI.19-01-00431.1999. [DOI] [PMC free article] [PubMed] [Google Scholar]
- McAlonan K, Cavanaugh J, Wurtz RH. Guarding the gateway to cortex with attention in visual thalamus. Nature. 2008;456:391–394. doi: 10.1038/nature07382. [DOI] [PMC free article] [PubMed] [Google Scholar]
- McMains SA, Fehd HM, Emmanouil TA, Kastner S. Mechanisms of feature- and space-based attention: response modulation and baseline increases. J Neurophysiol. 2007;98:2110–2121. doi: 10.1152/jn.00538.2007. [DOI] [PubMed] [Google Scholar]
- Merabet L, Desautels A, Minville K, Casanova C. Motion integration in a thalamic visual nucleus. Nature. 1998;396:265–268. doi: 10.1038/24382. [DOI] [PubMed] [Google Scholar]
- Merigan WH, Maunsell JH. How parallel are the primate visual pathways? Annu Rev Neurosci. 1993;16:369–402. doi: 10.1146/annurev.ne.16.030193.002101. [DOI] [PubMed] [Google Scholar]
- Mitchell JF, Stoner GR, Fallah M, Reynolds JH. Attentional selection of superimposed surfaces cannot be explained by modulation of the gain of color channels. Vision Res. 2003;43:1323–1328. doi: 10.1016/s0042-6989(03)00123-8. [DOI] [PubMed] [Google Scholar]
- Mountcastle VB. The columnar organization of the neocortex. Brain. 1997;120:701–722. doi: 10.1093/brain/120.4.701. [DOI] [PubMed] [Google Scholar]
- Müller MM, Andersen S, Trujillo NJ, Valdés-Sosa P, Malinowski P, Hillyard SA. Feature-selective attention enhances color signals in early visual areas of the human brain. Proc Natl Acad Sci U S A. 2006;103:14250–14254. doi: 10.1073/pnas.0606668103. [DOI] [PMC free article] [PubMed] [Google Scholar]
- O'Connor DH, Fukui MM, Pinsk MA, Kastner S. Attention modulates responses in the human lateral geniculate nucleus. Nat Neurosci. 2002;5:1203–1209. doi: 10.1038/nn957. [DOI] [PubMed] [Google Scholar]
- Pelli DG. The VideoToolbox software for visual psychophysics: transforming numbers into movies. Spat Vis. 1997;10:437–442. [PubMed] [Google Scholar]
- Petersen SE, Robinson DL, Keys W. Pulvinar nuclei of the behaving rhesus monkey: visual responses and their modulation. J Neurophysiol. 1985;54:867–886. doi: 10.1152/jn.1985.54.4.867. [DOI] [PubMed] [Google Scholar]
- Reynolds JH, Desimone R. Interacting roles of attention and visual salience in V4. Neuron. 2003;37:853–863. doi: 10.1016/s0896-6273(03)00097-7. [DOI] [PubMed] [Google Scholar]
- Reynolds JH, Alborzian S, Stoner GR. Exogenously cued attention triggers competitive selection of surfaces. Vision Res. 2003;43:59–66. doi: 10.1016/s0042-6989(02)00403-0. [DOI] [PubMed] [Google Scholar]
- Robinson DL, Kertzman C. Covert orienting of attention in macaques. III. Contributions of the superior colliculus. J Neurophysiol. 1995;74:713–721. doi: 10.1152/jn.1995.74.2.713. [DOI] [PubMed] [Google Scholar]
- Saenz M, Buracas GT, Boynton GM. Global effects of feature-based attention in human visual cortex. Nat Neurosci. 2002;5:631–632. doi: 10.1038/nn876. [DOI] [PubMed] [Google Scholar]
- Saenz M, Buraĉas GT, Boynton GM. Global feature-based attention for motion and color. Vision Res. 2003;43:629–637. doi: 10.1016/s0042-6989(02)00595-3. [DOI] [PubMed] [Google Scholar]
- Schiller PH, Koerner F. Discharge characteristics of single units in superior colliculus of the alert rhesus monkey. J Neurophysiol. 1971;34:920–936. doi: 10.1152/jn.1971.34.5.920. [DOI] [PubMed] [Google Scholar]
- Schiller PH, Stryker M. Single-unit recording and stimulation in superior colliculus of the alert rhesus monkey. J Neurophysiol. 1972;35:915–924. doi: 10.1152/jn.1972.35.6.915. [DOI] [PubMed] [Google Scholar]
- Schneider KA, Kastner S. Visual responses of the human superior colliculus: a high-resolution functional magnetic resonance imaging study. J Neurophysiol. 2005;94:2491–2503. doi: 10.1152/jn.00288.2005. [DOI] [PubMed] [Google Scholar]
- Schneider KA, Kastner S. Effects of sustained spatial attention in the human lateral geniculate nucleus and superior colliculus. J Neurosci. 2009;29:1784–1795. doi: 10.1523/JNEUROSCI.4452-08.2009. [DOI] [PMC free article] [PubMed] [Google Scholar]
- Schneider KA, Richter MC, Kastner S. Retinotopic organization and functional subdivisions of the human lateral geniculate nucleus: a high-resolution functional magnetic resonance imaging study. J Neurosci. 2004;24:8975–8985. doi: 10.1523/JNEUROSCI.2413-04.2004. [DOI] [PMC free article] [PubMed] [Google Scholar]
- Schoenfeld MA, Hopf JM, Martinez A, Mai HM, Sattler C, Gasde A, Heinze HJ, Hillyard SA. Spatio-temporal analysis of feature-based attention. Cereb Cortex. 2007;17:2468–2477. doi: 10.1093/cercor/bhl154. [DOI] [PubMed] [Google Scholar]
- Serences JT, Boynton GM. Feature-based attentional modulations in the absence of direct visual stimulation. Neuron. 2007;55:301–312. doi: 10.1016/j.neuron.2007.06.015. [DOI] [PubMed] [Google Scholar]
- Shapley R, Kaplan E, Soodak R. Spatial summation and contrast sensitivity of X and Y cells in the lateral geniculate nucleus of the macaque. Nature. 1981;292:543–545. doi: 10.1038/292543a0. [DOI] [PubMed] [Google Scholar]
- Shibata K, Yamagishi N, Goda N, Yoshioka T, Yamashita O, Sato MA, Kawato M. The effects of feature attention on prestimulus cortical activity in the human visual system. Cereb Cortex. 2008;18:1664–1675. doi: 10.1093/cercor/bhm194. [DOI] [PubMed] [Google Scholar]
- Shulman GL, d'Avossa G, Tansy AP, Corbetta M. Two attentional processes in the parietal lobe. Cereb Cortex. 2002;12:1124–1131. doi: 10.1093/cercor/12.11.1124. [DOI] [PubMed] [Google Scholar]
- Sirotin YB, Das A. Anticipatory haemodynamic signals in sensory cortex not predicted by local neuronal activity. Nature. 2009;457:475–479. doi: 10.1038/nature07664. [DOI] [PMC free article] [PubMed] [Google Scholar]
- Smith AT, Cotton PL, Bruno A, Moutsiana C. Dissociating vision and visual attention in the human pulvinar. J Neurophysiol. 2009;101:917–925. doi: 10.1152/jn.90963.2008. [DOI] [PMC free article] [PubMed] [Google Scholar]
- Solomon SG, Peirce JW, Dhruv NT, Lennie P. Profound contrast adaptation early in the visual pathway. Neuron. 2004;42:155–162. doi: 10.1016/s0896-6273(04)00178-3. [DOI] [PubMed] [Google Scholar]
- Stoppel CM, Boehler CN, Sabelhaus C, Heinze HJ, Hopf JM, Schoenfeld MA. Neural mechanisms of spatial- and feature-based attention: a quantitative analysis. Brain Res. 2007;1181:51–60. doi: 10.1016/j.brainres.2007.07.019. [DOI] [PubMed] [Google Scholar]
- Talairach J, Tournoux P. Stereotactic coplanar atlas of the human brain. New York: Thieme Medical; 1988. [Google Scholar]
- Treue S, Martínez Trujillo JC. Feature-based attention influences motion processing gain in macaque visual cortex. Nature. 1999;399:575–579. doi: 10.1038/21176. [DOI] [PubMed] [Google Scholar]
- Valdes-Sosa M, Cobo A, Pinilla T. Attention to object files defined by transparent motion. J Exp Psychol Hum Percept Perform. 2000;26:488–505. doi: 10.1037//0096-1523.26.2.488. [DOI] [PubMed] [Google Scholar]
- Vanduffel W, Tootell RB, Orban GA. Attention-dependent suppression of metabolic activity in the early stages of the macaque visual system. Cereb Cortex. 2000;10:109–126. doi: 10.1093/cercor/10.2.109. [DOI] [PubMed] [Google Scholar]
- Wang J, Clementz BA, Keil A. The neural correlates of feature-based selective attention when viewing spatially and temporally overlapping images. Neuropsychologia. 2007;45:1393–1399. doi: 10.1016/j.neuropsychologia.2006.10.019. [DOI] [PMC free article] [PubMed] [Google Scholar]
- Wiesel TN, Hubel DH. Spatial and chromatic interactions in the lateral geniculate body of the rhesus monkey. J Neurophysiol. 1966;29:1115–1156. doi: 10.1152/jn.1966.29.6.1115. [DOI] [PubMed] [Google Scholar]
- Wojciulik E, Kanwisher N. The generality of parietal involvement in visual attention. Neuron. 1999;23:747–764. doi: 10.1016/s0896-6273(01)80033-7. [DOI] [PubMed] [Google Scholar]
- Yantis S, Serences JT. Cortical mechanisms of space-based and object-based attentional control. Curr Opin Neurobiol. 2003;13:187–193. doi: 10.1016/s0959-4388(03)00033-3. [DOI] [PubMed] [Google Scholar]
- Zhang W, Luck SJ. Feature-based attention modulates feedforward visual processing. Nat Neurosci. 2009;12:24–25. doi: 10.1038/nn.2223. [DOI] [PubMed] [Google Scholar]