

Abstract
Posttranslational amyloid-β (Aβ) modification is considered to play an important role in Alzheimer's disease (AD) etiology. An N-terminally modified Aβ species, pyroglutamate-amyloid-β (pE3–Aβ), has been described as a major constituent of Aβ deposits specific to human AD but absent in normal aging. Formed via cyclization of truncated Aβ species by glutaminyl cyclase (QC; QPCT) and/or its isoenzyme (isoQC; QPCTL), pE3–Aβ aggregates rapidly and is known to seed additional Aβ aggregation. To directly investigate pE3–Aβ toxicity in vivo, we generated and characterized transgenic TBA2.1 and TBA2.2 mice, which express truncated mutant human Aβ. Along with a rapidly developing behavioral phenotype, these mice showed progressively accumulating Aβ and pE3–Aβ deposits in brain regions of neuronal loss, impaired long-term potentiation, microglial activation, and astrocytosis. Illustrating a threshold for pE3–Aβ neurotoxicity, this phenotype was not found in heterozygous animals but in homozygous TBA2.1 or double-heterozygous TBA2.1/2.2 animals only. A significant amount of pE3–Aβ formation was shown to be QC-dependent, because crossbreeding of TBA2.1 with QC knock-out, but not isoQC knock-out, mice significantly reduced pE3–Aβ levels. Hence, lowering the rate of QC-dependent posttranslational pE3–Aβ formation can, in turn, lower the amount of neurotoxic Aβ species in AD.
Introduction
Amyloid-β (Aβ) deposits represent a characteristic neuropathological feature of Alzheimer's disease (AD). Aβ deposits comprise a variety of different Aβ peptides, of which Aβ42 plays an important role in facilitating the aggregation of Aβ (Iwatsubo et al., 1994). More recent studies suggest, however, that the total amyloid burden in the brain does not directly correlate with the cognitive status of the individuals (Snowdon, 2003). Moreover, analyses in cell culture, mice, and humans support a pathogenetically important role of intraneuronal oligomeric and N-terminally truncated Aβ species in AD (Piccini et al., 2005; Schilling et al., 2006; Friedrich et al., 2010; Gouras et al., 2010). Addressing the missing direct link between Aβ load and prevalence of AD, N-terminally modified pyroglutamate–Aβ [pyroglutamate (pyroGlu)–Aβ, Aβ(pE3–4x), pE3–Aβ] has been described to differentiate between the soluble Aβ and Aβ deposits of AD patients and those found in aged controls (Saido et al., 1995; Piccini et al., 2005; Schilling et al., 2008). pE3–Aβ is formed enzymatically during posttranslational peptide maturation via cyclization of N-terminal glutamate residues of truncated Aβ3-x species by glutaminyl cyclase (QC)-like enzymatic activity (Schilling et al., 2004; Cynis et al., 2008). pE3–Aβ shows a higher aggregation propensity and stability, as well as a stronger tendency to seed additional aggregation of other Aβ species (He and Barrow, 1999; D'Arrigo et al., 2009; Schlenzig et al., 2009), and QC-dependent generation of pE3–Aβ has been implicated recently in AD (Schilling et al., 2008; Morawski et al., 2010). This novel hypothesis of QC-dependent pE3–Aβ-mediated neurotoxicity could explain the paradox of healthy aged individuals with high amyloid plaque load but, unfortunately, has not successfully been modeled in animals thus far. To address the open question of QC-dependent Aβ modification and to assess downstream effects of neuronal overexpression of N-terminally truncated and modified Aβ, we describe here the generation of two novel transgenic mouse lines for pE3–Aβ-induced pathology, TBA2.1 and TBA2.2. Initial experimental evidence of the in vivo neurotoxic properties of pE3–Aβ was obtained from another mouse model selectively expressing Aβ(Q3–42), but these mice lacked hippocampal degeneration (Wirths et al., 2009) and the data remained incomplete because of the loss of the line. In contrast to the model described by Wirths et al. (2009), in which 100% of heterozygous (HET) mice died by the age of 80 d, both HET TBA2.1 and HET TBA2.2 animals display unaltered viability. Comprehensive in vivo evidence is presented for the concurrence of pE3–Aβ formation and neurotoxicity in these models, leading to a neuropathological phenotype showing key features of human AD.
Materials and Methods
Experimental animals
All experiments were conducted in accordance with the German animal protection act and the regulations of the government of Upper Bavaria (Grant TVA 55.2-1-54-2531-135-07). Transgenic TBA2.1 and TBA2.2 mice were generated by chromosomal integration of an expression cassette, which directs Aβ(Q3–42) expression into neuronal tissue and is based on murine Thy1.2 regulatory sequences as described by Lüthi et al. (1997). The regulatory elements flank the coding sequence for a fusion protein consisting of the pre-pro-peptide of murine thyrotropin-releasing hormone (TRH, Thyroliberin), fused to the N terminus of the modified human Aβ polypeptide Aβ(Q3–42). Prohormone convertase (PC) cleavage within the trans-Golgi and secretory vesicles liberates the N-truncated Aβ species preferentially within the secretory pathway, in which they are modified by QC activity (Friedman et al., 1995; Cynis et al., 2006). Mice used for testing were C57BL/6 × DBA1 (TBA2.1, TBA2.2) or C57BL/6/J × 129SvPas (QC-ko) hybrids, with a C57BL/6 background of >90%, and C3H mice [glutaminyl cyclase isoenzyme knock-out (isoQC-ko)]. In TBA2.1, the transgene has inserted into position 15.5–16.5 Mbp (based on NCBI Build 36) on chromosome 12, resulting in a deletion of the trib2 (Tribbles homolog 2) gene, a loss of which has been reported to show no phenotype (Takasato et al., 2008). No defined genes are described for the region directly upstream of the insertion locus. Expression levels of two genes downstream of this locus (Lpin1, Ntsr2) were analyzed using quantitative PCR. In TBA2.2, the transgene cassette has inserted into chromosome 12 at 53.5 Mbp with a 2–4 kbp deletion. The expression levels of the neighboring genes Strn3 and Heatr5a (upstream) as well as Arhgap5 and Akap6 (downstream) were characterized. We found no evidence of any functional integration effects in TBA2.1 and TBA2.2 (data not shown). Because no gender differences were observed in these lines, both male and female animals were used in this study. QC knock-out mice were generated as described previously (Schilling et al., 2011). Briefly, the QC gene was disrupted by targeted deletion of exons 4 and 5. The isoQC knock-out line was generated by chemical mutagenesis (Augustin et al., 2005) and carries a T-to-A nucleotide substitution at nucleotide position 442 in the isoQC reference sequence (RefSeq identification number NM_026111), leading to the introduction of a stop codon into the isoQC open reading frame. This missense mutation terminates polypeptide synthesis during translation at amino acid residue position 144 of the isoQC polypeptide. Both lines were used in crossbreeding experiments to assess pE3–Aβ formation in the absence of either QC enzymatic activity in homozygous (HOM) TBA2.1/QC−/− animals or of isoQC activity in HOM TBA2.1/isoQC−/− animals.
Preparation of brain tissue for quantitative RT-PCR and immunochemical analysis
Mice were deeply anesthetized with carbon dioxide and transcardially perfused with PBS; brains were removed from the skull, snap frozen in liquid nitrogen, and stored at −80°C for RNA or protein expression analysis.
Genetic characterization of transgenic models
Mapping of the chromosomal transgene integration sites was performed as described by Siebert et al. (1995), using the Genome Walker Universal kit (Clontech). Transgene expression levels were assessed by real-time quantitative RT-PCR. In brief, total brain biopsies were homogenized in QIAzol reagent (Qiagen) using an Ultra Turrax disperser (Sigma), and, after centrifugation, total RNA was further purified from the aqueous phase using RNeasy spin columns (Qiagen). RNA at 1 μg was reverse transcribed using oligo-dT primers and Superscript II (Invitrogen) according to the instructions of the manufacturer. PCR reactions were performed in duplicate using 1 μl of resulting cDNA per 20 μl of reaction volume containing QuantiTect SYBR Green PCR Master Mix (Qiagen). The housekeeping gene β-actin (ACTB) was used as control. Two transgene specific primer sets were used for PCR amplification, with one set containing primer pairs 5′-AAACGCCAATTCCGACAT-3′ (forward) and 5′-GAAGGACCTCGAGTTACGC-3′ (reverse), and the other set containing primers 5′-CTCTTGGCACCTAGAGGATCT-3′ (forward) and 5′-AAGGTCAGGAGTCACAGCAC-3′ (reverse). Primers for mouse ACTB were purchased from Qiagen. PCR was performed on a LightCycler instrument (Roche) according to preset protocol, and mRNA levels were analyzed by the ΔΔCt method.
ELISA analysis of Aβ/pE3–Aβ levels
Brain tissue was homogenized in 2% SDS in distilled water (SDS fraction) by means of a Precellys (Peqlab) homogenizer followed by one round of sonication. The resulting homogenate was centrifuged at 75,000 × g for 1 h at 4°C. The supernatant was stored at −80°C, and Aβ peptides were further extracted with 70% formic acid [formic acid fraction (FA)]. The SDS and FA fractions were subjected to Aβx-42 and Aβ(pE3–42) ELISA (IBL International). ELISA was performed according to the instructions of the manufacturer. After quantification, the Aβ content was normalized to the brain wet weight.
Behavioral characterization
Primary screening.
Semiquantitative characterization of general health, neurological reflexes, and sensory functions was achieved by monthly application of a battery of assays generally referred to as the SHIRPA screening protocol (Rogers et al., 1997), and consisting of primary screening of muscle and lower motor neuron functions and spinocerebellar, sensory, neuropsychiatric, and autonomic functions. Primary screening provides a behavioral and functional profile by observational assessment, suitable for detecting phenotypes that could interfere with additional behavioral assays. Highly standardized primary screens were applied by trained observers blinded to the genotype of the animals and were initiated with observing social behavior in the home cage (“home-cage observation”), subsequently followed by monitoring of undisturbed behavior of single animals in a clear Plexiglas arena for 90 s (“individual observation”). This analysis was followed by a battery of simple behavioral assays characterizing the acoustic startle reflex, hanging behavior, visual placing, falling behavior, righting reflex, postural reflex, negative geotaxis, hanging wire, ear twitch, whiskers twitch, and eyeblink, as well as assessment of dysmorphology and body weight (Karl et al., 2003). Results were displayed as percentage affected HOM animals.
Rotarod/accelerod.
Quantification of time and maximal speed an animal reaches on a rotating rod represents a standard assay allowing an assessment of motor coordination and balance. Testing was performed on 2 consecutive days, using a computer-controlled RotaRod System (TSE Systems). In the first morning session, mice were trained on a constantly rotating rod at 10 rpm until they were able to remain on the drum for at least 60 s (maximum of 60 trials). In the afternoon and on the following day, three test sessions were conducted, each consisting of three trials. Rod speed was accelerated from 4 to 40 rpm over a 5 min period. The total distance moved until the animal fell off the drum was recorded. Performance was examined for each testing trial (motor learning) and using best trial analysis (motor coordination). Only male animals were tested. Results were displayed as percentage of wild-type (WT) littermate motor performance.
Automated phenotyping.
Circadian pattern of locomotor activity and ingestion behavior were assessed using the PhenoMaster system (TSE Systems). Two horizontally staked infrared-sensor frames detected locomotion in the horizontal axis and rearing events in the vertical axis. Water and food consumption was measured by two scales. Continuous recording of these four parameters was performed simultaneously for all mice in individual observation units (standard type III cages with grid lid) for 6 d. Data were collected automatically with a rate of 100 Hz and stored on a personal computer as a sum over 1 min intervals. The observations took place under a 12 h light/dark cycle (lights on, 6:00 A.M.; lights out, 6:00 P.M.). Animals received water and food ad libitum and remained undisturbed by the investigator during observation. Only male animals were tested. Results were analyzed using two-way repeated-measures ANOVA, with the factor genotype representing the inter-individual factor and time representing the intra-individual factor.
Acoustic startle response/prepulse inhibition.
Acoustic startle response and prepulse inhibition (PPI) were measured in HOM TBA2.1 and WT pups at postnatal days 17 (data not shown) and 28. The age of testing was validated in preliminary studies. Pups were placed in a startle chamber (TSE Systems), and the following protocol was used. Habituation and baseline determination of 30 s each with 68 dB white noise followed by 15 startle trials with 120 dB white noise was conducted, followed by 62 randomized trials (10 startle trials: 20 ms of 120 dB white noise; 4 × 10 prepulse + startle trials: 20 ms of white noise preceded 100 ms by 20 ms of 72/76/80 or 84 dB white noise; 4 × 3 control trials: 20 ms of 72/76/80 or 84 dB white noise followed by 100 ms of 68 dB white noise). Only male animals were tested. Results are displayed as percentage inhibition of startle response and were analyzed using two-way repeated-measures ANOVA with the factor genotype representing the inter-individual factor and prepulse intensity representing the intra-individual factor.
Immunohistochemical and histochemical studies
For histochemical analysis and immunohistochemistry on paraffin sections, mice were deeply anesthetized and transcardially perfused with PBS, and brains were removed. Tissue was then immersion fixed in HOPE fixative (DCS Innovative Diagnostic Systems) or IHC Zinc Fixative (BD Pharmingen), dehydrated, embedded in low-melting-point paraffin (DCS Innovative Diagnostic Systems), and sectioned at 8–10 μm on a rotating microtome. For immunohistochemistry on frozen and vibratome sections, PBS perfusion was followed by perfusion with a solution of 4% paraformaldehyde (PFA) and 1.4% sodium cacodylate in PBS. After extraction from the skull, postfixation by immersion in the same fixative, and cryoprotection in 15% sucrose (1 d) and 30% sucrose (2 d), brains were snap frozen in isopentane at −65°C and stored at −80°C until sectioning. Brains processed at Neuroscience Associates were stored in storage buffer after perfusion for shipment and processed according to Neuroscience Associates protocol.
After deparaffinization of HOPE-fixed or IHC Zinc-fixed sections according to the protocols of the manufacturers or thawing of frozen sections, immunohistochemical stainings were performed on both paraffin sections (8–10 μm) and frozen sections (35 μm) incubating with the primary antisera overnight at 4°C. For immunodetection, a biotinylated mouse-specific IgG secondary antibody (Vector Laboratories) was used, followed by diaminobenzidine staining (Vectastain ABC kit; Vector Laboratories). In double fluorescent immunolabeling procedures, secondary antibodies were Cy2- or Cy3- coupled species-specific IgGs (Dianova). Double immunofluorescent labeling of QC and Aβ was performed as described previously (Morawski et al., 2010; Hartlage-Rübsamen et al., 2011). For histological analysis and counterstaining, sections were stained with thionine or neutral red. For calbindin immunostaining, 50 μm vibratome sections of 4% PFA-fixed brains were subjected to a protocol using a commercially available anti-calbindin antibody as described previously (Petrasch-Parwez et al., 2007). Briefly, sections were reduced in 1% sodium borohydride, blocked in PBS with 10% normal goat serum (plus 0.3% Triton X-100) for 30 min in a free-floating manner, and incubated with the calbindin antibody diluted 1:10,000 in the same solution for 72 h at 4°C. Then sections were washed in PBS, preincubated with 0.1% BSA in PBS for 1 h, and incubated overnight with biotinylated goat anti-rabbit secondary antibody (Vector Laboratories). After washing and blocking, sections were incubated for 4 h with the avidin–biotin–peroxidase complex (ABC Elite reagent; Vector Laboratories) at 4°C. Peroxidase activity was visualized with 3,3′-diaminobenzidine (DAB). Finally, sections were mounted on Superfrost Plus slides, air dried for 2 h, dehydrated, and coverslipped. For quantification of neuronal loss in the hippocampal CA1 region of TBA2.1 mice, NeuN-stained 8 μm coronal sections were quantitatively analyzed (n = 12 sections per group). The sections were separated by equal distances (16 μm). To ensure inter-individual comparability, only sections corresponding to stereotaxic levels bregma −1.8 mm to −2.2 mm (as defined by Paxinos and Franklin, 2008) were used for analysis. The number of pyramidal neurons was measured manually using digital photomicrographs. For additional quantification of CA1 neurons at higher magnification, 0.75 μm semithin sections of the frontal CA1 area (stereotaxic coordinates bregma −1.7 mm to −1.9 mm) in the rostral hippocampus of WT and HOM TBA2.1 mice were examined (n = 13 per genotype). In semithin sections, the appropriate CA1 subdivision was readily distinguishable from the adjacent fasciola cinereum (FC) based on cytoarchitectonic criteria. Sections were separated by equal distances of 20 μm. The region of interest (ROI) for quantification was defined by positioning a rectangular counting frame of 50 × 193.3 μm onto the pyramidal cell layer adjacent to the FC at low-power magnification (40×). The ROI was adjusted to the pyramidal cell layer of WT mice. Quantification was performed independently by two individuals blinded to the genotype (concordance ≥95% across all sections) at high-power magnification (400×), counting only cells with a distinct clear nucleus of ≥9 μm in diameter.
Electron microscopy
For electron microscopic analysis, brains were adjusted in a Plexiglas frame according to the orientation of Paxinos and Franklin (2008), embedded in 2% agarose in PBS and cut into 3 mm frontal brain blocks with a vibratome. Blocks containing the hippocampus were further cut into series of 50 μm vibratome sections. Every fifth section was photodocumented for later orientation, postfixed with 2% osmium tetroxide in PBS for 30 min, and flat-embedded in Araldite (Serva) as described (Petrasch-Parwez et al., 2007). The embedded vibratome sections were prepared for semithin and ultrathin section series and cut with a Leica Ultracut UCT microtome. Semithin sections (0.75 μm) were stained with 1% toluidine blue. Ultrathin sections (100 nm) were contrasted with uranyl acetate and lead citrate. Light microscopic pictures were taken by a DP71 camera (Olympus). Ultrathin sections were analyzed in a Philips EM 420 electron microscope and documented by the digital system DITABIS (Digital Biomedical Imaging System).
Multibrain sections
Using the advantage of this approach, 25 mouse brains were embedded within a single gelatin matrix, freeze cut, and collected into series in which every 24th section was collected into a separate container; each series was then stained separately as free-floating section, enabling two-dimensional analysis of age- and region-specific characteristics. MultiBrain embedding, the Campbell–Switzer (CS) stain for AD-like neuropathology, and the amino–cupric–silver (AmCuAg) staining for acute neurodegeneration (Switzer, 2000) were a proprietary service of Neuroscience Associates. High-sensitivity immunohistochemistry on multibrain sections was performed essentially following the protocol described by Osmand et al. (2006). This involved treatment with sodium borohydride, blocking with 0.4% Triton X-100, and overnight incubation in a solution of biotinylated primary antibody at concentrations ranging from 30 to 300 ng/ml, followed by exposure to biotinylated secondary species-specific antibody and enzymatic detection using a 1:400 dilution of reagents A and B from the ABC Elite reagent (Vector Laboratories) and Ni2+–DAB–H2O2. In addition, a biotin–tyramide amplification step and a thionine counterstain were performed on selected sections.
Antibodies
The following antibodies were used in this study: neuron-specific antibody NeuN (mouse monoclonal, MAB377; Millipore Bioscience Research Reagents; 1:2000 dilution), glia-specific antibody GFAP (rabbit polyclonal, Z0334; Dako; 1:5000 dilution), and microglia-specific antibody Iba1 (rabbit polyclonal, 019-19741; Wako Pure Chemical Industries; 1:1000 dilution); for precise hippocampal subdivision, Calbindin D-28K antibody (rabbit polyclonal, CB38a; Swant; 1:10,000 dilution); for pE3–Aβ-specific antibodies, pGlu6 (mouse monoclonal; Probiodrug; 1:500 dilution) and pyroGlu Aβ (rabbit polyclonal, 218003; Synaptic Systems; 1:500 dilution); and for Aβ-specific antibodies, 4G8 (mouse monoclonal, BM2568B; Acris; 1:1000 dilution) and 6E10 (mouse monoclonal; Calbiochem, Merck; 1:1000 dilution), as well as QC-specific antibody 1301 (rabbit polyclonal, affinity purified; Probiodrug; 1:200 dilution). For stainings of multibrain sections, these antibodies were generally used at an additional dilution of 1:10. The biotinylated forms of certain antibodies were also used: b-NeuN (mouse monoclonal, ab77315; Abcam; 1:1500 dilution), Aβ-specific antibody b-4G8 (mouse monoclonal, SIG-39240; Covance; 1:10,000 dilution), and pE3–Aβ-specific antibody b-pGlu6 (mouse monoclonal; Probiodrug; 1:500 dilution).
Electrophysiology
Measurements of long-term potentiation (LTP) were performed on male TBA2.1 mice aged 2.5 and 5 months. Hippocampal slices (400 μm) were prepared as described previously (Rönicke et al., 2010). Briefly, both hippocampi were isolated and transferred into a submerged-type recording chamber and were allowed to recover for at least 30 min before initiating the experiment. The chamber was constantly perfused with artificial CSF (ACSF) at a rate of 2.5 ml/min at 33 ± 1°C. Synaptic responses were elicited by stimulation of the Schaffer collateral–commissural fibers in the stratum radiatum of the CA1 region using lacquer-coated stainless steel stimulating electrodes. Glass electrodes (filled with ACSF, 1–4 MΩ) were placed in the apical dendritic layer to record field EPSPs (fEPSPs). The initial slope of the fEPSP was used as a measure of this potential. An input–output curve was performed by applying increasing stimulus strengths (starting from 1 V to maximum of 3.5 V in 0.5 V steps applied every 5 min) and measuring the resulting fEPSP response. The stimulus strength of the test pulses was adjusted to 30% of the EPSP maximum. During baseline recording, single stimuli were applied every minute (0.0166 Hz) and were averaged every 5 min. Once a stable baseline had been established, long-term potentiation was induced by applying 100 pulses at an interval of 10 ms and a width of the single pulses of 0.2 ms (strong tetanus) three times at 10 min intervals. The potentiated synaptic response was recorded for 4 h.
Results
Generation of transgenic mice: direction of truncated Aβ into the secretory pathway induces an early progressive phenotype
To generate a model for pE3–Aβ toxicity, two transgenic mouse lines (TBA2.1 and TBA2.2) were generated expressing an N-terminally truncated Aβ transgene that was glutamate-to-glutamine modified at position 3, engineered to liberate its product Aβ(Q3–42) preferentially within the secretory pathway (Fig. 1A). The transgenic cassette is based on the pre-pro-sequence of murine TRH fused to the coding sequence of human Aβ(Q3–42). Processing of the TRH sequence has been shown to take place in the secretory pathway of neurons, facilitated by signal peptidase and PCs (Nillni and Sevarino, 1999). Thus, using the transgenic strategy described here, PC processing leads to the preferential liberation of Aβ within the trans-Golgi network and secretory granules. Generation of two transgenic lines was initiated to reduce chromosomal transgene integration site effects and to examine dosage effects of the transgene. Integration sites were mapped for both lines, and the expression cassettes were found to be inserted in multiple copies in different regions of chromosome 12 in both TBA2.1 and TBA2.2. HOM mice were slightly underrepresented in both genders, whereas the breeding performance of HET breeder pairs was excellent. Transgene expression levels reached their maximum between postnatal days 12 and 28 and then remained constant up to postnatal day 90 (data not shown). TBA2.2 displayed ∼70–80% of the TBA2.1 expression levels, and transgene expression was strictly gene-dosage dependent. Hence, expression levels in HET TBA2.1 were ∼50% of the HOM, and double HET TBA2.1/TBA2.2 animals reached ∼90% of the HOM TBA2.1 (Fig. 1B). Onset of first phenotypic changes, such as reduced body weight gain, abnormalities in primary SHIRPA-based neurobiological screening parameters, or frequency of rearing were detectable very early in HOM TBA2.1 and in double HET TBA2.1/TBA2.2 transgenic animals. Specifically, these changes consisted of altered hanging behavior (cramping, tremor) and/or delayed righting reflexes (Fig. 1C), these symptoms appearing only a few weeks after onset of transgene expression. Additionally, both HOM TBA2.1 (Fig. 1D) and double HET TBA2.1/TBA2.2 (Fig. 1D, inset) transgenic animals showed significantly reduced weight gain. Although there were no changes in survival of either HET TBA2.1 or HET TBA2.2 animals up to the age of 21 months, HOM TBA2.1 animals died prematurely or had to be killed for ethical reasons as a result of moribund status and/or severe feeding difficulties between 5 and 7 months of age (for details, see Fig. 6A–C).
Figure 1.

Genetic construct, phenotypic hallmarks, and Aβ/pE3–Aβ levels in TBA2.1 and TBA2.1/2.2 mice. In the construct of TBA2.1 and TBA2.2, Aβ(Q3–42) is fused to pre-pro-TRH for product liberation within the secretory pathway. After prohormone convertase cleavage, the N-terminally truncated Aβ peptide is transported into the trans-Golgi and secretory vesicles, in which the N terminus is available to QC for cyclization (A). Transgene expression levels (B) in both lines are gene-dosage dependent, with TBA2.2 expressing ∼80% of transgene compared with HOM TBA2.1 and double HET TBA2.1/TBA2.2 animals expressing ∼90% of transgene. HOM TBA2.1 mice aged 3 months are severely affected in hanging behavior and righting reflex paradigms (C). Both HOM TBA2.1 (D) and double HET TBA2.1/TBA2.2 (D, inset) mice show significantly slower body weight gain over time compared with WT (interaction, p < 0.001); data were analyzed by two-way repeated-measures ANOVA and represent means ± SEM; n ≥ 9 animals per group. Quantification of protein levels by ELISA (E) reveals differential kinetics of Aβ and pE3–Aβ in TBA2.1, with pE3–Aβ peaking at 4 weeks and decreasing to levels of ∼30 ng/g brain at the age of 7 months, whereas Aβ levels increase continuously over time. Significant loss of pE3–Aβ is seen after genetic deletion of QC activity (F, left), whereas a similar deletion of isoQC enzymatic activity has no effect on pE3–Aβ levels (F, right); values expressed as percentage of TBA2.1 HOM/QC-ko WT or isoQC-ko WT, respectively; *p = 0.0101; data were analyzed by one-way ANOVA followed by Newman–Keuls post hoc test and represent means ± SEM; n ≥ 6 animals per group.
Figure 6.
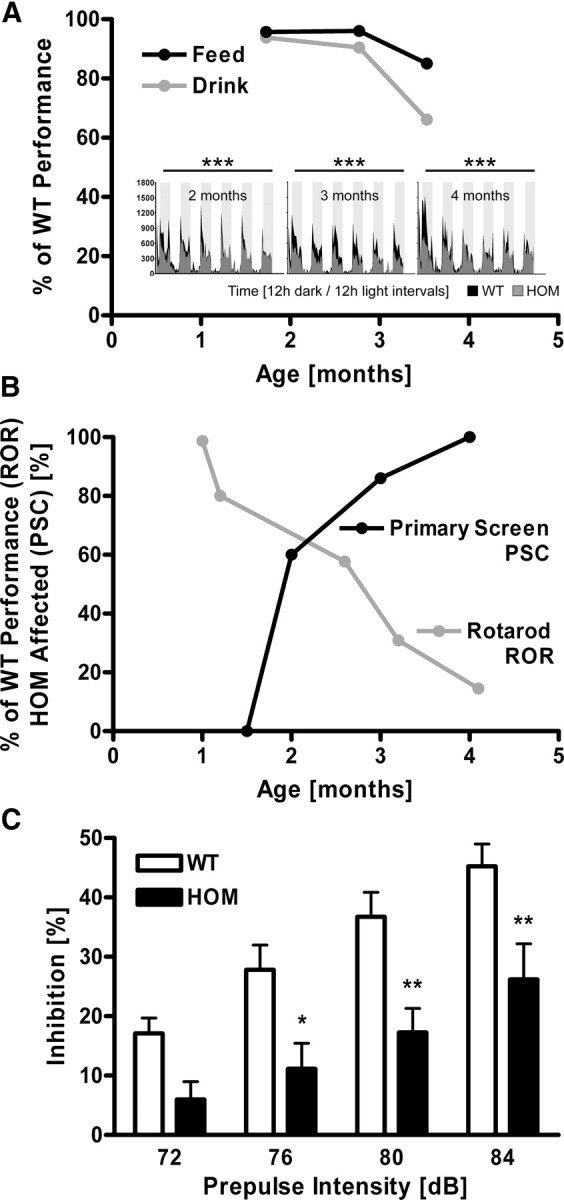
Early onset of behavioral alterations and progressive motor decline in TBA2.1 mice. Behavioral testing in automated home-cage environment reveals decline of free feeding (A, black line) and drinking (A, gray line) over time, as well as significantly altered rearing behavior across 6 d of individual recordings (A, small panels) in HOM TBA2.1 (gray actigrams) compared with age-matched WT littermates (black actigrams); data are expressed as percentage of WT littermate scores (feeding, drinking) or show number of rearing events (small panels) and were analyzed by two-way repeated-measures ANOVA and represent means; ***p < 0.001; n ≥ 7 animals per group. Abnormal performance of HOM TBA2.1 in primary neurobehavioral assessment (B, black line; percentage of animals affected per group) and in the rotarod test (B, gray line; percentage of WT littermate scores) increases over time; n ≥ 7 animals per group. A clear loss of the PPI of the auditory startle reflex in HOM TBA2.1 (C, black bars) compared with age-matched WT littermates (C, open bars) across 72–84 dB prepulse intensity (aged 28 d) is detected; *p < 0.05, **p < 0.01; data were analyzed by two-way repeated-measures ANOVA followed by Bonferroni's post hoc test and represent means ± SEM; n ≥ 14 animals per genotype.
Differential kinetics of Aβ and pE3–Aβ protein levels in TBA2.1 mice
Analysis of protein levels in brains of TBA2.1 mice showed substantial amounts of both Aβ and pE3–Aβ but with disparate kinetics (Fig. 1E). Although the levels of total Aβ increased continuously reaching 140 ng/g by the age of 7 months, pE3–Aβ levels peaked at the age of 4 weeks (approx. 60 ng/g). Surprisingly, the pE3–Aβ load showed a tendency to decrease with age, leading to levels of ∼30 ng/g at the age of 7 months. To investigate the importance of QC or isoQC activity in pE3–Aβ neuropathology, TBA2.1 mice were crossbred with lines deficient for either QC or isoQC, which were generated by deletion of entire exons of the QC gene (QC-ko) or via introduction of a nonsense mutation into the isoQC gene (isoQC-ko), respectively. Genetic elimination of QC, but not isoQC, activity resulted in a significant reduction of pE3–Aβ, illustrating that ∼40% of the levels of this N-terminally cyclized Aβ species (pE3–Aβ) in forebrain homogenates depend on QC activity (Fig. 1F).
Light and electron microscopic analysis of neuropathology in TBA2.1 mice reveals hippocampal cell loss and gliosis
To visualize possible changes in overall neuronal architecture related to early pE3–Aβ expression and associated progressive phenotypic changes, brain sections of TBA2.1 mice aged 3 months were analyzed using an anti-NeuN antibody, and neuronal numbers were quantified (Figs. 2A–E). NeuN staining revealed a dramatically altered hippocampal CA1 pyramidal cell layer in HOM TBA2.1 mice (Fig. 2C,D), whereas the morphology of CA1 was unaltered in WT controls (Fig. 2A,B), showing that neuronal loss is specific to HOM animals. Quantification confirmed the significant neuronal loss (35%) within the hippocampal CA1 in HOM TBA2.1 animals by the age of 3 months, with a total of almost 50% of pyramidal neurons lost in this region by the age of 5 months (Fig. 2E). In contrast, neuron numbers in the dentate gyrus were unaltered both in 3 and 5 month olds (data not shown), correlating closely with the immunohistochemical detection of pE3–Aβ (see below). These results were confirmed by quantification of CA1 neurons in semithin sections of WT and HOM TBA2.1 mice at higher-power magnification (400×), revealing significant neuronal loss of >40% in the rostral hippocampal CA1 region of HOM TBA2.1 (p < 0.0001; WT, 46.1 ± 1.4; HOM TBA2.1, 27.2 ± 1.5; data were analyzed by one-way ANOVA and represent mean ± SEM). The hippocampus was further investigated by calbindin immunostaining, which displayed markedly reduced immunoreactivity of the CA1 pyramidal cell somata and their dendrites in the stratum radiatum (Fig. 2G), when compared with corresponding stainings of WT mice (Fig. 2F). A specific stain for AD pathology (CS silver method) (Campbell et al., 1987) detected pathological alterations in the CA1 pyramidal cell layer of HOM animals (Fig. 2H) when compared with WT littermates (Fig. 2H, inset). Additionally, sections were stained for acute neurodegeneration applying the amino–cupric–silver stain for disintegrative degenerative changes (deOlmos' AmCuAg stain) (Switzer, 2000). Signs of severe neurodegeneration were seen in the CA1 pyramidal cell layer of HOM (Fig. 2I) and in other brain regions (data not shown) but were completely absent in WT animals (Fig. 2I, inset). To characterize degeneration in TBA2.1 in detail, 3-month-old TBA2.1 mice were investigated by analysis of semithin and ultrathin sections. Semithin sections confirmed substantial neuronal loss in the CA1 pyramidal cell layer, as well as reduced number of dendrites in the stratum radiatum of HOMs (Fig. 2K) when compared with the corresponding CA1 area in WT mice (Fig. 2J). Electron microscopic analysis of the CA1 area identified many neurons with an irregular nucleus and cytoplasm, as well as multiple pleomorphic lysosomal structures indicating severe degeneration. Other neurons showed highly condensed nuclei and cytoplasm, corresponding to dark structures observed in semithin sections (Fig. 2L,M). Double staining of QC and Aβ revealed colocalization of enzyme and substrate within the hippocampus at the age of 4 weeks in HOM TBA2.1 animals (Fig. 3C,F). TUNEL staining, as well as staining of caspase 3, showed no evidence of DNA fragmentation or apoptosis (data not shown). Therefore, it remains unclear by which exact mechanism the acute neurodegeneration (as shown by AmCuAg staining and EM) occurs. Possible co-occurrence of tau pathology was investigated using various anti-tau antibodies but showed no evidence of abnormally phosphorylated tau (data not shown). Labeling of double HET TBA2.1/TBA2.2 mice showed a similar set of pathological alterations but with a significantly later onset of pathology. Although CS pathology was obvious in TBA2.1/TBA2.2 double HETs at an age of 2 months (see Fig. 8B,D), neuronal loss comparable with HOM TBA2.1 mice at 3 months of age was only detected from the age of 7 months on or even later in double HET TBA2.1/TBA2.2 mice (see Fig. 8F,H). The nature of behavioral alterations in these animals was comparable with HOM TBA2.1, albeit with a later onset and slower progression, leading to a milder phenotype.
Figure 2.

Neuronal loss and neurodegeneration in TBA2.1 mice. NeuN immunostaining (A–D) shows thinning of the pyramidal cell layer in 3-month-old HOM TBA2.1 mice, most prominent in the medial CA1 area (arrows in C, D) when compared with age-matched WT littermates (A, B). Quantification of neurons in CA1 (E) reveals a significant reduction of neuronal numbers at the age of 3 or 5 months, respectively, in HOM TBA2.1 compared with age-matched WT littermates; ***p < 0.001; data were analyzed by one-way ANOVA followed by Newman–Keuls post hoc test and represent means ± SEM; n = 12 sections per group. Calbindin immunohistochemistry shows reduced immunoreactivity of pyramidal cell somata (PY) and processes in the stratum radiatum (RAD) of HOM TBA2.1 (G, PY and RAD) compared with WT (F). Both the Campbell–Switzer AD pathology stain (CS, H) and the amino–cupric–silver stain for acute neurodegeneration (AmCuAg, I) reveal abundant neuropathological alterations in the medial CA1 of HOM TBA2.1 (H, I) but not in WT littermates (H, I, insets). In semithin sections (J, K), the reduced PY is accompanied by a rarification of dendrites as detected in the RAD of HOM TBA2.1 (K, RAD), which is not observed in WT (J). Dark structures within the PY layer (K, arrow) correspond to severe signs of degeneration. Numerous neurons exhibit a nucleus (n) with an irregular nuclear envelope but the caryoplasm still preserved (L) and abundant cytoplasmic accumulation of dense bodies (L, M, asterisks) as detected by EM (L, M). At a more advanced stage, cell nucleus and cytoplasm are strongly condensed (M).
Figure 3.

QC and Aβ colocalize in the hippocampal CA1 of HOM TBA2.1 mice at the age of 1 month. Double immunofluorescent labeling of the hippocampal CA1 area with anti-Aβ (red) and anti-QC (green) antibodies (A–F) shows colocalization of enzyme and substrate in the hippocampus of in HOM TBA2.1 animals at 1 month of age (C, F, asterisks). QC immunoreactivity is also detected in scattered interneurons, which do not express Aβ (F, arrow).
Figure 8.
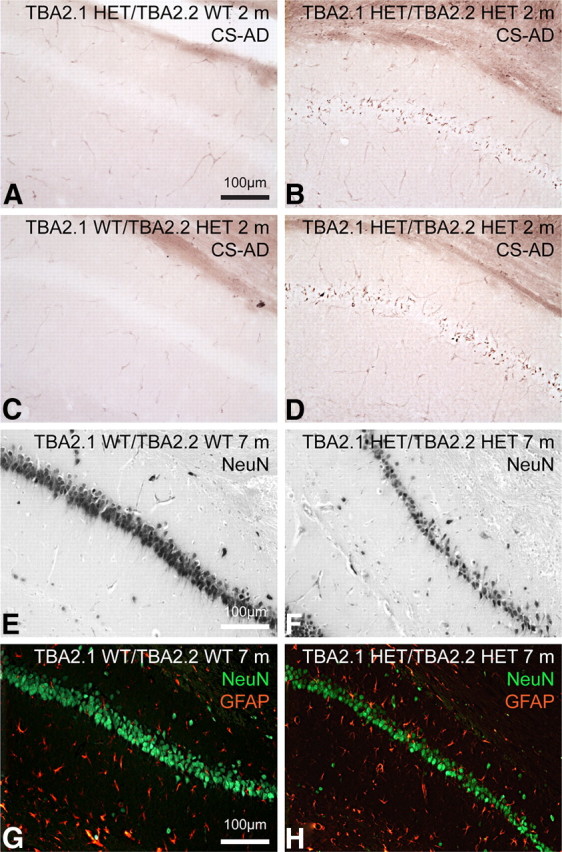
Neuropathology in the hippocampal CA1 of TBA2.1/2.2 double transgenic mice. A–D, Campbell–Switzer AD pathology staining of double HETs (B, D) and monoallelic controls (A, C), aged 2 months, reveals CS reactivity in the CA1 pyramidal cell layer of double HET animals only. NeuN immunohistochemistry shows prominent cell loss within the same region in the TBA2.1/TBA2.2 double HET animal (F) but not in the WT control (E, both aged 7 months). Double immunofluorescent labeling of neurons with NeuN (green) and glia with GFAP (red) indicates that neuronal loss is accompanied by gliosis at this time point in double HET (H), but not in WT (G).
Microgliosis, astrocytosis, and neuronal loss in TBA2.1 mice are associated with pE3–Aβ formation
To investigate the progression of gliosis and neuronal loss in CA1 over time, double immunofluorescent labeling using anti-NeuN and anti-GFAP antibodies (Fig. 4A–H), as well as immunohistochemical staining with an anti-Iba1 antibody (Fig. 4I–P), were performed on brain sections from HOM TBA2.1 and WT controls aged 1, 2, 3, and 5 months. Double immunofluorescent labeling revealed an age-dependent progress of astrocytosis in HOM animals beginning at 2 months (Fig. 4F), peaking at 3 months (Fig. 4G), and decreasing by 5 months (Fig. 4H), suggesting a considerable decline in the causative processes by this time. Dramatic neuronal loss in HOM TBA2.1 was again visible at 3 and 5 months (Fig. 4G,H). Both neuronal loss and astrocytosis were absent in HOM animals at 4 weeks of age (Fig. 4E) and in WT animals of all ages (Fig. 4A–D). Anti-Iba1 staining showed microgliosis in HOM mice aged 2 and 3 months (Fig. 4N,O), with microgliosis reduced by 5 months (Fig. 4P), but not in WT animals of the corresponding ages (Fig. 4J–L). To assess the association of neuronal loss and gliosis with expression of Aβ and pE3–Aβ, double labeling of the hippocampus with anti-Aβ or anti-pE3–Aβ, respectively, and anti-GFAP antibodies was performed (Fig. 4Q–V), revealing Aβ and pE3–Aβ immunoreactivity within the immediate areas of neuronal loss and gliosis at 3 months of age in HOM TBA2.1 (Fig. 4S–V) but not in WT animals (Fig. 4Q,R). This spatiotemporal concurrence of amyloid deposition and neurotoxicity strongly argues for pE3–Aβ-induced neurotoxicity at the cellular level. Corresponding to the later onset of pathology in TBA2.1/TBA2.2 double HETs, astrocytosis and microgliosis in these animals were also seen at a later age (see Fig. 8H).
Figure 4.
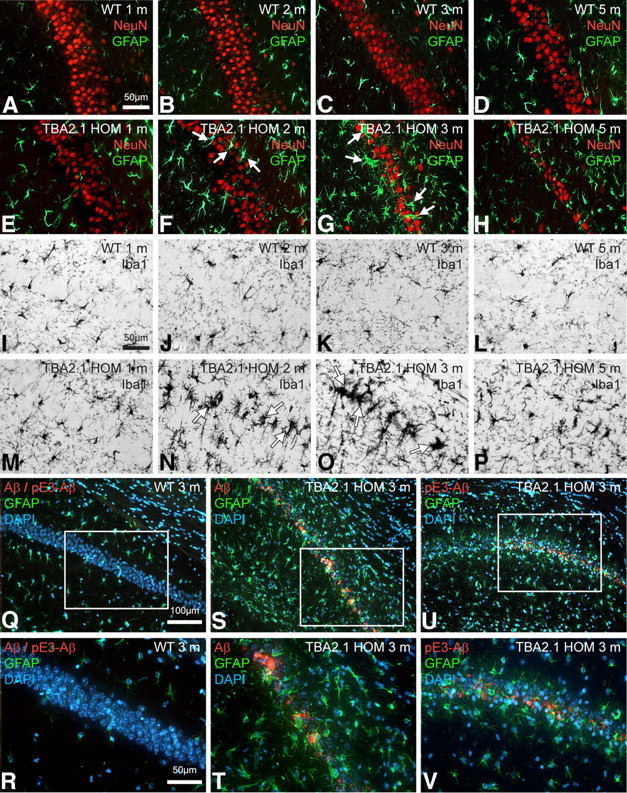
Progressing astrogliosis, microglial activation, and neuronal loss in the hippocampal CA1 region in TBA2.1 mice is associated with Aβ expression and subsequent pE3–Aβ formation. Double immunofluorescent labeling with anti-NeuN (red) and anti-GFAP (green) antibodies (A–H) shows age-dependent progress of astrogliosis within the CA1 area in HOM animals (E–H) beginning at the age of 2 months (F, arrows) and peaking at 3 months of age (G, arrows), whereas dramatic neuronal loss is visible in 3- and 5-month-old transgenic animals (G, H). Both neuronal loss and astrogliosis are absent in 1-month-old HOM TBA2.1 (E) and in WT animals of all ages (A–D). Immunohistochemical staining with an anti-Iba1 antibody (I–P) shows microgliosis in HOM animals 2 and 3 months of age (N, O, arrows) but not in WT animals of the corresponding ages (J, K), indicating neuroinflammatory processes. Labeling with anti-Aβ/anti-pE3–Aβ (red) and anti-GFAP (green) antibodies and a DAPI nuclear counterstain (blue) (Q–V) shows Aβ and pE3–Aβ immunoreactivity in the field of neuronal loss and gliosis (pyramidal cell layer) at 3 months of age in HOM TBA2.1 (S,T and U,V) but not in WT animals (Q, R), associating pathological processes with the formation of toxic pE3–Aβ from the Aβ transgene.
Hippocampal neuronal excitability and synaptic plasticity is severely impaired in TBA2.1 mice
To characterize neuronal dysfunction associated with pathological alterations in TBA2.1 mice, LTP of synaptic transmission in CA1 induced by strong tetanus stimulation was tested in WT and HOM TBA2.1 mice aged 2 and 5 months. LTP is widely accepted as the cellular correlative for learning and memory. Although no significant differences between WT and HOM TBA2.1 mice could be observed in the younger animals (Fig. 5A), HOMs showed a tendency for reduced excitability as indicated by a decreased fEPSP value during registration of input–output curve (Fig. 5B). At 5 months of age, LTP in HOM TBA2.1 was significantly reduced compared with WT mice (Fig. 5C). In addition, there was a significantly diminished fEPSP amplitude within the input–output curve in HOM (Fig. 5D). Because the fEPSP amplitude reflects the number of synchronously activated synapses, its reduction could reflect either a loss of synapses as a result of neuronal degeneration or a change in basal synaptic function, caused by decreased synaptic excitability. The impaired LTP indicates disruption of neuronal plasticity.
Figure 5.

Synaptic dysfunction in TBA2.1 mice. LTP of fEPSP after application of strong tetanus (at time point 0). At 2 months of age, LTP of HOM TBA2.1 does not differ significantly from LTP of age-matched WT littermates (A). At 5 months of age, LTP of HOM TBA2.1 is significantly diminished compared with age-matched WT littermates (C). Analog traces represent typical recordings of single experiments taken 10 min before tetanization (1) and 240 min after tetanization (2). Input–output curve showing the relation between the signal size (fEPSP slope) and the stimulation intensity reveals that, at 2 months of age, HOM TBA2.1 mice show only a slight, nonsignificant reduction of fEPSP amplitude (B). At 5 months of age, the fEPSP amplitude of HOM TBA2.1 is significantly diminished when compared with age-matched WT littermates (D); *p = 0.011, **p = 0.007; data were analyzed by two-way repeated-measures ANOVA (A, C) or by one-way ANOVA (B, D) and represent means ± SEM; n ≥ 12 animals per group.
Early behavioral alterations in TBA2.1 pups are followed by a rapidly progressing phenotype with severe motor symptoms
Lower body weights were detectable at 4 weeks of age in HOM TBA2.1, ultimately resulting in ∼30% lower body weights at 4.5 months of age (Fig. 1D). Double HET TBA2.1/TBA2.2 animals displayed a similar, although delayed, weight curve. At 4 months of age, virtually all HOM TBA2.1 animals were symptomatic in primary neurobehavioral assessment, showing tremor, rigor, and abnormal posture in the SHIRPA screen by 3 months of age (Fig. 1C). Their performance on the rotarod was <20% of that of WT littermate controls (Fig. 6B). Monitoring of free feeding and drinking as well as rearing behavior in TBA2.1 using a fully integrated and automated system (PhenoMaster) revealed a progressive decline of these home-cage activities (Fig. 6A). This onset of overt motor symptoms was preceded by a readily detectable dramatic loss of the PPI in HOM TBA2.1 pups at postnatal day 28 (Fig. 6C). Showing noncompromised startling amplitudes, the loss of PPI illustrates compromised sensorimotor gating (Geyer and Swerdlow, 1998). Onset of overt behavioral symptoms at 4 weeks of age is directly associated with the peak of pE3–Aβ levels (Fig. 1E). Although fear-conditioning experiments showed a tendency toward a possible cognitive decline in HOM TBA2.1 (data not shown), this could not be unequivocally attributed to cognitive function as a result of the severe early-onset motor phenotype. This early, progressive motor-deficiency-dominated phenotype most likely also comprised emotional changes in the light–dark transition test, the exact quantification of which was, again, confounded by severe motor dysfunction (data not shown).
Age and site specificity of neuropathology in TBA2.1 mice
To obtain a simultaneous rostral-to-caudal representation of different ages, we performed a series of high-sensitivity immunohistochemical stainings on sections of multiple brains embedded in gelatin (MultiBrain; Neuroscience Associates). Using the unique advantages of this approach, 25 mouse brains were simultaneously stained, enabling coincident analysis and comparison of age-dependent and region-specific characteristics. Analysis of the distribution of Aβ and pE3–Aβ immunoreactivity in four specific brain regions (lateral striatum, hippocampal CA1, midbrain inferior colliculus, and brainstem reticulate nuclei) revealed differential expression patterns of both proteins (Fig. 7A–P,A′–P′). Aβ reactivity using the 4G8 anti-Aβ antibody was found both intracellularly in intact cells and extracellularly in evidently disintegrated cells (Figs. 7A′–P′). Intracellularly, Aβ appeared to be originating from small, inclusion-like structures (Fig. 7D′), accumulating within the soma and being deposited extracellularly after disintegration of the neuron (Fig. 7N′). In contrast, pE3–Aβ appeared to be present diffusely in several areas (Fig. 7A–P) particularly at 1 month of age, in fibers and inclusions at later ages, and, after neuronal disintegration, in dense aggregates in the same regions, often in association with glia cells. In addition, scattered widespread deposits of Aβ and pE3–Aβ were also seen in the TBA2.1 mouse brain at 3 and 5 months of age in deep layers of cortex and in multiple midbrain, pontine, and medullary nuclei, and at 5 months in cerebellum (data not shown).
Figure 7.
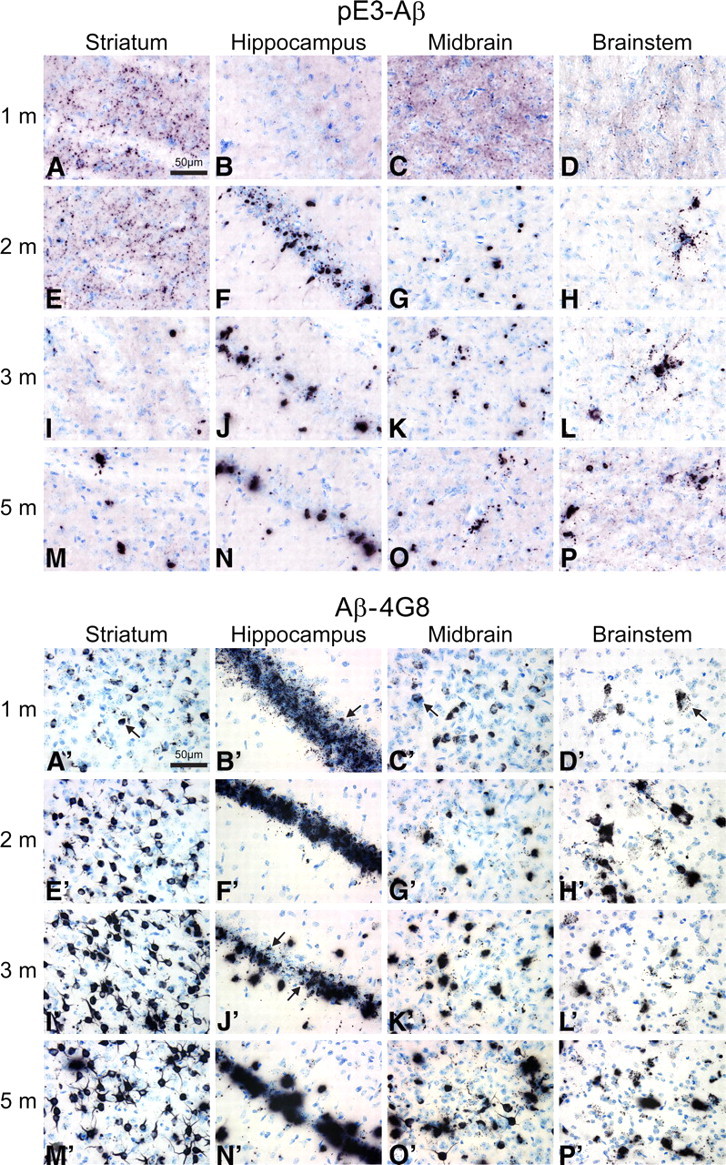
Age- and region-dependent accumulation of Aβ and pE3–Aβ in HOM TBA2.1 mice. For a simultaneous front-to-back representation of 25 brains, high-sensitivity immunohistochemistry was performed on MultiBrain sections. Two-dimensional analysis of pE3–Aβ (A–P) and Aβ (A′–P′) immunoreactivity in TBA2.1 mice reveals differential distribution patterns in different brain regions of HOM TBA2.1 mice. Aβ reactivity using the 4G8 anti-Aβ antibody is found both intracellularly in intact cells (e.g., A′–C′, arrows) and extracellularly in evidently disintegrated cells (e.g., J′, arrows). Intracellular Aβ deposits appear to be originating from small, inclusion-like structures (D′, arrow) and seem to be deposited extracellularly after disintegration of the neuron (N′). In contrast, using both a newly generated anti-pE3–Aβ antibody and a commercially available antibody, highest reactivity of pE3–Aβ is detected extracellularly after neuronal disintegration (A–P).
Discussion
To date, a large number of animal models of AD and other dementias have been generated, which have contributed to an understanding of the neuropathological characteristics of these disorders (for review, see Götz and Ittner, 2008). Many of these mimic certain neuropathological aspects, such as amyloid plaques, neurofibrillary tangles, gliosis, and neuronal loss, as well as a number of cognitive and behavioral correlates, but, so far, no model has been generated to represent the full spectrum of pathological and degenerative changes (Duyckaerts et al., 2008). The simultaneous occurrence of neuronal loss and memory deficits has been described in a variety of animal models overexpressing mutant human tau, but evidence of an accompanying amyloid pathology has not be shown. In contrast, transgenic mice expressing human APP are known for a robust APP/Aβ pathology and were shown to be impaired in memory tasks with hippocampal or amygdaloidal involvement (Götz and Ittner, 2008), but, to date, only some of the many APP and APP/PS1 transgenic rodent models have been described as showing significant neuronal loss. These discrepancies suggest some additional mechanisms underlying the pathology of AD, which are absent in the mouse. One notable difference between human AD and normal aging is the striking accumulation of N-terminally truncated and modified Aβ species, particularly pE3–Aβ, under disease conditions (Saido et al., 1995; Piccini et al., 2005; Schilling et al., 2008). Furthermore, most of the mouse models of AD do not show an accumulation of N-terminally cleaved Aβ species (Kawarabayashi et al., 2001; Kalback et al., 2002).
However, a significant accumulation of truncated Aβ with intraneuronal Aβ deposition has been linked to neuronal loss in certain mouse models combining expression of mutated APP and presenilin (APPSLPS1KI; Casas et al., 2004; Bayer and Wirths, 2008; Christensen et al., 2008) or with additional AD mutations (5XFAD; Oakley et al., 2006; Jawhar et al., 2010). Studies of the APPSLPS1KI line showed some evidence of pE3–Aβ neurotoxicity in these mice (Christensen et al., 2008; Breyhan et al., 2009; Wirths et al., 2010), and the development of novel imaging systems has further supported the role of pE3–Aβ as an important component in the amyloid deposits of transgenic mouse models (Maeda et al., 2007). To investigate the role of pE3–Aβ as a potential driver of neurotoxicity, we generated the TBA2.1 and TBA2.2 mouse lines expressing N-terminally truncated Aβ within the secretory pathway, resulting in significant pE3–Aβ formation promoted by enzymatic activity of QC, which colocalizes with prohormone convertases and is sorted to secretory vesicles.
The resulting neurodegeneration with an early-onset neuropathology, involving significant pE3–Aβ formation, associated with progressive neuronal loss and gliosis and accompanied by behavioral and motor deficits, appeared to be a consequence of intracellular neurotoxicity. A detailed analysis of Aβ expression and pE3–Aβ formation revealed differential kinetics with the amount of total Aβ increasing over time and pE3–Aβ expression peaking as early as 4 weeks of age, subsequently decreasing to steady-state levels at later ages. This decrease was attributed to the neurotoxicity of pE3–Aβ occurring in those regions and cells most prominently expressing the transgene and converting it into pE3–Aβ, whereas other cells might accumulate non-cyclized or even non-truncated endogenous Aβ forms. Measurement of QC activity in the homogenates of HOM TBA2.1 hippocampus preparations (ages 4 and 10 weeks) indicated that QC activity is higher in younger animals (data not shown), further accounting for the higher pE3–Aβ levels and consecutive decline in these animals despite continuing transgene expression. Although the mechanism of pE3–Aβ formation in other mouse models has not yet been explored, pE3–Aβ in TBA2.1 and TBA2.2 mice is formed within the secretory pathway as a result of the engineered transgene and appears to seed the formation of intracellular coaggregates with other Aβ species, enhancing the Aβ load within the cell and leading to neuronal death, with the subsequent release and extracellular deposition of these aggregated Aβ species. Thus, an intracellular accumulation of Aβ clearly precedes the neuronal dysfunction and loss of the affected cells in TBA2.1, a finding that has also been suggested for neuronal loss in APP/PS1 mice (Bayer and Wirths, 2010). It is noteworthy that the changes in histopathology are preceded by an activation of microglia and astrocytes in the affected regions, although it remains unclear whether gliosis has a solely protective role in Aβ turnover (Wyss-Coray et al., 2003) or whether it exerts contrary effects, aggravating neuropathology via excitotoxic mechanisms (Domenici et al., 2002; Block et al., 2007).
Synaptic pathology in AD has been suggested to be a consequence of altered intracellular transport mechanisms, attributable to the toxicity of Aβ (Gouras et al., 2010); this is reflected in the TBA2.1 mouse by the progressive loss of LTP in hippocampal preparations.
Behavioral evaluation of emotional and cognitive markers for neuronal dysfunction and neurodegeneration is confounded in this model by the early and severe motor impairments, because most assays for cognitive evaluation rely on motor performance to a considerable extent. Nonetheless, our findings of a loss of prepulse inhibition and early emotional changes in the dark/light box paradigm are consistent with the kinetics of transgene expression-driven pE3–Aβ levels within the basolateral amygdala, arguing for pE3–Aβ formation as the basis for alterations in limbic memory.
In summary, the pathology of the TBA2.1 mouse is unique in its early onset and an underlying mechanism of induction via an intraneuronal accumulation of N-terminally truncated Aβ. Other lines show a differential pathology devoid of neuronal loss, induced by large amounts of extracellular amyloid (McGowan et al., 2005) or, if describing similar neuropathological alterations, involve higher levels of Aβ and pE3–Aβ and display a considerably later onset of phenotype (Breyhan et al., 2009; Tomiyama et al., 2010). Although comparison of TBA2.1 with a negative control line such as transgenic mice expressing non-truncated Aβ1–40 or Aβ1–42 in a pre-pro-TRH-based vector construct would be ideal, some conclusions can be drawn from analyses of the BRI-Aβ40 and BRI-Aβ42 transgenic mice (McGowan et al., 2005). These lines, albeit expressing a different Aβ fusion protein than TBA2.1 and TBA2.2, also rely on release of the non-truncated Aβ peptide itself rather than on APP expression and processing. They efficiently produce and secrete either Aβ1–40 or Aβ1–42. The authors showed that overexpression of Aβ1–42 induces cerebral amyloid plaque pathology and plaque-associated gliosis but is not sufficient to induce neurodegeneration. The later-onset, slower pathology and milder phenotype in TBA2.1/TBA2.2 double HET animals (Fig. 8) with lower levels of pE3–Aβ strongly argue for a threshold for initiation of the neuropathological processes. This argument is supported by analysis of aged HET TBA2.1 mice. At the latest time point of analysis, 21 months of age, ELISA quantification of protein levels in brain homogenates of HET TBA2.1 mice combined with immunohistochemistry (data not shown) revealed that Aβ levels of 34 ng/g (45% of HOM aged 1 month) and corresponding pE3–Aβ levels as low as 4 ng/g (6% of HOM aged 1 month) are below the toxicity threshold, precluding the fatal change in the ratio of Aβ production versus degradation described to initiate amyloid accumulation in AD brains (Mawuenyega et al., 2010). In line with recent reports focusing on the importance of the exact composition of toxic Aβ species rather than their absolute amounts (Kuperstein et al., 2010), the significance of not only the toxic agent itself and its abundance but also its intracellular localization described in the present study sheds light onto a specific pathological process occurring early in AD and triggering additional upstream and downstream pathology. Given the potentially central role of pE3–Aβ in the pathogenesis of AD (Piccini et al., 2005), these data would provide an explanation for limited benefits achieved by current treatment strategies. Furthermore, it has been suggested that transgenic mouse models of AD based on APP, presenilin, and tau variants are essentially models of asymptomatic or pre-manifest AD (Ashe and Zahs, 2010), failing to demonstrate the cognitive deficits and neuronal loss that are characteristic of the human disease. The models described here begin to address these aspects directly and indicate novel strategies for the treatment of an underlying contribution to the pathogenesis of AD.
Footnotes
This work was supported by the German Council of Industrial Research Support (AIF) Grant KA0318901MD6 (to H.-U.D.). We are grateful to Mira Kellner, Sylvia Garke-Mayerthaler, Alexandra Graupner, Andrea Koppius, Kerstin Loske, Hans-Werner Habbes, Marlen Löbbecke-Schumacher, Eike Scheel, Katrin Böhm, and Carsten Jäger for their valuable technical assistance and to Robert C. Switzer III for critical discussion.
A.A., W.J., S.G., C.B., S.K., A.B., and R.S. are employees of Ingenium Pharmaceuticals. H.C. and S.S. are employees of Probiodrug. H.-U.D. serves as Chief Scientific Officer of Probiodrug and as Managing Director of Ingenium Pharmaceuticals. S.v.H. is consultant to the Probiodrug and Ingenium Group.
References
- Ashe KH, Zahs KR. Probing the biology of Alzheimer's disease in mice. Neuron. 2010;66:631–645. doi: 10.1016/j.neuron.2010.04.031. [DOI] [PMC free article] [PubMed] [Google Scholar]
- Augustin M, Sedlmeier R, Peters T, Huffstadt U, Kochmann E, Simon D, Schöniger M, Garke-Mayerthaler S, Laufs J, Mayhaus M, Franke S, Klose M, Graupner A, Kurzmann M, Zinser C, Wolf A, Voelkel M, Kellner M, Kilian M, Seelig S, Koppius A, Teubner A, Korthaus D, Nehls M, Wattler S. Efficient and fast targeted production of murine models based on ENU mutagenesis. Mamm Genome. 2005;16:405–413. doi: 10.1007/s00335-004-3028-2. [DOI] [PubMed] [Google Scholar]
- Bayer TA, Wirths O. Review on the APP/PS1KI mouse model: intraneuronal Abeta accumulation triggers axonopathy, neuron loss and working memory impairment. Genes Brain Behav. 2008;7(Suppl 1):6–11. doi: 10.1111/j.1601-183X.2007.00372.x. [DOI] [PubMed] [Google Scholar]
- Bayer TA, Wirths O. Intracellular accumulation of amyloid-Beta - a predictor for synaptic dysfunction and neuron loss in Alzheimer's disease. Front Aging Neurosci. 2010;2:8. doi: 10.3389/fnagi.2010.00008. [DOI] [PMC free article] [PubMed] [Google Scholar]
- Block ML, Zecca L, Hong JS. Microglia-mediated neurotoxicity: uncovering the molecular mechanisms. Nat Rev Neurosci. 2007;8:57–69. doi: 10.1038/nrn2038. [DOI] [PubMed] [Google Scholar]
- Breyhan H, Wirths O, Duan K, Marcello A, Rettig J, Bayer TA. APP/PS1KI bigenic mice develop early synaptic deficits and hippocampus atrophy. Acta Neuropathol. 2009;117:677–685. doi: 10.1007/s00401-009-0539-7. [DOI] [PubMed] [Google Scholar]
- Campbell SK, Switzer RC, Martin TL. Alzheimer's plaques and tangles: a controlled and enhanced silver staining method. Soc Neurosci Abstr. 1987;13:189–9. [Google Scholar]
- Casas C, Sergeant N, Itier JM, Blanchard V, Wirths O, van der Kolk N, Vingtdeux V, van de Steeg E, Ret G, Canton T, Drobecq H, Clark A, Bonici B, Delacourte A, Benavides J, Schmitz C, Tremp G, Bayer TA, Benoit P, Pradier L. Massive CA1/2 neuronal loss with intraneuronal and N-terminal truncated Abeta42 accumulation in a novel Alzheimer transgenic model. Am J Pathol. 2004;165:1289–1300. doi: 10.1016/s0002-9440(10)63388-3. [DOI] [PMC free article] [PubMed] [Google Scholar]
- Christensen DZ, Kraus SL, Flohr A, Cotel MC, Wirths O, Bayer TA. Transient intraneuronal A beta rather than extracellular plaque pathology correlates with neuron loss in the frontal cortex of APP/PS1KI mice. Acta Neuropathol. 2008;116:647–655. doi: 10.1007/s00401-008-0451-6. [DOI] [PubMed] [Google Scholar]
- Cynis H, Schilling S, Bodnár M, Hoffmann T, Heiser U, Saido TC, Demuth HU. Inhibition of glutaminyl cyclase alters pyroglutamate formation in mammalian cells. Biochim Biophys Acta. 2006;1764:1618–1625. doi: 10.1016/j.bbapap.2006.08.003. [DOI] [PubMed] [Google Scholar]
- Cynis H, Rahfeld JU, Stephan A, Kehlen A, Koch B, Wermann M, Demuth HU, Schilling S. Isolation of an isoenzyme of human glutaminyl cyclase: retention in the Golgi complex suggests involvement in the protein maturation machinery. J Mol Biol. 2008;379:966–980. doi: 10.1016/j.jmb.2008.03.078. [DOI] [PubMed] [Google Scholar]
- D'Arrigo C, Tabaton M, Perico A. N-terminal truncated pyroglutamyl beta amyloid peptide Abetapy3–42 shows a faster aggregation kinetics than the full-length Abeta1–42. Biopolymers. 2009;91:861–873. doi: 10.1002/bip.21271. [DOI] [PubMed] [Google Scholar]
- Domenici MR, Paradisi S, Sacchetti B, Gaudi S, Balduzzi M, Bernardo A, Ajmone-Cat MA, Minghetti L, Malchiodi-Albedi F. The presence of astrocytes enhances beta amyloid-induced neurotoxicity in hippocampal cell cultures. J Physiol Paris. 2002;96:313–316. doi: 10.1016/s0928-4257(02)00021-9. [DOI] [PubMed] [Google Scholar]
- Duyckaerts C, Potier MC, Delatour B. Alzheimer disease models and human neuropathology: similarities and differences. Acta Neuropathol. 2008;115:5–38. doi: 10.1007/s00401-007-0312-8. [DOI] [PMC free article] [PubMed] [Google Scholar]
- Friedman TC, Loh YP, Cawley NX, Birch NP, Huang SS, Jackson IM, Nillni EA. Processing of prothyrotropin-releasing hormone (Pro-TRH) by bovine intermediate lobe secretory vesicle membrane PC1 and PC2 enzymes. Endocrinology. 1995;136:4462–4472. doi: 10.1210/endo.136.10.7664666. [DOI] [PubMed] [Google Scholar]
- Friedrich RP, Tepper K, Rönicke R, Soom M, Westermann M, Reymann K, Kaether C, Fändrich M. Mechanism of amyloid plaque formation suggests an intracellular basis of Abeta pathogenicity. Proc Natl Acad Sci U S A. 2010;107:1942–1947. doi: 10.1073/pnas.0904532106. [DOI] [PMC free article] [PubMed] [Google Scholar]
- Geyer MA, Swerdlow NR. Measurement of the startle response, prepulse inhibition, and habituation. In: Crawley JN, Skolnick P, editors. Current protocols in neuroscience. New York: Wiley; 1998. pp. 8.7.1–8.7.15. [DOI] [PubMed] [Google Scholar]
- Götz J, Ittner LM. Animal models of Alzheimer's disease and frontotemporal dementia. Nat Rev Neurosci. 2008;9:532–544. doi: 10.1038/nrn2420. [DOI] [PubMed] [Google Scholar]
- Gouras GK, Tampellini D, Takahashi RH, Capetillo-Zarate E. Intraneuronal beta-amyloid accumulation and synapse pathology in Alzheimer's disease. Acta Neuropathol. 2010;119:523–541. doi: 10.1007/s00401-010-0679-9. [DOI] [PMC free article] [PubMed] [Google Scholar]
- Hartlage-Rübsamen M, Morawski M, Waniek A, Jäger C, Zeitschel U, Koch B, Cynis H, Schilling S, Schliebs R, Demuth HU, Rossner S. Glutaminyl cyclase contributes to the formation of focal and diffuse pyroglutamate (pGlu)-Aβ deposits in hippocampus via distinct cellular mechanisms. Acta Neuropathol. 2011;121:705–719. doi: 10.1007/s00401-011-0806-2. [DOI] [PMC free article] [PubMed] [Google Scholar]
- He W, Barrow CJ. The A beta 3-pyroglutamyl and 11-pyroglutamyl peptides found in senile plaque have greater beta-sheet forming and aggregation propensities in vitro than full-length A beta. Biochemistry. 1999;38:10871–10877. doi: 10.1021/bi990563r. [DOI] [PubMed] [Google Scholar]
- Iwatsubo T, Odaka A, Suzuki N, Mizusawa H, Nukina N, Ihara Y. Visualization of A beta 42(43) and A beta 40 in senile plaques with end-specific A beta monoclonals: evidence that an initially deposited species is A beta 42(43) Neuron. 1994;13:45–53. doi: 10.1016/0896-6273(94)90458-8. [DOI] [PubMed] [Google Scholar]
- Jawhar S, Trawicka A, Jenneckens C, Bayer TA, Wirths O. Motor deficits, neuron loss, and reduced anxiety coinciding with axonal degeneration and intraneuronal Abeta aggregation in the 5XFAD mouse model of Alzheimer's disease. Neurobiol Aging. 2010 doi: 10.1016/j.neurobiolaging.2010.05.027. [DOI] [PubMed] [Google Scholar]
- Kalback W, Watson MD, Kokjohn TA, Kuo YM, Weiss N, Luehrs DC, Lopez J, Brune D, Sisodia SS, Staufenbiel M, Emmerling M, Roher AE. APP transgenic mice Tg2576 accumulate Abeta peptides that are distinct from the chemically modified and insoluble peptides deposited in Alzheimer's disease senile plaques. Biochemistry. 2002;41:922–928. doi: 10.1021/bi015685+. [DOI] [PubMed] [Google Scholar]
- Karl T, Pabst R, von Hörsten S. Behavioral phenotyping of mice in pharmacological and toxicological research. Exp Toxicol Pathol. 2003;55:69–83. doi: 10.1078/0940-2993-00301. [DOI] [PubMed] [Google Scholar]
- Kawarabayashi T, Younkin LH, Saido TC, Shoji M, Ashe KH, Younkin SG. Age-dependent changes in brain, CSF, and plasma amyloid (beta) protein in the Tg2576 transgenic mouse model of Alzheimer's disease. J Neurosci. 2001;21:372–381. doi: 10.1523/JNEUROSCI.21-02-00372.2001. [DOI] [PMC free article] [PubMed] [Google Scholar]
- Kuperstein I, Broersen K, Benilova I, Rozenski J, Jonckheere W, Debulpaep M, Vandersteen A, Segers-Nolten I, Van Der Werf K, Subramaniam V, Braeken D, Callewaert G, Bartic C, D'Hooge R, Martins IC, Rousseau F, Schymkowitz J, De Strooper B. Neurotoxicity of Alzheimer's disease Aβ peptides is induced by small changes in the Aβ42 to Aβ40 ratio. EMBO J. 2010;29:3408–3420. doi: 10.1038/emboj.2010.211. [DOI] [PMC free article] [PubMed] [Google Scholar]
- Lüthi A, Van der Putten H, Botteri FM, Mansuy IM, Meins M, Frey U, Sansig G, Portet C, Schmutz M, Schröder M, Nitsch C, Laurent JP, Monard D. Endogenous serine protease inhibitor modulates epileptic activity and hippocampal long-term potentiation. J Neurosci. 1997;17:4688–4699. doi: 10.1523/JNEUROSCI.17-12-04688.1997. [DOI] [PMC free article] [PubMed] [Google Scholar]
- Maeda J, Ji B, Irie T, Tomiyama T, Maruyama M, Okauchi T, Staufenbiel M, Iwata N, Ono M, Saido TC, Suzuki K, Mori H, Higuchi M, Suhara T. Longitudinal, quantitative assessment of amyloid, neuroinflammation, and anti-amyloid treatment in a living mouse model of Alzheimer's disease enabled by positron emission tomography. J Neurosci. 2007;27:10957–10968. doi: 10.1523/JNEUROSCI.0673-07.2007. [DOI] [PMC free article] [PubMed] [Google Scholar]
- Mawuenyega KG, Sigurdson W, Ovod V, Munsell L, Kasten T, Morris JC, Yarasheski KE, Bateman RJ. Decreased clearance of CNS beta-amyloid in Alzheimer's disease. Science. 2010;330:1774. doi: 10.1126/science.1197623. [DOI] [PMC free article] [PubMed] [Google Scholar]
- McGowan E, Pickford F, Kim J, Onstead L, Eriksen J, Yu C, Skipper L, Murphy MP, Beard J, Das P, Jansen K, Delucia M, Lin WL, Dolios G, Wang R, Eckman CB, Dickson DW, Hutton M, Hardy J, Golde T. Abeta42 is essential for parenchymal and vascular amyloid deposition in mice. Neuron. 2005;47:191–199. doi: 10.1016/j.neuron.2005.06.030. [DOI] [PMC free article] [PubMed] [Google Scholar]
- Morawski M, Hartlage-Rübsamen M, Jäger C, Waniek A, Schilling S, Schwab C, McGeer PL, Arendt T, Demuth HU, Rossner S. Distinct glutaminyl cyclase expression in Edinger-Westphal nucleus, locus coeruleus and nucleus basalis Meynert contributes to pGlu-Abeta pathology in Alzheimer's disease. Acta Neuropathol. 2010;120:195–207. doi: 10.1007/s00401-010-0685-y. [DOI] [PMC free article] [PubMed] [Google Scholar]
- Nillni EA, Sevarino KA. The biology of pro-thyrotropin-releasing hormone-derived peptides. Endocr Rev. 1999;20:599–648. doi: 10.1210/edrv.20.5.0379. [DOI] [PubMed] [Google Scholar]
- Oakley H, Cole SL, Logan S, Maus E, Shao P, Craft J, Guillozet-Bongaarts A, Ohno M, Disterhoft J, Van Eldik L, Berry R, Vassar R. Intraneuronal beta-amyloid aggregates, neurodegeneration, and neuron loss in transgenic mice with five familial Alzheimer's disease mutations: potential factors in amyloid plaque formation. J Neurosci. 2006;26:10129–10140. doi: 10.1523/JNEUROSCI.1202-06.2006. [DOI] [PMC free article] [PubMed] [Google Scholar]
- Osmand AP, Berthelier V, Wetzel R. Imaging polyglutamine deposits in brain tissue. Methods Enzymol. 2006;412:106–122. doi: 10.1016/S0076-6879(06)12008-X. [DOI] [PubMed] [Google Scholar]
- Paxinos G, Franklin KB. Ed 3. San Diego: Elsevier Academic; 2008. The mouse brain in stereotaxic coordinates. [Google Scholar]
- Petrasch-Parwez E, Nguyen HP, Löbbecke-Schumacher M, Habbes HW, Wieczorek S, Riess O, Andres KH, Dermietzel R, Von Hörsten S. Cellular and subcellular localization of Huntingtin aggregates in the brain of a rat transgenic for Huntington disease. J Comp Neurol. 2007;501:716–730. doi: 10.1002/cne.21272. [DOI] [PubMed] [Google Scholar]
- Piccini A, Russo C, Gliozzi A, Relini A, Vitali A, Borghi R, Giliberto L, Armirotti A, D'Arrigo C, Bachi A, Cattaneo A, Canale C, Torrassa S, Saido TC, Markesbery W, Gambetti P, Tabaton M. beta amyloid is different in normal aging and in Alzheimer disease. J Biol Chem. 2005;280:34186–34192. doi: 10.1074/jbc.M501694200. [DOI] [PubMed] [Google Scholar]
- Rogers DC, Fisher EM, Brown SD, Peters J, Hunter AJ, Martin JE. Behavioral and functional analysis of mouse phenotype: SHIRPA, a proposed protocol for comprehensive phenotype assessment. Mamm Genome. 1997;8:711–713. doi: 10.1007/s003359900551. [DOI] [PubMed] [Google Scholar]
- Rönicke R, Mikhaylova M, Rönicke S, Meinhardt J, Schröder UH, Fändrich M, Reiser G, Kreutz MR, Reymann KG. Early neuronal dysfunction by amyloid beta oligomers depends on activation of NR2B-containing NMDA receptors. Neurobiol Aging. 2010 doi: 10.1016/j.neurobiolaging.2010.01.011. [DOI] [PubMed] [Google Scholar]
- Saido TC, Iwatsubo T, Mann DM, Shimada H, Ihara Y, Kawashima S. Dominant and differential deposition of distinct beta-amyloid peptide species, A beta N3(pE), in senile plaques. Neuron. 1995;14:457–466. doi: 10.1016/0896-6273(95)90301-1. [DOI] [PubMed] [Google Scholar]
- Schilling S, Hoffmann T, Manhart S, Hoffmann M, Demuth HU. Glutaminyl cyclases unfold glutamyl cyclase activity under mild acid conditions. FEBS Lett. 2004;563:191–196. doi: 10.1016/S0014-5793(04)00300-X. [DOI] [PubMed] [Google Scholar]
- Schilling S, Lauber T, Schaupp M, Manhart S, Scheel E, Böhm G, Demuth HU. On the seeding and oligomerization of pGlu-amyloid peptides (in vitro) Biochemistry. 2006;45:12393–12399. doi: 10.1021/bi0612667. [DOI] [PubMed] [Google Scholar]
- Schilling S, Zeitschel U, Hoffmann T, Heiser U, Francke M, Kehlen A, Holzer M, Hutter-Paier B, Prokesch M, Windisch M, Jagla W, Schlenzig D, Lindner C, Rudolph T, Reuter G, Cynis H, Montag D, Demuth HU, Rossner S. Glutaminyl cyclase inhibition attenuates pyroglutamate Abeta and Alzheimer's disease-like pathology. Nat Med. 2008;14:1106–1111. doi: 10.1038/nm.1872. [DOI] [PubMed] [Google Scholar]
- Schilling S, Kohlmann S, Bäuscher C, Sedlmeier R, Koch B, Eichentopf R, Becker A, Cynis H, Hoffmann T, Berg S, Freyse EJ, von Hörsten S, Rossner S, Graubner S, Demuth HU. Glutaminyl cyclase (QC) knock out mice show mild hypothyreodism but absence of hypogonadism: implications for enzyme function and drug development. J Biol Chem. 2011;286:14199–14208. doi: 10.1074/jbc.M111.229385. [DOI] [PMC free article] [PubMed] [Google Scholar]
- Schlenzig D, Manhart S, Cinar Y, Kleinschmidt M, Hause G, Willbold D, Funke SA, Schilling S, Demuth HU. Pyroglutamate formation influences solubility and amyloidogenicity of amyloid peptides. Biochemistry. 2009;48:7072–7078. doi: 10.1021/bi900818a. [DOI] [PubMed] [Google Scholar]
- Siebert PD, Chenchik A, Kellogg DE, Lukyanov KA, Lukyanov SA. An improved PCR method for walking in uncloned genomic DNA. Nucleic Acids Res. 1995;23:1087–1088. doi: 10.1093/nar/23.6.1087. [DOI] [PMC free article] [PubMed] [Google Scholar]
- Snowdon DA. Healthy aging and dementia: findings from the Nun Study. Ann Intern Med. 2003;139:450–454. doi: 10.7326/0003-4819-139-5_part_2-200309021-00014. [DOI] [PubMed] [Google Scholar]
- Switzer RC., 3rd Application of silver degeneration stains for neurotoxicity testing. Toxicol Pathol. 2000;28:70–83. doi: 10.1177/019262330002800109. [DOI] [PubMed] [Google Scholar]
- Takasato M, Kobayashi C, Okabayashi K, Kiyonari H, Oshima N, Asashima M, Nishinakamura R. Trb2, a mouse homolog of tribbles, is dispensable for kidney and mouse development. Biochem Biophys Res Commun. 2008;373:648–652. doi: 10.1016/j.bbrc.2008.06.088. [DOI] [PubMed] [Google Scholar]
- Tomiyama T, Matsuyama S, Iso H, Umeda T, Takuma H, Ohnishi K, Ishibashi K, Teraoka R, Sakama N, Yamashita T, Nishitsuji K, Ito K, Shimada H, Lambert MP, Klein WL, Mori H. A mouse model of amyloid β oligomers: their contribution to synaptic alteration, abnormal tau phosphorylation, glial activation, and neuronal loss in vivo. J Neurosci. 2010;30:4845–4856. doi: 10.1523/JNEUROSCI.5825-09.2010. [DOI] [PMC free article] [PubMed] [Google Scholar]
- Wirths O, Breyhan H, Cynis H, Schilling S, Demuth HU, Bayer TA. Intraneuronal pyroglutamate-Abeta 3–42 triggers neurodegeneration and lethal neurological deficits in a transgenic mouse model. Acta Neuropathol. 2009;118:487–496. doi: 10.1007/s00401-009-0557-5. [DOI] [PMC free article] [PubMed] [Google Scholar]
- Wirths O, Bethge T, Marcello A, Harmeier A, Jawhar S, Lucassen PJ, Multhaup G, Brody DL, Esparza T, Ingelsson M, Kalimo H, Lannfelt L, Bayer TA. Pyroglutamate Abeta pathology in APP/PS1KI mice, sporadic and familial Alzheimer's disease cases. J Neural Transm. 2010;117:85–96. doi: 10.1007/s00702-009-0314-x. [DOI] [PMC free article] [PubMed] [Google Scholar]
- Wyss-Coray T, Loike JD, Brionne TC, Lu E, Anankov R, Yan F, Silverstein SC, Husemann J. Adult mouse astrocytes degrade amyloid-beta in vitro and in situ. Nat Med. 2003;9:453–457. doi: 10.1038/nm838. [DOI] [PubMed] [Google Scholar]