

Abstract
Myelination, the elaboration of myelin surrounding neuronal axons, is essential for normal brain function. The development of the myelin sheath enables rapid synchronized communication across the neural systems responsible for higher order cognitive functioning. Despite this critical role, quantitative visualization of myelination in vivo is not possible with current neuroimaging techniques including diffusion tensor and structural magnetic resonance imaging (MRI). Although these techniques offer insight into structural maturation, they reflect several different facets of development, e.g., changes in axonal size, density, coherence, and membrane structure; lipid, protein, and macromolecule content; and water compartmentalization. Consequently, observed signal changes are ambiguous, hindering meaningful inferences between imaging findings and metrics of learning, behavior or cognition. Here we present the first quantitative study of myelination in healthy human infants, from 3 to 11 months of age. Using a new myelin-specific MRI technique, we report a spatiotemporal pattern beginning in the cerebellum, pons, and internal capsule; proceeding caudocranially from the splenium of the corpus callosum and optic radiations (at 3–4 months); to the occipital and parietal lobes (at 4–6 months); and then to the genu of the corpus callosum and frontal and temporal lobes (at 6–8 months). Our results also offer preliminary evidence of hemispheric myelination rate differences. This work represents a significant step forward in our ability to appreciate the fundamental process of myelination, and provides the first ever in vivo visualization of myelin maturation in healthy human infancy.
Introduction
The establishment of the lipid myelin bilayer around neuronal axons (myelination) is essential for normal brain function and is a cornerstone of human neurodevelopment. The myelin sheath enables the rapid and synchronized information transfer required for coordinated movement, decision-making, and other higher order cognitive, behavioral, and emotive functions. Detailed postmortem studies have revealed a pattern of myelination that proceeds from deep to superficial brain regions (Yakovlev and Leours, 1967; Kinney et al., 1988), in a manner believed to be consistent with evolving neural systems (Casey et al., 2000). Unfortunately, postmortem studies do not permit longitudinal investigations of healthy neurodevelopment, or provide insight into underlying structure–function associations. Consequently, the relationship(s) between myelination and behavioral maturation have only been assessed indirectly; and the associations with learning, social interaction, and other environmental cues remain to be established (Johnson and Munakata, 2005). Further, histological analysis is ill-suited to investigating the hypothesized role of abnormal myelination in neurodevelopmental disorders, including autism (Courchesne, 2004), as many of these conditions are not conclusively diagnosed until later in childhood.
As an adjunct to histology, magnetic resonance imaging (MRI) provides noninvasive visualization of brain maturation (Dietrich et al., 1987; Ballesteros et al., 1993; Paus et al., 2001; Huang et al., 2006; Leppert et al., 2009), through the gradual onset of “adult-like” gray and white matter contrast on T1 and T2 relaxation time-weighted images throughout the first postnatal year. This contrast evolution broadly parallels the biophysical tissue alterations associated with brain maturation, including the arrival of myelin precursory macromolecules and proteins; the appearance of lipids, cholesterol, and other constituents of the myelin sheath; and the compartmentalization of free water (Paus et al., 2001). Further, progressive increases in diffusion anisotropy (the degree to which water diffusion is oriented along a single dominant orientation), as measured by diffusion tensor (DT)-MRI, offers additional insight into white matter development, reflecting changes in axonal fiber size, density, tract coherence, as well as membrane structure and permeability (Zhang et al., 2005; Provenzale et al., 2007). Unfortunately, changes in these measures may not be specific to myelin content alteration (Fatouros et al., 1991; Beaulieu, 2002).
Visualization and quantification of myelination during neurodevelopment in human infants with MRI, therefore, remains unapproached, and remains a significant void in our appreciation of neurodevelopment.
Here we present a preliminary first in vivo report of myelination in healthy human infancy. Using a new, myelin-specific, MRI technique, we noninvasively measure myelin content throughout the brains of healthy infants between 3 and 11 months of age; reconstructing average myelination trajectories across different brain regions. Analysis of these data reveals a spatiotemporal sequence of myelination that closely mirrors prior postmortem reports. Further, comparison of these trajectories in bilateral brain regions provides preliminary evidence for hemispheric myelination rate differences in the temporal, occipital, and parietal white matter regions. The described data and imaging technique, therefore, provide a crucial first step toward relating structural maturation with functional, cognitive, and behavioral evolution.
Materials and Methods
Currently, the most direct means of quantifying myelin content in vivo using MRI is through multicomponent relaxation (MCR) analysis (Menon et al., 1991; Whittall et al., 1997; Beaulieu et al., 1998). Briefly, MCR analysis aims to decompose the measured MRI signal into contributions from distinct microanatomic water compartments. Due to differing biophysical and biochemical environments, water protons in each compartment exhibit unique T1 and T2 relaxation properties and provide distinct signal signatures. The measured MRI signal, therefore, is a volume-weighted summation of the individual compartment signals. Through multicomponent curve fitting and analysis, these individual signals can be separated, allowing each compartment's relaxation times and water volume fractions to be estimated.
Within brain parenchyma, MCR analysis has reliably revealed the presence of two water subdomains: a slow relaxing species attributed to the free intra- and extracellular water, and a faster relaxing species associated with water protons trapped between the lipid bilayers of the myelin sheath. These assignments are based on histological correlation studies (Webb et al., 2003; Stanisz et al., 2004), and investigations of the myelin water volume fraction (MWF) in de- and dysmyelination animal models, as well as in human demyelinating disorders such as multiple sclerosis (MS) (Beaulieu et al., 1998; Gareau et al., 2000; Laule et al., 2006). The MWF has been shown to correlate strongly with histological estimates of myelin content (Webb et al., 2003; Laule et al., 2006, 2008) and has been shown to be a more apt marker of myelin content compared with fractional anisotropy (Mädler et al. 2008) or magnetization transfer imaging estimates (Gareau et al., 2000), since it is insensitive to confounding processes, including complex tissue microarchitecture or crossing fibers, as well as inflammation or edema.
In the present work, we made use a new time-efficient MCR technique, termed multicomponent driven equilibrium single pulse observation of T1 and T2 (mcDESPOT) (Deoni et al., 2008), to measure the MWF throughout the brains of healthy human infants.
mcDESPOT involves the combined acquisition of T1-weighted spoiled gradient echo (SPGR) and T2/T1-weighted balanced steady-state free precession (SSFP) data. These data are then modeled as the summation of the exchanging myelin and intra/extra cellular water pools, yielding estimates of each pool's T1, T2, water volume fractions and water residence times (i.e., the average time a proton remains in each pool before exchanging to the other).
Data acquisition
All scanning was performed during natural sleep (i.e., without sedation) on a clinical 1.5T General Electric Signa Excite MR scanner, equipped with an 8-channel head radiofrequency (RF) coil array. Whole-brain, isotropically resolved, mcDESPOT data were acquired in 14 healthy infants (6 female; 107, 117, 130, 153, 157, 184, 184, 185, 203, 217, 232, 282, 301, and 329 d of age, corrected to a 40 week gestation). Throughout the imaging session, the infant's heart rate and blood oxygen saturation were constantly monitored. Only infants delivered after 36 weeks were recruited for the study. Other recruitment criteria included uncomplicated vaginal birth; no abnormalities on fetal ultrasound; no exposure to alcohol or illicit drugs during pregnancy; no familial history of learning, psychiatric, or depressive illness; and no preexisting neurological conditions (i.e., stroke at birth) or major head trauma.
Informed parental consent was obtained in accordance with ethics approval from the local Institutional Review Board.
A constant 17.3 × 17.3 × 13 cm3 sagittally oriented field of view with 96 × 96 × 72 imaging matrix was used, providing a voxel volume of 1.8 × 1.8 × 1.8 mm3. The SPGR and SSFP data were acquired with the following sequence-specific parameters: SPGR, echo time (TE)/repetition time (TR)/flip angles = 4.1 ms/11.2 ms/{3, 4, 5, 6, 7, 9, 11 and 14}°; receiver bandwidth = 93 Hz/voxel; and SSFP, TE/TR/flip angles = 5.6 ms/11.2 ms/{14, 20, 25, 30, 37, 46, 58 and 80}°; receiver bandwidth = 244 Hz/voxel. Two sets of SSFP data were acquired with phase-cycling increments 0° and 180° to allow for correction of main magnetic field (off-resonance) artifacts (Deoni, 2009a).
To minimize acquisition time, half k-space (with 16 overscan lines) and parallel acquisition (reduction factor of 2) were used. Scan time for each SPGR and SSFP image was 26 s, for a total imaging time of 10 min.
To minimize acoustic noise, the scanner bore was insulated with sound attenuating foam (Ultra Barrier, American Micro Industries). Minimuff ear pads (Natus Medical) and pediatric ear protectors (MR Confon) were placed on the infant. A Med-Vac Infant Immobilization bag (CFI Medical Solutions) provided neck support and restricted head movement. The gradient switching rate and maximum gradient amplitude were reduced to 35% (53 mT/m/s) and 75% (30 mT/m) of maximum, respectively. Sound levels at the center of the scanner bore were measured at 52 dB for SPGR and 68 dB for SSFP, well below established FDA guidelines of 99 dB.
Image analysis
Preprocessing and myelin map calculation.
Following acquisition, the 8 SPGR and 16 SSFP images comprising each infant's dataset were linearly coregistered to account for subtle intrasession head movement (Jenkinson et al., 2002). Nonbrain parenchyma signal was removed from each image using an automated deformable model approach (Smith, 2002) refined with manual editing. Voxelwise maps of T1, T2, and MWF were derived from the data using DESPOT (Deoni et al., 2005) and mcDESPOT (Deoni et al., 2008) processing.
Data coregistration and visualization.
To compare the cross-sectional data and reconstruct regional and voxelwise myelination trajectories, each infant's MWF map was first nonlinearly coregistered to a custom study template. To create this template, each infant's high flip angle T1-weighted SPGR image was nonlinearly registered to the 184 d-old infant. All registered images were then averaged and the result was smoothed with a 3 mm full-width-at-half-maximum Gaussian kernel. Registration was performed using an automated three-dimensional (3D) multiscale approach based on mutual information (Collins et al., 1994) and using each infant's high flip angle SPGR image. The estimated transformation matrix between each infant's T1-weighted data and the study template was subsequently applied to the associated T1, T2, and MWF maps. An adult reference dataset (Mazziotta et al., 2001) was also nonlinearly registered to the infant template to provide brain region tissue masks.
Three-dimensional segmentations of myelinated white matter were calculated by low-pass filtering each infant's MWF map to remove voxels with <3.5% MWF. This threshold was arbitrarily chosen as it provided the best visualization of white matter development across the age spectrum (i.e. a higher threshold provided no data within the younger infants). An iso-surface was fitted to the remaining voxels using a marching cubes algorithm, and the resulting image was displayed superimposed on the study template.
Reconstruction of myelin development trajectories.
Using the registered brain region masks, the genu, body, and splenium of the corpus callosum; right and left hemisphere internal capsule; and right and left hemisphere frontal, temporal, parietal, and occipital white matter regions were isolated in each infant's data. Mean and SD MWF values were obtained for each region and plotted with respect to age.
To the combined left and right hemisphere data, single-trajectory power curves of the form MWF(age) = A × AgeB were fitted using least-squares minimization. Interpolated curves-of-best-fit were then calculated spanning 100 through 330 d of age. Curves were also fitted to the left and right hemisphere data independently (termed the dual-trajectory model) to investigate potential hemispheric differences in developmental rate. An f test was performed to compare the single- and dual-trajectory models, and to identify areas with right/left maturation rate differences.
Voxelwise power curves were also fit to investigate regional differences in myelination rate. Color maps of the calculated exponential (rate) term were superimposed on the average template image for visualization.
Results
Representative coronal and axially reformatted images from the spatially normalized whole-brain T1 weighted, and quantitative T1, T2, and MWF maps of the 14 healthy infants are shown in Figures 1 and 2.
Figure 1.
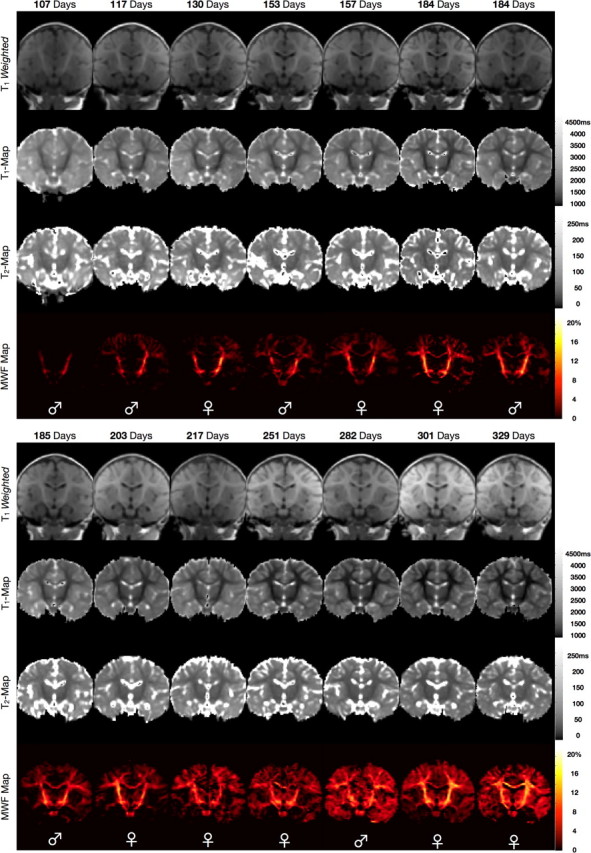
Representative coronal T1-weighted; quantitative T1, quantitative T2, and quantitative MWF images of each imaged infant. The increase in myelin content across the developmental period is readily appreciated in the MWF maps. Images are shown in radiological convention (viewing left = anatomical right). The sex of the infant is denoted across the bottom of each panel.
Figure 2.
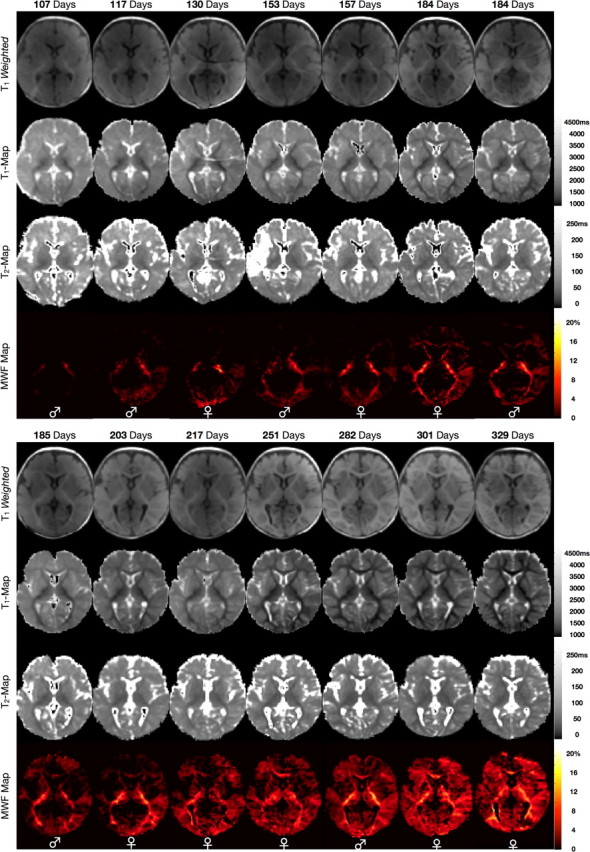
Representative axial T1-weighted, quantitative T1, quantitative T2, and quantitative MWF images of each imaged infant. The increase in myelin content across the developmental period is readily appreciated in the MWF maps. Images are shown in radiological convention (viewing left = anatomical right). The sex of the infant is denoted across the bottom of each panel.
As noted in prior studies (Dietrich et al., 1987; Ballesteros et al., 1993; Paus et al., 2001; Huang et al., 2006), the T1-weighted images reveal a progressive shift in the gray/white matter contrast across the age-range, with the images appearing adult-like by ∼9 months. However, this progression of contrast is obstructed by inconsistent signal intensity variations across the images. This spatial heterogeneity results from the differing placement of each infant within the multichannel RF coil array and produces variable gray and white matter appearance across the images unrelated to brain development. This highlights an important challenge in assessing brain maturation solely from conventional T1- or T2-weighted images, particularly from data acquired with modern multichannel RF coil arrays.
Quantitative calculation of T1 and T2 cleanly removes this RF hardware-related heterogeneity, revealing a continuous reduction of T1 and T2 with age within the gray and, more markedly, white matter. These reductions reflect not only the increased presence of myelin-associated lipids, cholesterol and compositional macromolecules, but are also driven by an overall reduction in free water content, increased water compartmentalization, and increasing paramagnetic iron content (Paus et al., 2001; Huang et al., 2006; Leppert et al., 2009; Saito et al., 2009). Thus, these progressive changes provide insight into several concomitant processes of brain maturation. Unfortunately, however, they are not specific indicators of myelin establishment.
Specific estimates of myelin content are provided by the MWF maps, which detail a myelination pattern that spreads from the primary white matter pathways (i.e., the internal capsule and optic radiations) to superficial white matter and gray matter regions. Our data show myelination beginning in the cerebellum, pons, and internal capsule. It then proceeds caudocranially to the splenium of the corpus callosum and optic radiations (with myelin appearing by 150 d); the occipital and parietal lobes (myelin appearing by 150–180 d); to the genu of the corpus callosum and frontal and temporal lobes after 250 d. This spatiotemporal pattern visually mirrors that established in previous histological studies (Yakovlev and Leours, 1967; Kinney et al., 1988), which have shown myelination of the occipital and parietal lobes beginning in the fourth to sixth month; the corpus callosum in the seventh month; and the frontal lobe being among the last regions to mature.
In comparison with T1 and T2, we note that significant reductions in peripheral gray matter T1, as well as frontal white matter T1, precede myelin content increases in these regions. Changes in T2, further, appear to be independent of myelin content alterations, particularly within the internal capsule and optic radiations. Finally, changes in the gray/white matter T1-weighted contrast appear to lag myelin content increases, for example within the internal capsule. This delay between MR image contrast changes compared with the histological timeframe of myelin establishment has been noted previously (Ballesteros et al., 1993) and depends on the imaging sequence used.
In Figure 3, the pattern of myelin maturation is presented through volume renderings of the myelinated white matter in each infant. To construct these images, each infant's MWF map was filtered to remove voxels with <3.5% MWF and a 3D surface was then fitted to the remaining voxels. The rendered surface is shown superimposed on the study specific template image and displayed from coronal and sagittal orientations. These data provide a ready graphical illustration of the spatiotemporal pattern of myelination.
Figure 3.

Three-dimensional segmentations of myelinated white matter across the age spectrum superimposed on the study template. Images are shown from a coronal (top) and sagittal (bottom) perspective with color corresponding to age. 3D segmentations show voxels with at least 3.5% MWF. The spatiotemporal progression from deep white matter (cerebellar, internal capsules) to superficial regions (optic radiations, corpus callosum and frontal white matter) corresponds with the histologically established sequence of myelination. Data are shown in radiological convention (viewing left = anatomical right).
Myelin maturation trajectories (MWF plotted against age) for the genu, body, and splenium of the corpus callosum; combined anterior and interior portions of the internal capsule; and frontal, temporal, parietal, and occipital lobe white matter are shown in Figures 4 and 5. Comparing these trajectories with the histological time-line (Fig. 4) reveals the expected spatiotemporal sequence, with myelination proceeding sequentially from the internal capsule to occipital, splenium, parietal, body of corpus callosum, temporal, frontal, and genu white matter.
Figure 4.

Comparison of myelin development trajectories for different white matter regions. Curves were reconstructed for left (blue) and right (red) hemisphere regions separately, and for the combined data (black). f test analysis revealed significantly different right/left hemispheric trajectories in the temporal, occipital, and parietal regions, suggesting asynchronous development in these regions. Across the top three panels we have identified the points corresponding to the female participants.
Figure 5.

Derived myelination trajectories (left) for the internal capsule (red curve) and occipital (yellow), parietal (pink), frontal (blue), and temporal (green) white matter. This sequence reproduces prior histologic findings (right), with onset of myelination in the internal capsule beginning before birth (beginning of the box), 50% of the region myelinated just after birth (beginning of the colored portion of box), and completely myelinated by 14 months (end of box). Similarly, occipital, parietal, and temporal regions begin myelinating at 6 months and achieve the 50% level by 11, 14, and 18 months, respectively. (Histologic results adapted from Dietrich et al., 1987).
Investigating the myelination trajectories for the right and left hemisphere independently (Fig. 5), we find preliminary evidence for asymmetric myelin development. For each region, an f test was used to compare the single (single power curve fitted to the combined right and left hemisphere data)- and dual-trajectory models (power curves fitted to the right and left hemisphere data independently) in an effort to identify regions with right/left differences in maturation rate. Brain regions showing significant right/left differences were the temporal, occipital, and parietal lobes. In each of these regions, the left hemisphere was the more rapidly developing. These results are compatible with prior demonstrations of functional lateralization in infants of the same age (Perani et al., 1996; Dehaene et al., 1997; Dehaene-Lambertz et al., 2002), and preliminary reports of structural asymmetries in white matter pathways within these regions (Dubois et al., 2009).
Fitting myelination trajectories on a voxelwise, rather than region-wise basis, allows us to further investigate the rate of myelination across the different brain regions. Axial, sagittal, and coronal images through the fit exponential rate term map, and superimposed on the reference template image, are shown in Figure 6. Cooler colors (purple and blue) denote slower maturation while warmer colors (yellow and red) indicate faster maturation. These data reveal a correspondence between slower myelinating regions and areas of early myelination (such as in cerebellum and internal capsule), and also highlight the hemispheric differences in myelination rate, particularly within the temporal and occipital lobes during this period of infancy.
Figure 6.

Axial, sagittal, and coronal images of the rate of myelination (exponential term of the power curve) throughout the brain. Cooler colored areas (purple, blue) are slower developing regions, while areas shown in warmer colors (yellow, red) are faster developing over the 3–11 month age range. Comparison with Figure 4 reveals that slower developing areas correspond to earlier myelinating regions. Data are shown in radiological convention (viewing left = anatomical right).
Discussion
The presented preliminary work builds substantively upon prior investigations of brain maturation and white matter development. Using the mcDESPOT technique, we have noninvasively mapped myelin content throughout the brain in healthy infants for the first time, providing the first quantitative visualization of brain myelination in vivo. Although MRI has been used to study infant brain development previously, prior studies have been unable to quantitatively measure myelin content and, consequently, the progress of myelination. For example, prior studies have relied on T1- or T2-weighted signal contrast to infer changes in brain structure, architecture or biochemistry (Dietrich et al., 1987; Barkovich and Kjos, 1988; Christophe et al., 1990; Ballesteros et al., 1993; Paus et al., 2001; Zhang et al., 2005; Huang et al., 2006; Saito et al., 2009). Unfortunately, differences in these signals reflect a broad range of microstructural and biochemical alterations, including lipid and cholesterol content, free water content, iron and oligodendrocyte content, macromolecule and protein content, and water mobility. Thus, it is not possible to translate observed T1 or T2 contrast changes into meaningful estimates of myelin content. This nonlinear relationship is demonstrated in Figures 1 and 2.
More advanced imaging techniques, such as DT-MRI and magnetization transfer imaging (MTI) are believed to provide information more closely aligned to myelin content. For example, diffusion fractional anisotropy (from DT-MRI) or the bound water fraction (from MTI). However, these techniques are sensitive to non-myelin-related structural and biochemical changes, rendering them nonspecific indicators of myelin (Gareau et al., 2000; Beaulieu, 2002; Mädler et al., 2008).
In addition to fractional anisotropy, alternative measures may be derived from the diffusion tensor, potentially providing more specific indicators of biostructure. The axial and radial diffusivities (AD and RD, respectively) are derived by considering the individual diffusivities, with AD corresponding to the principle diffusivity and RD equal to the mean diffusion perpendicular to the principle direction.
Song and colleagues (Song et al., 2002, 2003) have shown that RD is elevated in de- and dysmyelination, while AD remains unchanged, suggesting selective sensitivity to myelin. Investigation of changes in the axial and radial diffusivities in developing postnatal rat brain (Bockhorst et al., 2008) has demonstrated temporal correlation between RD and myelination in the internal capsule. However, within the corpus callosum, early stages of myelination were not well reflected by changes in RD.
Despite encouraging results in animal models, a straightforward interpretation of RD is challenged by several points. First, processes that alter fiber diameter or membrane permeability, and thus perpendicular diffusivity, will alter RD. Second, RD is derived from the diffusion tensor. Thus, its relevance is questionable in areas where this model fails, such as in complex tissue containing multiple fiber populations. This has been highlighted by numerical simulations and in vivo human imaging (Wheeler-Kingshott and Cercignani, 2009) showing artifactual changes in RD depending on tissue geometry.
Conventional MR imaging metrics, including T1, T2, anisotropy, and magnetization transfer, often suggest the presence of myelin before it has been found to be present histologically (Mukherjee et al., 2002; Provenzale et al., 2007; Leppert et al., 2009; Löbel et al., 2009); or show little difference in the myelination time course between regions (van Buchem et al., 2001; Ge et al., 2002; Provenzale et al., 2007). This limits the utility of these techniques in studying myelination, and is in contrast with our findings of a spatial-temporal myelination pattern that faithfully reproduces histological findings.
MCR is a well established technique that has been used to investigate myelin content changes in demyelinating disorders such as MS (MacKay et al., 2009). Studies have shown strong correlation between derived MWF and histological estimates of myelin content (Webb et al., 2003; Stanisz et al., 2004, Laule et al., 2006, 2008), with insensitivity to inflammation and edema (Gareau et al., 2000). However, these correlation studies refer to the conventional multiple spin-echo MCR approach (Whittall et al., 1997). Although results obtained using mcDESPOT agree strongly with spin-echo data in brain and spinal cord (Deoni et al., 2008; Kolind and Deoni, 2010), showing expected reductions in MWF in MS (Deoni et al., 2008; Deoni, 2009b) and showing reductions correlated with disease severity (Kitzler et al., 2010), only a single histological study has been performed (Hurley et al., 2010). However, results presented herein offer support for the validity of the technique. The temporal similarity of the imaging results and prior postmortem trends, as well as the absence of MWF in areas known to be devoid of myelin in the youngest infants, suggest a strong specificity of mcDESPOT to myelin. However, further investigations using animal demyelination models will strengthen our conclusions.
Of the various maturational processes that occur during neurodevelopment, the formation of the myelin sheath is of particular relevance to studies investigating structural associations with cognitive and behavioral evolution. Myelinating regions are believed to temporally and spatially correspond with the developing neuronal systems underlying neurological and behavioral functions (Yakovlev and Leours, 1967; Casey et al., 2000; Johnson and Munakata, 2005). To this end, our work represents a crucial step toward enabling future studies which, for example, examine the development of these discrete neuronal systems; and, further, how abnormalities in myelination may result in observed clinical symptoms or deficits. Abnormalities in brain myelination likely also result in aberrant brain “connectivity,” which is increasingly hypothesized to underlie numerous neurological and psychiatric disorders, including autism and schizophrenia (Hughes, 2007; Bassett and Bullmore, 2009). Despite the cross-sectional nature of our study, and the relatively small sample size, the study serves to illustrate the potential for comparing myelination trajectories in typically developing and at-risk individuals. This represents an important new avenue for investigating the early neurobiological events that may be central to these devastating disorders.
Longitudinal studies of normal and at-risk brain development have the potential not only to identify initiating insults that ultimately results in the behavioral, functional or emotional traits associated with neurological disorders, but also provide new insight into healthy brain development. For example, the model describing myelin maturation across infancy and early childhood is not known, nor is the regional variation or specificity in this model. While power curves provided the best fit (minimal residuals) to the infant data shown herein, they are unlikely to be appropriate over more inclusive age ranges. It is anticipated that following an initial period of rapid growth, the rate will slow and become more consistent with a logarithmic trajectory. Mapping of this trajectory throughout the brain in healthy development is essential before meaningful comparisons in at-risk or atypically developing individuals can be made.
Despite this concern in the appropriate developmental mode, investigation of the modeled power curves have allowed us to identify significant differences in the myelination rate across different brain regions and between the left and right hemispheres. For example, significant hemispheric differences were observed in temporal, occipital and parietal lobe white matter (Fig. 5). Comparing the temporal onset and rate of myelination shows that areas with early myelin deposition have slower rates of subsequent myelination than areas with later deposition. The reason for this is unknown. One possible explanation may be that while the initial formation of the myelin sheath is rapid, the rate of maturation slows depending on external forces, including environmental feedback, learning, etc. Alternatively, as the rapidly developing areas appear to be mostly in association neocortex, rapid myelin development in these areas may provide the biological basis for improved function of these regions, and/or their responsiveness to external stimuli. Further investigation, incorporating data from infants at later stages of development, in association with metrics of cognitive performance and behavior, are required to determine the precise relationships between regional variation in brain myelination and cognitive development.
Regardless of the underlying mechanism for these maturational differences, hemispheric asymmetry was observed; with the left hemisphere displaying earlier myelination than the right, but with opposing differences in the cerebellum (i.e., the right cerebellum and left cerebral white matter exhibit slower myelination relative to the left cerebellum/right cerebrum). How this structural and developmental asymmetry corresponds with functional lateralization remains a topic for future investigations. However, it is tempting to speculate that the observed temporal lobe asymmetry is associated with the increased auditory brain activity in this region reported by functional MRI and electroencephalography (EEG) studies (Dehaene et al., 1997). It should be stressed, however, that this is observation stems from a single set of cross-section data. Data from additional infants is required before any conclusive statements regarding hemispheric differences may be made.
Quantitative myelin imaging with mcDESPOT represents a substantive new avenue for investigating brain maturation and will enable more sensitive and specific examinations of white matter maturation than are presently possible. The noninvasive nature of the technique readily facilitates future longitudinal studies of individual developmental differences and will enable predictive studies (e.g., how early myelin content and cognitive performance predicts later development), as well as behavioral, functional and epigenetic association studies.
Footnotes
The Wellcome Trust and the Engineering and Physical Sciences Research Council for their ongoing support of the Centre for Neuroimaging Sciences. Funding was provided by the Medical Research Council (MRC, UK) and the MRC, UK Autism Imaging Study (AIMS) network (G0400061/69344; D.G.M.M., principal investigator), the National Institute for Health Research Biomedical Research Centre for Mental Health at King's College London, Institute of Psychiatry and South London and Maudsley National Health Service Foundation Trust. We also acknowledge the generous backing of Autism Speaks and Autistica. S.C.L.D. receives salary support from a Medical Research Council Career Development Award (G0800298).
References
- Ballesteros MC, Hansen PE, Soila K. MR imaging of the developing human brain. Part 2. Postnatal development. Radiographics. 1993;13:611–622. doi: 10.1148/radiographics.13.3.8316668. [DOI] [PubMed] [Google Scholar]
- Barkovich AJ, Kjos BO. Normal postnatal development of the corpus callosum as demonstrated by MR imaging. AJNR Am J Neuroradiol. 1988;9:487–491. [PMC free article] [PubMed] [Google Scholar]
- Bassett DS, Bullmore ET. Human brain networks in health and disease. Curr Opin Neurol. 2009;22:340–347. doi: 10.1097/WCO.0b013e32832d93dd. [DOI] [PMC free article] [PubMed] [Google Scholar]
- Beaulieu C. The basis of anisotropic water diffusion in the nervous system: a technical review. NMR Biomed. 2002;15:435–455. doi: 10.1002/nbm.782. [DOI] [PubMed] [Google Scholar]
- Beaulieu C, Fenrich FR, Allen PS. Multicomponent water proton transverse relaxation and T2-discriminated water diffusion in myelinated and nonmyelinated nerve. Magn Reson Imaging. 1998;16:1201–1210. doi: 10.1016/s0730-725x(98)00151-9. [DOI] [PubMed] [Google Scholar]
- Bockhorst KH, Narayana PA, Liu R, Ahobila-Vijjula P, Ramu J, Kamel M, Wosik J, Bockhorst T, Hahn K, Hasan KM, Perez-Polo JR. Early postnatal development of rat brain: in vivo diffusion tensor imaging. J Neurosci Res. 2008;86:1520–1528. doi: 10.1002/jnr.21607. [DOI] [PubMed] [Google Scholar]
- Casey BJ, Giedd JN, Thomas KM. Structural and functional brain development and its relation to cognitive development. Biol Psychol. 2000;54:241–257. doi: 10.1016/s0301-0511(00)00058-2. [DOI] [PubMed] [Google Scholar]
- Christophe C, Muller MF, Balériaux D, Kahn A, Pardou A, Perlmutter N, Szliwowski H, Segebarth C. Mapping of normal brain maturation in infants on phase-sensitive inversion recovery images. Neuroradiology. 1990;32:173–178. doi: 10.1007/BF00589106. [DOI] [PubMed] [Google Scholar]
- Collins DL, Neelin P, Peters TM, Evans AC. Automatic 3D intersubject registration of MR volumetric data in standardized Talairach space. J Comput Assist Tomogr. 1994;18:192–205. [PubMed] [Google Scholar]
- Courchesne E. Brain development in autism: early overgrowth followed by premature arrest of growth. Ment Retard Dev Disabil Res Rev. 2004;10:106–111. doi: 10.1002/mrdd.20020. [DOI] [PubMed] [Google Scholar]
- Dehaene S, Dupoux E, Mehler J, Cohen L, Paulesu E, Perani D, van de Moortele PF, Lehéricy S, Le Bihan D. Anatomical variability in the cortical representation of first and second language. Neuroreport. 1997;8:3809–3815. doi: 10.1097/00001756-199712010-00030. [DOI] [PubMed] [Google Scholar]
- Dehaene-Lambertz G, Dehaene S, Hertz-Pannier L. Functional neuroimaging of speech perception in infants. Science. 2002;298:2013–2015. doi: 10.1126/science.1077066. [DOI] [PubMed] [Google Scholar]
- Deoni SC. Correction of main magnetic field inhomogeneities in mcDESPOT data. Proceedings of the 17th Meeting of the International Society for Magnetic Resonance in Medicine; April 18–24, 2009; Hawaii. 2009a. p. 4609. [Google Scholar]
- Deoni SC. Whole-brain voxel-wise analysis of myelin water volume fraction in multiple sclerosis. Proceedings of the 17th Meeting of the International Society for Magnetic Resonance in Medicine; April 18–24, 2009; Hawaii. 2009b. p. 210. [Google Scholar]
- Deoni SC, Peters TM, Rutt BK. High Resolution T1 and T2 mapping of the brain in a clinically acceptable time with DESPOT1 and DESPOT2. Magn Reson Med. 2005;53:237–241. doi: 10.1002/mrm.20314. [DOI] [PubMed] [Google Scholar]
- Deoni SC, Rutt BK, Arun T, Pierpaoli C, Jones DK. Gleaning multicomponent T1 and T2 information from steady-state imaging data. Magn Reson Med. 2008;60:1372–1387. doi: 10.1002/mrm.21704. [DOI] [PubMed] [Google Scholar]
- Dietrich RB, Bradley WG, Zaragoza EJ, 4th, Otto RJ, Taira RK, Wilson GH, Kangarloo H. MR evaluation of early myelination patterns in normally and developmentally delayed infants. AJR Am J Roentgenol. 1987;150:889–896. doi: 10.2214/ajr.150.4.889. [DOI] [PubMed] [Google Scholar]
- Dubois J, Hertz-Pannier L, Cachia A, Mangin JF, Le Bihan D, Dehaene-Lambertz G. Structural asymmetries in the infant language and sensori-motor networks. Cereb Cortex. 2009;19:414–424. doi: 10.1093/cercor/bhn097. [DOI] [PubMed] [Google Scholar]
- Fatouros PP, Marmarou A, Kraft KA, Inao S, Schwarz FP. In vivo brain water determination by T1 measurements: effect of total water content, hydration fraction and field strength. Magn Reson Med. 1991;17:402–413. doi: 10.1002/mrm.1910170212. [DOI] [PubMed] [Google Scholar]
- Gareau PJ, Rutt BK, Karlik SJ, Mitchell JR. Magnetization transfer and multicomponent T2 relaxation measurements with histopathologic correlation in an experimental model of MS. J Magn Reson Imaging. 2000;11:586–595. doi: 10.1002/1522-2586(200006)11:6<586::aid-jmri3>3.0.co;2-v. [DOI] [PubMed] [Google Scholar]
- Ge Y, Grossman RI, Babb JS, Rabin ML, Mannon LJ, Kolson DL. Age-related total gray matter and white matter changes in normal adult brain. Part II. Quantitative magnetization transfer ratio histogram analysis. AJNR Am J Neuroradiol. 2002;23:1334–1341. [PMC free article] [PubMed] [Google Scholar]
- Huang H, Zhang J, Wakana S, Zhang W, Ren T, Richards LJ, Yarowsky P, Donohue P, Graham E, van Zijl PC, Mori S. White and gray matter development in human fetal, newborn and pediatric brains. Neuroimage. 2006;33:27–38. doi: 10.1016/j.neuroimage.2006.06.009. [DOI] [PubMed] [Google Scholar]
- Hughes JR. Autism: the first firm finding = underconnectivity? Epilepsy Behav. 2007;11:20–24. doi: 10.1016/j.yebeh.2007.03.010. [DOI] [PubMed] [Google Scholar]
- Hurley SA, Mossahebi P, Samsonov AA, Alexander AL, Deoni SC, Fisher R, Duncan ID, Field AS. Multicomponent relaxometry (mcDESPOT) in the shaking pup model of dysmyelination. Proceedings of the 18th Meeting of the International Society for Magnetic Resonance in Medicine; May 1–7, 2010; Stockholm. 2010. p. 4516. [Google Scholar]
- Jenkinson M, Bannister P, Brady M, Smith S. Improved optimization for the robust and accurate linear registration and motion correction of brain images. Neuroimage. 2002;17:825–841. doi: 10.1016/s1053-8119(02)91132-8. [DOI] [PubMed] [Google Scholar]
- Johnson MH, Munakata Y. Processes of change in brain and cognitive development. Trends Cogn Sci. 2005;9:152–158. doi: 10.1016/j.tics.2005.01.009. [DOI] [PubMed] [Google Scholar]
- Kinney HC, Brody BA, Kloman AS, Gilles FH. Sequence of central nervous system myelination in human infancy. II. Patterns of myelination in autopsied infants. J Neuropathol Exp Neurol. 1988;47:217–234. doi: 10.1097/00005072-198805000-00003. [DOI] [PubMed] [Google Scholar]
- Kitzler HH, Su J, Zeinch M, Deoni SC, Harper-Little C, Leung A, Kremenchutzky M, Rutt BK. mcDESPOT derived demyelination volume in multiple sclerosis patients correlates with clinical disability and senses early myelin loss. Proceedings of the 18th Meeting of the ISMRM; Stockholm SWE. 2010. p. 476. [Google Scholar]
- Kolind SH, Deoni CL. Rapid three dimensional multicomponent relaxation imaging of the spinal cord. Magn Reson Med. 2010 doi: 10.1002/mrm.22634. [DOI] [PubMed] [Google Scholar]
- Laule C, Leung E, Lis DK, Traboulsee AL, Paty DW, MacKay AL, Moore GR. Myelin water imaging in multiple sclerosis: quantitative correlations with histopathology. Mult Scler. 2006;12:747–753. doi: 10.1177/1352458506070928. [DOI] [PubMed] [Google Scholar]
- Laule C, Kozlowski P, Leung E, Li DK, Mackay AL, Moore GR. Myelin water imaging of multiple sclerosis at 7T: correlations with histopathology. Neuroimage. 2008;40:1575–1580. doi: 10.1016/j.neuroimage.2007.12.008. [DOI] [PubMed] [Google Scholar]
- Leppert IR, Almli CR, McKinstry RC, Mulkern RV, Pierpaoli C, Rivkin MJ, Pike GB Brain Development Cooperative Group. T2 relaxometry of normal pediatric brain development. J Magn Reson Imaging. 2009;29:258–267. doi: 10.1002/jmri.21646. [DOI] [PMC free article] [PubMed] [Google Scholar]
- Löbel U, Sedlacik J, Güllmar D, Kaiser WA, Reichenbach JR, Mentzel HJ. Diffusion tensor imaging: the normal evolution of ADC, RA, FA, and eigenvalues studied in multiple anatomical regions of the brain. Neuroradiology. 2009;51:253–263. doi: 10.1007/s00234-008-0488-1. [DOI] [PubMed] [Google Scholar]
- MacKay AL, Vavasour IM, Rauscher A, Kolind SH, Mädler B, Moore GR, Traboulsee AL, Li DK, Laule C. MR relaxation in multiple sclerosis. Neuroimaging Clin N Am. 2009;19:1–26. doi: 10.1016/j.nic.2008.09.007. [DOI] [PubMed] [Google Scholar]
- Mädler B, Drabycz SA, Kolind SH, Whittall KP, MacKay AL. Is diffusion anisotropy an accurate monitor of myelination? Correlation of multicomponent T2 relaxation and diffusion tensor anisotropy in human brain. Magn Reson Imaging. 2008;26:874–888. doi: 10.1016/j.mri.2008.01.047. [DOI] [PubMed] [Google Scholar]
- Mazziotta J, Toga A, Evans A, Fox P, Lancaster J, Zilles K, Woods R, Paus T, Simpson G, Pike B, Holmes C, Collins L, Thompson P, MacDonald D, Iacoboni M, Schormann T, Amunts K, Palomero-Gallagher N, Geyer S, Parsons L, et al. A four-dimensional probabilistic atlas of the human brain. J Am Med Inform Assoc. 2001;8:401–430. doi: 10.1136/jamia.2001.0080401. [DOI] [PMC free article] [PubMed] [Google Scholar]
- Menon RS, Rusinko MS, Allen PS. Multiexponential proton relaxation in model cellular systems. Magn Reson Med. 1991;20:196–213. doi: 10.1002/mrm.1910200204. [DOI] [PubMed] [Google Scholar]
- Mukherjee P, Miller JH, Shimony JS, Philip JV, Nehra D, Snyder AZ, Conturo TE, Neil JJ, McKinstry RC. Diffusion-tensor MR imaging of gray and white matter development during normal human brain maturation. AJNR. 2002;23:1445–1456. [PMC free article] [PubMed] [Google Scholar]
- Paus T, Collins DL, Evans AC, Leonard G, Pike B, Zijdenbos A. Maturation of white matter in the human brain: a review of magnetic resonance studies. Brain Res Bull. 2001;54:255–266. doi: 10.1016/s0361-9230(00)00434-2. [DOI] [PubMed] [Google Scholar]
- Perani D, Dehaene S, Grassi F, Cohen L, Cappa SF, Dupoux E, Fazio F, Mehler J. Brain processing of native and foreign languages. Neuroreport. 1996;4:2439–2444. doi: 10.1097/00001756-199611040-00007. [DOI] [PubMed] [Google Scholar]
- Provenzale JM, Liang L, DeLong D, White LE. Diffusion tensor imaging assessment of brain white matter maturation during the first postnatal year. AJR Am J Roentgenol. 2007;189:476–486. doi: 10.2214/AJR.07.2132. [DOI] [PubMed] [Google Scholar]
- Saito N, Sakai O, Ozonoff A, Jara H. Relaxo-volumetric multispectral quantitative magnetic resonance imaging of the brain over the human lifespan: global and regional aging patterns. Magn Reson Imaging. 2009;27:895–906. doi: 10.1016/j.mri.2009.05.006. [DOI] [PubMed] [Google Scholar]
- Smith SM. Fast robust automated brain extraction. Hum Brain Mapp. 2002;17:143–155. doi: 10.1002/hbm.10062. [DOI] [PMC free article] [PubMed] [Google Scholar]
- Song SK, Sun SW, Ramsbottom MJ, Chang C, Russell J, Cross AH. Dysmyelination revealed through MRI as increased radial (but unchanged axial) diffusion of water. Neuroimage. 2002;17:1429–1436. doi: 10.1006/nimg.2002.1267. [DOI] [PubMed] [Google Scholar]
- Song SK, Sun SW, Ju WK, Lin SJ, Cross AH, Neufeld AH. Diffusion tensor imaging detects and differentiates axon and myelin degeneration in mouse optic nerve after retinal ischemia. Neuroimage. 2003;20:1714–1722. doi: 10.1016/j.neuroimage.2003.07.005. [DOI] [PubMed] [Google Scholar]
- Stanisz GJ, Webb S, Munro CA, Pun T, Midha R. MR properties of excised neural tissue following experimentally induced inflammation. Magn Reson Med. 2004;51:473–479. doi: 10.1002/mrm.20008. [DOI] [PubMed] [Google Scholar]
- van Buchem MA, Steens SC, Vrooman HA, Zwinderman AH, McGowan JC, Rassek M, Engelbrecht V. Global estimation of myelination in the developing brain on the basis of magnetization transfer imaging: a preliminary study. AJNR Am J Neuroradiol. 2001;22:762–766. [PMC free article] [PubMed] [Google Scholar]
- Webb S, Munro CA, Midha R, Stanisz GJ. Is multicomponent T2 a good measure of myelin content in peripheral nerve? Magn Reson Med. 2003;49:638–645. doi: 10.1002/mrm.10411. [DOI] [PubMed] [Google Scholar]
- Wheeler-Kingshott CA, Cercignani M. About “axial” and “radial” diffusivities. Magn Reson Med. 2009;61:1255–1260. doi: 10.1002/mrm.21965. [DOI] [PubMed] [Google Scholar]
- Whittall KP, MacKay AL, Graeb DA, Nugent RA, Li DK, Paty DW. In vivo measurement of T2 distributions and water contents in normal human brain. Magn Reson Med. 1997;37:34–43. doi: 10.1002/mrm.1910370107. [DOI] [PubMed] [Google Scholar]
- Yakovlev PI, Leours AR. The myelogenetic cycles of regional maturation of the brain. In: Minkowski A, editor. Regional development of the brain in early life. Oxford: Blackwell; 1967. pp. 3–70. [Google Scholar]
- Zhang L, Thomas KM, Davidson MC, Casey BJ, Heier LA, Uluğ AM. MR quantification of volume and diffusion changes in the developing brain. AJNR Am J Neuroradiol. 2005;26:45–49. [PMC free article] [PubMed] [Google Scholar]