

Abstract
Sensory neurons are mostly studied in fixed animals, but their response properties might change when the animal is free to move. Indeed, recent studies found differences between responses of sensory neurons in resting versus moving insects. Since the dynamic range of visual motion stimuli strongly depends on the speed at which an animal is moving, we investigated whether the visual system adapts to such changes in stimulus dynamics as induced by self-motion. Lobula plate tangential cells of flies lend themselves well to study this question because they are known to code for ego-motion based on optic-flow. We recorded the responses of the lobula plate tangential cell H1 to a visual pattern moving at different velocities under three different conditions: fixed flies before and after application of the octopamine agonist chlordimeform (CDM) and tethered flying flies. CDM has been previously shown to induce arousal in flies. We found that flying as well as the application of CDM significantly broadens the velocity tuning of H1 toward higher velocities.
Introduction
In the past decades, much of the work on neuronal processing of sensory stimuli was restricted to immobilized and/or anesthetized animal preparations. In the functional interpretation of the findings obtained in this way, it was tacitly assumed that the response properties of sensory neurons are the same whether the animal is immobilized and passively perceivings a stimulus or is freely moving around. Given how different the tasks of passively receiving a stimulus and active sensation are, it is not surprising that this assumption has been challenged more recently. Several pioneering studies, in vertebrates as well as insects, demonstrated that the behavioral state of an animal has a strong influence on sensory processing (Treue and Maunsell, 1996; Rind et al., 2008; Chiappe et al., 2010; Haag et al., 2010; Maimon et al., 2010; Niell and Stryker, 2010).
In flies, the dynamic range of stimulus velocities experienced by the animal should change considerably depending on whether the fly is at rest, walking, or flying. How does the visual system adjust to these changes? To address this question, we investigated how the response properties of lobula plate tangential cells are altered during flight. The lobula plate is a well characterized brain center dedicated to the processing of optic flow. Their response properties to visual stimuli of many motion-sensitive tangential cells of the lobula plate and their postsynaptic descending neurons have been described (Krapp and Hengstenberg, 1996; Krapp et al., 1998; Haag et al., 1999, 2007; Farrow et al., 2006; Joesch et al., 2008; Wertz et al., 2008, 2009; Borst et al., 2010; Schnell et al., 2010). From various lines of evidence, it has been concluded that the tangential cells are involved in the visual course control of the fly (Heisenberg et al., 1978; Geiger and Nässel, 1981, 1982; Hausen and Wehrhahn, 1983, 1990).
However, only few studies addressed the question of how the behavioral state changes the response properties of lobula plate tangential cells (LPTC). In these studies, it was shown that the response gain of lobula plate tangential cells in Drosophila is enhanced during locomotion (Chiappe et al., 2010; Maimon et al., 2010). In addition, Chiappe et al. (2010) demonstrated that during walking, the peak of the velocity tuning of the cells of the horizontal system is shifted toward higher velocities compared with resting flies. For the reasons outlined above, velocity tuning might even be altered more strongly when flying instead of walking. Using extracellular recording, we investigated how the velocity tuning of H1, a well studied LPTC, changes during tethered flight.
We found that flight strongly broadens the tuning of H1 toward higher velocities. We furthermore found that this effect can be mimicked in resting flies by the application of the octopamine agonist chlordimeform (CDM). Finally, using the well known Reichardt detector to account for fly motion detection, we show that the observed shift of the tuning curves can be explained by altered time constants in the filter stages of this model.
Materials and Methods
Preparation and set-up.
Blowflies (Lucilia spp.) were purchased weekly from a local pet shop. Only female blowflies were used for experiments. Before each preparation, animals were briefly anesthetized with CO2. A small piece of cardboard was waxed perpendicular onto the thorax of the fly, allowing the wings to move freely. The head was fixed with wax to the thorax at an angle of ∼20°. In addition, the occelli were covered with wax. Flies were put back into the cage to recover for at least 12 h. Before recording, the head capsule was opened from behind. In contrast to experiments on fixed flies described in the literature, the proboscis was not waxed to the thorax. The fly was then mounted in a slightly forward bending position on a heavy recording table with the stimulus monitor in front of the animal (Fig. 1). The fly brain was viewed from behind through a Zeiss dissection scope. Since the small angle between head and thorax was blocking the access to the lobula plate with straight electrodes, we bent the tip of the tungsten electrodes beforehand. To maintain flying, a constant air flow (2.5 m/s) had to be delivered to the fly through a plastic tube. Under these conditions, flies flew steadily for ∼20 min. To measure the wingbeat frequency, we filmed the fly with a high-speed camera (MotionPro Y3; Redlake) with a macro objective (105 mm F2.8 EX DG; Sigma) at a frame rate of 1000 Hz. The acquired movies were tracked manually (Manual Tracking plugIn; ImageJ). The wingbeat frequency during flight was 153 ± 5 Hz (n = 5). To test whether the fly shows a normal optomotor following response during flight, we filmed the fly at a frame rate of 90 Hz while we displayed a visual motion stimulus. After 1 s stationary pattern, a moving pattern (temporal frequency, 2 Hz) was displayed that changed direction every 5 s. From the acquired movies, the wingbeat amplitudes of the left and right wing were determined. Figure 2 shows the result from a single fly. The amplitudes of the left and right wings are modulated in counterphase depending on the direction of pattern motion. The difference in wing amplitude between left and right wings reflects the turning tendency of the fly (Fig. 2b), which is syndirectional with the pattern motion. This result demonstrates that the tethered flying flies show a normal optomotor response. Wingbeat amplitudes shown in Figure 2 and wingbeat frequencies reported here were collected in a dissected preparation, simultaneous with H1 recordings.
Figure 1.

Picture of the blowfly during an experiment. The activity of H1 was recorded from the right brain hemisphere. The reference electrode was placed in the hemolymphe close to the left brain hemisphere.
Figure 2.

Wingbeat amplitude during tethered flight. The direction of pattern movement alternated every 5 s from left to right and from right to left. a, Wingbeat amplitude (amp.) of the left (black line) and the right (gray line) wing. Pattern motion to the left is indicated by the gray boxes. b, Difference in wingbeat amplitude of left and right wings (wingbeat amplitude of left wing − wingbeat amplitude of right wing). The fly was trying to compensate for the visual stimulus. temp. freq., Temporal frequency.
Visual stimulation.
Visual stimuli were presented using a cylinder-shaped LED arena (Joesch et al., 2008; Reiser and Dickinson, 2008). The arena covered 170° and 60° of the horizontal and vertical visual fields, respectively. The angle between adjacent LEDs was 1.7°. The patterns were displayed with a refresh rate of 200 Hz and 32 intensity values. The stimulus itself consisted of a vertical one-dimensional sinus grating of 40° spatial wavelength and 17.4% contrast. The mean luminosity of the screen was 5.3 cd/m2.
Experimental protocol.
After the fly was inserted into the set-up, a drop of saline was applied to the hemolyph. The fly was given at least 5 min to adapt to the ambient light conditions. To measure the velocity tuning, the pattern moved at velocity ranging from 12 to 800 deg/s, corresponding to temporal frequencies of 0.3 to 20 Hz. For each stimulus trial, 10 different velocities were presented in pseudorandom fashion. Each velocity was presented for 3 s. Between each stimulus presentation, the stationary pattern was presented for 3 s. This stimulus protocol was repeated 10 times. The velocity tuning was first measured during tethered flight and afterward in the nonflight condition. The response of H1 to a brief motion impulse (test stimulus) was measured before and after the presentation of constant motion stimuli (adapting stimulus). The adapting stimulus lasted 3 s and had a temporal frequency of 5 Hz. The motion impulse was realized by a sudden displacement of the grating. The contrast of the pattern for both adapting and test stimulus was 17.4%.
Octopamine agonist.
CDM-HCl (Sigma-Aldrich), a tissue-permeable octopamine agonist (Hiripi et al., 1999), has been used in many insect preparations to test the functional role of octopamine in locomotion (Rosenberg et al., 2007; Vierk et al., 2009). CDM was dissolved in water and stored as a 1 m stock solution at 4°C. Before each experiment, the CDM solution was diluted in Ringer's solution (Case, 1957) to give a final concentration of 20 μm. CDM solution (2 μl) was applied to the lobula plate contralateral to the recording site. Note that the experiments with CDM application were performed in the same setup as the experiments with tethered flight.
Recording.
All the experiments were done on the lobula plate tangential cell H1. H1 represents one of the most studied cells in insect physiology (Maddess and Laughlin, 1985; de Ruyter van Steveninck et al., 1997; Haag and Borst, 1997; Brenner et al., 2000). It spans its arborizations over the lobula plate of both brain hemispheres, one being the dendrite and the other the axon terminals. The axon crosses along the dorsal surface of the central protocerebrum to the opposite side where it enters the contralateral lobula plate. H1 responds with an increase in firing rate when the pattern moves horizontally from back to front (preferred direction) and with an decrease in firing rate when the pattern is moved in the opposite direction (null direction) (Eckert, 1980). H1 was recorded extracellularly from the axonal arborization in the right brain hemisphere. The visual stimulus was presented to the left eye of the fly. For recording, we used tungsten electrodes with a resistance of 0.5–1 MOhm. Extracellular signals were amplified, bandpass filtered, and transferred at 30 kHz temporal resolution to a computer to allow for off-line spike detection.
Data analysis.
To estimate the spontaneous activity, the firing rate was recorded for 1 min while presenting the stationary visual pattern described above. In the experiments where the effect of CDM was studied, we measured the spontaneous firing rate before and after recording the velocity tuning and averaged the results. We defined the steady-state response as the difference between the firing rate during the last second of stimulus movement and the firing rate during the last second before stimulus onset. To analyze the responses to velocity steps (see Figs. 4a,b, 5a,b), we first subtracted the resting firing rate before averaging over the responses from different flies. To calculate the normalized velocity tuning curve (see Figs. 6c, 7b), the responses of each fly in all test velocities were normalized by the maximum response during nonflight for each fly individually. After normalization, all curves were averaged across flies. We defined the gain as the ratio of the velocity tuning curve of the flying and the nonflying fly. The same procedure was repeated for the CDM application experiments. Here, the condition before CDM application was used as reference. Data significance was always tested with paired t test.
Figure 4.

State-dependent velocity tuning of H1 neuron in the fly Lucilia. a, Peristimulus time histogram of the mean response of H1 to a 1 Hz stimulation lasting for 3 s during nonflying (black line) and flying (gray line) condition (n = 8, 10 trails for each fly; bin width = 10 ms). b, Same as a but for a 20 Hz stimulus. c, Temporal frequency (temp. freq.) tuning curve of the mean response of H1 in resting and flying flies (n = 8, 10 trails for each fly). Plotted is the mean response ± SEM. d, Mean response gain as a function of temporal frequency. The gain is defined as the ratio of the mean response during flight and during rest.
Figure 5.

Effect of CDM on the velocity tuning of H1. a, Peristimulus time histogram of the mean response of H1 to a 1 Hz stimulation lasting for 3 s before (black line) and after (gray line) application of CDM (n = 10, 10 trails for each fly; bin width = 10 ms). b, Same as a but for a 10 Hz stimulus. c, Temporal frequency (temp. freq.) curve of the mean response of H1 before and after application of the octopamine agonist CDM (n = 10, 10 trails for each fly). Plotted is the mean response ± SEM. d, Mean response gain as a function of temporal frequency. The gain is defined as the ratio of the mean response after and before the application of CDM.
Figure 6.
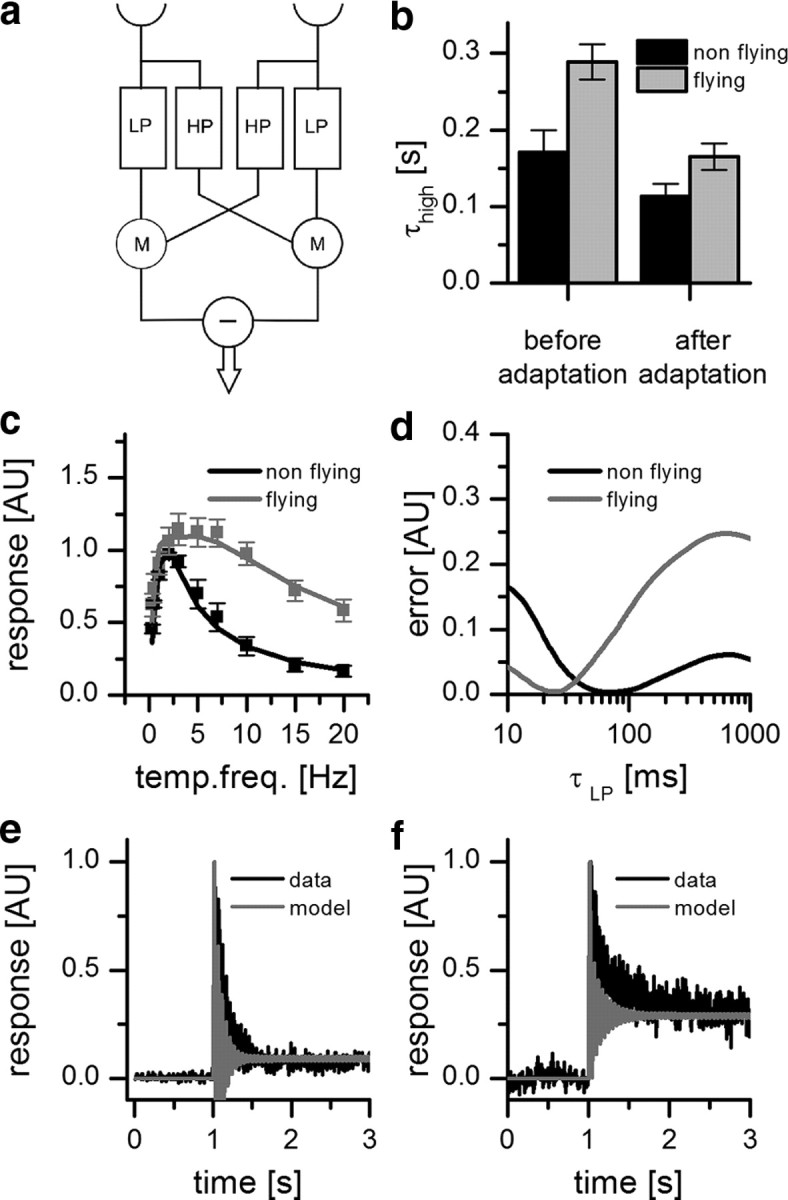
Flight changes the properties of the Reichardt detector. a, Structure of the Reichardt detector model considered here with high-pass (HP), low-pass (LP), and multiplication (M) stages. The high-pass time constant was estimated from measurements of the H1 response to a velocity impulse. The low-pass time constant was fitted. b, High-pass time constant before and after adaptation (nonflight: before adaptation = 0.171 s, after adaptation = 0.113 s; flight: before adaptation = 0.289 s, after adaptation = 0.165 s). Error bars indicate mean ± SEM of n = 5 flies. Adaptation led to a decrease of the high-pass time constant. c, Temporal frequency (temp. freq.) tuning curve of the mean response of H1 in nonflying and flying flies (black and gray squares, respectively; data from Fig. 4) together with the results of the Reichardt detector model (see equation). The response is normalized by the maximum response of resting flies. d, Quality of fit as a function of the time constant of the low-pass filter. The error was calculated as the mean squared difference between the model responses and the experimental data. During flight, the low-pass time constant decreased from 0.069 to 0.024 s. e, Peristimulus time histogram of the mean response of H1 recorded in a nonflying condition to a 20 Hz stimulation lasting for 3 s before (black line) together with the result of the simulation (gray line). f, Same as e but recorded from a flying condition.
Figure 7.

Application of CDM changes the properties of the Reichardt detector. a, High-pass time constant before and after adaptation (before CDM: before adaptation = 0.161 s, after adaptation = 0.105 s; after CDM: before adaptation = 0.145 s, after adaptation = 0.062 s). Error bars indicate mean ± SEM of n = 3 flies. b, Temporal frequency (temp. freq.) tuning curve of the mean response of H1 before and after application of CDM (black and gray symbols, respectively; data from Fig. 5) together with the results of the Reichardt detector model (black and gray lines). The response is normalized by the maximum response of resting flies. c, Quality of fit as a function of the time constant of the low-pass (LP) filter. Application of CDM led to a decrease of the low-pass time constant from 0.062 to 0.036 s. d, Peristimulus time histogram of the mean response of H1 recorded after application of CDM to a 10 Hz stimulation lasting for 3 s before (black line) together with the result of the simulation (gray line).
Results
Flight changes velocity tuning of H1
To study how the response properties of the motion-sensitive neuron H1 is modulated by the behavioral state, we made extracellular recordings from H1 while the fly was not moving as well as during tethered flight. To characterize the influence of flight on the response properties of the H1 cell, we first measured the spontaneous activity under light-adapted conditions. We presented a stationary sine wave grating that was also used as the motion stimulus. Figure 3 shows an example trace of an H1 recording before (Fig. 3a), during (Fig. 3b), and after (Fig. 3c) flight. The extracted spikes are shown in Figure 3d–f. The recording quality did not change depending on whether the flies were flying or nonflying. However, between nonflight and flight, the spontaneous firing rate increased strongly from 8.4 ± 1.6 Hz to 75.5 ± 6.5 Hz (mean ± SEM; n = 8; p < 0.05). Next, we tested whether, in addition to the observed elevated spontaneous spike rate, the cells' velocity tuning changed. We used 10 different velocities ranging from 12 to 800 deg/s, corresponding to temporal frequencies from 0.3 to 20 Hz. At a small temporal frequency of 1 Hz, we found almost no difference in the response of H1 between the two behavioral conditions (Fig. 4a). This, however, changed dramatically when a high temporal frequency of 20 Hz was considered (Fig. 4b). Whereas in a nonmoving fly, the response of H1 after an initial transient peak rapidly settles to a small steady-state value, the response of H1 during flight stays at a high level during the whole stimulus presentation. If the steady-state response of H1 is plotted as a function of temporal frequency, the following difference in velocity tuning become obvious (Fig. 4c): in nonflying flies, the tuning curve reaches its maximum at ∼2 Hz and falls off rapidly toward higher velocities; in flying flies, the response stays at an almost constant level until a temporal frequency of 7 Hz is reached. For higher temporal frequencies, the response declines relatively little, so that even at the highest temporal frequency tested, i.e., 20 Hz, the response is still significantly higher than during nonflight. On average, the gain defined as the ratio of the response during flight and during nonflight increased steadily between 2 and 15 Hz (Fig. 4d).
Figure 3.

Raw voltage traces of H1 recording. a–c, Voltage traces before (a), during (b), and after (c) flight. The quality of the recording did not change during an experiment. d–f, This can also be seen in the spike wavelets before (d), during (e), and after (f) flight. The red lines represent the mean waveforms of the detected spikes.
Octopamine agonist mimics flight condition
Since octopamine level is known to increase in the hemolymphe during flight (Orchard et al., 1993), we tested whether the effects of flight on the response properties of H1 can be mimicked by application of the octopamine agonist CDM (Hiripi et al., 1999). To compare the response of H1 with and without the presence of externally applied CDM, we measured the spontaneous firing rate as well as the responses of H1 to patterns moving at different velocities using the same stimulus protocol as in the previous experiments. We then applied 2 μl of a 20 μm solution of CDM to the left hemisphere. After letting CDM diffuse for 5 min, we repeated the stimulus protocol. Application of CDM increased the spontaneous firing rate from 12 ± 2 Hz to 38 ± 3 Hz (p < 0.05, n = 10). At a low temporal frequency of 1 Hz, we found almost no difference in the time course of the response of H1 before and after application of CDM (Fig. 5a). However, increasing temporal frequencies of the stimulus led to responses that were comparable to the responses shown in Figure 4b (Fig. 5b). Again, similar to the flight condition, CDM application resulted in a significant broadening of the velocity tuning curve of H1 toward higher velocities (Fig. 5c). The gain increased steadily for temporal frequency up to 15 Hz (Fig. 5d). Overall, the changes in activity of H1 seen after CDM application were similar but less pronounced than those seen during flight.
Altered velocity tuning is accounted for by shorter motion-detector time constants
The Reichardt detector (Fig. 6a) is a well established model used to explain motion detection in the visual system (Hassenstein and Reichardt, 1956). Quantitatively, the steady-state response of such a detector to sine gratings moving at a constant velocity is described by the following equation (Borst et al., 2003):
 |
where λ represents the wavelength of the pattern (in degrees), Δϕ the sampling base (in degrees), ΔI the pattern contrast, τh the high-pass and τl the low-pass time constant (in seconds), , the angular frequency of the pattern (in Hertz), and v the stimulus velocity. As can be seen from the above equation, the steady-state velocity tuning of this detector depends only on the time-constants of the internal filters since the first two terms are independent of stimulus velocity, affecting the overall amplitude of the response only. We investigated to what extent the filter time constants had to be adjusted to explain the differences observed in the response to visual stimulation when the flies are at rest or during tethered flight. Interestingly, the decay time constant of the impulse response of such a detector is identical to the time constant of its high-pass filter, which shortens after prolonged stimulation by a moving grating (Borst et al., 2003; Reisenman et al., 2003). We therefore used the adapted high-pass time constant during nonflight and during flight as one parameter of our model. To estimate the other parameter, i.e., the time constant of the low-pass filter, we fitted the tuning curve of the model to the tuning curve of the fly obtained under both conditions by minimizing the mean square error between the model response and the experimental data.
We measured the impulse response in isolation and 200 ms after presenting a moving sine grating for 3 s. In the nonadapted state, the time constant of the impulse response during nonflight amounted to ∼170 ms, compared with ∼290 ms during flight. In the adapted state, both time constants shortened significantly, yielding values of 113 ms for nonflight and 165 ms during flight (Fig. 6b). We used the latter time constants as one parameter for the Reichardt detector and fitted the low-pass constant accordingly (Fig. 6c). The tuning curve for the nonflight condition was fitted best by the model using a low-pass time constant of 69 ms. For the flight condition, the best fit was obtained using a low-pass time constant of 24 ms (Fig. 6d). Using these parameters, we also fitted the response to a pattern movement with 20 Hz temporal frequency. While the model describes well the transient and steady-state amplitudes of the experiments with nonflying (Fig. 6e) and flying (Fig. 6f) flies, it deviates slightly in reproducing the time course of the transient oscillations at the onset of motion. This deviation might be due to a contrast-dependent nonlinearity that is not captured by the basic detector model (Reisenman et al., 2003).
From this, we conclude that during flight an important system parameter, i.e., the time constant of the low-pass filter, is strongly shortened. This shortening leads to a significant broadening of the velocity tuning of H1 during flight, making it more sensitive to higher velocities.
In analogy to the flight experiments, we measured the time constant of the high-pass filter after application of CDM. After the application of CDM, the time constant of the unadapted filter was found to be 145 and 62 ms after adaptation (Fig. 7a). We again used these time constants as one parameter for the Reichardt detector and fitted the low-pass constant accordingly (Fig. 7b). The tuning curve for the CDM condition was fitted best by the model using a low-pass time constant of 36 ms (Fig. 7c).
Discussion
The results presented above demonstrate that both during tethered flight and after the application of the octopamine agonist CDM, the spontaneous activity of H1 increases and its velocity tuning broadens significantly toward higher velocities. In addition, we measured and calculated to what extent the filter time constants of the Reichardt detector had to be adjusted to account for the differences in the velocity tuning when the flies are at rest or during flight. We found that during flight, the time constant of the high-pass filter increases by ∼70%, whereas the time constant of the low-pass filter shortens to 35% of its value during rest.
So far, only a few studies exist that investigate the influence of the behavioral state on the response properties of motion-sensitive interneurons in flies. Heide (1983) recorded extracellularly from H1 during flight. In this study, no difference in the response properties between the flying and nonflying state was found. However, the visual stimulus used drove H1 in nonflying flies to a firing rate of ∼300 Hz, which is the maximum fire rate that can be obtained. Therefore, the additional increase in fire rate might have been occluded due to output saturation. Maimon et al. (2010) and Chiappe et al. (2010) found an increase in the response of LPTCs of moving compared with nonmoving Drosophila. Furthermore, Chiappe et al. (2010) demonstrated a shift of the temporal frequency optimum from 1 to 3 Hz in walking Drosophila.
Studies in flying flies revealed a discrepancy between the electrophysiological measured temporal frequency tuning curve in lobula plate tangential cells and the behaviorally observed optomotor response. Whereas tuning properties of single cells in fixed flies showed an optimum ∼1 Hz (Lucilia: Eckert, 1980; Calliphora: Haag et al., 2004; Drosophila: Joesch et al., 2008), behavioral analysis revealed an optimal response of 2–5 Hz for walking Drosophila (Götz and Wenking, 1973) and 5–10 Hz for flying flies (Musca: Borst and Bahde, 1987; Calliphora: Hausen and Wehrhahn, 1989; Drosophila: Duistermars et al., 2007).
In our experiments, we found that flying as well as the application of CDM led to a shift and broadening of the temporal frequency tuning curve of H1. After the application of CDM, the measured frequency optimum was ∼3–5 Hz; flying led to an even further shift of the frequency optimum to ∼7 Hz. These results may solve the observed discrepancy in the velocity tuning between behavior and cellular response. However, in contrast to the experiments on Drosophila (Chiappe et al., 2010; Maimon et al., 2010), we did not find an amplification of the response at low temporal frequencies (Fig. 4a,d). Whether this reflects differences between the species or differences due to graded versus spiking neurons needs to be investigated in future studies. In addition, we found that flying led to an increase of the time constant of the high-pass filter compared with the nonflying state. This increase was not mimicked by the application of CDM. Instead, we found a decrease of this time constant after the application of CDM. This might indicate that factors other than octopamine play a role during flight or that the exact concentration and spatial distribution of octopamine during flight is important.
In invertebrates, octopamine acts as a neurotransmitter, neuromodulator, and neurohormone regulating many physiological processes (Roeder, 1999; Farooqui, 2007). Octopamine has been shown to change the behavioral state of an animal (Davenport and Evans, 1984; Stevenson et al., 2005). The effects of octopamine on the flight system of locust has been investigated in quite some detail, ranging from studies on adaption to energy-demanding processes to single-cell physiology (Orchard and Lange, 1984; Ramirez and Pearson, 1991; Orchard et al., 1993; Morris et al., 1999). Also, work in Drosophila has indicated that octopamine plays an important role during flight (Brembs et al., 2007). In the visual system, behavioral studies have shown that octopamine increases the optokinetic response in crabs and the motion-sensitive antennal reflex in honey bees (Erber and Sandeman, 1989; Erber and Kloppenburg, 1995). At the single-cell level, octopamine is known to increase the response to visual stimuli in the lobula plate of flies (Longden and Krapp, 2009, 2010). In addition, anatomical studies in flies have shown that the visual system is highly innervated by octopaminergic neurons projecting from the central brain into the lobula complex and the medulla (Sinakevitch and Strausfeld, 2006). Especially the projections to the medulla are of great interest since optical motion processing is thought to take place mainly in this neuropile (for review, see Borst, 2009). All together, these results give a strong hint that octopamine might modulate the time constant of those neurons involved in elementary motion detection in flies.
An increase in spontaneous activity for both the flying condition (Maimon et al., 2010) and the application of CDM (Longden and Krapp, 2009, 2010) has been observed in other lobula plate tangential cells before. In the nonflight condition, the spontaneous activity of H1 is rather low, ranging from 5 to 25 Hz. An increase of the spontaneous activity can have a strong effect on the neural coding properties. For CDM application, it has been shown that the tuning range for motion in null direction is increased through the elevated spontaneous-firing rate (Longden and Krapp, 2009). Information theoretical work has also revealed that an elevated firing activity can increase the information rate of H1 (Borst and Haag, 2001). Longden and Krapp (2009, 2010) showed that in spiking tangential cells, the information rate is increased after application of CDM. A broadening of the velocity tuning curve toward higher velocities can be interpreted as an adaptation toward higher image velocities created by self-motion. In contrast, a low firing rate in the resting state could be regarded as an evolutionary adaptation to save energy, since action potentials carry a significant metabolic cost (Laughlin, 2001).
Interestingly, Longden and Krapp (2010) found that after the application of CDM, the velocity tuning was almost unchanged. However, in their experiments, stimuli with a duration of 0.5 s were used. The short duration of the stimuli did not lead to a steady-state plateau in the response to higher velocities. Using longer stimulus durations, Longden and Krapp (2010, their Fig. 4) found that the response level reached after 3.25 s is strongly increased after the application of CDM, whereas the transient response is only slightly higher compared with control flies. While this result is in accordance with our data obtained in flying flies (Fig. 4b), it raises the more general question for the behavioral relevance of the transient versus the steady-state of response of lobula plate tangential cells. This is of particular interest since, during normal flight, flies execute several saccadic turns per second (Schilstra and van Hateren, 1999), reaching peak angular velocities of up to 2000 deg/s. These velocities are certainly far beyond the steady-state optimum of tangential cells, resulting in strong response transients only. Therefore, during such saccadic turns, the effect of flight and octopamine on the coding of angular velocities in tangential cells is expected to be negligible. However, the flight control system is also active between saccadic turns, obviously compensating for slow drifts of the fly (Kern et al., 2005; Mronz and Lehmann, 2008). Within these flight episodes, which can account for >90% of the total flight, tangential cells are expected to operate in their steady-state, and this steady-state response regime is significantly broadened toward higher stimulus velocities during active flight as well as octopamine application.
Footnotes
This work was supported by the Max-Planck-Society. S.N.J. was supported by a grant from the Deutsche Forschungsgemeinschaft (GRK1091). We are grateful to Renate Gleich for excellent technical assistance and Robert Schorner for the picture of the experimental setup.
References
- Borst A. Drosophila's view on insect vision. Curr Biol. 2009;19:R36–R47. doi: 10.1016/j.cub.2008.11.001. [DOI] [PubMed] [Google Scholar]
- Borst A, Bahde S. Comparison between the movement detection systems underlying the optomotor and the landing response in the housefly. Biol Cybern. 1987;56:217–224. [Google Scholar]
- Borst A, Haag J. Effects of mean firing on neural information rate. J Comput Neurosci. 2001;10:213–221. doi: 10.1023/a:1011225232120. [DOI] [PubMed] [Google Scholar]
- Borst A, Reisenman C, Haag J. Adaptation of response transients in fly motion vision. II. Model studies. Vision Res. 2003;43:1309–1322. doi: 10.1016/s0042-6989(03)00092-0. [DOI] [PubMed] [Google Scholar]
- Borst A, Haag J, Reiff DF. Fly motion vision. Annu Rev Neurosci. 2010;33:49–70. doi: 10.1146/annurev-neuro-060909-153155. [DOI] [PubMed] [Google Scholar]
- Brembs B, Christiansen F, Pflüger HJ, Duch C. Flight initiation and maintenance deficits in flies with genetically altered biogenic amine levels. J Neurosci. 2007;27:11122–11131. doi: 10.1523/JNEUROSCI.2704-07.2007. [DOI] [PMC free article] [PubMed] [Google Scholar]
- Brenner N, Strong SP, Koberle R, Bialek W, de Ruyter van Steveninck RR. Synergy in a neural code. Neural Comput. 2000;12:1531–1552. doi: 10.1162/089976600300015259. [DOI] [PubMed] [Google Scholar]
- Case JF. Differentiation of the effects of pH and CO2 on spiracular functions of insects. J Cell Physiol. 1957;49:103–113. doi: 10.1002/jcp.1030490106. [DOI] [PubMed] [Google Scholar]
- Chiappe ME, Seelig JD, Reiser MB, Jayaraman V. Walking modulates speed sensitivity in Drosophila motion vision. Curr Biol. 2010;20:1470–1475. doi: 10.1016/j.cub.2010.06.072. [DOI] [PMC free article] [PubMed] [Google Scholar]
- Davenport AP, Evans PD. Stress-induced changes in the octopamine levels of insect hemolymph. Insect Biochem. 1984;14:135–143. [Google Scholar]
- de Ruyter van Steveninck RRD, Lewen GD, Strong SP, Koberle R, Bialek W. Reproducibility and variability in neural spike trains. Science. 1997;275:1805–1808. doi: 10.1126/science.275.5307.1805. [DOI] [PubMed] [Google Scholar]
- Duistermars BJ, Chow DM, Condro M, Frye MA. The spatial, temporal, and contrast properties of expansion and rotation optomotor responses in Drosophila. J Exp Biol. 2007;210:3218–3227. doi: 10.1242/jeb.007807. [DOI] [PubMed] [Google Scholar]
- Eckert H. Functional properties of the H1-neurone in the third optic ganglion of the blowfly, Phaenicia. J Comp Physiol. 1980;135:29–39. [Google Scholar]
- Erber J, Sandeman DC. The effect of serotonin and octopamine on the optokinetic response of the crab Leptograpsus variegatus. J Neurobiol. 1989;20:667–680. doi: 10.1002/neu.480200802. [DOI] [PubMed] [Google Scholar]
- Erber J, Kloppenburg P. The modulatory effects of serotonin and octopamine in the visual system of the honey-bee (Apis mellifera L). I. Behavioral analysis of the motion-sensitive antennal reflex. J Comp Physiol. 1995;176:111–118. [Google Scholar]
- Farooqui T. Octopamine-mediated neuromodulation of insect senses. Neurochem Res. 2007;32:1511–1529. doi: 10.1007/s11064-007-9344-7. [DOI] [PubMed] [Google Scholar]
- Farrow K, Haag J, Borst A. Nonlinear, binocular interactions underlying flow field selectivity of a motion-sensitive neuron. Nat Neurosci. 2006;9:1312–1320. doi: 10.1038/nn1769. [DOI] [PubMed] [Google Scholar]
- Geiger G, Nässel DR. Visual orientation behaviour of flies after selective laser beam ablation of interneurons. Nature. 1981;293:398–399. doi: 10.1038/293398a0. [DOI] [PubMed] [Google Scholar]
- Geiger G, Nässel DR. Visual processing of moving single objects and wide-field patterns in flies: behavioural analysis after laser-surgical removal of interneurons. Biol Cybern. 1982;44:141–149. [Google Scholar]
- Götz KG, Wenking H. Visual control of locomotion in the walking fruitfly Drosophila. J Comp Physiol. 1973;85:235–266. [Google Scholar]
- Haag J, Borst A. Encoding of visual motion information and reliability in spiking and graded potential neurons. J Neurosci. 1997;17:4809–4819. doi: 10.1523/JNEUROSCI.17-12-04809.1997. [DOI] [PMC free article] [PubMed] [Google Scholar]
- Haag J, Vermeulen A, Borst A. The intrinsic electrophysiological characteristics of fly lobula plate tangential cells. III. Visual response properties. J Comput Neurosci. 1999;7:213–234. doi: 10.1023/a:1008950515719. [DOI] [PubMed] [Google Scholar]
- Haag J, Denk W, Borst A. Fly motion vision is based on Reichardt detectors regardless of the signal-to-noise ratio. Proc Natl Acad Sci U S A. 2004;101:16333–16338. doi: 10.1073/pnas.0407368101. [DOI] [PMC free article] [PubMed] [Google Scholar]
- Haag J, Wertz A, Borst A. Integration of lobula plate output signals by DNOVS1, an identified premotor descending neuron. J Neurosci. 2007;27:1992–2000. doi: 10.1523/JNEUROSCI.4393-06.2007. [DOI] [PMC free article] [PubMed] [Google Scholar]
- Haag J, Wertz A, Borst A. Central gating of fly optomotor response. Proc Natl Acad Sci U S A. 2010;107:20104–20109. doi: 10.1073/pnas.1009381107. [DOI] [PMC free article] [PubMed] [Google Scholar]
- Hassenstein B, Reichardt W. Systemtheoretische Analyse der Zeit-, Reihenfolgen- und Vorzeichen-auswertung bei der Bewegungsperzeption des Russelkafers Chlorophanus. Zeitschr Naturforsch. 1956;llb:513–524. [Google Scholar]
- Hausen K, Wehrhahn C. Microsurgical lesion of horizontal cells changes optomotor yaw response in the blowfly Calliphora erythocephala. Proc R Soc Lond B. 1983;219:211–216. [Google Scholar]
- Hausen K, Wehrhahn C. Neural circuits mediating visual flight control in flies. I. Quantitative comparison of neural and behavioral response characteristics. J Neurosci. 1989;9:3828–3836. doi: 10.1523/JNEUROSCI.09-11-03828.1989. [DOI] [PMC free article] [PubMed] [Google Scholar]
- Hausen K, Wehrhahn C. Neural circuits mediating visual flight control in flies. II. Separation of two control systems by microsurgical brain lesions. J Neurosci. 1990;10:351–360. doi: 10.1523/JNEUROSCI.10-01-00351.1990. [DOI] [PMC free article] [PubMed] [Google Scholar]
- Heide G. BIONA report. 2 ed. Mainz: Akademie der Wissenschaften und der Literatur zu Mainz and Gustav Fischer Verlag; 1983. Neural mechanisms of flight control in Diptera; pp. 35–52. (Nachtigall, W) [Google Scholar]
- Heisenberg M, Wonneberger R, Wolf R. Optomotor-blind (H31): a Drosophila mutant of the lobula plate giant neurons. J Comp Physiol. 1978;124:287–296. [Google Scholar]
- Hiripi L, Nagy L, Hollingworth RM. In vitro and in vivo effects of formamidines in locust (Locusta migratoria migratorioides) Acta Biol Hung. 1999;50:81–87. [PubMed] [Google Scholar]
- Joesch M, Plett J, Borst A, Reiff DF. Response properties of motion-sensitive visual interneurons in the lobula plate of Drosophila melanogaster. Curr Biol. 2008;18:368–374. doi: 10.1016/j.cub.2008.02.022. [DOI] [PubMed] [Google Scholar]
- Kern R, van Hateren JH, Michaelis C, Lindemann JP, Egelhaaf M. Function of a fly motion-sensitive neuron matches eye movements during free flight. PLoS Biol. 2005;3:e171. doi: 10.1371/journal.pbio.0030171. [DOI] [PMC free article] [PubMed] [Google Scholar]
- Krapp HG, Hengstenberg R. Estimation of self-motion by optic flow processing in single visual interneurons. Nature. 1996;384:463–466. doi: 10.1038/384463a0. [DOI] [PubMed] [Google Scholar]
- Krapp HG, Hengstenberg B, Hengstenberg R. Dendritic structure and receptive-field organization of optic flow processing interneurons in the fly. J Neurophysiol. 1998;79:1902–1917. doi: 10.1152/jn.1998.79.4.1902. [DOI] [PubMed] [Google Scholar]
- Laughlin SB. Energy as a constraint on the coding and processing of sensory information. Curr Opin Neurobiol. 2001;11:475–480. doi: 10.1016/s0959-4388(00)00237-3. [DOI] [PubMed] [Google Scholar]
- Longden KD, Krapp HG. State-dependent performance of optic-flow processing interneurons. J Neurophysiol. 2009;102:3606–3618. doi: 10.1152/jn.00395.2009. [DOI] [PubMed] [Google Scholar]
- Longden KD, Krapp HG. Octopaminergic modulation of temporal frequency coding in an identified optic flow-processing interneuron. Front Syst Neurosci. 2010;4:153. doi: 10.3389/fnsys.2010.00153. [DOI] [PMC free article] [PubMed] [Google Scholar]
- Maddess T, Laughlin SB. Adaptation of the motion-sensitive neuron H1 is generated locally and governed by contrast frequency. Proc R Soc Lond B Biol Sci. 1985;225:251–275. [Google Scholar]
- Maimon G, Straw AD, Dickinson MH. Active flight increases the gain of visual motion processing in Drosophila. Nat Neurosci. 2010;13:393-U29. doi: 10.1038/nn.2492. [DOI] [PubMed] [Google Scholar]
- Morris OT, Duch C, Stevenson PA. Differential activation of octopaminergic (DUM) neurones via proprioceptors responding to flight muscle contractions in the locust. J Exp Biol. 1999;202:3555–3564. doi: 10.1242/jeb.202.24.3555. [DOI] [PubMed] [Google Scholar]
- Mronz M, Lehmann FO. The free-flight response of Drosophila to motion of the visual environment. J Exp Biol. 2008;211:2026–2045. doi: 10.1242/jeb.008268. [DOI] [PubMed] [Google Scholar]
- Niell CM, Stryker MP. Modulation of visual responses by behavioral state in mouse visual cortex. Neuron. 2010;65:472–479. doi: 10.1016/j.neuron.2010.01.033. [DOI] [PMC free article] [PubMed] [Google Scholar]
- Orchard I, Lange A. Cyclic-AMP in locust fat-body: correlation with octopamine and adipokinetic hormones during flight. J Insect Physiol. 1984;30:901–904. [Google Scholar]
- Orchard I, Ramirez JM, Lange AB. A multifunctional role for octopamine in locust flight. Annu Rev Entomol. 1993;38:227–249. [Google Scholar]
- Ramirez JM, Pearson KG. Octopaminergic modulation of interneurons in the flight system of the locust. J Neurophysiol. 1991;66:1522–1537. doi: 10.1152/jn.1991.66.5.1522. [DOI] [PubMed] [Google Scholar]
- Reisenman C, Haag J, Borst A. Adaptation of response transients in fly motion vision. I. Experiments. Vision Res. 2003;43:1291–1307. doi: 10.1016/s0042-6989(03)00091-9. [DOI] [PubMed] [Google Scholar]
- Reiser MB, Dickinson MH. A modular display system for insect behavioral neuroscience. J Neurosci Methods. 2008;167:127–139. doi: 10.1016/j.jneumeth.2007.07.019. [DOI] [PubMed] [Google Scholar]
- Rind FC, Santer RD, Wright GA. Arousal facilitates collision avoidance mediated by a looming sensitive visual neuron in a flying locust. J Neurophysiol. 2008;100:670–680. doi: 10.1152/jn.01055.2007. [DOI] [PMC free article] [PubMed] [Google Scholar]
- Roeder T. Octopamine in invertebrates. Prog Neurobiol. 1999;59:533–561. doi: 10.1016/s0301-0082(99)00016-7. [DOI] [PubMed] [Google Scholar]
- Rosenberg LA, Glusman JG, Libersat F. Octopamine partially restores walking in hypokinetic cockroaches stung by the parasitoid wasp Ampulex compressa. J Exp Biol. 2007;210:4411–4417. doi: 10.1242/jeb.010488. [DOI] [PubMed] [Google Scholar]
- Schilstra C, van Hateren JH. Blowfly flight and optic flow. I. Thorax kinematics and flight dynamics. J Exp Biol. 1999;202:1481–1490. doi: 10.1242/jeb.202.11.1481. [DOI] [PubMed] [Google Scholar]
- Schnell B, Joesch M, Forstner F, Raghu SV, Otsuna H, Ito K, Borst A, Reiff DF. Processing of horizontal optic flow in three visual interneurons of the Drosophila brain. J Neurophysiol. 2010;103:1646–1657. doi: 10.1152/jn.00950.2009. [DOI] [PubMed] [Google Scholar]
- Sinakevitch I, Strausfeld NJ. Comparison of octopamine-like immunoreactivity in the brains of the fruit fly and blow fly. J Comp Neurol. 2006;494:460–475. doi: 10.1002/cne.20799. [DOI] [PubMed] [Google Scholar]
- Stevenson PA, Dyakonova V, Rillich J, Schildberger K. Octopamine and experience-dependent modulation of aggression in crickets. J Neurosci. 2005;25:1431–1441. doi: 10.1523/JNEUROSCI.4258-04.2005. [DOI] [PMC free article] [PubMed] [Google Scholar]
- Treue S, Maunsell JH. Attentional modulation of visual motion processing in cortical areas MT and MST. Nature. 1996;382:539–541. doi: 10.1038/382539a0. [DOI] [PubMed] [Google Scholar]
- Vierk R, Pflueger HJ, Duch C. Differential effects of octopamine and tyramine on the central pattern generator for Manduca flight. J Comp Physiol A Neuroethol Sens Neural Behav Physiol. 2009;195:265–277. doi: 10.1007/s00359-008-0404-5. [DOI] [PubMed] [Google Scholar]
- Wertz A, Borst A, Haag J. Nonlinear integration of binocular optic flow by DNOVS2, a descending neuron of the fly. J Neurosci. 2008;28:3131–3140. doi: 10.1523/JNEUROSCI.5460-07.2008. [DOI] [PMC free article] [PubMed] [Google Scholar]
- Wertz A, Haag J, Borst A. Local and global motion preferences in descending neurons of the fly. J Comp Physiol A Neuroethol Sens Neural Behav Physiol. 2009;195:1107–1120. doi: 10.1007/s00359-009-0481-0. [DOI] [PMC free article] [PubMed] [Google Scholar]