

Abstract
A classical example of age-dependent plasticity is ocular dominance (OD) plasticity, triggered by monocular deprivation (MD). Sensitivity of cortical circuits to a brief period of MD is maximal in juvenile animals and downregulated in adult age. It remains unclear whether a reduced potential for morphological remodeling underlies this downregulation of physiological plasticity in adulthood. Here we have tested whether stimulation of structural rearrangements is effective in promoting experience-dependent plasticity in adult age. We have exploited a bacterial protein toxin, cytotoxic necrotizing factor 1 (CNF1), that regulates actin dynamics and structure of neuronal processes via a persistent activation of Rho GTPases. Injection of CNF1 into the adult rat visual cortex triggered a long-lasting activation of the Rho GTPase Rac1, with a consequent increase in spine density and length in pyramidal neurons. Adult rats treated with CNF1, but not controls, showed an OD shift toward the open eye after MD. CNF1-mediated OD plasticity was selectively attributable to the enhancement of open-eye responses, whereas closed-eye inputs were unaffected. This effect correlated with an increased density of geniculocortical terminals in layer IV of monocularly deprived, CNF1-treated rats. Thus, Rho GTPase activation reinstates OD plasticity in the adult cortex via the potentiation of more active inputs from the open eye. These data establish a direct link between structural remodeling and functional plasticity and demonstrate a role for Rho GTPases in brain plasticity in vivo. The plasticizing effects of Rho GTPase activation may be exploited to promote brain repair.
Introduction
Critical periods are particularly sensitive phases of development during which even brief alterations in sensory experience induce significant cortical plasticity (Berardi et al., 2000; Hensch, 2005). For example, a short period of monocular deprivation (MD) in early age induces a shift in the ocular dominance (OD) of cortical neurons toward the open eye (Frenkel and Bear, 2004). Even if the adult cortex retains some potential for plasticity, sensitivity of cortical circuits to MD is maximal in juvenile animals (Hofer et al., 2006; Lehmann and Löwel, 2008; Morishita and Hensch, 2008; Sato and Stryker, 2008). Similarly, structural plasticity of neuronal processes in visual cortex is prominent in young animals and much reduced in adulthood. For example, the vast majority of dendritic spines, the main site of excitatory input, are remarkably stable and persist unaltered over a period of months in the adult visual cortex (Grutzendler et al., 2002; Majewska et al., 2006; Keck et al., 2008; Holtmaat and Svoboda, 2009; Chen and Nedivi, 2010). It remains unclear whether this downregulation of structural remodeling underlies the reduced potential for experience-dependent plasticity in adulthood.
Actin dynamics is a key regulator of the shape and morphological plasticity of axons, dendrites, and dendritic spines. Actin dynamics is controlled by the Rho family of small GTPases, including RhoA, Rac1, and Cdc42 (Van Aelst and Cline, 2004). Rho GTPases are molecular switches that cycle between a GDP-bound inactive and a GTP-bound active state to control actin assembly and polymerization. Rho GTPases can be blocked in their activated, GTP-bound state by a bacterial protein toxin from Escherichia coli, named cytotoxic necrotizing factor 1 (CNF1). CNF1 catalyzes the deamidation of a single glutamine residue of the Rho molecules, thus impeding GTP hydrolysis and leading to their persistent activation (Flatau et al., 1997; Schmidt et al., 1997; Diana et al., 2007). Here we have exploited this enzymatic activity to examine whether stimulation of structural rearrangements reinstates experience-dependent plasticity in adult age.
Materials and Methods
Animals
Long–Evans hooded female rats (age > P90) bred in our animal facility were used in this study. A total of 132 animals were used. Animals were housed in a 12 h light/dark cycle with food and water available ad libitum. All experimental procedures were in conformity to the European Communities Council Directive 86/609/EEC and were approved by the Italian Ministry of Health.
CNF1 injections
E. coli CNF1 was obtained from the 392 ISS strain (kindly provided by V. Falbo, Istituto Superiore di Sanità, Rome, Italy) and purified as described previously (Falzano et al., 1993b). CNF1 was diluted to a final working concentration of 2 nm with sterile 20 mm Tris-HCl buffer, pH 7.5. CNF1 activity was tested on cultures of mouse NIH-3T3 fibroblasts that become giant and multinucleated 24–48 h after toxin exposure (Falzano et al., 1993a). For control injections, we used either the vehicle solution (Tris-HCl buffer) or a recombinant toxin (CNF1 C866S) in which the change of cysteine with serine at position 866 abrogates the enzymatic activity on Rho GTPases (Schmidt et al., 1998). The plasmid coding for CNF1 C866S was a kind gift from E. Lemichez (Inserm, Nice, France), and the recombinant toxin was purified as described previously (Falzano et al., 1993b).
Stereotaxic infusions of CNF1 (3 μl of a 2 nm solution) or control solution were made into the primary visual cortex of adult rats under avertin anesthesia. CNF1/control injections were performed in three sites: 4.0 lateral to the midline and 1 mm anterior, 1 mm posterior, and in correspondence with lambda. CNF1 was slowly delivered at a depth of 0.8–1 mm from the pial surface.
Electrophysiology
Rats were anesthetized with urethane (Sigma; 20% solution in saline; 7 ml/kg body weight) and placed in a stereotaxic apparatus. Recordings were performed as described previously (Restani et al., 2009). A portion of the skull overlying the occipital cortex was carefully drilled on one side of the skull, and a glass micropipette (2 MΩ) filled with NaCl (3 m) was mounted on a three-axis motorized micromanipulator and inserted into the binocular portion of visual cortex (∼5.0 mm lateral from midline and in correspondence with lambda). Visual evoked potentials (VEPs) and single units were recorded from three to four penetrations per animal.
For VEP recordings, the electrode was typically positioned at a depth of 400 μm within the cortex. In some animals, recordings were also performed at a depth of 100 μm and yielded the same results (Restani et al., 2009). Transient VEPs were recorded in response to abrupt reversal (1 Hz) of a horizontal square-wave grating (spatial frequency, 0.07 cycles/°; contrast, 90%), generated by computer on a display (Sony; subtending 110 × 85° of visual angle; mean luminance, 15 cd/m2) by a VSG card (Cambridge Research System). VEP amplitude was quantified for each eye by measuring the peak-to-trough amplitude, as described previously (Restani et al., 2009; Cerri et al., 2010). Analysis of the amplitude of VEP responses was performed blind to experimental treatment.
Extracellular recordings of spiking activity were performed at a depth <800 μm from the cortical surface. Thus, our sample of cells is mainly derived from layers II–III, in which we also examined CNF1-mediated structural plasticity (see below). The visual stimulus consisted of a computer-generated bar (contrast, 90%; thickness, 3°; speed, 25°/s) presented on a monitor (Sony; mean luminance, 15 cd/m2). Spontaneous activity and peak response were determined from peristimulus time histograms (PSTHs) of the cell response to the stimulus, averaged over 20 consecutive stimulations as described previously (Restani et al., 2009; Cerri et al., 2010).
OD was evaluated according to the methods of Hubel and Wiesel (1962). Neurons in ocular dominance class 1 were driven only by stimulation of the contralateral eye. Neurons in ocular dominance class 2/3 were binocular and preferentially driven by the contralateral eye. Neurons in ocular dominance class 4 were equally driven by the two eyes. Neurons in ocular dominance class 5/6 were binocular and preferentially driven by the ipsilateral eye. Neurons in ocular dominance class 7 were driven only by the ipsilateral eye. For each animal, the bias of the OD distribution toward the contralateral eye [contralateral bias index (CBI)] was calculated as follows: CBI = [(N(1) − N(7)) + 1/2 (N(2/3) − N(5/6)) + NTOT]/2NTOT, where N(i) is the number of cells in class (i), and NTOT is the total number of recorded cells in a specific animal.
To obtain a finer and statistically more robust comparison of OD distributions, we computed the normalized OD score of single neurons (Rittenhouse et al., 1999) and plotted the cumulative distribution for each experimental group. OD score was computed on cells with complete PSTH analysis of peak and baseline spiking activity after closure of either eye. OD score was defined as {[Peak(ipsi) − baseline(ipsi)] − [Peak(contra) − baseline(contra)]}/{[Peak(ipsi) − baseline(ipsi)] + [Peak(contra) − baseline(contra)]}.
Anatomical analysis
Rats were deeply anesthetized and transcardially perfused with 4% paraformaldehyde in 0.1 m phosphate buffer 10 d after injection of CNF1 (n = 8) or control solution (n = 4). A group of naive, untreated rats was also included (n = 4). Serial cortical sections (one of three, 40 μm thick, cut on a freezing microtome) were Nissl stained for the evaluation of cortical thickness. The remaining serial sections were immunostained with the neuron-specific anti-NeuN (mouse monoclonal; Millipore Bioscience Research Reagents) or with OX-42 (mouse monoclonal; BD Pharmingen) antibodies (Caleo et al., 2007). Cortical thickness and neuronal and microglial density were measured in five coronal sections per animal using Stereo Investigator software (MicroBrightField). Analysis was performed blind to experimental treatment.
Cortical thickness.
In each section, we measured the distance from the pial surface to white matter. These values were averaged to obtain cortical thickness in individual animals.
Density of NeuN- and OX-42-positive cells.
NeuN- and OX-42-positive cells were counted in three-dimensional counting boxes (100 × 100 × 20 μm) positioned in layer II/III of primary visual cortex. An average of 450 NeuN-positive and 340 OX-42-positive cells were counted for each experimental animal. Cell density was calculated by averaging values obtained from at least 15 counting boxes per animal. To determine CNF1 effects on microglial morphology, we acquired at high magnification several microglial cells per condition, and we compared their morphology blind to experimental treatment.
Another subset of four rats per group were perfused 10 d after CNF1/vehicle, and brain coronal sections were stained for perineuronal nets and myelin basic protein. After a blocking step, sections were incubated with biotin-conjugated Wisteria floribunda agglutinin (WFA) (10 μg/ml; Sigma) or with myelin basic protein (MBP) (1:500; Sternberger Monoclonals), followed by Cy3-conjugated ExtrAvidin (1:500; Sigma) or anti-rabbit secondary antibody conjugated to Dy568 fluorophore (1:500; Jackson ImmunoResearch), respectively.
Density of WFA-positive cells.
Labeled cells were counted blind to treatment on a fluorescence microscope using a 40× objective in vertical stripes (width, 250 μm) spanning the entire thickness of primary visual cortex from layer II to layer VI. Six to eight sections were analyzed for each experimental animal.
Analysis of MBP expression.
Images from anti-MBP-stained coronal sections through the visual cortex were captured at 10× with a CCD Carl Zeiss Axiocam camera. Exposure time and gain were kept constant for all samples. Images were imported into NIH ImageJ, and the distribution of relative MBP intensity within visual cortex was quantified according to the procedure described by McGee et al. (2005). The distribution of fluorescence intensity was measured using the profile function of NIH ImageJ, and the corresponding pixel intensities were reported. Data points are the average of at least four to five sections from each of four animals per group.
To examine thalamocortical terminals, animals were intracortically injected with CNF1 (n = 6) or vehicle (n = 5), and the contralateral eye was monocularly deprived 1 week later. Monocularly deprived animals were perfused at 2 weeks. Another group of naive rats were injected unilaterally with CNF1 (n = 4) or vehicle (n = 4) and perfused at 10 d. Free-floating sections were incubated overnight with 1:1000 rabbit anti-vesicular glutamate transporter 2 (vGlut-2) primary antibody (Synaptic Systems) in PBS. The signal was detected by incubation in anti-rabbit secondary antibody conjugated to Dy488 fluorophore (1:200; Jackson ImmunoResearch). Sections were mounted on glass slides using VectaShield mounting medium (Vector Laboratories).
Density of vGlut-2-positive terminals.
Images of vGluT-2 immunoreactivity in layer IV of binocular visual cortex were acquired with a Leica confocal laser scanning microscope, using a 63× oil-immersion objective (numerical aperture 1.4) and a 2.5× digital zoom. A preliminary analysis of the fluorescence intensity of the samples was done, and the acquisition parameters (photomultiplier gain and offset, laser intensity) were set to avoid signal saturation at either end of the pixel intensity range (0–255). An intensity scan along the z-axis was used to select the brightest focal plane, which was acquired together with the underlying and overlying focal planes (1 μm z-step), and then the resulting images were stacked and saved as eight-bit TIFFs (Mainardi et al., 2010). At least 12 images from four to five sections were acquired for each experimental animal.
Signal quantification was performed with MetaMorph software (Molecular Devices) as described by Caleo et al. (2007, 2009). For each image, four rectangles covering neuronal somata and representing the background were drawn, and their mean fluorescence intensity was calculated; then, the values were averaged. vGlut-2 positive pixels were discriminated from background by applying a threshold (mean background signal in the cell somas multiplied by 4.5). The expression level of vGluT-2 was then calculated as the percentage of pixels in the field whose intensity was over threshold (Caleo et al., 2007, 2009; Mainardi et al., 2010).
Pull-down assay
A total of eight CNF1-injected and eight vehicle-injected rats were examined. Visual cortex samples were dissected, frozen in dry ice, and processed for a pull-down assay to determine levels of activated Rac1. The test is based on the use of an effector (GST–PAK70−106) capable of binding activated Rac1. Samples were homogenized in 50 mm Tris, pH 7.4, 1 mm EDTA, pH 8.0, 0.5% Nonidet P-40, 150 mm NaCl, 10% glycerol, 10 μg/ml aprotinin, 10 μg/ml leupeptin, and 1 mm PMSF and processed for pull-down assay as described previously (Diana et al., 2007). The homogenates were clarified by centrifugation at 14,000 rpm for 5 min at 4°C, and the pull-down assay was performed by using 0.5 mg of homogenate and 60 μg of GST–PAK70-106. Rac binding to GST–PAK70-106, total Rac, α-tubulin levels were determined by Western blot analysis as described below.
Immunoblotting
We injected CNF1 (n = 8) or vehicle solution (n = 8) in the visual cortex of rats older than P90. Their visual cortices were dissected 10 d after injection. Proteins were extracted with lysis buffer (1% Triton X-100, 10% glycerol, 20 mm Tris-HCl, pH 7.5, 150 mm NaCl, 10 mm EDTA, 0.1 mm Na3VO4, 1 μg/ml leupeptin, 1 μg/ml aprotinin, and 1 mm PMSF). Protein extracts (10 μg) were separated by electrophoresis and blotted, and filters were incubated with an antibody specific for vGlut-1 (1:2000 dilution; Synaptic Systems) or with an antibody recognizing GAD65/67 (1:5000 dilution; Sigma). Blots were then reacted with HRP-conjugated secondaries (Bio-Rad) and developed by ECL (GE Healthcare). Filters were also probed with anti-α-tubulin monoclonal antibody (1:10,000 dilution; Sigma), which serves as an internal standard for protein quantification. Levels of vGlut-1, GAD65/67, and activated Rac1 were determined as described previously (Caleo et al., 2007; Mainardi et al., 2010). Briefly, films were digitized, and band ODs relative to the proteins of interest and corresponding α-tubulin internal standards were measured with NIH Image J. For each sample (corresponding to the visual cortex of a single animal) and each film, we calculated the ratio of protein to α-tubulin OD values. These values were normalized to the mean of the ratios obtained for vehicle-treated samples run on the same gel. Each sample was run in three different gels, and the normalized values were averaged. Results are presented as a percentage of control (vehicle-treated) values (Cotrufo et al., 2003; Caleo et al., 2007; Antonucci et al., 2008; Mainardi et al., 2010).
Dendritic spine analysis
Adult rats injected with CNF1 (n = 11) or vehicle solution (n = 10) were deeply anesthetized and perfused through the heart with 4% paraformaldehyde 10 d after injection. A block of visual cortex was sectioned in the coronal plane into 300-μm-thick slices by using a vibratome (Leica). The lipophilic dye 1,1′-dioctadecyl-3,3,3′,3-tetramethylindocarbocyanine (DiI) (Invitrogen) was coated onto tungsten particles (diameter, 1.1 μm; Bio-Rad) according to Gan et al. (2000). DiI-coated particles were delivered to the slices by using a Helios Gene Gun System (Bio-Rad). Density of labeling was controlled by gas pressure (80 psi of helium). After labeling, slices were fixed in 4% paraformaldehyde. Labeled structures were analyzed with a Leica confocal microscope (63× oil-immersion objective; numerical aperture 1.4; 3× zoom). Two to four labeled pyramidal neurons per animal were randomly selected from layers II–III in the binocular zone of the visual cortex. Images of basal dendrites were acquired, stacked (0.5 μm step), and then analyzed with MetaMorph (Molecular Devices) blind to the treatment. All protrusions along each dendrite were counted and measured in length. Specifically, we measured the length of the spine neck (from the dendritic shaft to the beginning of the spine head). For the statistical analysis of spine neck lengths/densities, we cumulated the measures taken from individual spines/dendrites belonging to CNF1- or vehicle-treated neurons (Tashiro et al., 2000; Govek et al., 2004; Wallace and Bear, 2004). As an alternative method, we also measured the average lengths and densities for each animal and calculated the mean per group.
We examined protrusions in the dendritic segment starting from the first bifurcation (beginning at ∼25 μm from the soma; Mataga et al., 2004; Pizzorusso et al., 2006) and ending at a distance of 100 μm from the cell body. A total of 31 neurons/2356 spines and 21 neurons/1761 spines were analyzed in CNF1- and vehicle-treated rats, respectively.
Statistical analysis
Statistical analysis was performed with SigmaStat. Differences between two groups were assessed with Student's t test for data normally distributed and with Mann–Whitney rank-sum test for data non-normally distributed. Differences between three groups were evaluated with one-way ANOVA, followed by Holm–Sidak test. MBP intensity profiles were compared using two-way repeated measures ANOVA. Cumulative frequency distributions were compared with the Kolmogorov–Smirnov test. Differences between OD histograms were assessed using a χ2 test (four degrees of freedom).
Results
Activation of Rho GTPases increases spine density and length in cortical pyramidal neurons
Injection of CNF1 into the brain has been shown previously to trigger a sustained (28 d) activation of Rac1 (Diana et al., 2007; Pavone et al., 2009). We stereotaxically injected CNF1 (2 nm) or vehicle into the primary visual cortex of naive adult rats (older than P90). The activation state of Rac1 was assessed by a pull-down assay. A significant activation of Rac1 was observed 4 h after the injection (data not shown) and persisted at 10 d (paired t test, p < 0.01; Fig. 1A,B).
Figure 1.
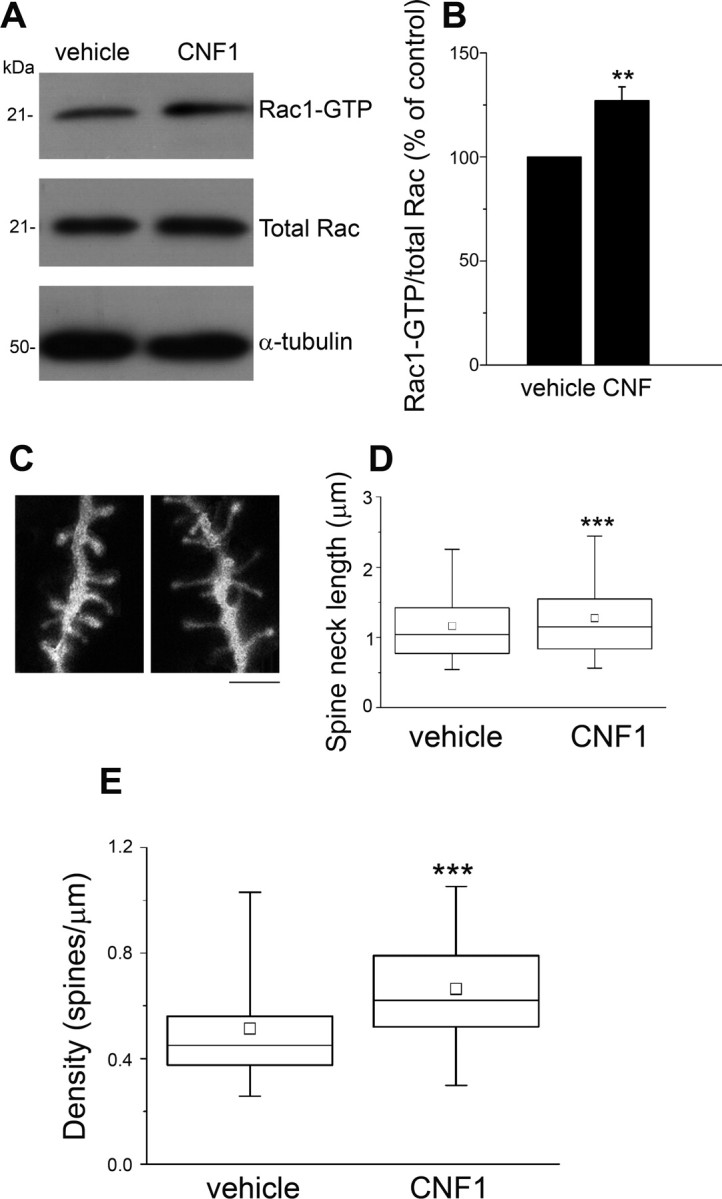
Enhanced Rac1 activation and increased spine density in the primary visual cortex after CNF1 treatment. A, Representative immunoblot showing the amount of activated Rac1 (Rac1–GTP) in protein extracts from visual cortex 10 d after CNF1 (or vehicle) injection. α-tubulin, Loading control. B, Quantification of the ratio between Rac1–GTP and total Rac in CNF1- and vehicle-treated rats (3 independent experiments). CNF1 significantly enhances Rac1 activation (paired t test, p < 0.01). C, Spine phenotype of visual cortex pyramidal neurons in animals treated with vehicle (left) or CNF1 (right). Scale bar, 1 μm. D, Box chart showing spine neck lengths for vehicle- and CNF1-treated neurons. The horizontal lines denote the 25th, 50th, and 75th percentile values. The error bars denote the 5th and 95th percentile values, whereas the square indicates the mean of the data. Spine neck length is significantly longer in CNF1-treated samples with respect to controls (Mann–Whitney rank-sum test, p < 0.001). E, Analysis of spine density in basal dendrites from layer II–III pyramidal neurons in visual cortex. Neurons of animals treated with CNF1 show a consistent and highly significant increase in the density of protrusions (Mann–Whitney rank-sum test, p < 0.001). The horizontal lines in the box chart denote the 25th, 50th, and 75th percentile values. The error bars denote the 5th and 95th percentile values, whereas the square indicates the mean of the data. We examined 2356 spines from 31 neurons and 1761 spines from 21 neurons in CNF1- and vehicle-treated rats, respectively. **p < 0.01; ***p < 0.001.
To evaluate the impact of CNF1 injection on dendritic spine structure, rats were intracortically injected with CNF1 (n = 11) or vehicle (n = 10) and perfused at 10 d. “DiOlistic” labeling of pyramidal neurons in layers II–III was performed on vibratome slices of primary visual cortex (Fig. 1C). We measured spine neck length and the density of protrusions on basal dendrites. The vast majority of the protrusions had a well-defined neck and head structure, characteristic of mature spines; filopodia accounted for only a minority of the protrusions, with no difference between CNF1-treated and control neurons (10.2 ± 0.57 and 10.8 ± 0.8%, respectively; t test, p = 0.99). For the statistical analysis of spine neck lengths/densities, we initially cumulated the measures taken from individual spines/dendrites belonging to CNF1- or vehicle-treated neurons. We found that median length of the spine neck in CNF1-treated cortices was significantly longer than in control cortices (CNF1: median, 1.15 μm; 25 -75% interquartile ranges, 0.83–1.55; vehicle: median, 1.04 μm; 25–75% interquartile ranges, 0.77–1.42; Mann–Whitney rank-sum test, p < 0.001; Fig. 1D). Remarkably, we detected a highly consistent increase in spine density of CNF1-treated neurons (median, 0.62 spines/μm; 25–75% interquartile ranges, 0.52–0.8) with respect to controls (median, 0.45 spines/μm; 25–75% interquartile ranges, 0.38–0.56; Mann–Whitney rank-sum test, p < 0.001; Fig. 1E). These results were highly consistent among animals, and indeed we obtained the same results by measuring the average lengths and densities for each animal and calculating the mean per group (length: CNF1, 1.15 ± 0.03 μm; vehicle, 0.99 ± 0.06 μm; t test, p = 0.037; density: CNF1, 0.64 ± 0.05 spines/μm; vehicle, 0.47 ± 0.04 spines/μm; t test, p = 0.028).
CNF1 injection increases vGlut-2 and vGlut-1 expression in visual cortex
To examine whether enhanced spine density in CNF1 animals was accompanied by a corresponding increase in presynaptic excitatory markers, we analyzed the expression of vGlut-1 and vGlut-2 in the visual cortex. A previous study (Coleman et al., 2010) demonstrates that vGlut-2 can be used as a selective and reliable marker for thalamocortical axon terminals in rodent primary visual cortex. We therefore analyzed vGlut-2 immunolabeling in layer IV of binocular visual cortex of vehicle- and CNF-treated animals. We found that vGlut-2 levels were higher in CNF1-injected rats with respect to the controls (t test, p = 0.04; Fig. 2A,B), pointing to an increased density of geniculocortical afferents in adult, CNF1-treated cortices.
Figure 2.
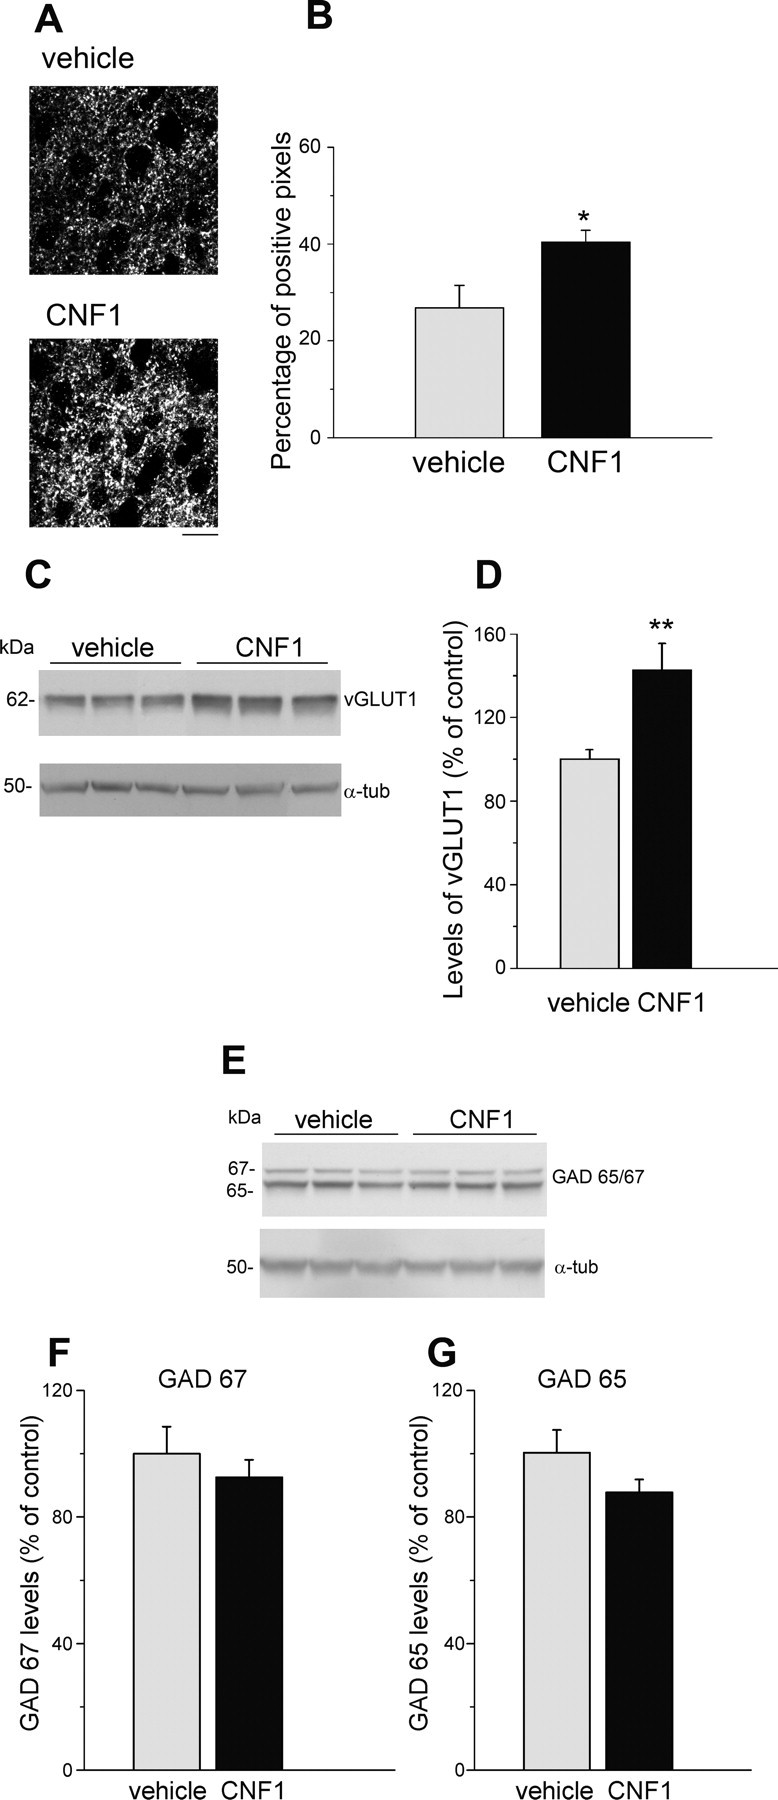
CNF1 injection increases vGlut-2 and vGlut-1 expression in visual cortex. A, Representative immunostaining for vGlut-2 in layer IV of binocular visual cortex in vehicle- and CNF1-treated rats. Scale bar, 10 μm. B, Quantification reveals a significant increase in density of vGlut-2-positive puncta in the CNF1-infused cortex (t test, p = 0.04). Data are mean ± SEM. C, Representative immunoblotting for vGlut-1 in the visual cortex of vehicle- and CNF1-injected rats. Each lane represents the visual cortex of one animal. α-tubulin, Loading control. D, Quantification of immunoblots for vGlut-1 (8 samples per group examined in triplicate). CNF1 significantly enhances the expression of vGlut-1 (t test, p < 0.01). Data are mean ± SEM. E, Representative immunoblotting for GAD65/67 on protein extracts from the visual cortex of vehicle- and CNF1-injected rats. Each lane represents the visual cortex of one animal. α-tubulin, Loading control. F, G, Quantification of immunoblots for GAD67 (F) and GAD65 (G; 8 samples per group examined in triplicate). There is no significant variation of GAD65/67 levels between vehicle and CNF1 samples (t test, GAD67, p = 0.47; GAD65, p = 0.15). Data are mean ± SEM. *p < 0.05; **p < 0.01.
We also analyzed the expression of vGlut-1, the major excitatory vesicular transporter in the cortex, by Western blot. Quantitative immunoblotting analysis indicated a significant (40%) upregulation of vGlut-1 in CNF1-treated cortices 10 d after injection (t test, p < 0.01; Fig. 2C,D).
There was a tendency for reduced levels of GABA biosynthetic enzymes GAD65/67 in CNF1-treated animals, but this trend did not reach statistical significance (t test, p > 0.15; Fig. 2E,F). Altogether, these data demonstrate that injection of CNF1 into the adult rat visual cortex induces a long-lasting activation of Rac1, associated with an increase in dendritic spine density and a corresponding increase in the levels of the presynaptic excitatory markers vGlut-2 and vGlut-1.
CNF1 treatment does not alter the expression of known structural brakes on plasticity
Histological controls were performed 10 d after CNF1 injection to demonstrate that the sustained activation of Rho GTPases had no deleterious effects on neuronal survival in the cortex. Cortical thickness and neuronal density (measured in NeuN-stained coronal sections) were superimposable in naive, CNF1- and vehicle-injected rats (one-way ANOVA, p > 0.57; Fig. 3A,B). We also controlled inflammatory responses using staining for OX-42, a marker for microglia and neutrophils (Tropea et al., 2003). We found that CNF1 had no impact on the density of OX-42-positive cells in primary visual cortex (one-way ANOVA, p = 0.63; Fig. 3C). We also compared microglial morphology between conditions, and we found no detectable differences between CNF1-treated and control cortices (Fig. 3D).
Figure 3.

CNF1 has no adverse effects on neuronal survival in the visual cortex. A, Mean cortical thickness in the various experimental groups. NORM, Cortex of normal adult animals (n = 4); vehicle, cortex injected with vehicle solution (n = 4); CNF1, cortex treated with CNF1 (n = 8). There are no significant differences among the groups (one-way ANOVA, p = 0.8). B, Top, Representative immunostaining for the neuronal marker NeuN in layer II–III of the visual cortex of animals in the three experimental groups. CNF1 produces no significant alterations in neuronal density (bottom; one-way ANOVA, p = 0.57). C, Top, Representative immunostaining for the microglial marker OX-42. Density of microglial cells is not impacted by CNF1 administration (bottom; one-way ANOVA, p = 0.63). Scale bars, 100 μm. All data are mean ± SEM. D, Representative high-magnification images of OX-42-positive microglial cells in the various groups. Scale bar, 12 μm.
It was of interest to examine whether CNF1 treatment has an impact on the expression of specific structural “brakes” on plasticity, such as perineuronal nets and myelin (Pizzorusso et al., 2002; McGee et al., 2005). Perineuronal nets (visualized by WFA) and MBP expression were examined 10 d after CNF1 injection. Quantification of the density of WFA-positive cells across the whole thickness of primary visual cortex revealed no significant differences among naive (NORM), vehicle- and CNF1-treated rats (one-way ANOVA, p = 0.33; Fig. 4A,B). The pattern of MBP staining was very similar in all animals, with strong expression in white matter and layers IV–VI and reduced expression in supragranular layers (Fig. 4C). The distribution of MBP intensity within visual cortex was indistinguishable among the experimental groups (two-way repeated-measures ANOVA, p = 0.85; Fig. 4D). Thus, CNF1 injection has no significant effect on the expression of known structural brakes on plasticity.
Figure 4.
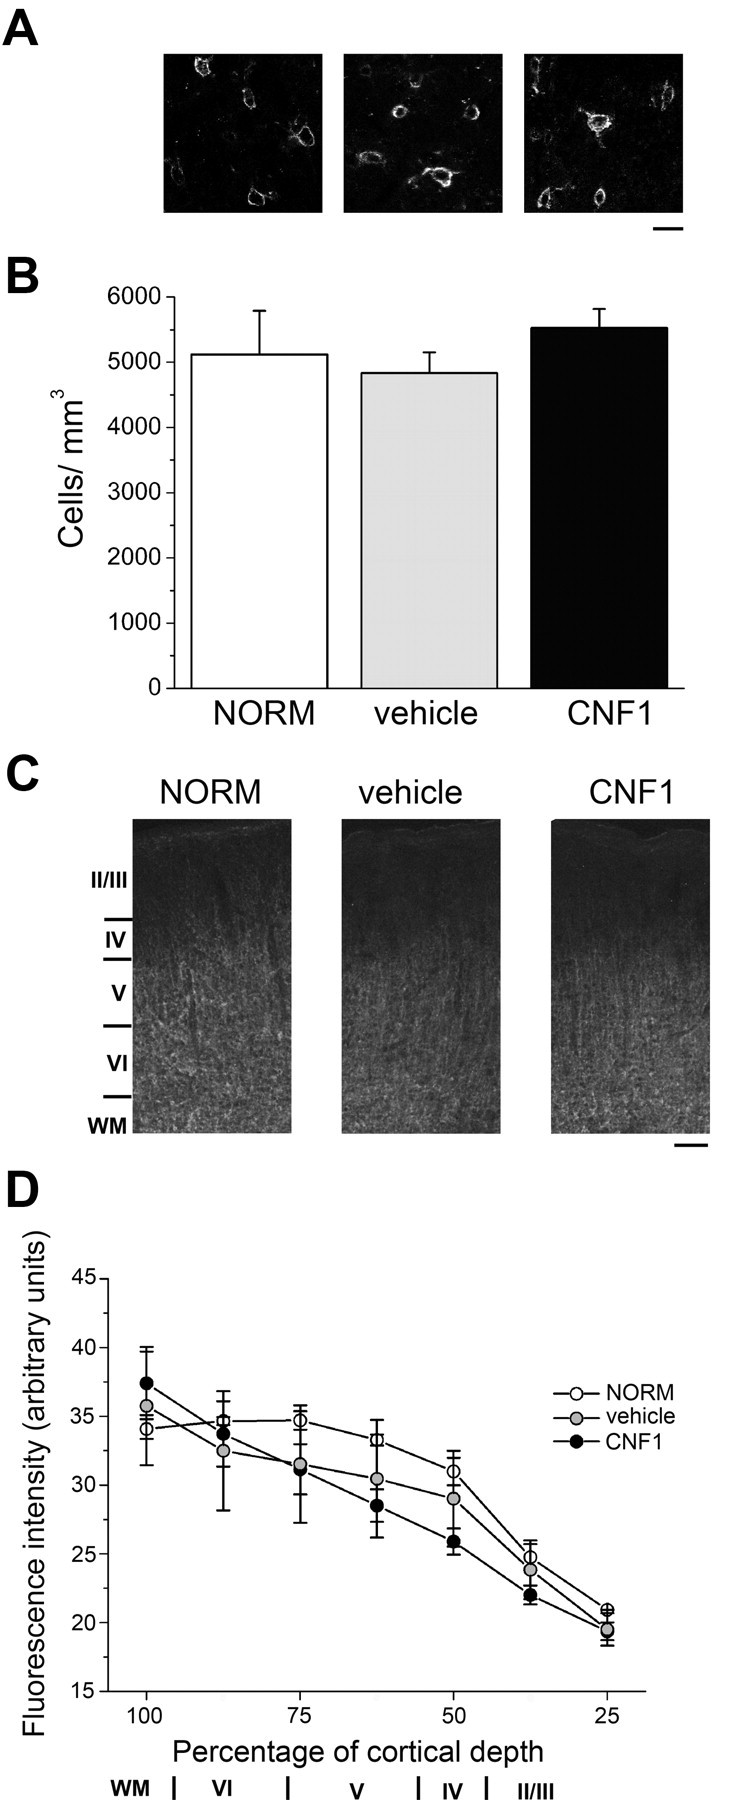
CNF1 injections have no impact on density of perineuronal nets and myelin expression. A, Representative staining for WFA in coronal sections through the visual cortex. NORM, Cortex of normal adult animals (n = 3); vehicle, cortex injected with vehicle solution (n = 4); CNF1, cortex treated with CNF1 (n = 4). Scale bar, 25 μm. B, Density of WFA-positive cells in the visual cortex of the different experimental groups. The statistical analysis reveals no significant differences in perineuronal net density (one-way ANOVA, p = 0.33). C, Representative coronal sections through the visual cortex labeled with antibodies to MBP. Layers I–VI and white matter (WM) are indicated on the left. Scale bar, 100 μm. D, Distribution of MBP intensity within visual cortex. Cortical layers are indicated on the abscissa. There are no significant differences in the intensity profile among the various groups (two-way repeated-measures ANOVA, p = 0.85). WM, White matter.
Activation of Rho GTPases reinstates OD plasticity via the enhancement of open eye inputs
We used the classical paradigm of MD to examine whether CNF1-induced structural remodeling reinstates functional plasticity. Adult (older than P90) rats were unilaterally injected into the visual cortex with CNF1 or vehicle, and 7 d later the eye contralateral to the injection was sutured shut. OD was evaluated by VEPs and extracellular recordings of single-unit activity after 7 d of MD (Fig. 5A).
Figure 5.
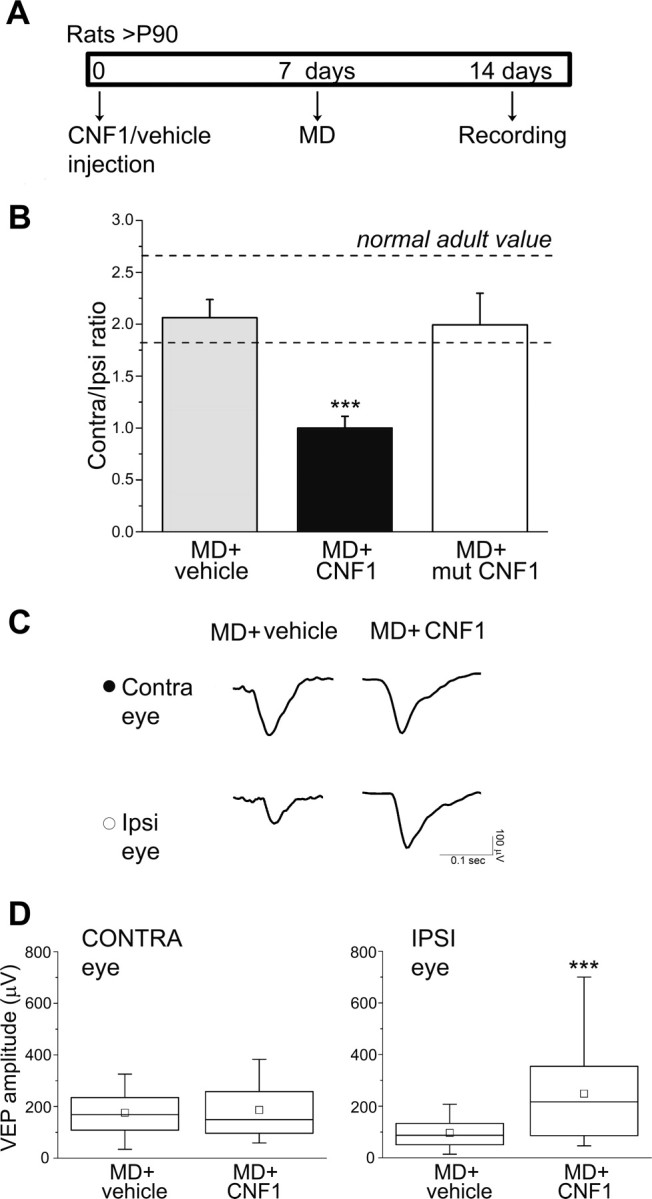
Activation of Rho GTPases reinstates OD plasticity in the adult cortex via potentiation of inputs from the ipsilateral, open eye. A, Experimental protocol. B, C/I VEP ratios in MD animals treated with vehicle (MD + vehicle; n = 11), with CNF1 (MD + CNF1; n = 8) and with a mutated form of CNF1 (MD + mut CNF1; n = 5). In MD + vehicle rats, the C/I ratio is unchanged (post-ANOVA Holm–Sidak test, p = 0.52) compared with the normal adult range (indicated by the dashed lines), whereas in MD + CNF1 animals, there is a dramatic decrease of the C/I ratio (p < 0.001). Injection of a mutated form of CNF1 (mut CNF1) is completely ineffective in shifting OD (MD + mut CNF1 vs MD + vehicle, p = 0.8; MD + mut CNF1 vs MD + CNF1, p = 0.002). Data are mean ± SEM. Normal adult range: mean ± SD value. C, Representative examples of VEP responses for both eyes in MD + vehicle (left column) and MD + CNF1 (right column) rats. Visual stimulus: square-wave grating alternating at 1 Hz, spatial frequency of 0.07 cycles/°, contrast at 90%. CONTRA, Contralateral deprived eye; IPSI, ipsilateral open eye. D, Quantitative analysis of absolute VEP amplitudes in MD + vehicle (n = 11) and MD + CNF1 (n = 8) rats. There is no difference in contralateral eye VEP amplitude between the two groups (Mann–Whitney rank-sum test, p = 0.75, left), whereas ipsilateral eye VEPs are significantly enhanced in CNF1-injected rats (Mann–Whitney rank-sum test, p < 0.001, right). ***p < 0.001.
We found that the contralateral-to-ipsilateral (C/I) VEP ratio (i.e., the ratio of VEP amplitudes recorded by stimulating the contralateral and ipsilateral eye) was ∼2 in naive adult rats. Intracortical injection of vehicle solution followed by MD had no effect on OD (Fig. 5B, MD + vehicle vs naive adult, post-ANOVA Holm–Sidak test, p = 0.52), whereas delivery of CNF1 produced a robust and consistent shift toward the ipsilateral open eye (one-way ANOVA followed by Holm–Sidak test, MD + vehicle and naive adult vs MD + CNF1, p < 0.001; Fig. 5B). Thus, CNF1 triggers a plastic modification normally restricted to the critical period. Importantly, injection of a mutated form of CNF1 that lacks enzymatic activity (mut CNF1; Schmidt et al., 1998) was completely ineffective in shifting OD (MD + CNF1 vs MD + mut CNF1, post-ANOVA Holm–Sidak test, p = 0.002; Fig. 5B), demonstrating that activation of Rho GTPases by CNF1-induced deamidation is crucial for the reinstatement of plasticity.
In an additional set of experiments, we combined intracortical CNF1 injections with MD of the contralateral eye, and OD was measured at 7 d (n = 6 rats). In these animals, we found a C/I ratio of 1.65 ± 0.1 (SEM), that is intermediate between that observed in MD + vehicle rats and MD + CNF1 rats analyzed at 14 d (one-way ANOVA followed by Holm–Sidak test; MD + CNF1 7 d vs MD + CNF1 14 d, p = 0.01; MD + CNF1 7 d vs MD + vehicle, p = 0.07).
The CNF1-induced OD shift after MD could be attributable to a depression of deprived eye inputs or to a potentiation of the visual drive through the ipsilateral open eye. To define the mechanism, we analyzed absolute VEP amplitudes after stimulation of each eye in MD rats treated with CNF1 or control solution (animals recorded 14 d after injection). Responses evoked by the contralateral, deprived eye were comparable in CNF1-treated and control rats (Mann–Whitney rank-sum test, p = 0.75; Fig. 5C,D). Conversely, there was a highly significant increase in the strength of inputs from the ipsilateral, open eye in CNF1-injected animals (Mann–Whitney rank-sum test, p < 0.001; Fig. 5C,D). Thus, the reinstatement of plasticity observed in CNF1 animals is selectively attributable to a potentiation of open-eye responses.
We next examined whether Rho GTPase activation alters the efficacy of each eye to evoke cortical spiking activity. Extracellular recordings of single-unit discharges were performed contralateral to the deprived eye, and OD was quantitatively assigned to each unit according to a five-point scale (Restani et al., 2009). We found that 7 d of MD were totally ineffective in shifting the OD distribution in rats treated with vehicle. Indeed, the OD distribution of MD + vehicle animals was biased toward the contralateral eye and superimposable to that of naive undeprived animals (χ2 test, p = 0.6; Fig. 6A). In contrast, a significant shift of OD toward the ipsilateral, open eye was induced in MD rats injected with CNF1 (χ2 test, p < 0.001; Fig. 6A). It is worth noting that this shift was mainly attributable to a loss of cells driven exclusively by the contralateral, deprived eye (class 1 cells; Fig. 6A). Computation of an OD score for each recorded neuron (Rittenhouse et al., 1999; Pizzorusso et al., 2002) confirmed that the OD distribution recorded in MD + CNF1 animals was significantly different from that of control rats (Kolmogorov–Smirnov test, p = 0.01; Fig. 6B). To examine how CNF1 application affects the response strength of each eye, we compared the peak discharge rates of single units in MD rats treated with CNF1 or with control solution. No difference was observed between two groups for the responses evoked by the deprived, contralateral eye (Mann–Whitney rank-sum test, p = 0.64; Fig. 6C, left). Remarkably, firing rates triggered by the ipsilateral open eye were significantly higher in CNF1-treated animals than in control animals (Mann–Whitney rank-sum test, p = 0.01; Fig. 6C, right). These spiking data are in line with the selective potentiation of the ipsilateral eye observed by VEP recordings (Fig. 5D). Moreover, the decrease of class 1 cells coupled to a globally stable strength of contralateral eye responses indicates that the likely mechanism of CNF1-mediated plasticity is a takeover of originally monocular, contralaterally driven cells by inputs from the ipsilateral eye.
Figure 6.
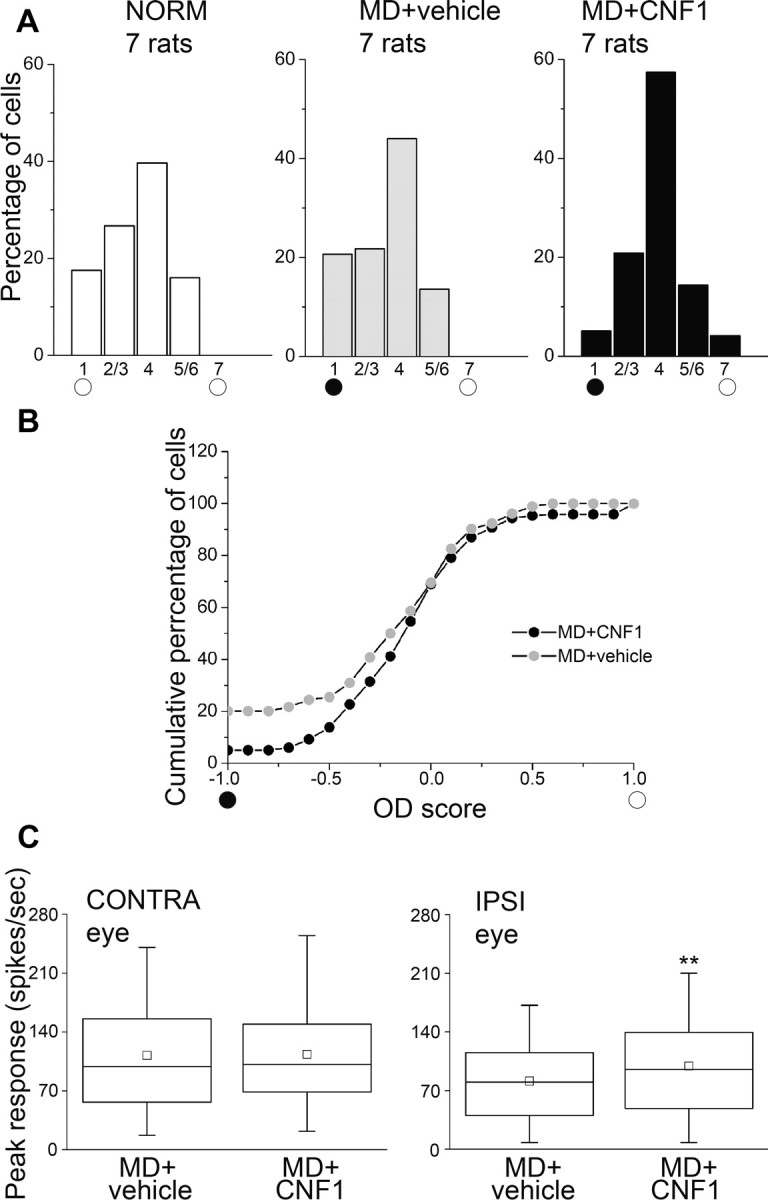
CNF1 injection in adult MD rats shifts the OD histogram toward the open eye. A, OD distributions of naive adult rats (NORM) and rats monocularly deprived for 7 d and treated with either vehicle (MD + vehicle) or CNF1 (MD + CNF1). Recordings were performed in the visual cortex contralateral to the closed eye (filled circle). CNF1 triggers a significant OD shift (χ2 test, p < 0.001) and a reduction of the proportion of neurons driven exclusively by the closed eye (class 1 cells). Number of animals as indicated. NORM, n = 131 cells; MD + vehicle, n = 184 cells; MD + CNF1, n = 216 cells. B, Cumulative distribution of the OD score of MD + vehicle (gray circles) and MD + CNF1 (black circles) rats. The two groups are significantly different from each other (Kolmogorov–Smirnov test, p = 0.01). C, Box chart showing peak firing rates of visual cortical neurons in MD + vehicle and MD + CNF1 rats. Ipsilateral (IPSI), open-eye responses are significantly increased by CNF1 treatment (Mann–Whitney rank-sum test, p = 0.01), whereas contralateral (CONTRA), deprived-eye responses are unaffected (Mann–Whitney rank-sum test, p = 0.64). **p = 0.01.
Increased density of geniculocortical terminals in layer IV of monocularly deprived, CNF1-treated rats
To gain insight into the mechanisms by which Rho GTPase activation triggers functional OD plasticity, we examined thalamocortical terminals in monocularly deprived rats, 14 d after CNF1 treatment. We analyzed vGlut-2 immunolabeling in layer IV of the binocular visual cortex contralateral to the deprived eye, and we found that vGlut-2 levels are consistently higher in CNF1-injected animals with respect to the controls (t test, p = 0.003; Fig. 7). This result indicates a robust rearrangement of afferent axonal terminals triggered by CNF1 in the visual cortex of adult MD rats. Moreover, this enhanced geniculocortical connectivity correlates with the potentiation of the open-eye responses, suggesting the addition of synaptic terminals serving the ipsilateral, nondeprived eye in the CNF1-treated cortex.
Figure 7.

Increased vGlut-2 expression in layer IV of CNF1-treated MD rats. A, Representative immunostaining for vGlut-2 in layer IV of binocular visual cortex contralateral to the deprived eye in vehicle- and CNF1-infused rats. Scale bar, 10 μm. B, Quantification reveals a significant increase in density of vGlut-2-positive puncta in the CNF1-treated cortex (t test, p = 0.003). Data are mean ± SEM. **p < 0.01.
Effects of Rho GTPase activation on cortical physiology in normal rats
To exclude the possibility that activation of Rho GTPases causes an OD shift toward the ipsilateral eye, we measured OD in a subset of adult, CNF1-treated animals with normal vision. We found that the C/I ratio of VEP responses was unaltered by CNF1 treatment in naive, undeprived adult rats (t test, CNF1 vs normal, p = 0.83; Fig. 8A). Receptive field size of cortical cells was also comparable between naive rats and naive rats treated with CNF1 (Mann–Whitney rank-sum test, p = 0.73; Fig. 8B), suggesting that spatial resolution of cortical neurons was not impacted by CNF1 treatment. We also noted an increase in the spontaneous discharge of cortical units (vehicle-treated, median of 4.7 spikes/s; CNF1-treated, median of 10.9 spikes/s; Mann–Whitney rank-sum test, p < 0.001), which is consistent with a higher density of excitatory synaptic inputs on cortical neurons.
Figure 8.
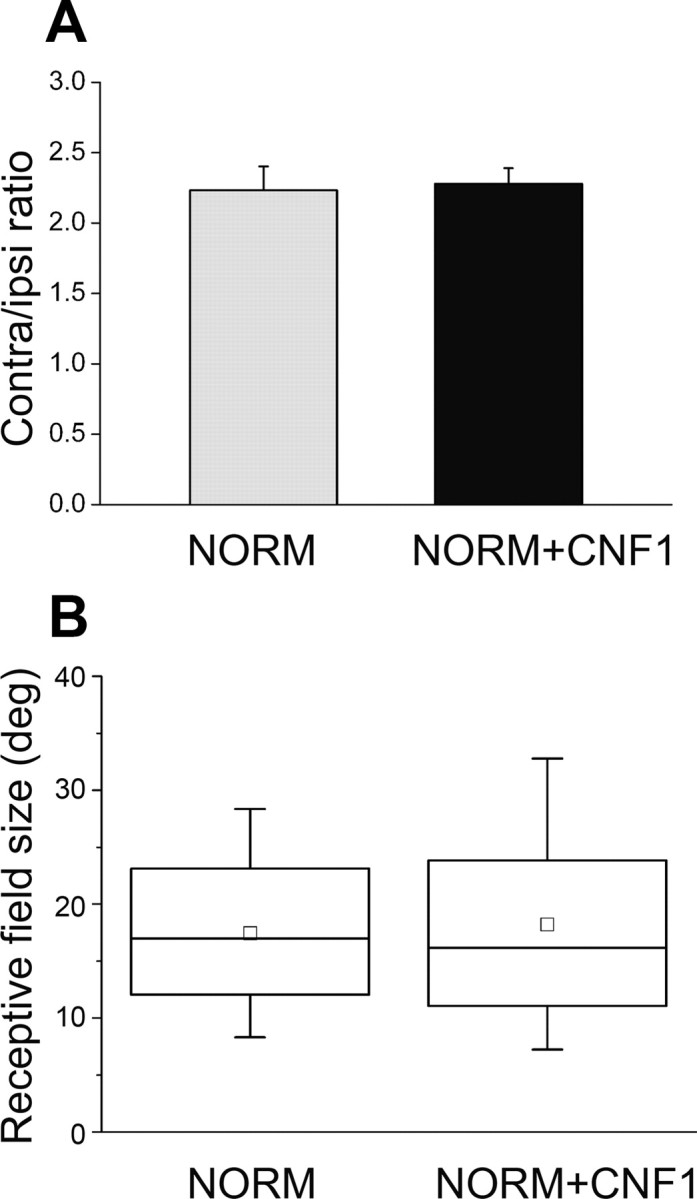
Effects of CNF1 injection in the normal adult visual cortex. A, C/I VEP ratio is identical in naive, undeprived adult rats (n = 4) and naive rats treated with CNF1 14 d before (n = 4; t test, p = 0.83). Data are mean ± SEM. B, Receptive field size is not altered by CNF1 infusion in naive rats (Mann–Whitney rank-sum test, p = 0.73). Normal, n = 131 cells; CNF1, n = 55 cells.
Discussion
These experiments provide novel evidence on the importance of structural remodeling for functional plasticity in the adult cerebral cortex. To induce morphological changes in the cortex, we have exploited a bacterial protein toxin, CNF1, that triggers a persistent activation of Rho GTPases (Flatau et al., 1997; Schmidt et al., 1997; Diana et al., 2007; Pavone et al., 2009). CNF1 has a remarkable specificity for small GTPases of the Rho family, thus excluding the involvement of other classes of GTPases such as Ras (Schmidt et al., 1998). Mutation of a single amino acid that is required for the enzymatic activity of CNF1 abolishes the ability of the toxin to induce spine growth in cultured neurons (Diana et al., 2007) and functional plasticity in vivo (present results), supporting the specificity of the CNF1 effects. Importantly, the anatomical analysis revealed no detectable changes in neuronal and microglial densities, indicating no pathological alterations after toxin treatment. We also found that CNF1 produces no changes in the expression of known structural “brakes” on adult plasticity, such as myelin and perineuronal nets. Therefore, the reactivation of OD plasticity by CNF1 appears to involve morphological changes that proceed independent of these well-described brakes on plasticity.
The Rho family of GTPases comprises RhoA, Rac1, and Cdc42, which have different actions on neurite elongation. Specifically, Rac1 and Cdc42 activation stimulates new spine formation and branching of neuronal dendrites, whereas RhoA exerts an inhibitory action (Tashiro et al., 2000; Sin et al., 2002; Govek et al., 2004; Van Aelst and Cline, 2004). Transgenic mice with overexpression of a constitutively active human Rac1 in Purkinje cells show increases in the density of dendritic spines and the appearance of supernumerary synapses (Luo et al., 1996). Antagonistic effects of Rac1 and RhoA have also been described for axon elongation. In general, Rac1 activation promotes axon outgrowth, whereas RhoA antagonizes it (Fournier et al., 2003; Montenegro-Venegas et al., 2010; Tahirovic et al., 2010). For example, Rac1 deficiency impairs axon and lamellipodia formation both in vivo and in vitro (Tahirovic et al., 2010).
CNF1 can potentially increase the activity of all three Rho GTPases, but previous in vivo studies in mice have shown that the CNF1-mediated activation of Rac1 is long lasting (28 d), whereas that of RhoA is short lasting (<10 d; Diana et al., 2007). For this reason, we decided to assess OD plasticity during the second week after CNF1 treatment. Indeed, the structural phenotype of CNF1-treated neurons at 10 d (increased spine density and length) correlated with an enhanced Rac1 activation (Fig. 1). In an independent set of physiology experiments, we combined CNF1 injection with MD, and OD plasticity was evaluated at 7 d. In these experiments, the induction of plasticity was significantly diminished. One possible explanation for this partial effect is that the plasticizing actions of Rac1 are partly counterbalanced by an activation of RhoA during the first phase after CNF1 injection (Diana et al., 2007).
Recent two-photon imaging studies have indicated a link between structural and functional plasticity by following longitudinally the morphology of spines and axonal boutons in response to an altered sensory experience (Hofer et al., 2009; Holtmaat and Svoboda, 2009; Tropea et al., 2009; Wilbrecht et al., 2010). These studies have consistently demonstrated experience-dependent changes in density, structure, and motility of neuronal processes (Holtmaat and Svoboda, 2009; Hübener and Bonhoeffer, 2010). Here we have taken another approach that consists in stimulating morphological changes and then looking at the effects of this manipulation on the plasticity of cortical circuits. Our DiOlistic analysis of spine structure revealed robust changes in spine density and length triggered by CNF1 treatment, in parallel with a reinstatement of physiological plasticity. To examine how the dynamics of spine gain/elimination is altered by CNF1, it would be interesting in future studies to perform longitudinal two-photon in vivo imaging of spines before and after toxin application. Independent of this, the present results provide good evidence on the importance of cytoskeletal changes to functional plasticity in the adult cerebral cortex.
CNF1 treatment increased consistently the density of dendritic spines and the length of the spine neck. We decided to measure spine neck length (Belichenko et al., 2009) rather than length of the whole spine (Wallace and Bear, 2004). This measure may be useful because (1) spine neck length can be considered a good indicator of spine function and synaptic strength (Majewska et al., 2000; Arellano et al., 2007), (2) activation of Rho GTPases could affect spine neck length, without significantly altering the spine head (Tashiro et al., 2000), and (3) measures of spine neck length allow to better capture with one parameter the morphological variability of dendritic spines (from short stubby spines with virtually no neck to spines with small head and long neck; Arellano et al., 2007).
How can Rho GTPase activation reinstate plasticity in adulthood? Rho GTPases play critical roles in activity-dependent plasticity of excitatory synapses by controlling their structural and functional stability (Bonhoeffer and Yuste, 2002; Van Aelst and Cline, 2004). We speculate that the increase in the density of spines could be a crucial factor for the reactivation of plasticity, because this suggests an increase in the number of available postsynaptic sites that could trigger the wiring up of new synapses. Our observation of an increase in the presynaptic excitatory markers vGlut-2 and vGlut-1 and the fact that transgenic mice with constitutively active Rac1 have supernumerary synapses (Luo et al., 1996) is consistent with this possibility.
Interestingly, CNF1-mediated OD shift after MD appeared to be specifically attributable to a potentiation of open-eye responses. This differs from the typical effect of eyelid suture during juvenile age, i.e., a loss of responsiveness of cortical neurons to the closed eye (Frenkel and Bear, 2004; Restani et al., 2009). The potentiation of open-eye inputs was accompanied by an increased density of thalamocortical terminals (vGlut-2-positive puncta) in the visual cortex of CNF1-injected MD rats, indicating a robust rearrangement of axonal terminals in treated animals. These thalamocortical rearrangements were also observed in naive, CNF1-treated rats, a condition in which a shift of OD is not apparent (Fig. 8A). Although we were unable to distinguish eye-specific thalamocortical synapses, one could speculate that, when inputs from the two eyes are balanced (naive animals), CNF1-induced rearrangements involve axonal terminals from both eyes and do not cause an OD shift. Conversely, under MD conditions, open-eye geniculocortical inputs would get a competitive advantage, resulting in the addition of synaptic terminals serving the ipsilateral, nondeprived eye. Therefore, we favor the idea that CNF1 sets in motion a mechanism of activity-dependent takeover, by which newly formed dendritic sites are contacted preferentially by more active afferents from the open eye. Recent studies have indicated a correlation between spine growth/density and response potentiation in the adult cortex (Dahlhaus et al., 2008; Wilbrecht et al., 2010). A link between response potentiation and new spine formation is also confirmed by the evidence that, in adult mouse visual cortex, the functional consequences of adult MD (strengthening of open-eye responses) is accompanied by a net gain of spines (Hofer et al., 2009).
Previous strategies to restore plasticity in adulthood have primarily relied on the manipulation of intracortical GABAergic inhibition (He et al., 2007; Sale et al., 2007; Maya Vetencourt et al., 2008) or on the removal of extracellular inhibitory molecules (Pizzorusso et al., 2002; McGee et al., 2005; Syken et al., 2006). The present data represent, to our knowledge, the first evidence that activation of Rho GTPases is effective in reinstating physiological plasticity in the adult cortex.
In summary, these results indicate a direct link between structural and physiological plasticity of the adult brain and demonstrate a key role for Rho GTPases in these processes. Spine pathology is consistently observed in synaptopathies and mental retardation syndromes (Govek et al., 2004; Holtmaat and Svoboda, 2009), and a net loss of spines is found in neurodegenerative disorders such as Alzheimer's disease (Tsai et al., 2004). The plasticizing effects of Rho GTPase activation may be beneficial in the treatment of these pathologies and as a strategy to promote brain repair after injury.
References
- Antonucci F, Rossi C, Gianfranceschi L, Rossetto O, Caleo M. Long-distance retrograde effects of botulinum neurotoxin A. J Neurosci. 2008;28:3689–3696. doi: 10.1523/JNEUROSCI.0375-08.2008. [DOI] [PMC free article] [PubMed] [Google Scholar]
- Arellano JI, Benavides-Piccione R, Defelipe J, Yuste R. Ultrastructure of dendritic spines: correlation between synaptic and spine morphologies. Front Neurosci. 2007;1:131–143. doi: 10.3389/neuro.01.1.1.010.2007. [DOI] [PMC free article] [PubMed] [Google Scholar]
- Belichenko PV, Wright EE, Belichenko NP, Masliah E, Li HH, Mobley WC, Francke U. Widespread changes in dendritic and axonal morphology in Mecp2-mutant mouse models of Rett syndrome: evidence for disruption of neuronal networks. J Comp Neurol. 2009;514:240–258. doi: 10.1002/cne.22009. [DOI] [PubMed] [Google Scholar]
- Berardi N, Pizzorusso T, Maffei L. Critical periods during sensory development. Curr Opin Neurobiol. 2000;10:138–145. doi: 10.1016/s0959-4388(99)00047-1. [DOI] [PubMed] [Google Scholar]
- Bonhoeffer T, Yuste R. Spine motility. Phenomenology, mechanisms, and function. Neuron. 2002;35:1019–1027. doi: 10.1016/s0896-6273(02)00906-6. [DOI] [PubMed] [Google Scholar]
- Caleo M, Restani L, Gianfranceschi L, Costantin L, Rossi C, Rossetto O, Montecucco C, Maffei L. Transient synaptic silencing of developing striate cortex has persistent effects on visual function and plasticity. J Neurosci. 2007;27:4530–4540. doi: 10.1523/JNEUROSCI.0772-07.2007. [DOI] [PMC free article] [PubMed] [Google Scholar]
- Caleo M, Tropea D, Rossi C, Gianfranceschi L, Maffei L. Environmental enrichment promotes fiber sprouting after deafferentation of the superior colliculus in the adult rat brain. Exp Neurol. 2009;216:515–519. doi: 10.1016/j.expneurol.2008.12.016. [DOI] [PubMed] [Google Scholar]
- Cerri C, Restani L, Caleo M. Callosal contribution to ocular dominance in rat primary visual cortex. Eur J Neurosci. 2010;32:1163–1169. doi: 10.1111/j.1460-9568.2010.07363.x. [DOI] [PubMed] [Google Scholar]
- Chen JL, Nedivi E. Neuronal structural remodeling: is it all about access? Curr Opin Neurobiol. 2010;20:557–562. doi: 10.1016/j.conb.2010.06.002. [DOI] [PMC free article] [PubMed] [Google Scholar]
- Coleman JE, Nahmani M, Gavornik JP, Haslinger R, Heynen AJ, Erisir A, Bear MF. Rapid structural remodeling of thalamocortical synapses parallels experience-dependent functional plasticity in mouse primary visual cortex. J Neurosci. 2010;30:9670–9682. doi: 10.1523/JNEUROSCI.1248-10.2010. [DOI] [PMC free article] [PubMed] [Google Scholar]
- Cotrufo T, Viegi A, Berardi N, Bozzi Y, Mascia L, Maffei L. Effects of neurotrophins on synaptic protein expression in the visual cortex of dark-reared rats. J Neurosci. 2003;23:3566–3571. doi: 10.1523/JNEUROSCI.23-09-03566.2003. [DOI] [PMC free article] [PubMed] [Google Scholar]
- Dahlhaus M, Hermans JM, Van Woerden LH, Saiepour MH, Nakazawa K, Mansvelder HD, Heimel JA, Levelt CN. Notch1 signaling in pyramidal neurons regulates synaptic connectivity and experience-dependent modifications of acuity in the visual cortex. J Neurosci. 2008;28:10794–10802. doi: 10.1523/JNEUROSCI.1348-08.2008. [DOI] [PMC free article] [PubMed] [Google Scholar]
- Diana G, Valentini G, Travaglione S, Falzano L, Pieri M, Zona C, Meschini S, Fabbri A, Fiorentini C. Enhancement of learning and memory after activation of cerebral Rho GTPases. Proc Natl Acad Sci USA. 2007;104:636–641. doi: 10.1073/pnas.0610059104. [DOI] [PMC free article] [PubMed] [Google Scholar]
- Falzano L, Fiorentini C, Boquet P, Donelli G. Interaction of Escherichia coli cytotoxic necrotizing factor type 1 (CNF1) with cultured cells. Cytotechnology. 1993a;11(Suppl 1):S56–S58. [PubMed] [Google Scholar]
- Falzano L, Fiorentini C, Donelli G, Michel E, Kocks C, Cossart P, Cabanié L, Oswald E, Boquet P. Induction of phagocytic behaviour in human epithelial cells by Escherichia coli cytotoxic necrotizing factor type 1. Mol Microbiol. 1993b;9:1247–1254. doi: 10.1111/j.1365-2958.1993.tb01254.x. [DOI] [PubMed] [Google Scholar]
- Flatau G, Lemichez E, Gauthier M, Chardin P, Paris S, Fiorentini C, Boquet P. Toxin-induced activation of the G protein p21 Rho by deamidation of glutamine. Nature. 1997;387:729–733. doi: 10.1038/42743. [DOI] [PubMed] [Google Scholar]
- Fournier AE, Takizawa BT, Strittmatter SM. Rho kinase inhibition enhances axonal regeneration in the injured CNS. J Neurosci. 2003;23:1416–1423. doi: 10.1523/JNEUROSCI.23-04-01416.2003. [DOI] [PMC free article] [PubMed] [Google Scholar]
- Frenkel MY, Bear MF. How monocular deprivation shifts ocular dominance in visual cortex of young mice. Neuron. 2004;44:917–923. doi: 10.1016/j.neuron.2004.12.003. [DOI] [PubMed] [Google Scholar]
- Gan WB, Grutzendler J, Wong WT, Wong RO, Lichtman JW. Multicolor “DiOlistic” labeling of the nervous system using lipophilic dye combinations. Neuron. 2000;27:219–225. doi: 10.1016/s0896-6273(00)00031-3. [DOI] [PubMed] [Google Scholar]
- Govek EE, Newey SE, Akerman CJ, Cross JR, Van der Veken L, Van Aelst L. The X-linked mental retardation protein oligophrenin-1 is required for dendritic spine morphogenesis. Nat Neurosci. 2004;7:364–372. doi: 10.1038/nn1210. [DOI] [PubMed] [Google Scholar]
- Grutzendler J, Kasthuri N, Gan WB. Long-term dendritic spine stability in the adult cortex. Nature. 2002;420:812–816. doi: 10.1038/nature01276. [DOI] [PubMed] [Google Scholar]
- He HY, Ray B, Dennis K, Quinlan EM. Experience-dependent recovery of vision following chronic deprivation amblyopia. Nat Neurosci. 2007;10:1134–1136. doi: 10.1038/nn1965. [DOI] [PubMed] [Google Scholar]
- Hensch TK. Critical period plasticity in local cortical circuits. Nat Rev Neurosci. 2005;6:877–888. doi: 10.1038/nrn1787. [DOI] [PubMed] [Google Scholar]
- Hofer SB, Mrsic-Flogel TD, Bonhoeffer T, Hübener M. Lifelong learning: ocular dominance plasticity in mouse visual cortex. Curr Opin Neurobiol. 2006;16:451–459. doi: 10.1016/j.conb.2006.06.007. [DOI] [PubMed] [Google Scholar]
- Hofer SB, Mrsic-Flogel TD, Bonhoeffer T, Hübener M. Experience leaves a lasting structural trace in cortical circuits. Nature. 2009;457:313–317. doi: 10.1038/nature07487. [DOI] [PMC free article] [PubMed] [Google Scholar]
- Holtmaat A, Svoboda K. Experience-dependent structural synaptic plasticity in the mammalian brain. Nat Rev Neurosci. 2009;10:647–658. doi: 10.1038/nrn2699. [DOI] [PubMed] [Google Scholar]
- Hubel DH, Wiesel TN. Receptive fields, binocular interaction and functional architecture in the cat's visual cortex. J Physiol. 1962;160:106–154. doi: 10.1113/jphysiol.1962.sp006837. [DOI] [PMC free article] [PubMed] [Google Scholar]
- Hübener M, Bonhoeffer T. Searching for engrams. Neuron. 2010;67:363–371. doi: 10.1016/j.neuron.2010.06.033. [DOI] [PubMed] [Google Scholar]
- Keck T, Mrsic-Flogel TD, Vaz Afonso M, Eysel UT, Bonhoeffer T, Hübener M. Massive restructuring of neuronal circuits during functional reorganization of adult visual cortex. Nat Neurosci. 2008;11:1162–1167. doi: 10.1038/nn.2181. [DOI] [PubMed] [Google Scholar]
- Lehmann K, Löwel S. Age-dependent ocular dominance plasticity in adult mice. PLoS One. 2008;3:e3120. doi: 10.1371/journal.pone.0003120. [DOI] [PMC free article] [PubMed] [Google Scholar]
- Luo L, Hensch TK, Ackerman L, Barbel S, Jan LY, Jan YN. Differential effects of the Rac GTPase on Purkinje cell axons and dendritic trunks and spines. Nature. 1996;379:837–840. doi: 10.1038/379837a0. [DOI] [PubMed] [Google Scholar]
- Mainardi M, Landi S, Gianfranceschi L, Baldini S, De Pasquale R, Berardi N, Maffei L, Caleo M. Environmental enrichment potentiates thalamocortical transmission and plasticity in the adult rat visual cortex. J Neurosci Res. 2010;88:3048–3059. doi: 10.1002/jnr.22461. [DOI] [PubMed] [Google Scholar]
- Majewska A, Brown E, Ross J, Yuste R. Mechanisms of calcium decay kinetics in hippocampal spines: role of spine calcium pumps and calcium diffusion through the spine neck in biochemical compartmentalization. J Neurosci. 2000;20:1722–1734. doi: 10.1523/JNEUROSCI.20-05-01722.2000. [DOI] [PMC free article] [PubMed] [Google Scholar]
- Majewska AK, Newton JR, Sur M. Remodeling of synaptic structure in sensory cortical areas in vivo. J Neurosci. 2006;26:3021–3029. doi: 10.1523/JNEUROSCI.4454-05.2006. [DOI] [PMC free article] [PubMed] [Google Scholar]
- Mataga N, Mizuguchi Y, Hensch TK. Experience-dependent pruning of dendritic spines in visual cortex by tissue plasminogen activator. Neuron. 2004;44:1031–1041. doi: 10.1016/j.neuron.2004.11.028. [DOI] [PubMed] [Google Scholar]
- Maya Vetencourt JF, Sale A, Viegi A, Baroncelli L, De Pasquale R, O'Leary OF, Castrén E, Maffei L. The antidepressant fluoxetine restores plasticity in the adult visual cortex. Science. 2008;320:385–388. doi: 10.1126/science.1150516. [DOI] [PubMed] [Google Scholar]
- McGee AW, Yang Y, Fischer QS, Daw NW, Strittmatter SM. Experience-driven plasticity of visual cortex limited by myelin and Nogo receptor. Science. 2005;309:2222–2226. doi: 10.1126/science.1114362. [DOI] [PMC free article] [PubMed] [Google Scholar]
- Montenegro-Venegas C, Tortosa E, Rosso S, Peretti D, Bollati F, Bisbal M, Jausoro I, Avila J, Cáceres A, Gonzalez-Billault C. MAP1B regulates axonal development by modulating Rho-GTPase Rac1 activity. Mol Biol Cell. 2010;21:3518–3528. doi: 10.1091/mbc.E09-08-0709. [DOI] [PMC free article] [PubMed] [Google Scholar]
- Morishita H, Hensch TK. Critical period revisited: impact on vision. Curr Opin Neurobiol. 2008;18:101–107. doi: 10.1016/j.conb.2008.05.009. [DOI] [PubMed] [Google Scholar]
- Pavone F, Luvisetto S, Marinelli S, Straface E, Fabbri A, Falzano L, Fiorentini C, Malorni W. The Rac GTPase-activating bacterial protein toxin CNF1 induces analgesia up-regulating mu-opioid receptors. Pain. 2009;145:219–229. doi: 10.1016/j.pain.2009.06.026. [DOI] [PubMed] [Google Scholar]
- Pizzorusso T, Medini P, Berardi N, Chierzi S, Fawcett JW, Maffei L. Reactivation of ocular dominance plasticity in the adult visual cortex. Science. 2002;298:1248–1251. doi: 10.1126/science.1072699. [DOI] [PubMed] [Google Scholar]
- Pizzorusso T, Medini P, Landi S, Baldini S, Berardi N, Maffei L. Structural and functional recovery from early monocular deprivation in adult rats. Proc Natl Acad Sci USA. 2006;103:8517–8522. doi: 10.1073/pnas.0602657103. [DOI] [PMC free article] [PubMed] [Google Scholar]
- Restani L, Cerri C, Pietrasanta M, Gianfranceschi L, Maffei L, Caleo M. Functional masking of deprived eye responses by callosal input during ocular dominance plasticity. Neuron. 2009;64:707–718. doi: 10.1016/j.neuron.2009.10.019. [DOI] [PubMed] [Google Scholar]
- Rittenhouse CD, Shouval HZ, Paradiso MA, Bear MF. Monocular deprivation induces homosynaptic long-term depression in visual cortex. Nature. 1999;397:347–350. doi: 10.1038/16922. [DOI] [PubMed] [Google Scholar]
- Sale A, Maya Vetencourt JF, Medini P, Cenni MC, Baroncelli L, De Pasquale R, Maffei L. Environmental enrichment in adulthood promotes amblyopia recovery through a reduction of intracortical inhibition. Nat Neurosci. 2007;10:679–681. doi: 10.1038/nn1899. [DOI] [PubMed] [Google Scholar]
- Sato M, Stryker MP. Distinctive features of adult ocular dominance plasticity. J Neurosci. 2008;28:10278–10286. doi: 10.1523/JNEUROSCI.2451-08.2008. [DOI] [PMC free article] [PubMed] [Google Scholar]
- Schmidt G, Sehr P, Wilm M, Selzer J, Mann M, Aktories K. Gln 63 of Rho is deamidated by Escherichia coli cytotoxic necrotizing factor-1. Nature. 1997;387:725–729. doi: 10.1038/42735. [DOI] [PubMed] [Google Scholar]
- Schmidt G, Selzer J, Lerm M, Aktories K. The Rho-deamidating cytotoxic necrotizing factor 1 from Escherichia coli possesses transglutaminase activity. Cysteine 866 and histidine 881 are essential for enzyme activity. J Biol Chem. 1998;273:13669–13674. doi: 10.1074/jbc.273.22.13669. [DOI] [PubMed] [Google Scholar]
- Sin WC, Haas K, Ruthazer ES, Cline HT. Dendrite growth increased by visual activity requires NMDA receptor and Rho GTPases. Nature. 2002;419:475–480. doi: 10.1038/nature00987. [DOI] [PubMed] [Google Scholar]
- Syken J, Grandpre T, Kanold PO, Shatz CJ. PirB restricts ocular-dominance plasticity in visual cortex. Science. 2006;313:1795–1800. doi: 10.1126/science.1128232. [DOI] [PubMed] [Google Scholar]
- Tahirovic S, Hellal F, Neukirchen D, Hindges R, Garvalov BK, Flynn KC, Stradal TE, Chrostek-Grashoff A, Brakebusch C, Bradke F. Rac1 regulates neuronal polarization through the WAVE complex. J Neurosci. 2010;30:6930–6943. doi: 10.1523/JNEUROSCI.5395-09.2010. [DOI] [PMC free article] [PubMed] [Google Scholar]
- Tashiro A, Minden A, Yuste R. Regulation of dendritic spine morphology by the rho family of small GTPases: antagonistic roles of Rac and Rho. Cereb Cortex. 2000;10:927–938. doi: 10.1093/cercor/10.10.927. [DOI] [PubMed] [Google Scholar]
- Tropea D, Caleo M, Maffei L. Synergistic effects of brain-derived neurotrophic factor and chondroitinase ABC on retinal fiber sprouting after denervation of the superior colliculus in adult rats. J Neurosci. 2003;23:7034–7044. doi: 10.1523/JNEUROSCI.23-18-07034.2003. [DOI] [PMC free article] [PubMed] [Google Scholar]
- Tropea D, Van Wart A, Sur M. Molecular mechanisms of experience-dependent plasticity in visual cortex. Philos Trans R Soc Lond B Biol Sci. 2009;364:341–355. doi: 10.1098/rstb.2008.0269. [DOI] [PMC free article] [PubMed] [Google Scholar]
- Tsai J, Grutzendler J, Duff K, Gan WB. Fibrillar amyloid deposition leads to local synaptic abnormalities and breakage of neuronal branches. Nat Neurosci. 2004;7:1181–1183. doi: 10.1038/nn1335. [DOI] [PubMed] [Google Scholar]
- Van Aelst L, Cline HT. Rho GTPases and activity-dependent dendrite development. Curr Opin Neurobiol. 2004;14:297–304. doi: 10.1016/j.conb.2004.05.012. [DOI] [PubMed] [Google Scholar]
- Wallace W, Bear MF. A morphological correlate of synaptic scaling in visual cortex. J Neurosci. 2004;24:6928–6938. doi: 10.1523/JNEUROSCI.1110-04.2004. [DOI] [PMC free article] [PubMed] [Google Scholar]
- Wilbrecht L, Holtmaat A, Wright N, Fox K, Svoboda K. Structural plasticity underlies experience-dependent functional plasticity of cortical circuits. J Neurosci. 2010;30:4927–4932. doi: 10.1523/JNEUROSCI.6403-09.2010. [DOI] [PMC free article] [PubMed] [Google Scholar]