

Abstract
Multiple sclerosis is a demyelinating disease that affects ∼2,000,000 people worldwide. In the advanced stages of the disease, endogenous oligodendrocyte precursors cannot colonize the lesions or differentiate into myelinating oligodendrocytes. During development, both FGF-2 and Anosmin-1 participate in oligodendrocyte precursor cell migration, acting via the FGF receptor 1 (FGFR1). Hence, we performed a histopathological and molecular analysis of these developmental modulators in postmortem tissue blocks from multiple sclerosis patients. Accordingly, we demonstrate that the distribution of FGF-2 and Anosmin-1 varies between the different types of multiple sclerosis lesions: FGF-2 is expressed only within active lesions and in the periplaque of chronic lesions, whereas Anosmin-1 is upregulated within chronic lesions and is totally absent in active lesions. We show that the endogenous oligodendrocyte precursor cells recruited toward chronic-active lesions express FGFR1, possibly in response to the FGF-2 produced by microglial cells in the periplaque. Also in human tissue, FGF-2 is upregulated in perivascular astrocytes in regions of the normal-appearing gray matter, where the integrity of the blood–brain barrier is compromised. In culture, FGF-2 and Anosmin-1 influence adult mouse oligodendrocyte precursor cell migration in the same manner as at embryonic stages, providing an explanation for the histopathological observations: FGF-2 attracts/enhances its migration, which is hindered by Anosmin-1. We propose that FGF-2 and Anosmin-1 are markers for the histopathological type and the level of inflammation of multiple sclerosis lesions, and that they may serve as novel pharmacogenetic targets to design future therapies that favor effective remyelination and protect the blood–brain barrier.
Introduction
Multiple sclerosis (MS) is a demyelinating disease of the CNS and a major cause of neurological disability among young adults. The symptoms of this disease are the consequence of newly formed CNS lesions and the expansion of older ones. Neuropathology of MS includes blood cell infiltration within the white matter, formation of demyelinating areas due to oligodendrocyte loss, and axonal degeneration (Noseworthy et al., 2000; Compston and Coles, 2008; Henderson et al., 2009). Currently available treatments for MS rely on immunomodulators but do not favor the issue of lesion remyelination (Steinman, 2005; Compston and Coles, 2008; Martínez-Forero et al., 2008).
Once generated, oligodendrocyte precursor cells (OPCs) migrate and give rise to mature oligodendrocytes on receiving the appropriate developmental signals (de Castro and Bribián, 2005). One of the main mitogens for OPCs is FGF-2, which also acts as a motogenic or chemokinetic and chemotropic factor, in both cases acting via FGF receptor 1 (FGFR1) (Bögler et al., 1990; McKinnon et al., 1990; Goddard et al., 1999, 2001; Bribián et al., 2006). Thus, FGF-2 could be involved in oligodendrocyte responses during demyelination and remyelination, although the effects exerted by this growth factor have proven to be controversial (Ruffini et al., 2001; Butt and Dinsdale, 2005). Indeed, the most recent study suggests that FGF-2 has a neuroprotective/regenerative effect on oligodendroglia (Rottlaender et al., 2011).
Anosmin-1 is an extracellular matrix protein that influences the migration of gonadotropin-releasing hormone-producing neurons (Cariboni et al., 2004), neuronal precursors (García-González et al., 2010), and OPCs (Bribián et al., 2006, 2008). In the latter, Anosmin-1 inhibits the motogenic effect of FGF-2, via FGFR1 (Bribián et al., 2006), and promotes the adhesion of these cells by an FGF-2-independent mechanism (Bribián et al., 2006, 2008). Anosmin-1 interacts with FGFR1, and different components of the extracellular matrix, including Anosmin-1 itself (Murcia-Belmonte et al., 2010). During optic nerve development, Anosmin-1 is expressed by OPCs and optic axons, and inactivation of this protein reduces their adhesiveness to different substrates, including Anosmin-1 (Bribián et al., 2008). Indeed, Anosmin-1 is misexpressed in the X-linked Kallmann syndrome, wherein some alterations in myelinated commissures and tracts containing numerous Anosmin-1+ oligodendrocytes have been described (Krams et al., 1997; Mayston et al., 1997; Farmer et al., 2004; Clemente et al., 2008). Thus, these data point to Anosmin-1 as a potentially important factor in oligodendroglial biology during the onset of MS.
The present study fills the histopathological gap regarding identity of FGF-2+/FGFR1+/Anosmin-1+ cells in MS tissue. Moreover, we establish a direct correlation between the expression pattern of these molecules in MS patients with the histopathological characteristics of the demyelinated plaques and the blood–brain barrier (BBB) integrity within the normal-appearing gray matter (NAGM). We corroborate that FGF-2/Anosmin-1 exert similar effects on adult OPCs as during development. In agreement with that, the recruited OPC population within areas of remyelination mainly expressed FGFR1. Our data suggest that FGF-2/Anosmin-1 would be important actors in the pathogenesis of MS and putative objectives for future therapeutic approaches (including remyelination).
Materials and Methods
Human samples.
Postmortem cortical and periventricular brain tissue blocks (ranging from 8.55 to 21.94 cm3) from 10 human MS patients and 5 human controls, of either sex and with no history of neuropsychiatric disease, were analyzed (Table 1). To obtain the blocks, the UK Multiple Sclerosis Tissue Bank proceeds as follows: alternate coronal slices or cerebral hemispheres are placed in 4% paraformaldehyde fixative for ∼2 weeks and then blocked. Individual blocks were cryoprotected in 30% sucrose for ∼1 week and frozen by immersing in isopentane precooled on a bed of dry ice. All the cortical blocks contained both gray and white matter. The UK Multiple Sclerosis Tissue Bank randomly provided us with at least four different blocks from the cerebral cortex with white matter lesions, and two with normal-appearing white matter (NAWM) for each MS patient, and two cortical blocks from each selected control patient. No demyelinated lesions were detected within the gray matter in any of the blocks analyzed. Brain samples were cut into microtome sections (50 μm; Microm) for immunohistochemical analysis.
Table 1.
Summary of the samples analyzed for this study
| Patient | Age (years)/sex | Diagnostic | TP (h) | Disease duration (years) | Number of MS lesions | Lesion activitya |
|||
|---|---|---|---|---|---|---|---|---|---|
| Active | Shadow plaques | Chronic active | Chronic inactive | ||||||
| MS40 | 58/F | PP | 6 | 21 | 8 | 4 | 1 | 3 | |
| MS46 | 40/M | SP | 18 | 23 | 10 | 6 | 1 | 2 | 1 |
| MS47 | 66/F | SP | 17 | 34 | 13 | 3 | 5 | 5 | |
| MS60 | 55/M | SP | 16 | 43 | 8 | 3 | 3 | 1 | 1 |
| MS94 | 42/F | PP | 11 | 6 | 9 | 4 | 3 | 2 | |
| MS100 | 46/M | SP | 7 | 8 | 12 | 1 | 3 | 5 | 3 |
| MS106 | 39/F | SP | 18 | 21 | 8 | 2 | 1 | 5 | |
| MS125 | 76/F | SP | 13 | 30 | 5 | 1 | 1 | 3 | |
| MS149 | 82/F | SP | 15 | 45 | 7 | 2 | 1 | 3 | 1 |
| MS342 | 35/F | SP | 9 | 5 | 8 | 6 | 2 | ||
| CO02 | 85/M | Normal | 12 | ||||||
| CO08 | 93/F | Normal | 9 | ||||||
| CO25 | 35/M | Normal | 22 | ||||||
| CO30 | 75/M | Normal | 17 | ||||||
| CO41 | 54/M | Normal | 20 | ||||||
Ct, Control; F, female; M, male; MS, multiple sclerosis; PP, primary progressive; SP, secondary progressive; TP, time postmortem.
aClassification criteria described in Results. No gray matter lesions were detected.
Western blots.
Total proteins were extracted from the sum of two (for controls) or four (for MS patients) different fixed frozen postmortem cortical sections (one from each block; with checked white matter lesions in the case of MS patients) using Qproteome FFPE tissue kit (Qiagen), following manufacturer's instructions. Protein concentrations were determined by the BCA method (ThermoScientific). Samples equivalent to 100 μg of total protein were resuspended in sample buffer (Sigma) for protein gel electrophoresis and subsequently transferred to nylon membranes. After 1 h of blocking, membranes were allowed to react overnight at 4°C with primary goat anti-FGF-2 polyclonal antibody (1:200; SCBT) or anti-α-tubulin monoclonal antibody (1:30,000; Sigma). Blots were incubated with either biotinylated (for FGF-2; 1:5000; Vector Laboratories) or HRP-conjugated (for α-tubulin; 1:10,000; Sigma) secondary antibodies, as appropriate. The standard ABC method was followed for amplification of FGF-2 signal, which was then visualized using Pierce ECL Western blotting substrate (ThermoScientific).
For quantitative analysis, densitometry was performed on scanned images of the immunostained blots using ImageJ software. The mean gray value and the area for each band were measured. After subtraction of the background values, mean gray values were multiplied by band area to obtain an estimate of the total stained area. Band values were normalized to α-tubulin and the initial tissue amount (grams of wet weight).
Immunohistochemistry.
After several rinses with PB, sections were mounted in gelatin-coated slides and air dried at 37°C overnight. Immunohistochemical procedures were performed as previously described (Clemente et al., 2008) with the following modifications: a prior antigen retrieval (0.1 m acetate buffer, pH 6.0, for 10 min at 95°C) and a final treatment to avoid autofluorescence (Schnell et al., 1999) were included. After 1 h of preincubation, tissues were incubated for immunohistochemistry (IHC) or immunohistofluorescence (IHF) with the following primary antibodies: mouse anti-β-III-Tubulin (1:500; Millipore); mouse anti-CD3 (1:50 for IHC; Dako); mouse anti-CD68 (1:100 for IHF; Dako); goat anti-FGF-2 (1:200 for IHC and IHF; Santa Cruz Biotechnology); rabbit anti-FGF-2 (1:250 for IHC and IHF; Santa Cruz Biotechnology); goat anti-FGFR1 (1:250 for IHC and IHF; Santa Cruz Biotechnology); rabbit anti-FGFR1 (1:1000 for IHC, 1:500 for IHF; Abcam); mouse anti-GFAP (1:500 for IHF; Millipore Bioscience Research Reagents); mouse anti-human leukocyte antigen (HLA)-DR (1:200 for IHC, 1:100 for IHF; Dako); rabbit anti-KAL1 (1:500 for IHC, 1:250 for IHF; Orbigen); rabbit anti-PDGF receptor α (PDGFRα) (1:200 for IHF; Santa Cruz Biotechnology); and rabbit anti-zonula occludens-1 (ZO-1) (1:100 for IHF; Invitrogen). Appropriate fluorescent-tagged (1:1000, Invitrogen; 1:200, The Jackson Laboratories) or biotinylated (1:200; Vector Laboratories) secondary antibodies were used. The reaction was detected using Vectastain Elite ABC reagent (Vector Laboratories). Renaissance TSA Biotin System Kit (PerkinElmer) together with Texas Red-conjugated Streptavidine (1:200; The Jackson Laboratories) were used for FGF-2, FGFR1, and Anosmin-1 detection. The fluorescent Hoechst stain (Sigma) was used to label the cell nucleus. Eriochrome cyanine (Sigma) was usedto stain myelin. To measure ZO-1 staining intensity, fluorescence photomicrographs of the gray matter of controls and the NAGM of MS patients were captured with a confocal microscope (SP5; Leica), and fluorescence intensity of the blood vessel was quantified using ImageJ software.
The total number of cells of interest was obtained by manually counting the PDGFRα+ cells under a confocal microscope, both alone or in combination with cells expressing FGFR1 in the chronic-active lesions (n = 9) of the following patients: MS40, MS46, MS106, and MS125. The cells counted were those in the plaque (the demyelinated part of the lesion with a low density of cell bodies), the periplaque (the area surrounding the plaque where remyelination occurs and with a much higher cell density than in either the plaque or the NAWM), and the adjacent NAWM (a portion of white matter close to the periplaque with no signs of demyelination/remyelination and with a cell density similar to the rest of the white matter). Several pictures were taken at different levels of each region to avoid repetitive cell counts. The total number of cells was considered in relation to the area of the picture measured using ImageJ software. The percentage of Anosmin-1+ axons with respect to the total number of β-III-tubulin+ axons was quantified by counting them in different levels of several pictures of the plaques of chronic-active lesions.
Cell culture.
To isolate adult OPCs, the cerebral cortex of P60 CD1 female mice was dissected out and enzymatically dissociated in a solution containing papain (0.9 mg/ml; Worthington Biochemical), l-cysteine (0.2 mg/ml; Sigma), and EDTA (0.2 mg/ml; Sigma) diluted in HBSS (Invitrogen) during 5 min, at 37°C. Digested tissue was filtered through a 100 μm cell nylon strainer (BD Biosciences) and seeded on polyornithine-treated flasks in DMEM medium complemented with 10% fetal bovine serum (FBS; BioWhittaker) and 1% penicillin-streptomycin (Invitrogen). The culture medium was changed the next day, and 10 ng/ml human PDGFα (Millipore) was added. When cultures reached confluence, cells were shaken overnight at 300 rpm at 37°C. Medium was filtered through 40 μm filters and centrifuged at 900 rpm. Then, cells were seeded twice (45 min each) in uncoated Petri dishes to eliminate microglial cells. After a new centrifugation at 900 rpm, the number of cells was calculated and seeded. After OPC isolation, the average cell yield was 108,642 ± 8,669 cells/mg fresh tissue. To check their OPC nature, immunocytochemistry against A2B5/olig2 (mouse anti-A2B5; 1:10, ATCC; CRL-1520, Hybridoma Bank; rabbit anti-olig2, 1:250, Millipore) and PDGFRα/NG2 (goat anti-PDGFRα, 1:100, R&D Systems; rabbit anti-NG2, 1:100, a generous gift from Dr. W. Stallcup, Sanford-Burnham Medical Research Institute, Cancer Center, La Jolla, CA) were performed. Only those cultures with at least 95% purity of PDGFRα+/NG2+ or A2B5+/olig2+ OPCs were used for the migratory analysis.
Astrocyte cultures were prepared from P1–P3 CD1 mice of either sex using an adapted protocol (Docagne et al., 2007). Before the cell dissociation, the deepest part of the cerebral cortex was dissected out and discarded to avoid the presence of white matter astrocytes. Dissociated cortical cells were cultured in multiwell dishes coated with poly-l-lysine using a media stock (DMEM, containing 25 mm glucose, Invitrogen) supplemented with 5% horse serum, 5% FBS, and 2 mm glutamine. After the astrocyte cultures reached confluence, they were maintained for 24 h in serum-free DMEM containing murine IL-1β (20 ng/ml), TNF-α (5 ng/ml), or both (Peprotech).
Chemotaxis assay.
Two CHO lines, CHO wild-type control cells (CHO-CT) and CHO cells expressing the C-terminal myc-tagged, full-length Anosmin-1 (CHO-A1), were used to prepare extracellular matrix protein extracts following a modified protocol that has been described previously (Soussi-Yanicostas et al., 1996). Briefly, the cells were washed once with calcium/magnesium-free HBSS and then incubated with gentle rocking for 30 min at 4°C in 1 ml per culture dish (10 cm in diameter) of 20 mm phosphate buffer, pH 7.4, containing 350 mm NaCl and complete EDTA free protease inhibitor (Roche). The extracellular matrix proteins released into the buffer were concentrated 10 times with Amicon Ultra-4 Ultracel-30k (Millipore) and used in the chemotaxis experiments.
The migration of adult OPCs was studied in chemotaxis chambers with polycarbonate membranes (pore size: 8 μm, Costar, Corning). The membranes were coated as described previously (Merchán et al., 2007; Murcia-Belmonte et al., 2010) and 4 × 10⁴ adult OPCs were seeded in the upper chamber in BS medium and different experimental conditions in the lower chamber as follows: (1) CHO-CT extract; (2) CHO-CT extract with FGF-2 (20 ng/ml; R&D Systems); (3) CHO-A1 extract; or (4) CHO-A1 extract with FGF-2 (20 ng/ml; R&D Systems). To block FGFRs, the adult OPCs were treated during the experiment with the FGFR blocker SU5402 (10 μm; Calbiochem) as indicated, and the rest of the cultures were exposed to an equal volume of the vehicle dimethylsulfoxide (Sigma). After 20 h at 37°C, nonmigratory cells on the upper membrane surface were removed with a cotton swab and the migratory cells on the lower membrane surface were fixed for 15 min with 4% PFA at room temperature. For quantitative analysis, the number of A2B5+/Olig-2+ migrating cells (see above) was scored under an epifluorescence microscope (DM5000B, Leica) using a 20× objective, and 10 random fields/well were analyzed in three independent experiments, each involving three transwells per experimental condition.
Quantitative reverse transcription-PCR analysis.
Total RNA from control or treated astrocytes was retrotranscribed into cDNA using the High Capacity cDNA Reverse Transcription kit (Applied Biosystems). Taqman gene expression assays used for fgf-2 and fgfr1 expression were Mm00433287_m1 and Mm01215488_m1, respectively, using mouse GAPDH gene transcript as endogenous control. Relative mRNA levels for both were determined using the comparative threshold cycle method and were normalized to mRNA levels of GAPDH. Results are expressed as the fold increase in the relative level of gene expression for the replicate group associated with the test sample.
Statistics.
The data were expressed as the mean ± SEM. and were analyzed with SigmaStat (SPSS). Student's t test, ANOVA, or their corresponding on-rank tests was used for comparative analyses. The Pearson's product moment test was used for correlation analysis. Minimal statistical significance was fixed at p < 0.05, and the results were represented as follows: *p < 0.05; **p < 0.01; ***p < 0.001.
Results
Classification of MS plaques
In the cerebral cortex tissue blocks, all lesions were circumscribed to the white matter, and there were no signs of demyelination in the gray matter. Plaques present in brain tissue samples from 10 human MS patients were classified (Table 1) according to previously described methods (Trapp et al., 1999; Chang et al., 2002, 2008; Benito et al., 2007; Koning et al., 2007; Breij et al., 2008; Young et al., 2008). Active plaques exhibited, among other characteristics, abundant and evenly distributed HLA-DR+ cells (mostly large, round, and lipid-laden macrophages), clear signs of remyelination (faint eriochrome cyanine staining and the presence of OPCs), parenchymal and perivascular lymphocytic cells, and swollen astrocytes. If phagocytes contained myelin protein debris, the plaques were considered even more recent. Moreover, pre-phagocytic areas presented a high density of HLA-DR+ ramified microglial cells intermingled with a few (if any) irregularly distributed macrophages. Shadow plaques presented a low density of HLA-DR+ cells with resting microglia, well defined edges, and an incomplete remyelination (a low intensity of eriochrome cyanine staining compared with the surrounding NAWM). Conversely, chronic-active plaques were clearly characterized by a lower cellular density in the core of the lesion but an enrichment of HLA-DR+ lipid-laden macrophages, perivascular and/or parenchymal lymphocytic cells, and an accumulation of OPCs at the border (where remyelination is evident). Chronic-inactive (also referred to as chronic-silent) lesions contained very few HLA-DR+ cells, had a clear sharp edge, and showed no signs of remyelination in both the core and the border. Following these criteria, 30 plaques were identified as active, 15 as shadow, 23 as chronic-active, and 18 as chronic-inactive (Table 1). In addition, in white matter from controls and in the NAWM from MS patients, none of the aforementioned features were observed (data not shown).
FGF-2 is differentially upregulated in MS patients
Differences in the protein levels of FGF-2 have been reported in the CSF of MS patients (Su et al., 2006; Sarchielli et al., 2008). However, the distribution of this factor in MS tissue has not yet been studied, either in the different types of MS plaques or in the cells that might secrete it. In Western blots of cerebral cortex tissue sections from both groups, containing both gray and white matter (with lesions only present in the latter), there was significantly more FGF-2 in MS patients than in controls (7.10 ± 2.02-fold increase vs control; p < 0.05) (Fig. 1A). However, there was no correlation between the signal intensity in the Western blots and the following parameters: age (r = 0,474; p = 0.166); postmortem delay (r = 0.210; p = 0.561); disease duration (r = 0.308; p = 0.387); total number of MS lesions (r = −0.288; p = 0.420); number of active lesions (r = −0.229; p = 0.525); number of chronic-active lesions (r = 0.406; p = 0.244); number of chronic-inactive lesions (r = −0.294; p = 0.410); number of chronic-active plus chronic-inactive lesions (r = −0.206; p = 0.568); or the percentage of each type of MS lesions with respect to the total number of MS lesions (percentage of active lesions: r = −0,213; p = 0.554; percentage of chronic-active lesions: r = 0.523; p = 0.121; percentage of chronic-inactive lesions: r = −0.318; p = 0.371; and percentage of chronic-active plus chronic-inactive lesions: r = 0.170; p = 0.638). We performed the histopathological analysis of both the gray and white matters of the cerebral cortex sections from the same controls and MS patients to assign this FGF-2 expression to specific cell types.
Figure 1.
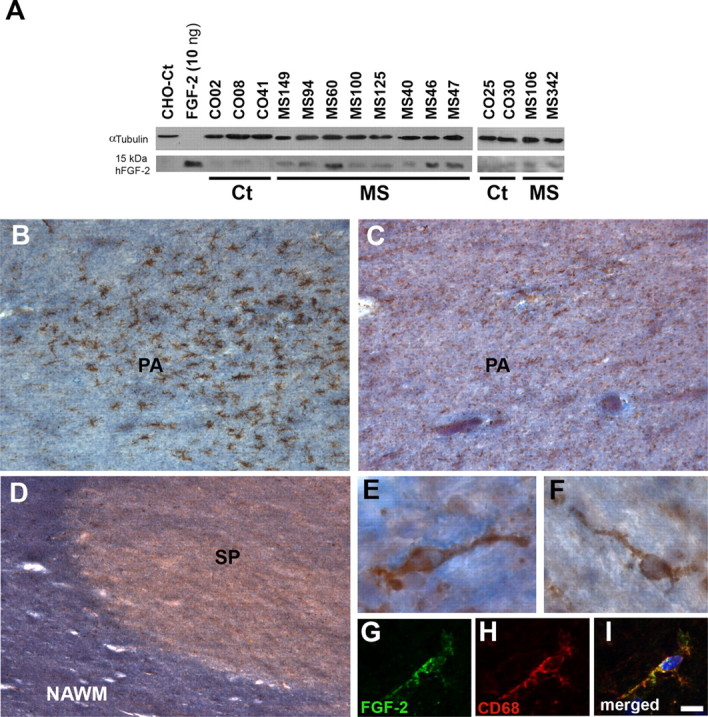
FGF-2 is overexpressed in the tissue of MS patients but not in all types of MS lesions. A, Western blot analysis was performed using an FGF-2 polyclonal antibody on cerebral cortex protein extracts (100 μg of total protein each) from control (Ct) and MS patients. α-Tubulin was used as a loading control. B, C, Panoramic views of a pre-phagocytic area (PA) labeled with HLA-DR (B, brown staining), which presented a group of activated microglial cells with no signs of cell infiltration, and FGF-2 (C, brown staining) and the myelin staining eriochrome cyanine (B, C, blue staining). D, General view of a portion of one shadow plaque (SP). The density of FGF-2+ cells (brown staining) is similar in the shadow plaque to that in the adjacent NAWM. E, F, Examples of FGF-2+ cells (with the morphology of resting microglia) from a pre-phagocytic area (E) or within a shadow plaque (F). G–I, FGF-2+ cells within the shadow plaque are also positive for the macrophage/microglial marker CD68. Scale bars: B–D, 200 μm; E, F, 10 μm; G–I, 12 μm. B, C, and E are from case MS125; D and F–I are from case MS60.
In the white matter, whereas in controls FGF-2 was immunodetected in the rare microglial cells (data not shown), in very early lesions (pre-phagocytic areas) FGF-2 was observed in a few activated microglial cells (Fig. 1B,C,E). In contrast, shadow plaques presented a much lower density of FGF-2+ resting microglial cells (Fig. 1D,F–I). In active lesions, FGF-2+ macrophages at a high density were found to be evenly distributed within the lesion (Fig. 2A,B,D–F). The FGF-2+ cells observed in the lesion border presented intermediate characteristics between macrophages and microglial cells: hypertrophied well vacuolated cell bodies with a few processes of different lengths and thicknesses (Fig. 2C,G–I). In chronic-active and chronic-inactive plaques of the white matter, FGF-2+ cells were exclusively detected in the periplaque, most of them showing macrophagic and/or activated microglial morphologies (Fig. 2J–R). Together, these data showed that FGF-2 is mainly observed in activated microglial/macrophages in those areas where remyelination is possible. At the end of the remyelinating process (shadow plaques), FGF-2+ cells are less abundant.
Figure 2.

Expression pattern of FGF-2 in active and chronic-active lesions. A, Panoramic view of an active lesion with many FGF-2+ infiltrates. B, High-magnification image showing several FGF-2+ cells with macrophage morphology from the core of an active lesion. C, In the border of the same lesion, FGF-2+ cells showed intermediate shapes between macrophage and activated microglia. D–I, Double labeling with the inflammatory marker HLA-DR and the microglia/macrophage marker CD68 of both cell types, within the core (D–F) and at the border (G–I) of an active lesion. J, General view of a chronic-active lesion where a higher density of FGF-2+ cells was detected within the demyelinating area (periplaque) than in the adjacent NAWM. In contrast, no FGF-2 immunoreactivity was detected within the demyelinated plaque itself. K–L, High-magnification images of two of the FGF-2+ cells observed in the periplaque of a chronic-active lesion showing a well vacuolated cytoplasm and several processes. M–R, Examples of FGF-2+ cells (M, P) double labeled with HLA-DR (N, O) or the microglia/macrophage marker CD68 (Q, R). Scale bars: A, 120 μm; B, C, M–O, 7 μm; D–F, 6 μm; G–I, 8 μm; J, 100 μm; K–L, P–R, 10 μm. A–I are from case MS249; J–R are from case MS106.
The gray matter of the same sections from the cerebral cortex of controls was devoid of FGF-2 staining, except for a few microglial cells (data not shown). Although no demyelinated areas were observed within the gray matter, a subpopulation of perivascular astrocytes contacting blood vessels expressed FGF-2 in MS patients (Fig. 3A–F), in addition to the sparsely distributed microglial cells (data not shown). These cells were observed in the gray matter of all the cortical blocks analyzed, either those with demyelinated plaques within the white matter (data not shown) or those without them (Fig. 3A,B). The gray matter of blocks from the cerebral cortex of controls, where FGF-2+ astrocytes were absent, showed an unaltered ZO-1 profile (Fig. 3G–I), an indicator of BBB-associated tight junction integrity in MS (Kirk et al., 2003; Padden et al., 2007). In contrast, FGF-2+ perivascular astrocytes were invariably associated with a slightly discontinuous tight junction profile (Fig. 3J–L). The quantification of ZO-1 staining showed that MS patients presented a 3.52 ± 0.647-fold decrease (p < 0.001) in ZO-1 labeling than controls. Therefore, tight junction integrity in the gray matter, and consequently that in the BBB, was disturbed in MS patients.
Figure 3.

Perivascular astrocytes overexpress FGF-2 in the cerebral cortex of MS patients. A, B, Parallel sections of the same region of a block from one MS patient where a general upregulation of FGF-2 in perivascular astrocytes (A, arrows) was restricted to the NAGM area with no signs of demyelination in the contiguous NAWM (B). C, Detailed view of two FGF-2+ cells, one in contact with a blood vessel (black arrow). D–F, Double labeling (white arrows) of FGF-2 (D) and GFAP, a marker for astrocytes (E), which confirms their coexpression (F). G–I, In gray matter of controls, where FGF-2-immunoreactive astrocytes were absent (G), a continuous linear ZO-1 immunoreactivity could be seen (H–I). J, L, Association of FGF-2+ perivascular astrocytes within the NAGM of a MS patient with a blood vessel contacting process (J, L, arrow). K, L, ZO-1 immunoreactivity displayed a continuous but more diffuse expression pattern in the NAGM of MS patients. EC, Eriochrome cyanine. Scale bars: A, B, 800 μm; C, 25 μm; D–F, 10 μm; G–L, 15 μm. A, B, and J–L are from case MS125; C–F are from case MS106; G–I are from case CO41.
Anosmin-1 is upregulated in chronic-active and chronic-inactive plaques
Anosmin-1 was not detectable in the brain of control cases either in the gray or in the white matter (data not shown). While Anosmin-1 immunolabeling was also absent from active and shadow plaques in the white matter of MS patients (Fig. 4A,D), it was clearly observed as a typical extracellular matrix protein in both chronic-active and chronic-inactive demyelinating lesions (Fig. 4B,C,E,F), with more intense staining in the former (Fig. 4E,F). Anosmin-1 immunolabeling was found within the entire extension of both types of plaques, but was scrupulously confined to the demyelinated area, without showing well defined Anosmin-1+ neural cell bodies inside it (Fig. 4E,F). Anosmin-1 was also detected in some perivascular infiltrates in the periplaque of chronic lesions, always in close proximity to the Anosmin-1+ core of the lesions or rarely inside them (Fig. 4G,H). In addition to the diffuse extracellular matrix labeling, Anosmin-1 immunoreactivity was observed in some axons, selectively in their nude segment within the demyelinated lesion (Fig. 4I–L). The percentage of axons that presented Anosmin-1 immunoreactivity was 13.57 ± 2.89%. In contrast, Anosmin-1+ axons were not detected in the NAWM (Fig. 4M–O) or in active and shadow plaques from the same patients (data not shown).
Figure 4.

Anosmin-1 is selectively expressed within chronic-active and chronic-inactive demyelinating plaques of MS patients. A–F, Images of parallel sections with one active (Ac in A, D), one chronic-active (C-A in B, E), and one chronic-inactive (C-I in C, F) plaques stained with HLA-DR followed by the myelin-specific eriochrome cyanine staining (A–C) and immunostained for Anosmin-1 (D–F). G, Anosmin-1-immunoreactive perivascular infiltrates (asterisk) from an MS patient in close proximity to an Anosmin-1-containing lesion. H, High-magnification image of one group of Anosmin-1+ perivascular blood cells within a chronic lesion. I, Some axons express Anosmin-1 in their nude segment within a chronic-active MS lesion. J–L, Within chronic lesions, some of the β-III-Tubulin+ axons showed Anosmin-1 immunoreactivity (arrows). M–O, In the NAWM of the same patient, no Anosmin-1+ axons were detected. Scale bars: A–F, 400 μm; G, 100 μm; H, I, 25 μm; J–L, 20 μm; M–O, 17 μm. A, D, and J–O are from case MS342; B and E are from case MS125; C, and F–I are from case MS149.
FGFR1 is upregulated in OPCs and in NAGM perivascular astrocytes of MS patients
The distribution of FGFR1, the receptor shared by FGF-2 and Anosmin-1 during OPC migration, varied in MS patients when compared with controls. In all the blocks from controls, FGFR1 was exclusively observed in a subpopulation of astrocytes in the white matter (Fig. 5A–D). In MS patients (Fig. 5E–H), FGFR1 was upregulated also in an OPC subpopulation within active lesions and surrounding chronic-active and chronic-inactive lesions (Fig. 5E–P). In the case of chronic-active lesions (Fig. 5Q), although the density of OPCs was similar in the periplaque and the adjacent NAWM (36.89 ± 6.48 and 27.74 ± 5.49 cells/mm2, respectively; p = 0.395), the density of FGFR1+ OPCs (Fig. 5R) was significantly higher in the periplaque of demyelinated lesions than in the adjacent NAWM (2.89 ± 0.73-fold increase; p < 0.05). In the same cortical blocks, no demyelinated areas were present. However, new FGFR1+ periventricular astrocytes were observed in the gray matter of MS patients (Fig. 5S–V). These FGFR1+ perivascular astrocytes of the NAGM were always found in close association with a slightly discontinuous ZO-1 immunolabeling (data not shown).
Figure 5.

FGFR1 distribution in controls and MS patients. A, A detailed view of one FGFR1+ cell from the white matter of a control patient. B–D, Confocal images showing one astrocyte positively immunostained for FGFR1 (red) and GFAP (green). E–H, Panoramic view of a chronic-active lesion where FGFR1+/PDGFRα+ OPCs within the periplaque and in the NAWM (arrowheads) and a FGFR1−/ PDGFRα+ OPC in the periplaque (arrows) were observed. I–L, A FGFR1+ OPC within the periplaque of a chronic-active lesion of a MS patient. M–P, A detailed image of a FGFR1+/GFAP+ astrocyte (arrowheads) and a PDGFRα+/FGFR1− OPC (arrows) within the NAWM of a MS patient. Q, R, Quantification of the density of OPCs (Q) or OPCs double labeled for FGFR1 (R) in the plaque, periplaque, and its adjacent NAWM from nine chronic-active lesions belonging to MS40, MS46, MS106, and MS125. There were no OPCs detected in the plaque, while the periplaque and NAWM showed statistically similar numbers of OPCs (Q). In contrast, the number of FGFR1+ OPCs was significantly higher in the periplaque than in its adjacent NAWM. Within the periplaque, the number of FGFR1+ OPCs was significantly higher than that of FGFR1− OPCs. One-way ANOVA followed by Student's t test (represented): *p < 0.05. S, A group of FGFR1+ perivascular glial cells from the gray matter of a MS patient. T–V, Confocal images of an astrocyte double immunostained for FGFR1 (red) and GFAP (green) with a blood vessel contacting process from the gray matter of an MS patient. Scale bars: A, 10 μm; B–D, 22 μm; E–H, 45 μm; I–P, 15 μm; S, 50 μm; T–V, 8 μm. A–D are from case CO25; E–P are from case MS106; S–V are from case MS149.
A number of FGFR1+ neurons were detected in the gray matter of controls and in the NAGM of MS patients of the same blocks from cerebral cortices (data not shown), although no differences in their number or staining intensity was detected between the different types of patients.
FGF-2 and Anosmin-1 influence adult OPC migration in the same manner as during development
To determine whether the FGF-2/FGFR1/Anosmin-1 system had the same biological implications on adult OPC migration as it has in embryos (Bribián et al., 2006), we analyzed the effects of FGF-2 and Anosmin-1 on the migration of OPCs isolated from cerebral cortices of adult mice (Fig. 6A–J). While FGF-2 significantly mobilized and/or attracted the OPCs (3.34 ± 0.20-fold increase vs control; p < 0.001), the opposite effect was observed in the presence of Anosmin-1 (1.84 ± 0.09-fold decrease vs control; p < 0.001). When cells were exposed to both molecules simultaneously, the number of transmigrating OPCs was slightly higher than in untreated control cultures (1.58 ± 0.12-fold increase vs control; p = 0.482), but significantly lower than in cells treated with FGF-2 alone (2.11 ± 0.14-fold decrease vs FGF-2 alone; p < 0.001). The effects of these cues were all abolished when FGFRs were blocked by adding SU5402 agent (FGF-2+SU5402 = 1.26 ± 0.09-fold increase vs control, p = 0.102; A1+ SU5402 = 0.96 ± 0.06-fold increase vs control, p = 0.796; FGF-2+A1+SU5402 = 1.09 ± 0.09-fold increase vs control, p = 0.482). Therefore, we concluded that FGF-2 and Anosmin-1 act in adult OPCs as they do during development.
Figure 6.

In vitro studies on FGF-2/Anosmin-1-mediated activity in adult OPCs. A–C, Characterization of OPCs isolated from mouse adult cerebral cortex double immunostained for NG2/PDGFRα. D–I, Representative images of the A2B5+/olig2+ migratory cells under different experimental conditions. J, Histogram showing the percentage of migrating OPCs from adult mice quantified after culturing under standard conditions (CHO-CT) or in the presence of various modulators as indicated, including the FGFR blocker SU5402. Treatment with FGF-2 alone (white bars) led to a significant increase in the number of migrating OPCs, while that with Anosmin-1 alone (CHO-A1, light gray bars) had the opposite effect when compared withcontrol conditions (black bars). Combined treatment with FGF-2 and Anosmin-1 (dark gray bars) gave rise to an intermediate number of migrating OPCs. The effects of FGF-2 and Anosmin-1 were blocked in the presence of SU5402. Student's t test results are represented as follows: **p < 0.01; ***p < 0.001 with respect to control conditions (###p < 0.001, also vs control conditions). Scale bar: A–I, 25 μm.
Pro-inflammatory cytokines upregulate FGF-2 expression in gray matter astrocytes
Alterations in endothelial cells, which are the morphological base of the BBB, are induced by different inflammatory stimuli (Dietrich, 2002). In the NAGM of MS patients, an alteration in the expression of different genes related to inflammation and the energetic metabolism of astrocytes are altered (Kinter et al., 2009). To determine whether the upregulation of FGF-2 and/or FGFR1 in astrocytes was induced by an inflammatory environment, astrocytes were isolated from the gray matter of cerebral cortices dissected from P0 mice, and the cells were cultured in the presence of IL-1β, TNF-α, or both cytokines. Our results showed a drastic upregulation of fgf-2 expression in the presence of IL-1β alone (7.18 ± 1.48-fold increase vs control, p < 0.01), or combined with TNF-α (9.22 ± 2.0-fold increase vs control, p < 0.01), but not with TNF-α alone (2.12 ± 0.87-fold increase vs control, p = 0.132). In contrast, no alterations in fgfr1 mRNA expression were detected in any of the samples analyzed (IL-1β: 1.45 ± 0.42-fold increase vs control, p = 0.435; TNF-α: 2.19 ± 1.03-fold increase vs control, p = 0.324; IL-1β/TNF-α: 1.69 ± 0.56-fold increase vs control, p = 0.328).
Discussion
In this work, we describe a complementary spatial distribution pattern of FGF-2 and Anosmin-1 associated with chronic-active and chronic-inactive MS lesions, where remyelination rarely exists (Frohman et al., 2006). In contrast, in active plaques, where remyelination normally occurs (Frohman et al., 2006), FGF-2 is upregulated in infiltrating macrophages, and in microglia-derived macrophages also, and Anosmin-1 is absent. Our data on the effects of FGF-2 and Anosmin-1 in the motility and migration of adult OPCs resemble those observed during development (Bribián et al., 2006). As shown schematically in Figure 7, these histopathological observations in the CNS support the following interpretation: (1) FGF-2 expression within active lesions and in the periplaque of chronic-active and chronic-inactive lesions leads to recruitment of FGFR1+ OPCs; and (2) in contrast, Anosmin-1 may impede OPCs from invading the lesions, since it is present within the plaques in which no remyelination is observed.
Figure 7.

Schematic representation of the putative functional implications of the FGF-2/FGFR1/Anosmin-1 system in MS. A, In active lesions (where remyelination is possible), there is an increment in the density of FGF-2 expressing macrophages and FGFR1+ OPCs, whereas Anosmin-1 is absent. B, In contrast, in chronic-active lesions (where remyelination rarely exists and is mainly restricted to the periplaque), the molecular environment is drastically different: FGF-2 expression is limited to the macrophages/microglia in the periplaque, probably attracting FGFR1+ OPCs toward the lesion; on the contrary, the expression of Anosmin-1 is widespread throughout the core of the lesion and may be preventing remyelination.
The plaque type-specific upregulation of Anosmin-1 is probably due to a change in the cytokine balance as known in another relapsing inflammatory disease (Tengara et al., 2010), and is similar to that previously demonstrated for other molecules involved in OPC migration (Back et al., 2005; Omari et al., 2005; Williams et al., 2007; Wang et al., 2008). The cellular source identification of this staining is difficult. Indeed, this is the first description of Anosmin-1 immunostaining in adult human CNS. The only data about Anosmin-1 expression in humans were provided by in situ hybridization analysis in fetuses in which different regions, without defining any specific cell source, were reported (Lutz et al., 1994; Duke et al., 1995). In other mammals, this kind of Anosmin-1 diffuse staining has been described previously in different regions during CNS development (Soussi-Yanicostas et al., 2002; Dellovade et al., 2003), but, again, it lacks data in adulthood. The presence of Anosmin-1 in the segment of nude axons crossing chronic-active and chronic-inactive lesions is a striking functional histopathological observation and confirms that, in adult MS patients, axons acquire developmental features (Soussi-Yanicostas et al., 2002; Bribián et al., 2008), as previously shown for polysialylated-NCAM (Charles et al., 2002; Jakovcevski et al., 2007). This axonal immunoreactivity was clearly stronger than the diffuse extracellular staining, which seems to be the result of the upregulation of Anosmin-1 rather than a passive deposition of the protein on axonal membranes. The following two putative roles for Anosmin-1 in axonal upregulation could be considered: (1) Anosmin-1 may interfere with the FGF-2 effects (see above); or (2) Anosmin-1 may facilitate OPC recognition/adhesion (Bribián et al., 2008) and thereby facilitate remyelination. We suggested earlier that homophilic Anosmin-1/Anosmin-1 interactions are important for axon-OPC recognition during development (Bribián et al., 2008). In MS chronic lesions, the absence of Anosmin-1 in OPCs could affect their recognition of the nude Anosmin-1+ axons and thus compromise their ability to repair the damage. Indeed, to mimic developmental conditions and induce effective remyelination, not only axons, but adult OPCs, may also acquire embryonic features, as it has been previously shown in MS for other OPC-specific genes (Capello et al., 1997; Arnett et al., 2004). Attending to our in vitro data, we consider more plausible the first interpretation about the presence of Anosmin-1 in axons and in the extracellular matrix as an obstacle for OPC migration toward the interior of the plaque.
To our knowledge, these are the first data that identify different functional OPC subpopulations (FGFR1+/FGFR1−) in human adults, populations that probably influence OPC recruitment to demyelinating lesions. In fact, the significant difference in the density of FGFR1+ OPCs between the periplaque and its adjacent NAWM suggest that FGFR1+ OPCs primarily respond to FGF-2 upregulation, reflecting the presence of a gradient of FGF-2 around both types of lesions. A second possibility that we cannot rule out is that FGF-2 in the periplaque might upregulate FGFR1 in OPCs, as observed previously in vitro (Bansal et al., 1996). It has been postulated that myelination may be facilitated in active lesions by inflammation and infiltrating (or microglial-derived) macrophages, which provide the tissue with growth factors (Diemel et al., 1998; Kotter et al., 2001) and/or cues, such as secreted semaphorins (Williams et al., 2007). Indeed, macrophages/microglia produce growth factors in vitro (Araujo and Cotman, 1992; Nakajima et al., 2007; Yin et al., 2009). However, considering the data from mouse models of demyelination, an elevated amount of FGF-2 within active lesions not only appears to favor the recruitment of FGFR1+ OPCs but also to inhibit their differentiation toward myelinating oligodendrocytes (Armstrong et al., 2002, 2006). Moreover, the absence of this growth factor was recently shown to be detrimental rather than beneficial for remyelination during experimental autoimmune encephalomyelitis (EAE) (Rottlaender et al., 2011). The latter study emphasizes that the role of FGF-2 is not related to changes in antigen epitope recognition or inflammatory molecules itself but, rather, to the prevention of axonal damage and to favoring the process of remyelination. In view of the present results, we suggest that during the remyelination process the level of FGF-2 should fluctuate to a level that allows OPC differentiation and the subsequent partial remyelination of the affected axons (shadow plaques). A similar FGF-2 upregulation in macrophages/microglia within spinal cord lesions was previously described in EAE (Liu et al., 1998). Indeed, it has been demonstrated by gene therapy that FGF-2 significantly increases the number of OPCs and myelin-forming oligodendrocytes in areas of demyelination in the aforementioned MS model (Ruffini et al., 2001). Therefore, FGF-2 might be one of the factors that favor the proper remyelination in MS.
In contrast to the white matter, the gray matter of the same cortical blocks from MS patients did not present any sign of demyelination. Nevertheless, FGF-2 upregulation in perivascular astrocytes was observed selectively within the NAGM of MS patients in close association with a slightly disrupted tight junction profile, probably mediated by an inflammatory environment (Kinter et al., 2009). Although the tight junction profile within the white matter is disrupted in all types of lesions (Claudio et al., 1995; Kirk et al., 2003; Padden et al., 2007), it remains unclear why tight junctions within the gray matter are not altered to the same degree. While it is accepted as a regulator of the vascular tone (Zhou et al., 1998), the relevance of FGF-2 in inducing and maintaining BBB integrity has been shown by different in vitro approaches. Thus, FGF-2 is one of the astrocytic factors to induce the BBB properties of immortalized bovine brain endothelial cells (Sobue et al., 1999) and plays a significant role in maintaining the integrity of the BBB during the progress of HIV-associated cerebral endothelial cell damage (Langford et al., 2005). In fgf-2−/− mice, a functional deficit of the BBB was related to reduced levels of ZO-1 protein (Reuss et al., 2003). In addition, FGF-2 deficit paralleled alterations in the content of intermediate filaments within the endfeet of perivascular astrocytes of the gray matter, but not in those within the white matter (Reuss et al., 2003). In this scenario, our data suggest that FGF-2 could be upregulated and secreted by perivascular astrocytes to improve cell fitness and the integrity of the BBB within the gray matter of MS patients, which is modified by changes in the inflammatory environment in the milieu around blood vessels.
In conclusion, the upregulation of FGF-2 in different areas (MS lesions and NAGM) by different cell types (microglial/macrophages and perivascular astrocytes, respectively) suggests a general role of this growth factor in MS patient neurorepair (microglial/macrophages in areas of remyelination attracting OPCs) and neuroprotection (perivascular astrocytes maintaining gray matter BBB integrity). This, together with the demonstration that the FGF-2/FGFR1/Anosmin-1 system is conserved among forebrain regions and throughout the lifespan (Bribián et al., 2006; Bribián et al., 2008; present results) in parallel with its histopathological implications in MS patients, points to it being considered as a future therapeutic target (pharmacogenetics, cell therapy) to induce effective colonization of MS lesions by endogenous and/or exogenous OPCs and to give rise effective remyelination of lesions.
Footnotes
This work was supported by the Ministerio de Ciencia e Innovación (MICINN) (Grants SAF2007-65845 and SAF2009-07842); the Fondo de Investigaciones Sanitarias [partially financed by the Fondo Europeo de Desarrollo Regional (FEDER), European Union “Una manera de hacer Europa” Grant RD07-0060-2007]; the Gobierno de Castilla-La Mancha (Grants PAI08-0242-3822; ICS06024-00; G-2008-C8; and PI2009-26); and the Fundación Eugenio Rodríguez Pascual (Spain). D.C. and F.d.C. held a Servicio de Salud de Castilla-La Mancha contract, and M.C.O. is a Fundación para la Investigación Sanitaria de Castilla-La Mancha (FISCAM) predoctoral fellow (MOV-2007_JI-20). F.J.A. was financed through MICINN Grants SAF2007-65845 and SAF2009-07482. Human samples were supplied by the UK Multiple Sclerosis Tissue Bank, funded by the Multiple Sclerosis Society of Great Britain and Northern Ireland (registered charity 207495). NG2 antibody was a kind gift from Professor William Stallcup (Sanford-Burnham Medical Research Institute, Cancer Center, La Jolla, CA). We thank Laura García, Amelia González, Isabel Machín, Eva María Medina, and Iris Sánchez for their technical support; Dr. José Ángel Rodríguez-Alfaro and Dr. Javier Mazarío for their help with the confocal imaging; and Diego García-González for his artistic inspiration and creation of the drawings.
The authors declare no competing financial interests.
References
- Araujo DM, Cotman CW. Basic FGF in astroglial, microglial, and neuronal cultures: characterization of binding sites and modulation of release by lymphokines and trophic factors. J Neurosci. 1992;12:1668–1678. doi: 10.1523/JNEUROSCI.12-05-01668.1992. [DOI] [PMC free article] [PubMed] [Google Scholar]
- Armstrong RC, Le TQ, Frost EE, Borke RC, Vana AC. Absence of fibroblast growth factor 2 promotes oligodendroglial repopulation of demyelinated white matter. J Neurosci. 2002;22:8574–8585. doi: 10.1523/JNEUROSCI.22-19-08574.2002. [DOI] [PMC free article] [PubMed] [Google Scholar]
- Armstrong RC, Le TQ, Flint NC, Vana AC, Zhou YX. Endogenous cell repair of chronic demyelination. J Neuropathol Exp Neurol. 2006;65:245–256. doi: 10.1097/01.jnen.0000205142.08716.7e. [DOI] [PMC free article] [PubMed] [Google Scholar]
- Arnett HA, Fancy SP, Alberta JA, Zhao C, Plant SR, Kaing S, Raine CS, Rowitch DH, Franklin RJ, Stiles CD. bHLH transcription factor Olig1 is required to repair demyelinated lesions in the CNS. Science. 2004;306:2111–2115. doi: 10.1126/science.1103709. [DOI] [PubMed] [Google Scholar]
- Back SA, Tuohy TM, Chen H, Wallingford N, Craig A, Struve J, Luo NL, Banine F, Liu Y, Chang A, Trapp BD, Bebo BF, Jr, Rao MS, Sherman LS. Hyaluronan accumulates in demyelinated lesions and inhibits oligodendrocyte progenitor maturation. Nat Med. 2005;11:966–972. doi: 10.1038/nm1279. [DOI] [PubMed] [Google Scholar]
- Bansal R, Kumar M, Murray K, Morrison RS, Pfeiffer SE. Regulation of FGF receptors in the oligodendrocyte lineage. Mol Cell Neurosci. 1996;7:263–275. doi: 10.1006/mcne.1996.0020. [DOI] [PubMed] [Google Scholar]
- Benito C, Romero JP, Tolón RM, Clemente D, Docagne F, Hillard CJ, Guaza C, Romero J. Cannabinoid CB1 and CB2 receptors and fatty acid amide hydrolase are specific markers of plaque cell subtypes in human multiple sclerosis. J Neurosci. 2007;27:2396–2402. doi: 10.1523/JNEUROSCI.4814-06.2007. [DOI] [PMC free article] [PubMed] [Google Scholar]
- Bögler O, Wren D, Barnett SC, Land H, Noble M. Cooperation between two growth factors promotes extended self-renewal and inhibits differentiation of oligodendrocyte-type-2 astrocyte (O-2A) progenitor cells. Proc Natl Acad Sci U S A. 1990;87:6368–6372. doi: 10.1073/pnas.87.16.6368. [DOI] [PMC free article] [PubMed] [Google Scholar]
- Breij EC, Brink BP, Veerhuis R, van den Berg C, Vloet R, Yan R, Dijkstra CD, van der Valk P, Bö L. Homogeneity of active demyelinating lesions in established multiple sclerosis. Ann Neurol. 2008;63:16–25. doi: 10.1002/ana.21311. [DOI] [PubMed] [Google Scholar]
- Bribián A, Barallobre MJ, Soussi-Yanicostas N, de Castro F. Anosmin-1 modulates the FGF-2-dependent migration of oligodendrocyte precursors in the developing optic nerve. Mol Cell Neurosci. 2006;33:2–14. doi: 10.1016/j.mcn.2006.05.009. [DOI] [PubMed] [Google Scholar]
- Bribián A, Esteban PF, Clemente D, Soussi-Yanicostas N, Thomas JL, Zalc B, de Castro F. A novel role for anosmin-1 in the adhesion and migration of oligodendrocyte precursors. Dev Neurobiol. 2008;68:1503–1516. doi: 10.1002/dneu.20678. [DOI] [PubMed] [Google Scholar]
- Butt AM, Dinsdale J. Fibroblast growth factor 2 induces loss of adult oligodendrocytes and myelin in vivo. Exp Neurol. 2005;192:125–133. doi: 10.1016/j.expneurol.2004.11.007. [DOI] [PubMed] [Google Scholar]
- Capello E, Voskuhl RR, McFarland HF, Raine CS. Multiple sclerosis: re-expression of a developmental gene in chronic lesions correlates with remyelination. Ann Neurol. 1997;41:797–805. doi: 10.1002/ana.410410616. [DOI] [PubMed] [Google Scholar]
- Cariboni A, Pimpinelli F, Colamarino S, Zaninetti R, Piccolella M, Rumio C, Piva F, Rugarli EI, Maggi R. The product of X-linked Kallmann's syndrome gene (KAL1) affects the migratory activity of gonadotropin-releasing hormone (GnRH)-producing neurons. Hum Mol Genet. 2004;13:2781–2791. doi: 10.1093/hmg/ddh309. [DOI] [PubMed] [Google Scholar]
- Chang A, Tourtellotte WW, Rudick R, Trapp BD. Premyelinating oligodendrocytes in chronic lesions of multiple sclerosis. N Engl J Med. 2002;346:165–173. doi: 10.1056/NEJMoa010994. [DOI] [PubMed] [Google Scholar]
- Chang A, Smith MC, Yin X, Fox RJ, Staugaitis SM, Trapp BD. Neurogenesis in the chronic lesions of multiple sclerosis. Brain. 2008;131:2366–2375. doi: 10.1093/brain/awn157. [DOI] [PMC free article] [PubMed] [Google Scholar]
- Charles P, Reynolds R, Seilhean D, Rougon G, Aigrot MS, Niezgoda A, Zalc B, Lubetzki C. Re-expression of PSA-NCAM by demyelinated axons: an inhibitor of remyelination in multiple sclerosis? Brain. 2002;125:1972–1979. doi: 10.1093/brain/awf216. [DOI] [PubMed] [Google Scholar]
- Claudio L, Raine CS, Brosnan CF. Evidence of persistent blood-brain barrier abnormalities in chronic-progressive multiple sclerosis. Acta Neuropathol. 1995;90:228–238. doi: 10.1007/BF00296505. [DOI] [PubMed] [Google Scholar]
- Clemente D, Esteban PF, del Valle I, Bribián A, Soussi-Yanicostas N, Silva A, de Castro F. Expression pattern of Anosmin-1 during pre- and postnatal rat brain development. Dev Dyn. 2008;237:2518–2528. doi: 10.1002/dvdy.21659. [DOI] [PubMed] [Google Scholar]
- Compston A, Coles A. Multiple sclerosis. Lancet. 2008;372:1502–1517. doi: 10.1016/S0140-6736(08)61620-7. [DOI] [PubMed] [Google Scholar]
- de Castro F, Bribián A. The molecular orchestra of the migration of oligodendrocyte precursors during development. Brain Res Brain Res Rev. 2005;49:227–241. doi: 10.1016/j.brainresrev.2004.12.034. [DOI] [PubMed] [Google Scholar]
- Dellovade TL, Hardelin JP, Soussi-Yanicostas N, Pfaff DW, Schwanzel-Fukuda M, Petit C. Anosmin-1 immunoreactivity during embryogenesis in a primitive eutherian mammal. Brain Res Dev Brain Res. 2003;140:157–167. doi: 10.1016/s0165-3806(02)00544-8. [DOI] [PubMed] [Google Scholar]
- Diemel LT, Copelman CA, Cuzner ML. Macrophages in CNS remyelination: friend or foe? Neurochem Res. 1998;23:341–347. doi: 10.1023/a:1022405516630. [DOI] [PubMed] [Google Scholar]
- Dietrich JB. The adhesion molecule ICAM-1 and its regulation in relation with the blood-brain barrier. J Neuroimmunol. 2002;128:58–68. doi: 10.1016/s0165-5728(02)00114-5. [DOI] [PubMed] [Google Scholar]
- Docagne F, Muñetón V, Clemente D, Ali C, Loría F, Correa F, Hernangómez M, Mestre L, Vivien D, Guaza C. Excitotoxicity in a chronic model of multiple sclerosis: neuroprotective effects of cannabinoids through CB1 and CB2 receptor activation. Mol Cell Neurosci. 2007;34:551–561. doi: 10.1016/j.mcn.2006.12.005. [DOI] [PubMed] [Google Scholar]
- Duke VM, Winyard PJ, Thorogood P, Soothill P, Bouloux PM, Woolf AS. KAL, a gene mutated in Kallmann's syndrome, is expressed in the first trimester of human development. Mol Cell Endocrinol. 1995;110:73–79. doi: 10.1016/0303-7207(95)03518-c. [DOI] [PubMed] [Google Scholar]
- Farmer SF, Harrison LM, Mayston MJ, Parekh A, James LM, Stephens JA. Abnormal cortex-muscle interactions in subjects with X-linked Kallmann's syndrome and mirror movements. Brain. 2004;127:385–397. doi: 10.1093/brain/awh047. [DOI] [PubMed] [Google Scholar]
- Frohman EM, Racke MK, Raine CS. Multiple sclerosis—the plaque and its pathogenesis. N Engl J Med. 2006;354:942–955. doi: 10.1056/NEJMra052130. [DOI] [PubMed] [Google Scholar]
- García-González D, Clemente D, Coelho M, Esteban PF, Soussi-Yanicostas N, de Castro F. Dynamic roles of FGF-2 and Anosmin-1 in the migration of neuronal precursors from the subventricular zone during pre- and postnatal development. Exp Neurol. 2010;222:285–295. doi: 10.1016/j.expneurol.2010.01.006. [DOI] [PubMed] [Google Scholar]
- Goddard DR, Berry M, Butt AM. In vivo actions of fibroblast growth factor-2 and insulin-like growth factor-I on oligodendrocyte development and myelination in the central nervous system. J Neurosci Res. 1999;57:74–85. doi: 10.1002/(SICI)1097-4547(19990701)57:1<74::AID-JNR8>3.0.CO;2-O. [DOI] [PubMed] [Google Scholar]
- Goddard DR, Berry M, Kirvell SL, Butt AM. Fibroblast growth factor-2 inhibits myelin production by oligodendrocytes in vivo. Mol Cell Neurosci. 2001;18:557–569. doi: 10.1006/mcne.2001.1025. [DOI] [PubMed] [Google Scholar]
- Henderson AP, Barnett MH, Parratt JD, Prineas JW. Multiple sclerosis: distribution of inflammatory cells in newly forming lesions. Ann Neurol. 2009;66:739–753. doi: 10.1002/ana.21800. [DOI] [PubMed] [Google Scholar]
- Jakovcevski I, Mo Z, Zecevic N. Down-regulation of the axonal polysialic acid-neural cell adhesion molecule expression coincides with the onset of myelination in the human fetal forebrain. Neuroscience. 2007;149:328–337. doi: 10.1016/j.neuroscience.2007.07.044. [DOI] [PMC free article] [PubMed] [Google Scholar]
- Kinter J, Allaman I, Schroeder K, Tschopp J, Magistretti P, Schaeren-Wiemers N. Cellular immunity and pathological alterations in MS grey matter. Glia. 2009;57:S92. [Google Scholar]
- Kirk J, Plumb J, Mirakhur M, McQuaid S. Tight junctional abnormality in multiple sclerosis white matter affects all calibres of vessel and is associated with blood-brain barrier leakage and active demyelination. J Pathol. 2003;201:319–327. doi: 10.1002/path.1434. [DOI] [PubMed] [Google Scholar]
- Koning N, Bö L, Hoek RM, Huitinga I. Downregulation of macrophage inhibitory molecules in multiple sclerosis lesions. Ann Neurol. 2007;62:504–514. doi: 10.1002/ana.21220. [DOI] [PubMed] [Google Scholar]
- Kotter MR, Setzu A, Sim FJ, Van Rooijen N, Franklin RJ. Macrophage depletion impairs oligodendrocyte remyelination following lysolecithin-induced demyelination. Glia. 2001;35:204–212. doi: 10.1002/glia.1085. [DOI] [PubMed] [Google Scholar]
- Krams M, Quinton R, Mayston MJ, Harrison LM, Dolan RJ, Bouloux PM, Stephens JA, Frackowiak RS, Passingham RE. Mirror movements in X-linked Kallmann's syndrome. II. A PET study. Brain. 1997;120:1217–1228. doi: 10.1093/brain/120.7.1217. [DOI] [PubMed] [Google Scholar]
- Langford D, Hurford R, Hashimoto M, Digicaylioglu M, Masliah E. Signalling crosstalk in FGF2-mediated protection of endothelial cells from HIV-gp120. BMC Neurosci. 2005;6:8. doi: 10.1186/1471-2202-6-8. [DOI] [PMC free article] [PubMed] [Google Scholar]
- Liu X, Mashour GA, Webster HF, Kurtz A. Basic FGF and FGF receptor 1 are expressed in microglia during experimental autoimmune encephalomyelitis: temporally distinct expression of midkine and pleiotrophin. Glia. 1998;24:390–397. doi: 10.1002/(sici)1098-1136(199812)24:4<390::aid-glia4>3.0.co;2-1. [DOI] [PubMed] [Google Scholar]
- Lutz B, Kuratani S, Rugarli EI, Wawersik S, Wong C, Bieber FR, Ballabio A, Eichele G. Expression of the Kallmann syndrome gene in human fetal brain and in the manipulated chick embryo. Hum Mol Genet. 1994;3:1717–1723. doi: 10.1093/hmg/3.10.1717. [DOI] [PubMed] [Google Scholar]
- Martínez-Forero I, Peláez A, Villoslada P. Pharmacogenomics of multiple sclerosis: in search for a personalized therapy. Expert Opin Pharmacother. 2008;9:3053–3067. doi: 10.1517/14656560802515553. [DOI] [PubMed] [Google Scholar]
- Mayston MJ, Harrison LM, Quinton R, Stephens JA, Krams M, Bouloux PM. Mirror movements in X-linked Kallmann's syndrome. I. A neurophysiological study. Brain. 1997;120:1199–1216. doi: 10.1093/brain/120.7.1199. [DOI] [PubMed] [Google Scholar]
- McKinnon RD, Matsui T, Dubois-Dalcq M, Aaronson SA. FGF modulates the PDGF-driven pathway of oligodendrocyte development. Neuron. 1990;5:603–614. doi: 10.1016/0896-6273(90)90215-2. [DOI] [PubMed] [Google Scholar]
- Merchán P, Bribián A, Sánchez-Camacho C, Lezameta M, Bovolenta P, de Castro F. Sonic hedgehog promotes the migration and proliferation of optic nerve oligodendrocyte precursors. Mol Cell Neurosci. 2007;36:355–368. doi: 10.1016/j.mcn.2007.07.012. [DOI] [PubMed] [Google Scholar]
- Murcia-Belmonte V, Esteban PF, García-González D, de Castro F. Biochemical dissection of Anosmin-1 interaction with FGFR1 and components of the extracellular matrix. J Neurochem. 2010;115:1256–1265. doi: 10.1111/j.1471-4159.2010.07024.x. [DOI] [PubMed] [Google Scholar]
- Nakajima K, Tohyama Y, Maeda S, Kohsaka S, Kurihara T. Neuronal regulation by which microglia enhance the production of neurotrophic factors for GABAergic, catecholaminergic, and cholinergic neurons. Neurochem Int. 2007;50:807–820. doi: 10.1016/j.neuint.2007.02.006. [DOI] [PubMed] [Google Scholar]
- Noseworthy JH, Lucchinetti C, Rodriguez M, Weinshenker BG. Multiple sclerosis. N Engl J Med. 2000;343:938–952. doi: 10.1056/NEJM200009283431307. [DOI] [PubMed] [Google Scholar]
- Omari KM, John GR, Sealfon SC, Raine CS. CXC chemokine receptors on human oligodendrocytes: implications for multiple sclerosis. Brain. 2005;128:1003–1015. doi: 10.1093/brain/awh479. [DOI] [PubMed] [Google Scholar]
- Padden M, Leech S, Craig B, Kirk J, Brankin B, McQuaid S. Differences in expression of junctional adhesion molecule-A and beta-catenin in multiple sclerosis brain tissue: increasing evidence for the role of tight junction pathology. Acta Neuropathol. 2007;113:177–186. doi: 10.1007/s00401-006-0145-x. [DOI] [PubMed] [Google Scholar]
- Reuss B, Dono R, Unsicker K. Functions of fibroblast growth factor (FGF)-2 and FGF-5 in astroglial differentiation and blood-brain barrier permeability: evidence from mouse mutants. J Neurosci. 2003;23:6404–6412. doi: 10.1523/JNEUROSCI.23-16-06404.2003. [DOI] [PMC free article] [PubMed] [Google Scholar]
- Rottlaender A, Villwock H, Addicks K, Kuerten S. Neuroprotective role of fibroblast growth factor-2 in experimental autoimmune encephalomyelitis. Immunology. 2011;133:370–378. doi: 10.1111/j.1365-2567.2011.03450.x. [DOI] [PMC free article] [PubMed] [Google Scholar]
- Ruffini F, Furlan R, Poliani PL, Brambilla E, Marconi PC, Bergami A, Desina G, Glorioso JC, Comi G, Martino G. Fibroblast growth factor-II gene therapy reverts the clinical course and the pathological signs of chronic experimental autoimmune encephalomyelitis in C57BL/6 mice. Gene Ther. 2001;8:1207–1213. doi: 10.1038/sj.gt.3301523. [DOI] [PubMed] [Google Scholar]
- Sarchielli P, Di Filippo M, Ercolani MV, Chiasserini D, Mattioni A, Bonucci M, Tenaglia S, Eusebi P, Calabresi P. Fibroblast growth factor-2 levels are elevated in the cerebrospinal fluid of multiple sclerosis patients. Neurosci Lett. 2008;435:223–228. doi: 10.1016/j.neulet.2008.02.040. [DOI] [PubMed] [Google Scholar]
- Schnell SA, Staines WA, Wessendorf MW. Reduction of lipofuscin-like autofluorescence in fluorescently labeled tissue. J Histochem Cytochem. 1999;47:719–730. doi: 10.1177/002215549904700601. [DOI] [PubMed] [Google Scholar]
- Sobue K, Yamamoto N, Yoneda K, Hodgson ME, Yamashiro K, Tsuruoka N, Tsuda T, Katsuya H, Miura Y, Asai K, Kato T. Induction of blood-brain barrier properties in immortalized bovine brain endothelial cells by astrocytic factors. Neurosci Res. 1999;35:155–164. doi: 10.1016/s0168-0102(99)00079-6. [DOI] [PubMed] [Google Scholar]
- Soussi-Yanicostas N, Hardelin JP, Arroyo-Jimenez MM, Ardouin O, Legouis R, Levilliers J, Traincard F, Betton JM, Cabanié L, Petit C. Initial characterization of anosmin-1, a putative extracellular matrix protein synthesized by definite neuronal cell populations in the central nervous system. J Cell Sci. 1996;109:1749–1757. doi: 10.1242/jcs.109.7.1749. [DOI] [PubMed] [Google Scholar]
- Soussi-Yanicostas N, de Castro F, Julliard AK, Perfettini I, Chédotal A, Petit C. Anosmin-1, defective in the X-linked form of Kallmann syndrome, promotes axonal branch formation from olfactory bulb output neurons. Cell. 2002;109:217–228. doi: 10.1016/s0092-8674(02)00713-4. [DOI] [PubMed] [Google Scholar]
- Steinman L. Blocking adhesion molecules as therapy for multiple sclerosis: natalizumab. Nat Rev Drug Discov. 2005;4:510–518. doi: 10.1038/nrd1752. [DOI] [PubMed] [Google Scholar]
- Su JJ, Osoegawa M, Matsuoka T, Minohara M, Tanaka M, Ishizu T, Mihara F, Taniwaki T, Kira J. Upregulation of vascular growth factors in multiple sclerosis: correlation with MRI findings. J Neurol Sci. 2006;243:21–30. doi: 10.1016/j.jns.2005.11.006. [DOI] [PubMed] [Google Scholar]
- Tengara S, Tominaga M, Kamo A, Taneda K, Negi O, Ogawa H, Takamori K. Keratinocyte-derived anosmin-1, an extracellular glycoprotein encoded by the X-linked Kallmann syndrome gene, is involved in modulation of epidermal nerve density in atopic dermatitis. J Dermatol Sci. 2010;58:64–71. doi: 10.1016/j.jdermsci.2010.02.010. [DOI] [PubMed] [Google Scholar]
- Trapp BD, Bö L, Mörk S, Chang A. Pathogenesis of tissue injury in MS lesions. J Neuroimmunol. 1999;98:49–56. doi: 10.1016/s0165-5728(99)00081-8. [DOI] [PubMed] [Google Scholar]
- Wang Y, Imitola J, Rasmussen S, O'Connor KC, Khoury SJ. Paradoxical dysregulation of the neural stem cell pathway sonic hedgehog-Gli1 in autoimmune encephalomyelitis and multiple sclerosis. Ann Neurol. 2008;64:417–427. doi: 10.1002/ana.21457. [DOI] [PMC free article] [PubMed] [Google Scholar]
- Williams A, Piaton G, Aigrot MS, Belhadi A, Théaudin M, Petermann F, Thomas JL, Zalc B, Lubetzki C. Semaphorin 3A and 3F: key players in myelin repair in multiple sclerosis? Brain. 2007;130:2554–2565. doi: 10.1093/brain/awm202. [DOI] [PubMed] [Google Scholar]
- Yin J, Sakamoto K, Zhang H, Ito Z, Imagama S, Kishida S, Natori T, Sawada M, Matsuyama Y, Kadomatsu K. Transforming growth factor-beta1 upregulates keratan sulfate and chondroitin sulfate biosynthesis in microglias after brain injury. Brain Res. 2009;1263:10–22. doi: 10.1016/j.brainres.2009.01.042. [DOI] [PubMed] [Google Scholar]
- Young EA, Fowler CD, Kidd GJ, Chang A, Rudick R, Fisher E, Trapp BD. Imaging correlates of decreased axonal Na+/K+ ATPase in chronic multiple sclerosis lesions. Ann Neurol. 2008;63:428–435. doi: 10.1002/ana.21381. [DOI] [PubMed] [Google Scholar]
- Zhou M, Sutliff RL, Paul RJ, Lorenz JN, Hoying JB, Haudenschild CC, Yin M, Coffin JD, Kong L, Kranias EG, Luo W, Boivin GP, Duffy JJ, Pawlowski SA, Doetschman T. Fibroblast growth factor 2 control of vascular tone. Nat Med. 1998;4:201–207. doi: 10.1038/nm0298-201. [DOI] [PMC free article] [PubMed] [Google Scholar]