

Abstract
During vertebrate cortical neurogenesis, radial glial cells (RGCs) serve as neural stem cells that generate neurons directly or indirectly through intermediate progenitor cells (IPCs). The transition from RGCs to IPCs is a key step in determining overall neuronal production and may underlie evolutionary expansion of the cerebral cortex. Here we show that this transition is controlled by fragile X mental retardation protein (FMRP), an RNA-binding protein whose deficiency causes fragile X syndrome. Analysis of mouse embryos electroporated with FMRP small hairpin RNA and knock-out mouse embryos lacking FMRP reveals that specific loss of FMRP causes depletion of neocortical RGCs due to an RGC-to-IPC cell fate change. The RGC depletion is associated with altered F-actin organization and can be largely rescued by overexpressing profilin 1 (Pfn1), a core actin regulatory protein promoting F-actin formation. Our data suggest that FMRP suppresses the transition from RGCs to IPCs during neocortical development by an actin-dependent mechanism.
Introduction
During vertebrate cortical neurogenesis, radial glial cells (RGCs) serve as neural stem cells that undergo asymmetric divisions to generate neurons directly or indirectly (Fish et al., 2008; Kriegstein and Alvarez-Buylla, 2009). Each RGC generates one RGC and one neuron or one RGC and one intermediate progenitor cell (IPC), which then undergo symmetric division to produce two IPCs or two neurons. Compared with direct neuronal production from RGCs, more neurons can be generated through IPCs from each RGC. Thus, the transition from RGCs to IPCs plays a key role in determining the total number of neurons produced from RGCs and may underlie the evolutionary expansion of the cerebral cortex (Fish et al., 2008; Kriegstein and Alvarez-Buylla, 2009). Mechanisms underlying this transition remain poorly understood.
Fragile X mental retardation protein (FMRP) is an RNA-binding protein encoded by FMR1, the causative gene for the developmental disorder fragile X syndrome (FXS) (Bassell and Warren, 2008). Previous studies have revealed a key role for FMRP in neuronal differentiation and have therefore led to the assumption that the neurological symptoms of FXS result from altered neuronal differentiation during brain development (Bassell and Warren, 2008). However, it remains unclear whether FMRP deficiency may affect other processes during the development of the mammalian brain. In particular, FMRP was recently shown to play an important role in the proliferation of neural stem cells in the Drosophila larval brain (Callan et al., 2010) and in the adult mouse brain (Luo et al., 2010). Although a previous study (Tervonen et al., 2009) observed normal expression of cytoplasmic markers of RGCs in Fmr1 knock-out mouse embryos during late neocortical neurogenesis, a possible change in RGC numbers during earlier stages of neocortical neurogenesis cannot be ruled out. Moreover, potential function of FMRP in RGCs may be masked in Fmr1 knock-out embryos by compensation, which often occurs in constitutive knock-out mice (Deuel et al., 2006; Koizumi et al., 2006; Fasano et al., 2007; Satyanarayana and Kaldis, 2009). Thus, whether FMRP regulates RGCs during cortical development remains to be determined.
Here, we show that FMRP plays a critical role in suppressing the transition from RGCs to IPCs during neocortical development. We analyzed neocortical RGCs in mouse embryos electroporated with FMRP small hairpin RNA (shRNA) and neocortical RGCs in knock-out mouse embryos lacking FMRP. These analyses suggest that specific loss of FMRP caused RGC depletion because of increased production of IPCs at the expense of RGCs and that this RGC defect was associated with abnormalities in the actin cytoskeleton.
Materials and Methods
Plasmids.
The FMRP shRNA constructs were generated by inserting annealed oligonucleotides (oligos) into pSilencer 2.0-U6. The oligos used were as follows: fmr1-1f (5′-gatccgttgaggtttattccagagttcaagagactctggaataaacctcaacttttttggaaa-3′) and fmr1-1r (5′-agcttttccaaaaaagttgaggtttattccagagtctcttgaactctggaataaacctcaacg-3′) for FMRP shRNA #1 (targeting sequence: aagttgaggtttattccagag), and fmr1-2f (5′-gatccagaatcagcacataaggatttcaagagaatccttatgtgctgattctttttttggaaa-3′) and fmr1-2r (5′-agcttttccaaaaaaagaatcagcacataaggattctcttgaaatccttatgtgctgattctg-3′) for FMRP shRNA #2 (targeting sequence: aaagaatcagcacataaggat). The pCAX-EGFP, pCAX-mCherry, and pCAX-Lifeact-EGFP plasmids were gifts of F. B. Gertler (Massachusetts Institute of Technology, Cambridge, MA). These plasmids direct the expression of enhanced green fluorescent protein (EGFP), mCherry, and Lifeact-EGFP, respectively, under the CAG promoter (cytomegalovirus enhancer/chicken β-actin promoter/rabbit globin intron). The Lifeact-EGFP fusion protein is comprised of the first 17 aa (MGVADLIKKFESISKEE) of Saccharomyces cerevisiae Abp140 at the N terminus and EGFP at the C terminus (Riedl et at., 2008). To construct pCAX-Lifeact-EGFP, a DNA fragment encoding Lifeact-EGFP was generated by PCR using a 3′ primer complementary to EGFP coding sequence (CDS) and a 5′ chimeric primer that contains the coding sequence of the 17 Abp140 aa followed by EGFP coding sequence. The PCR product was then used to replace the EGFP fragment of pCAX-EGFP to generate pCAX-Lifeact-EGFP. To construct pCAX-FMRP, the CDS of mouse Fmr1 was obtained by reverse transcription PCR using embryonic day (E)12.5 mouse brain total RNA preparations. The CDS was verified by sequencing to be identical to the CDS of BC079671. The Fmr1 CDS was used to replace the EGFP sequence of pCAX-EGFP to generate pCAX-FMRP. An I304N mutation (att mutated to aAt) was then introduced into pCAX-FMRP by site-directed mutagenesis to generate pCAX-FMRP-I304N. The plasmids pCAX-FMRP and pCAX-FMRP-I304N were identical except for the I304N mutation. To express FMRP and FMRP-I304N resistant to FMRP shRNA#2, the shRNA targeting sequence (aaagaatcagcacataaggat) in pCAX-FMRP and pCAX-FMRP-I304N was changed to aaGgaGtcTgcTcaCaaAgat by site-directed mutagenesis. These changes would not alter amino acid coding. To construct pCAX-Pfn1, the EGFP sequence of pCAX-EGFP was replaced by mouse Pfn1 CDS, which was obtained by PCR using the IMAGE clone 3490976 (Open Biosystems) as the template. The H119E mutation was introduced into pCAX-Pfn1 by site-directed mutagenesis to generate pCAX-Pfn1-H119E. The plasmids pCAX-Pfn1 and pCAX-Pfn1-H119E were identical except for the H119E mutation.
Cell culture and transfection.
Mouse CAD cell line was cultured in DMEM (Invitrogen) supplemented with 10% fetal bovine serum, 2 mm l-glutamine, and 1× penicillin/streptomycin (Invitrogen). Transfection was performed using the Attractene reagent (Qiagen) according to the supplier's instructions.
Antibodies.
A mouse monoclonal anti-FMRP antibody (clone 7G1-1, Developmental Studies Hybridoma Bank, 1:500 dilution) was used for Western blot analysis of cultured CAD cells cotransfected with pCAX-FMRP and either control or FMRP shRNA. This antibody did not efficiently detect endogenous FMRP in CAD cells but readily detected FMRP overexpressed from the plasmid pCAX-FMRP. A rabbit polyclonal FMRP antibody (Sigma) against the C terminus of FMRP was used for immunoblotting (1:1000 dilution) and immunostaining (1:100 dilution) of the embryonic mouse neocortex. The following primary antibodies were also used: mouse monoclonal anti-β-actin (GenScript, 1:5000 for Western blot), mouse monoclonal anti-Pax6 (Developmental Studies Hybridoma Bank, 1:100 for immunostaining), mouse monoclonal anti-Ser10 phosphorylated histone H3 (Abcam, 1:200 for immunostaining), mouse monoclonal anti-nestin (BD Biosciences, 1:1000 for immunostaining), mouse monoclonal Tuj1 (Covance, 1:1000 for immunostaining), rabbit polyclonal anti-Tbr2 (Abcam, 1:1000 for immunostaining), rabbit polyclonal anti-Pfn1 (Abcam, 1:200 for immunostaining), rabbit polyclonal anti-activated caspase 3 (Millipore Bioscience Research Reagents, 1:200 for immunostaining), and chicken polyclonal anti-GFP (Aves Labs, 1:500 for immunostaining). All secondary antibodies for immunostaining (1:250 dilution) were purchased from Jackson ImmunoResearch Laboratories and did not have species cross-reactivity. These secondary antibodies were conjugated with cyanine (Cy)2 (green), Cy3 (red), Cy5 (far red), or amino-methyl-coumarin-acetate (blue). For Western blot analysis, the antibodies were diluted in PBS containing 0.2% Tween 20. For immunostaining analysis, the antibodies were diluted in PBS containing 0.2% Triton X-100 and 1% fetal bovine serum. Generally the primary antibody incubation step in immunostaining experiments was performed at room temperature for 2–3 h.
Mice and in utero electroporation.
All animals were treated according to a protocol approved by the Institutional Animal Care and Use Committee of Boston University School of Medicine (Boston, MA). Congenic Fmr1 knock-out mice (strain name: FVB.129P2-Fmr1tm1Cgr/J; stock #:4624) and control wild-type mice on the same strain background (stock # 4828) were purchased from The Jackson Laboratory and bred in the animal facility of the Boston University School of Medicine. These mice were genotyped by PCR using a mixture of three primers, including oIMR2060 (cacgagactagtgagacgtg), oIMR6734 (tgtgatagaatatgcagcatgtga), and oIMR6735 (cttctggcacctccagctt). The wild-type and knock-out alleles were represented by a PCR product of ∼130 and ∼400 bp, respectively. Phusion polymerase (New England Biolabs) was used for the PCR genotyping. For in utero electroporation experiments that did not involve Fmr1 knock-out mice, timed-pregnant Swiss Webster mice purchased from Taconic were used. The day of vaginal plug detection was designated as E0.5. The in utero electroporation procedure was performed as described by Walantus et al. (2007) with modifications. In our procedure, DNA (eluted in sterile distilled H2O) prepared from Qiagen Miniprep kits was used, and electric pulses (5 pulses; 50 ms on, 950 ms off; 11–13 V for E11.5 embryos, 15–16 V for E12.5–13.5 embryos, and 18–21 V for E15.5 embryos) were produced by an ECM 830 electroporator (Harvard Apparatus). The FMRP shRNA plasmid and the pCAX-EGFP plasmid were mixed at a ratio of 3:1, with pCAX-EGFP at the concentration of ∼0.2 μg/μl. In experiments for assessing the effect of FMRP shRNA on actin in RGCs, FMRP shRNA #2 (or control shRNA), pCAX-Lifeact-EGFP, and pCAX-mCherry were mixed at a ratio of 6:1:2, with pCAX-Lifeact-EGFP at the concentration of ∼0.1 μg/μl.
Tissue preparation, antigen retrieval, and immunostaining.
The transfected forebrain of electroporated mouse embryos was fixed in 4% paraformaldehyde at room temperature for 15–25 min (the hippocampus was removed to expose the lateral ventricle before fixation). After fixation, samples were soaked in PBS containing 20% sucrose until they sank, embedded in Tissue-Tek OCT, and sectioned on a cryostat. Cryosections (12–30 μm) were collected on Superfrost slides and either immediately stored at −20°C or immediately placed at 4°C overnight and then stored at −20°C (prolonged storage of sections at room temperature might affect Pax6 and Tbr2 immunostaining). Antigen retrieval treatment was performed before immunostaining in most experiments. In this treatment, tissue slides were immersed in 1× Antigen Retrieval Citra Solution (Biogenex) in a Coplin jar that was placed in a tray filled with water and microwaved for 3 min on power 90 and then 6 min on power 30. After the microwave treatment, the slides were kept in the Antigen Retrieval Citra Solution for 30–40 min before the immunostaining procedure. Transfected cells were detected by anti-GFP immunostaining after the antigen retrieval treatment, which would quench the autofluorescence of EGFP. Samples transfected with pCAX-Lifeact-EGFP were not treated with antigen retrieval because the GFP antibody showed nonspecific staining of the neocortical ventricular surface and therefore might affect the interpretation of the Lifeact-EGFP localization data. Samples in EGFP/mCherry two-step electroporation experiments were also not treated with antigen retrieval because the GFP antibody might weakly cross-react with mCherry.
Confocal microscopy.
Images were obtained on a laser scanning confocal microscope using the LSM510 software or on a spinning-disk confocal microscope using IPLab software.
Statistics.
Statistical analyses were performed using the GraphPad Prism software. Student's t test (two-tailed, unpaired) was used to compare two groups and one-way ANOVA (with Newman–Keuls post test) was used to compare more than two groups.
Results
FMRP is present in RGCs at relatively high levels in the embryonic mouse neocortex
To investigate the protein expression of FMRP in RGCs, we used a rabbit polyclonal FMRP antibody (Sigma) to examine FMRP expression in the embryonic mouse neocortex. This antibody readily detected the FMRP protein in immunoblot analysis of the embryonic mouse neocortex (Fig. 1A). Immunostaining of neocortical sections with this antibody revealed that the FMRP protein is present in the cytoplasm of essentially all neocortical cells (Fig. 1B) and particularly enriched in the endfeet of the apical process and the basal process of RGCs (Fig. 1B–D). The specificity of the antibody was demonstrated by the absence of staining in equivalent regions of Fmr1 knock-out sections (Fig. 1B–D).
Figure 1.
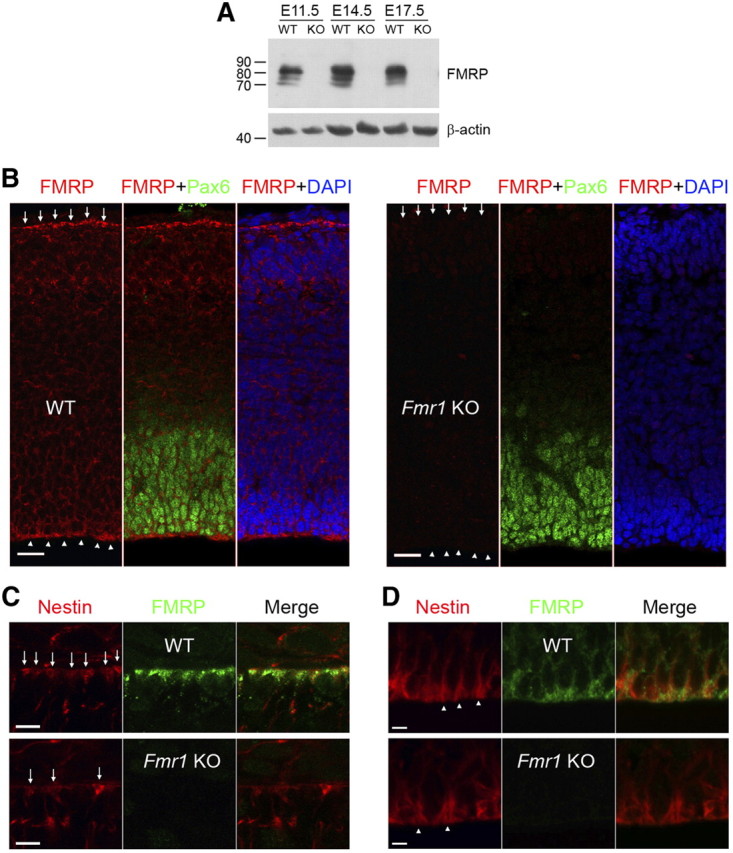
FMRP is expressed in RGCs at relatively high levels during neocortical development. A rabbit polyclonal FMRP antibody (Sigma) was used for immunoblot and immunohistochemical analysis of the embryonic mouse neocortex. A, FMRP can be detected in neocortical lysates throughout cortical neurogenesis. Neocortices from littermate wild-type (WT) and Fmr1 knock-out (KO) embryos were lysed in radioimmunoprecipitation assay buffer, resolved by SDS-PAGE, and probed for FMRP and β-actin (loading control). B, FMRP is present in perinuclear regions throughout the neocortex but at the highest levels near the pial surface (arrows) and the ventricular surface (arrowheads). Pax6 immunoreactivity labels the ventricular zone. C, D, The FMRP immunoreactivity near the pial surface and the ventricular surface colocalizes with nestin+ endfeet of basal (C, arrows) and apical (D, arrowheads) processes, respectively. DAPI, 4′,6-Diamidino-2-phenylindole. Scale bars: B, 20 μm; C, D, 5 μm.
FMRP is important for maintaining the RGC pool during mouse neocortical neurogenesis
To determine the function of FMRP in RGCs, we generated pSilencer 2.0-U6-based shRNA plasmids that could effectively knock down FMRP both in cultured CAD cells (Fig. 2A) and in RGCs in vivo (Fig. 2B,C). A pSilencer 2.0-U6 plasmid carrying a random sequence small hairpin insert was used as control shRNA. We electroporated either FMRP shRNA or control shRNA with pCAX-EGFP, which served as a marker for transfected cells, into the neocortex of Swiss Webster mouse embryos at E11.5, the beginning stage of mouse neocortical neurogenesis. We then quantified the RGC population among the EGFP+ cells at E14.5 based on the expression of Pax6, a nuclear marker for RGCs. We found that RGCs were severely depleted by FMRP shRNA (Fig. 3). This depletion was unlikely caused by RNA interference (RNAi) off-target effects because two different shRNAs caused similar defects (Fig. 3). As a further control for RNAi off-target effects, we generated a plasmid for expressing an shRNA-resistant FMRP. This plasmid rescued the shRNA-induced RGC depletion (Fig. 3). Moreover, the rescue was abolished by introducing an I304N mutation into this plasmid (Fig. 3). The I304N mutation impairs the association of FMRP with RNA (Bassell and Warren, 2008) and renders the protein a null mutant (Zang et al., 2009). Together, these data suggest that specific knock-down of FMRP during early neocortical neurogenesis leads to severe depletion of RGCs.
Figure 2.

Knock-down of FMRP by FMRP shRNA. A, Knock-down of exogenous FMRP. CAD cells were cotransfected with control or FMRP shRNA and pCAX-FMRP, a plasmid for expressing mouse FMRP. Two days following transfection, cells were lysed in radioimmunoprecipitation assay buffer. Lysates were resolved by SDS-PAGE and immunoblotted using an FMRP antibody (7G1-1) and an actin antibody (for loading control). B,C, Knock-down of endogenous FMRP in RGCs in vivo. Control or FMRP shRNA was coelectroporated with pCAX-EGFP, a plasmid for expressing EGFP under the CAG promoter, into the neocortex of Swiss Webster mouse embryos at E11.5. The expression of FMRP was analyzed at E13.5 by immunostaining using a rabbit polyclonal FMRP antibody (Sigma). B, Examples of transfected RGCs (EGFP+Pax6+ cells). The perinuclear FMRP immunoreactivity (indicated by arrows) is reduced by FMRP shRNA. FMRP immunoreactivity in the perinuclear region rather than other subcellular compartments was used to assess FMRP knock-down, because by this method the RGC identity of the cells being measured could be more clearly determined based on the nuclear marker Pax6. Scale bars, 5 μm. C, Quantification. Images were acquired on a laser scanning confocal microscope. The relative intensity of the FMRP fluorescence was measured using the Adobe Photoshop CS3 software. The FMRP signal of each cell was obtained by subtracting the mean intensity of the nuclear fluorescence (calculated from 10 nearby nontransfected cells) from the mean intensity of the perinuclear fluorescence. The FMRP signal of transfected cells (EGFP+) was then compared with that of nearby nontransfected cells (mean value of 10 nearby nontransfected cells was used). DAPI, 4′,6-Diamidino-2-phenylindole. *p < 0.05, ***p < 0.001, one-way ANOVA.
Figure 3.
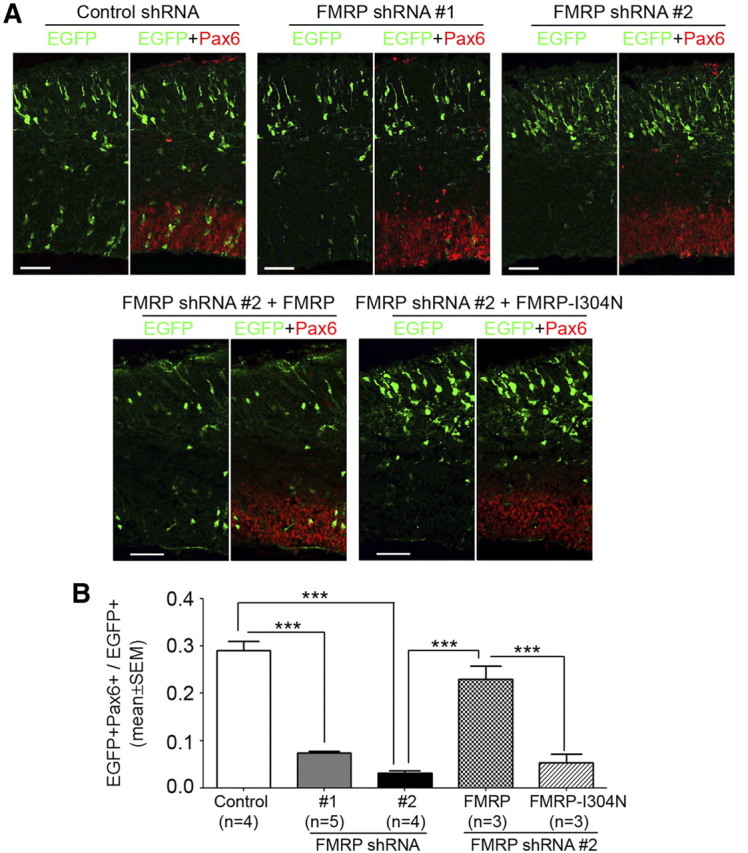
FMRP knock-down during early neocortical neurogenesis results in severe depletion of RGCs. pCAX-EGFP was coelectroporated with control or FMRP shRNA or with FMRP shRNA and a plasmid for expressing shRNA-resistant FMRP or FMRP-I304N into the neocortex of Swiss Webster mouse embryos at E11.5. The electroporated embryos were killed at E14.5, and cryosections of the transfected forebrain hemisphere were prepared for immunostaining. Images of stained sections were acquired on a laser scanning confocal microscope and used for quantifying the proportion of EGFP+ cells that were RGCs (Pax6+). The quantification was performed in comparable neocortical regions in rostrocaudal and mediolateral dimensions. A, Representative confocal images of transfected neocortices. Scale bars, 50 μm. B, Quantification; ***p < 0.001, one-way ANOVA. FMRP shRNA caused a marked decrease in the proportion of EGFP+ cells that were RGCs. This decrease was rescued by the coexpression of FMRP but not FMRP-I304N.
The FMRP shRNA-induced severe depletion of RGCs prompted us to assess whether Fmr1 knock-out mouse embryos also exhibited reduced number of neocortical RGCs. To this end, we bred Fmr1 knock-out mice (The Jackson Laboratory, stock #4624; strain name: FVB.129P2-Fmr1tm1Cgr/J) and control wild-type mice on the same strain background (The Jackson Laboratory, stock #4828) to generate Fmr1+/− female and then crossed Fmr1+/− female with Fmr1Y/− male to obtain E14.5 littermate wild-type and knock-out embryos. We quantified the number of RGCs in neocortical sections of littermate wild-type and Fmr1 knock-out embryos based on the expression of Pax6, which as a nuclear marker would allow more accurate cell counting than cytoplasmic markers because of the high density of RGCs in neocortical sections. Compared with littermate wild-type controls, Fmr1 knock-out mouse embryos exhibited a mild but significant (p < 0.001, Student's t test) reduction in the size of the RGC pool (Fig. 4A,B).
Figure 4.
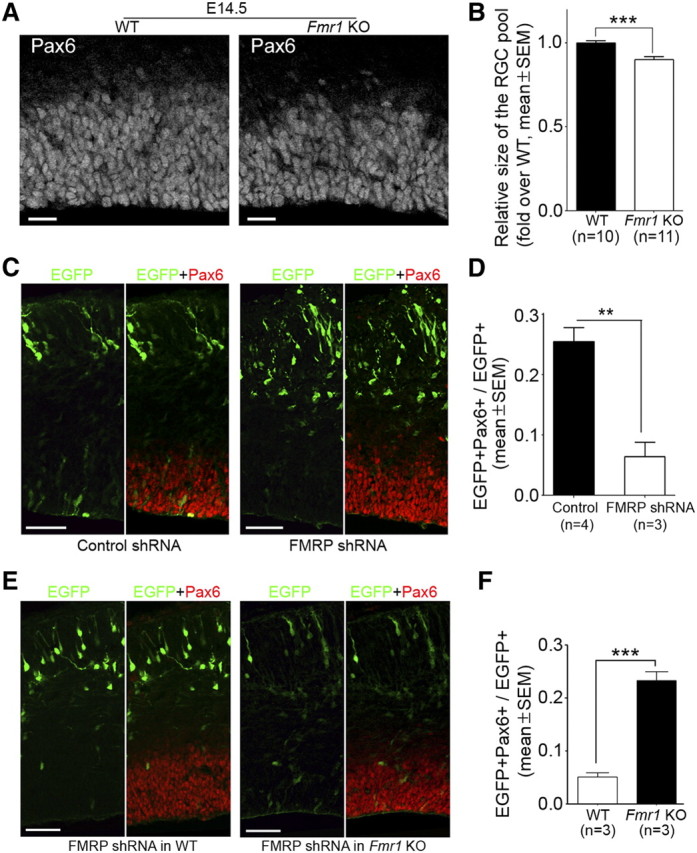
Analysis of the RGC pool in Fmr1 knock-out mouse embryos during early to mid stages of neocortical neurogenesis. A, B, Fmr1 knock-out (KO) mouse embryos exhibit a slight but significant reduction in the number of neocortical RGCs at E14.5. Littermate embryos derived from Fmr1+/− × Fmr1Y/− crossing were killed at E14.5. Forebrain cryosections prepared from these embryos were subjected to antigen retrieval treatment and Pax6 immunostaining. Images of the stained sections were acquired on a laser scanning confocal microscope and used for quantifying the number of RGCs (Pax6+ cells). The quantification was performed in equivalent neocortical regions in rostrocaudal and mediolateral dimensions (three sections for each embryo and a 150 μm mediolateral sector for each section were included for quantification). The number of RGCs in each embryo was compared with the average number of RGCs in littermate wild-type (WT) embryos to obtain a ratio, which reflected the relative size of the RGC pool. A, Representative images. B, Quantification. C, D, Expression of FMRP shRNA during early neocortical neurogenesis results in marked depletion of RGCs in wild-type embryos on the same strain background as Fmr1 knock-out mice. Mouse embryos were coelectroporated with pCAX-EGFP and control shRNA or FMRP shRNA #2 at E11.5 and killed at E14.5. Cryosections of the transfected forebrain hemisphere were prepared for immunostaining and RGC quantification. C, Representative confocal images. D, Quantification. E, F, Expression of FMRP shRNA during early neocortical neurogenesis does not cause apparent depletion of RGCs in Fmr1 knock-out embryos. Fmr1 knock-out embryos or wild-type embryos on the same strain background were coelectroporated with pCAX-EGFP and FMRP shRNA #2 at E11.5 and analyzed at E14.5. E, Representative images. F, Quantification; **p < 0.01, ***p < 0.001, Student's t test. Scale bars: A, 20 μm; C, E, 50 μm.
The mild decrease in RGCs in Fmr1 knock-out embryos contrasted with the severe depletion of RGCs induced by FMRP shRNA. We considered three possible explanations for this difference: (1) the requirement for FMRP in maintaining the RGC pool may depend on strain background (Swiss Webster mice were used for knock-down analysis, whereas congenic mice on the FVB background were used for knock-out analysis); (2) the severe phenotype in knock-down analysis may result from shRNA off-target effects; and (3) Fmr1 knock-out embryos may have developed mechanisms to partially compensate for the loss of FMRP. Introducing FMRP shRNA at E11.5 into the neocortex of wild-type mice on the same strain background as Fmr1 knock-out mice also resulted in marked depletion of RGCs at E14.5 (Fig. 4C,D), although the defect was slightly smaller than that observed in Swiss Webster mice (Fig. 3B, compare Fig. 4D to FMRP shRNA #2). Thus, strain background was unlikely a major cause of the difference between knock-down and knock-out analyses. To distinguish between the second explanation (i.e., shRNA off-target effects) and the third explanation (i.e., compensation in knock-out embryos), we electroporated FMRP shRNA into Fmr1 knock-out embryos at E11.5 and analyzed the RGC pool at E14.5. We reasoned that FMRP shRNA would induce severe depletion of RGCs in Fmr1 knock-out embryos if it did so in wild-type embryos through off-target effects. We found that FMRP shRNA did not affect the size of the RGC pool in Fmr1 knock-out embryos (Fig. 4E,F). These data suggest that FMRP shRNA induces severe depletion of RGCs in wild-type embryos by specifically silencing FMRP and that Fmr1 knock-out embryos have developed compensation mechanisms for maintaining the RGC pool. Functional compensation is not uncommon in knock-out mouse embryos (Deuel et al., 2006; Koizumi et al., 2006; Fasano et al., 2007; Satyanarayana and Kaldis, 2009).
To determine whether FMRP regulates the RGC pool during later stages of neocortical neurogenesis, we electroporated FMRP shRNA into the neocortex of E13.5 Swiss Webster mouse embryos and examined the RGC pool at E17.5, the end stage of neocortical neurogenesis. FMRP shRNA decreased the RGC pool by about twofold (Fig. 5A,B). This defect was considerably smaller than that at earlier stages (Fig. 3B, compare Fig. 5B to FMRP shRNA #2). We then used Pax6 immunostaining to analyze the neocortical RGC pool in E16.5 Fmr1 knock-out mouse embryos and found that they exhibited normal number of Pax6+ cells (Fig. 5C,D). This is consistent with the previous observation that E16.5 Fmr1 knock-out mouse embryos show normal expression of cytoplasmic RGC markers (Tervonen et al., 2009). Thus, the knock-down and knock-out analyses suggest that at later stages of neocortical neurogenesis, although FMRP still regulates the RGC pool, the loss of FMRP can be better tolerated than at earlier stages.
Figure 5.

Effects of FMRP-deficiency on RGCs during mid to late stages of neocortical neurogenesis. A, B, Introducing FMRP shRNA into the neocortex at E13.5 results in a moderate reduction of RGCs. Swiss Webster mouse embryos were coelectroporated with pCAX-EGFP and control shRNA or FMRP shRNA #2 at E13.5 and killed at E17.5. Cryosections of the transfected forebrain hemisphere were prepared for immunostaining and RGC quantification. A, Representative confocal images. Scale bars, 50 μm. B, Quantification; **p < 0.01, Student's t test. C, D, The number of neocortical RGCs in E16.5 Fmr1 knock-out (KO) embryos is not altered. Littermate mouse embryos derived from Fmr1+/− × Fmr1Y/− crossing were killed at E16.5. Forebrain cryosections prepared from these embryos were subjected to antigen retrieval treatment and Pax6 immunostaining. Confocal images of the stained sections were used for quantifying the number of RGCs (Pax6+ cells). The quantification was performed in equivalent neocortical regions in rostrocaudal and mediolateral dimensions (two sections for each embryo and a 150 μm mediolateral sector for each section were included for quantification). The number of RGCs in each embryo was compared with the average number of RGCs in littermate wild-type (WT) embryos to obtain a ratio, which reflected the relative size of the RGC pool. C, Representative images. Scale bars, 20 μm. D, Quantification; p = 0.61, Student's t test.
FMRP shRNA causes increased IPC production at the expense of RGCs
The depletion of RGCs may result from increased cell death or altered cell fate. FMRP knock-down did not cause increased number of RGCs exhibiting condensed nuclei or expressing activated caspase 3 (Fig. 6), an apoptosis marker, suggesting that the depletion of RGCs was likely caused by altered cell fate. Because most IPCs in the embryonic mouse neocortex undergo one terminal division to generate two neurons (Kriegstein and Alvarez-Buylla, 2009), either an RGC-to-neuron or an RGC-to-IPC cell fate change would lead to a decreased number of RGCs and an increased number of neurons after several rounds of cell division. Consistent with this, FMRP knock-down resulted in higher percentages of EGFP+ cells distributed in Tuj1+ neuronal layers (Fig. 7A,B).
Figure 6.

FMRP knock-down does not affect cell death. Swiss Webster mouse embryos were coelectroporated with pCAX-EGFP and either control shRNA or FMRP shRNA #2 at E11.5 and killed at E13.5. Cryosections of the transfected neocortex were subjected to antigen retrieval treatment and then immunostained using an antibody against activated caspase 3. A, Examples of images showing that generally, EGFP+Pax6+ cells neither have condensed nuclei nor express activated caspase 3. Scale bars, 50 μm. B, Quantification of EGFP+Pax6+ cells that are positive for activated caspase 3; p = 0.76, Student's t test.
Figure 7.

Effects of FMRP shRNA on neuronal population and IPCs during early neocortical neurogenesis. Swiss Webster mouse embryos were coelectroporated with pCAX-EGFP and control or FMRP shRNA at E11.5 and killed at E14.5. Cryosections of the transfected neocortex were immunostained using a Tuj1 antibody, a marker for neuronal specific β-III tubulin, or a Tbr2 antibody, a nuclear marker for IPCs. A, B, Expression of FMRP shRNA leads to increased proportion of EGFP+ cells that are distributed in neuronal layers (Tuj1+ layers). Note that the EGFP signal does not completely overlap with the Tuj1 signal, because EGFP is present in all subcellular compartments whereas Tuj1 specifically labels the microtubule cytoskeleton. A, Representative confocal images. Scale bars, 50 μm. B, Quantification; ***p < 0.001, one-way ANOVA. C, D, FMRP shRNA does not significantly affect the proportion of EGFP+ cells that are IPCs (Tbr2+ cells). C, Representative confocal images. Scale bars, 50 μm. D, Quantification; p = 0.13, one-way ANOVA. Note that although FMRP shRNA #2 samples exhibited a trend toward decreased Tbr2+ cells, this decrease did not reach statistical significance.
Interestingly, although the IPC supply (i.e., RGCs) was severely depleted (Fig. 3), the percentage of IPCs was not significantly affected by FMRP knock-down at E14.5 (Fig. 7C,D). Thus, IPCs might be produced at a higher rate from each round of RGC division. To test this possibility, we performed a two-step electroporation assay (Fig. 8A). In this assay, FMRP shRNA and pCAX-EGFP were cotransfected into the neocortex by the first electroporation, pCAX-mCherry was introduced into the same region by the second electroporation 2 d later, and the identity of EGFP+mCherry+ cells was determined after they were allowed to divide once. Immediately following pCAX-mCherry electroporation, EGFP should label cells with reduced levels of FMRP, because FMRP shRNA was coelectroporated with pCAX-EGFP 2 d before, and mCherry should label RGCs because in utero electroporation leads to specific transfection of RGCs (Gal et al., 2006). Therefore, this assay allowed us to determine cell identity after RGCs with reduced levels of FMRP divided once. Because of technical difficulties at earlier stages, the two electroporations were performed at E13.5 and E15.5, respectively, to produce sufficient number of EGFP+ mCherry+ cells. The length of cell cycle at E15.5-E16.5 was ∼20 h (Miyama et al., 1997), and cell identity was therefore determined 24 h after mCherry electroporation. We found that FMRP shRNA significantly decreased RGCs (Pax6+) and significantly increased IPCs (Tbr2+), but did not affect the number of Pax6− Tbr2− cells, which constituted a minor proportion of EGFP+mCherry+ cells and most likely represented just born neurons (Fig. 8B–E). No changes were observed when cell identity was determined only 10 h after mCherry electroporation (control: 87.3 ± 3.0% Pax6+, 22.7 ± 0.5% Tbr2+, mean ± SEM; FMRP shRNA: 87.9 ± 2.0% Pax6+, 24.7 ± 7.4% Tbr2+; p > 0.05 for both Pax6+ and Tbr2+ comparisons, Student's t test). These data suggest that FMRP knock-down leads to an RGC-to-IPC cell fate change.
Figure 8.

FMRP knock-down induces an RGC-to-IPC cell fate change. A, Schematic illustrating the two-step electroporation procedure for in vivo cell fate analysis in a single round of RGC division. In this assay, FMRP shRNA and pCAX-EGFP were cotransfected into the neocortex by the first electroporation, pCAX-mCherry was introduced into the same region by the second electroporation 2 d later, and the identity of EGFP+mCherry+ cells was determined after they were allowed to divide once. Immediately following mCherry electroporation, EGFP should label cells with reduced levels of FMRP, because FMRP shRNA was coelectroporated with pCAX-EGFP 2 d before, and mCherry should label RGCs because in utero electroporation leads to specific transfection of RGCs (Gal et al., 2006). Therefore, this assay allowed us to determine cell identity after RGCs with reduced levels of FMRP divided once. B–E, The two-step electroporation assay reveals an RGC-to-IPC cell fate change caused by FMRP shRNA. FMRP shRNA #2 was used in the first electroporation. The sequential electroporations were performed on Swiss Webster mouse embryos at E13.5 and E15.5, respectively. At earlier stages we were unable to obtain sufficient number of EGFP+mCherry+ cells for quantification because of two reasons: (1) at earlier stages the transfection efficiency we could obtain was relatively low; and (2) at earlier stages significant RGC depletion already occurred in FMRP shRNA samples at the time of the second electroporation. B, Examples of EGFP+mCherry+ cells that express Pax6 (arrows) or Tbr2 (arrowheads). Scale bars, 20 μm. C–E, Quantifications of the percentage of EGFP+mCherry+ cells that are Pax6+ (C), Tbr2+ (D), or Pax6−Tbr2− (E). The sum of these percentages is >100%, because a small proportion of EGFP+mCherry+ cells express both Pax6 and Tbr2; *p < 0.05, ***p < 0.001, Student's t test.
Although because of technical difficulties the two-step electroporation experiment was only performed from E13.5 to E16.5, the observed RGC-to-IPC cell fate change was consistent with the marked increase in the IPC/RGC ratio in single electroporation experiments performed from E11.5 to E14.5 (control: IPC/RGC = 0.47 ± 0.02, mean ± SEM; FMRP shRNA #2: IPC/RGC = 3.3 ± 0.82; p < 0.05, Student's t test). Thus, FMRP likely functions to suppress the RGC-to-IPC transition at both earlier and later stages of neocortical neurogenesis.
FMRP maintains the RGC pool by regulating the actin cytoskeleton
Previous studies indicate that FMRP may regulate neuronal function by an actin-dependent mechanism (Schenck et al., 2003; Reeve et al., 2005). In neocortical neural stem cells, F-actin forms a distinct ring-like structure at the apical endfeet (Chenn et al., 1998). Thus, we were interested in whether FMRP-deficiency might affect this F-actin structure. Using three-dimensional (3D) reconstructed confocal images of phalloidin-stained cryosections, we were able to observe the ring-like F-actin structure at the ventricular surface (Fig. 9A). However, our attempt to unequivocally identify the ring-like structure in individual transfected cells was unsuccessful. Because RGCs closely contact each other at the apical endfeet, each F-actin bundle visualized by phalloidin staining should be comprised of two parts that belong to two neighboring cells, and the border between these two parts is unclear (Fig. 9A). Thus, each F-actin bundle surrounding the endfoot of a transfected cell partially belongs to the transfected cell and partially belongs to a neighboring nontransfected cell, and we were unable to determine exactly which part of the F-actin bundle belongs to the transfected cell. This was the case regardless of whether we used E13.5 mouse embryos (electroporated at E11.5) (data not shown) or E16.5 mouse embryos (electroporated at E13.5) (Fig. 9A) in which EGFP was usually expressed at higher levels than at earlier stages. To overcome this problem, we used Lifeact-EGFP (Riedl et al., 2008, 2010), a fusion protein comprised of an F-actin binding domain and EGFP, to visualize the ring-like F-actin structure in transfected RGCs (Fig. 9B). Lifeact-EGFP preferentially binds F-actin without interfering with actin dynamics and therefore faithfully reveals the actin cytoskeleton both in cultured cells and in mice (Riedl et al., 2008, 2010). We coelectroporated control or FMRP shRNA with a plasmid for expressing Lifeact-EGFP at E11.5 and examined the distribution pattern of Lifeact-EGFP at E13.5. Because only transfected cells would express Lifeact-EGFP, F-actin bundles in the endfeet of individual transfected cells could be clearly identified. We measured the ratio of the fluorescence intensity of the ring-like structure over the background fluorescence intensity (the diffuse Lifeact-EGFP signal in the shaft of the apical process was used as the background fluorescence). This ratio was significantly reduced in RGCs expressing FMRP shRNA compared with the control (Fig. 9C,D). To determine whether the altered ratio might result from different expression levels of Lifeact-EGFP, we used a scatter plot to assess the correlation between the ratio and the background fluorescence intensity. We found that there was essentially no correlation (R2 = 0.0246) (Fig. 9E). Thus, FMRP shRNA affects the pattern of Lifeact-EGFP distribution in the endfeet of RGCs independently of Lifeact-EGFP expression levels. Because Lifeact-EGFP faithfully reveals the F-actin cytoskeleton (Riedl et al., 2008, 2010), these data suggest that FMRP knock-down may impair F-actin formation in RGCs.
Figure 9.

FMRP shRNA impairs F-actin formation in neocortical RGCs. A, Difficulty in identifying the ring-like F-actin structure in individual transfected cells by phalloidin staining. Neocortical cryosections were prepared from E16.5 mouse embryos electroporated with control shRNA and pCAX-EGFP at E13.5. The sections were stained with an anti-GFP antibody and phalloidin. Top, A 3D reconstructed confocal image that is rotated to show the F-actin ring-like structure at the ventricular surface. Bottom, One of the Z-series images used for the 3D reconstruction. F-actin bundles can be clearly seen. However, each F-actin bundle should be comprised of two parts that belong to two neighboring RGCs, and the border between these two parts cannot be unequivocally identified. For instance, the F-actin bundle indicated by arrows partially belongs to the transfected cell (EGFP+) and partially belongs to an adjacent nontransfected cell. Exactly which part of the F-actin bundle belongs to the transfected cell is unclear. B, Lifeact-EGFP specifically labels the ring-like F-actin structure in the apical endfeet of RGCs. pCAX-Lifeact-EGFP was electroporated into the neocortex at E12.5, and the localization of Lifeact-EGFP was analyzed at E13.5. F-actin was labeled by phalloidin. Z-series confocal images of the stained sections were acquired on a laser scanning confocal microscope. These images were then stacked and rotated to show the ring-like F-actin structure at the ventricular surface. C–E, FMRP shRNA reduces the fluorescence intensity of the Lifeact-EGFP-labeled ring-like F-actin structure at the apical endfeet (C, arrowheads). Swiss Webster mouse embryos were coelectroporated with pCAX-Lifeact-EGFP, pCAX-mCherry, and either control shRNA or FMRP shRNA #2 at E11.5. mCherry was used to facilitate the identification of transfected cells. Cryosections were prepared from the electroporated mouse embryos at E13.5. Z-series confocal images of the apical process of transfected RGCs were acquired on a laser scanning confocal microscope. These images were 3D reconstructed to show the Lifeact-EGFP labeled ring-like structure. The relative fluorescence intensity of this ring-like structure was measured using the diffuse Lifeact-EGFP fluorescence in the shaft of the apical process as background fluorescence. C, Representative stacked confocal images of the apical process of transfected RGCs. D, Quantification of the relative fluorescence intensity of the ring-like structure; ***p < 0.001, Student's t test. E, The effect of FMRP shRNA on Lifeact-EGFP labeling of the ring-like F-actin structure cannot be explained by expression levels of Lifeact-EGFP. The scatter plot shows that there is essentially no correlation (R2 = 0.0246) between the relative fluorescence intensity of the Lifeact-EGFP labeled ring-like structure and the fluorescence intensity of the diffuse background Lifeact-EGFP. Scale bars: A, 2 μm; B, C, 5 μm.
In Drosophila, dFmr1 (ortholog of FMRP) genetically interacts with profilin (Reeve et al., 2005), a core actin-regulatory protein that promotes F-actin formation (Birbach, 2008). Thus we were interested in whether overexpressing profilin could rescue FMRP shRNA-induced RGC defects. Although profilin and dFmr1 function antagonistically in Drosophila neurons (Reeve et al., 2005), different mechanisms of the interaction may exist in other tissues. For instance, the genetic interaction between dFmr1 and dRac1 (Lee et al., 2003; Schenck et al., 2003) and that between dFmr1 and aPKCζ (Zarnescu et al., 2005) are either antagonistic or synergistic, depending on the cellular contexts. Thus we coelectroporated FMRP shRNA with pCAX-Pfn1, a plasmid for overexpressing mouse profilin 1 (Pfn1), into mouse embryos at E11.5 and quantified the population of RGCs at E14.5. Strikingly, the FMRP shRNA-induced RGC depletion was largely rescued by pCAX-Pfn1 (Fig. 10A,B).
Figure 10.
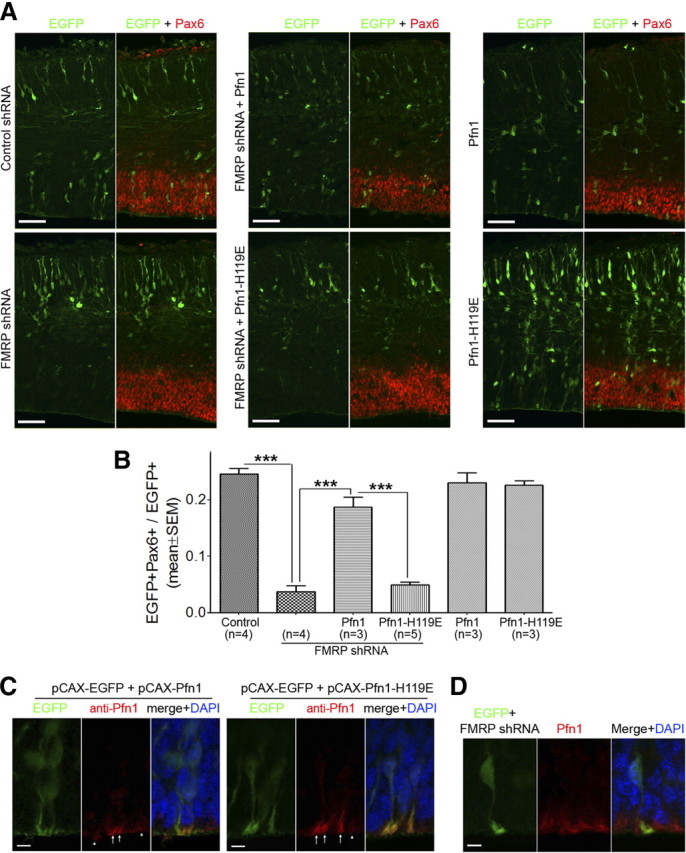
Rescue of FMRP shRNA-induced RGC depletion by Pfn1 overexpression. A, B, Overexpressing Pfn1, but not Pfn1–H119E, largely rescues FMRP shRNA-induced RGC depletion. Swiss Webster mouse embryos were coelectroporated with pCAX-EGFP and the indicated plasmid at E11.5 and killed at E14.5. Cryosections of the electroporated embryos were prepared for Pax6 immunostaining and RGC quantification. A, Representative images. Scale bars, 50 μm. B, Quantification; ***p < 0.001, one-way ANOVA. Coelectroporation of pCAX-Pfn1, but not pCAX-Pfn1–H119E, with FMRP shRNA #2 restored the proportion of Pax6+ cells close to that of the control shRNA group. pCAX-Pfn1 and pCAX-Pfn1–H119E did not affect the proportion of Pax6+ cells when electroporated with pCAX-EGFP alone. C, Wild-type Pfn1 and Pfn1–H119E exhibit similar expression and localization in neocortical RGCs. Mouse embryos were coelectroporated with pCAX-EGFP and pCAX-Pfn1 or pCAX-EGFP and pCAX-Pfn1–H119E at E11.5 and killed at E14.5. Cryosections of electroporated embryos were subjected to antigen retrieval treatment and then costained with antibodies against GFP, Pax6, and Pfn1. The Pfn1 immunoreactivity is relatively higher around the ventricular surface in both nontransfected cells (arrowheads) and transfected cells (arrows). Moreover, the Pfn1-immunoreactivity at the apical endfeet of transfected cells was higher than that in nearby nontransfected cells. Thus, the Pfn1 immunoreactivity is likely specific. Similar pattern and intensity of Pfn1-immunoreactivity are observed in cells transfected with pCAX-Pfn1 and in cells transfected with pCAX-Pfn1–H119E. Scale bars, 5 μm. D, FMRP knock-down does not affect the expression or localization of Pfn1. Mouse embryos were coelectroporated with pCAX-EGFP and FMRP shRNA #2 at E11.5 and killed at E13.5. Cryosections of electroporated embryos were subjected to antigen retrieval treatment and then costained with antibodies against GFP, Pax6, and Pfn1. The pattern and intensity of Pfn1-immunoreactivity in the apical endfeet of transfected cells were similar to that in nearby nontransfected cells. Scale bars, 5 μm.
We were unable to use Lifeact-EGFP to determine whether overexpressing Pfn1 rescued the FMRP shRNA-induced F-actin defect, because simultaneous overexpression of Pfn1 and Lifeact-EGFP resulted in the absence of distinct ring-like structures in the apical endfeet (data not shown). Nonetheless, we found that the H119E mutation, which specifically impairs the actin-binding activity of Pfn1 (Suetsugu et al., 1998), abolished the rescue of RGC depletion by Pfn1 (Fig. 10A,B). The wild-type Pfn1 and the mutant Pfn1-H119E exhibited similar expression and localization in RGCs (Fig. 10C) and did not affect the RGC pool when overexpressed alone (Fig. 10A,B). These data suggest that Pfn1 rescues the FMRP shRNA-induced RGC depletion by correcting the actin defect.
FMRP may control actin organization by enhancing the translation of Pfn1 or by regulating the translation of other genes important for F-actin formation. Anti-Pfn1 immunostaining analysis revealed that FMRP knock-down did not affect the expression of Pfn1 in RGCs (Fig. 10D), suggesting that FMRP may regulate the translation of other genes important for actin organization in RGCs.
Several actin-dependent cellular mechanisms may control the cell fate decision of RGC divisions, including the regulation of apical polarity, interkinetic nuclear migration, and cleavage plane (Farkas and Huttner, 2008; Fish et al., 2008; Kriegstein and Alvarez-Buylla, 2009). RGCs expressing FMRP shRNA showed detachment of the apical process from the ventricular surface (Fig. 11), but no defect in interkinetic nuclear migration (Fig. 12A,B) or cleavage plane (Fig. 12C,D). Therefore, the disruption of apical polarity may contribute to the FMRP knock-down-induced RGC depletion.
Figure 11.

FMRP knock-down causes an apical detachment defect that can be rescued by overexpressing Pfn1. Mouse embryos were electroporated at E11.5 and killed at E14.5. Cryosections prepared from electroporated mouse embryos were costained with antibodies against GFP, Pax6, and Tbr2. Z-series confocal images of the stained sections were acquired on a laser scanning confocal microscope. These images were then examined, both individually and in a 3D reconstructed form (21 μm on the z-axis) to determine the apical end of transfected Pax6+Tbr2− cells. The distance between the apical end of these cells (arrows) and the ventricular surface (outlined by dashed lines) was measured. An increase in the distance would indicate that more cells were detached from the ventricular surface. A, Representative stacked Z-series confocal images. Scale bars, 10 μm. B, Quantification. FMRP shRNA #2 caused a marked increase in the distance, and the increase was restored close to the control group by Pfn1 but not Pfn1–H119E; **p < 0.01, ***p < 0.001, one-way ANOVA.
Figure 12.

FMRP shRNA does not affect interkinetic nuclear migration or cleavage plane of RGCs. Swiss Webster mouse embryos were electroporated with control shRNA or FMRP shRNA #2 at E11.5 and killed at E13.5. The embryos were killed at E13.5 because no mitotic transfected RGCs could be detected in most transfected neocortical sectors in Fmr1 shRNA samples at E14.5 (data not shown). Cryosections of electroporated embryos were subjected to antigen retrieval treatment and then immunostained with antibodies against GFP, Ser10-phophorylated histone H3 (PH3, marker for mitotic cells), and Tbr2. A, B, FMRP knock-down does not affect interkinetic nuclear migration. The distance between the nuclei of transfected PH3+Tbr2− cells, which should be mitotic RGCs, and the ventricular surface was measured. An increase in the distance would indicate an interkinetic nuclear migration defect (i.e., impaired migration of the nuclei toward the ventricular surface immediately preceding mitosis). A, Representative images showing PH3+Tbr2− nuclei of transfected cells at the ventricular surface. Scale bars, 5 μm. B, Quantification; p = 0.23, Student's t test. C, D, FMRP shRNA does not affect the cleavage plane of RGCs. The cleavage plane of transfected PH3+Tbr2− cells, which should be mitotic RGCs, was measured. C, Representative images showing cleavage plane measurement. Scale bars, 5 μm. Quantification; p = 0.37, Student's t test.
Discussion
The RGC-to-IPC transition, a key step in neuronal production from RGCs, may underlie the evolutionary expansion of the cerebral cortex (Fish et al., 2008; Kriegstein and Alvarez-Buylla, 2009). Here, we identify an FMRP-dependent mechanism that controls this transition. FMRP is present in RGCs at relatively high levels in the embryonic mouse neocortex (Fig. 1). Knock-down of FMRP causes RGC depletion (Figs. 2–4), possibly due to an RGC-to-IPC cell fate change (Fig. 8). Examination of cells expressing Lifeact-EGFP suggests that FMRP knock-down may alter actin organization in RGCs (Fig. 9). Overexpression of Pfn1, but not a mutant Pfn1 deficient in actin binding, largely rescues the FMRP knock-down-induced RGC depletion (Fig. 10). Together, these data suggest that FMRP suppresses the transition from RGCs to IPCs during neocortical development by regulating the actin cytoskeleton.
Our study has revealed a novel function for FMRP in neocortical development, i.e., the control of RGC-to-IPC transition. A role for FMRP in RGCs during neocortical development has not been previously suspected, largely because of the relatively normal size and organization of the brain in Fmr1 knock-out mice. However, gene functions are often masked in knock-out mice due to compensation, which may be better avoided when the protein is acutely lost or inhibited (Deuel et al., 2006; Koizumi et al., 2006; Fasano et al., 2007; Satyanarayana and Kaldis, 2009). Therefore, we used shRNA-mediated acute knock-down to investigate the function of FMRP in RGCs. We found that FMRP shRNA caused severe RGC depletion during early neocortical neurogenesis. This depletion likely resulted from specific FMRP knock-down but not off-target effects. First, two different FMRP shRNAs led to similar defects (Fig. 3). Second, the defect was rescued by coexpressing wild-type FMRP, but not a null mutant of FMRP (Fig. 3). Third, FMRP shRNA did not affect the size of the RGC pool in Fmr1 knock-out embryos (Fig. 4). These data suggest that FMRP is important for maintaining the RGC pool during neocortical development.
An alternative explanation for the decreased RGC population among EGFP+ cells in our knock-down analysis is that FMRP shRNA does not change RGC cell fate, but increases the rate of neuronal production from RGCs. Increased neuronal production per se could result in the apparent decrease of RGCs among EGFP+ cells. This explanation would be consistent with the previous observation that FMRP deficiency leads to increased neuronal production in cultured neurospheres (Castrén et al., 2005). We do not rule out the possibility that FMRP knock-down may lead to an increased rate of neuronal production independent of RGC cell fate change. However, when the electroporation was performed at E11.5, the expression of FMRP shRNA #2 often resulted in the absence of RGCs in many transfected neocortical sectors at E14.5 (data not shown). This suggests that, regardless of whether increased neuronal production independent of RGC cell fate change is involved, FMRP knock-down leads to the loss of RGC cell fate.
In contrast to the severe depletion of RGCs in the knock-down experiments, the size of the neocortical RGC pool in Fmr1 knock-out mouse embryos was only slightly decreased at E14.5 (Fig. 4) and not decreased at E16.5 (Fig. 5). We considered several possibilities for this discrepancy. First, strain background may affect the requirement for FMRP in maintaining the RGC pool. In wild-type mice on the same strain background as Fmr1 knock-out mice, FMRP shRNA caused marked depletion of RGCs, although the depletion was slightly less severe than that observed in Swiss Webster mice (Fig. 3B, compare Fig. 4D to FMRP shRNA #2). Thus, strain background may only be a minor contributing factor. Second, shRNA off-target effects may lead to more severe defects in knock-down experiments. However, this possibility could be ruled out by the various controls in our experiments, including the use of two different shRNAs, the rescue of the defect by coexpressing FMRP but not FMRP-I304N, and the absence of FMRP shRNA-induced defect in Fmr1 knock-out embryos. Third, partial loss of FMRP induced by FMRP shRNA may be more detrimental than complete loss of FMRP in Fmr1 knock-out mice. We do not favor this possibility because, of the two FMRP shRNAs used in this study, the severity of the RGC depletion positively correlates with the degree of FMRP knock-down (compare Figs. 2C, 3B). Last, the loss of FMRP may be largely compensated for by its homologs in Fmr1 knock-out mouse embryos but not in wild-type mouse embryos electroporated with FMRP shRNA. We favor this possibility, because previous studies have shown that functional compensation commonly occurs during development when the gene is constitutively deleted but not when the protein is acutely lost or inhibited (Deuel et al., 2006; Koizumi et al., 2006; Fasano et al., 2007; Satyanarayana and Kaldis, 2009). Two close homologs of FMRP, FXR1 and FXR2, have been identified in mice. These three proteins have similar domain structures and interact with each other (Zhang et al., 1995). Behavioral analysis of Fmr1 Fxr2 double knock-out mice suggests that the loss of FMRP may be partially compensated for by FXR2 (Spencer et al., 2006), although the mechanism of compensation remains unclear. Whether FXR1 regulates brain development and compensates for the loss of FMRP is also unknown. However, in situ hybridization data from gene expression databases (Image 30393 from GENSAT, g02525 from BGEM, and EN473 from GenePaint) suggest that during neocortical neurogenesis FXR1 is expressed at relatively high levels in the ventricular zone, a region mainly comprised of neural stem cells. Furthermore, analysis of skeletal and cardiac muscles in Fxr1 knock-out mouse embryos has revealed actin defects in these tissues (Mientjes et al., 2004). Given that actin defects appear to be largely responsible for the FMRP shRNA-induced depletion of RGCs (Figs. 9, 10), FXR1 may cooperate with FMRP to regulate actin in RGCs during neocortical neurogenesis. This possibility can be tested by future analysis of Fmr1 Fxr1 double knock-out mouse embryos.
In both knock-down and knock-out analyses, the loss of FMRP was more detrimental to RGCs at earlier stages of neocortical neurogenesis than at later stages. The RGC depletion induced by FMRP shRNA #2 was much more pronounced when the knock-down experiment was performed from E11.5 to E14.5 (Fig. 3B) than from E13.5 to E17.5 (Fig. 5B). Correspondingly, Fmr1 knock-out mouse embryos showed a significant reduction in the size of the RGC pool at E14.5 (Fig. 4A,B) but not at E16.5 (Fig. 5C,D). One possible cause for this stage-dependent effect may be that maintaining the RGC pool at earlier stages is more dependent on precise regulation of actin than at later stages. In addition, a developmental delay resulting from FMRP deficiency may be a contributing factor. The ventricular zone thickness, which should reflect the size of the RGC pool, increases in the mouse neocortex from E11.5 to E13.5, stays unchanged at E13.5-E14.5, and decreases from E14.5 to E16.5 (Miyama et al., 1997). Thus, a developmental delay per se could result in decreased number of RGCs at earlier stages but increased number of RGCs at later stages, thereby exacerbating the RGC depletion phenotype at earlier stages but ameliorating the RGC depletion phenotype at later stages.
Interestingly, whereas our study revealed that FMRP-deficiency led to depletion of RGCs in the embryonic mouse neocortex, previous studies showed that FMRP deficiency resulted in increased number of neural stem cells in the Drosophila larval brain (Callan et al., 2010) and in the adult mouse brain (Luo et al., 2010). This may be explained by the different mechanisms underlying neural stem cell proliferation in different tissues. For instance, the cell polarity and the role of nuclear migration and cleavage plane in RGCs are different from those in Drosophila embryonic neural stem cells and those in adult mammalian neural stem cells (Farkas and Huttner, 2008; Kriegstein and Alvarez-Buylla, 2009).
The increased production of IPCs at the expense of RGCs may affect the overall production of neurons during the entire neurogenesis period and consequently the size of the neocortex. On one hand, premature depletion of RGCs could lead to reduced overall neuronal production and therefore a smaller neocortex. On the other hand, a larger pool of IPCs could lead to increased overall neuronal production and therefore a larger neocortex. Even though most IPCs in rodents undergo only one division to produce two neurons, IPCs in primates may divide multiple times (Kriegstein and Alvarez-Buylla, 2009). Thus the effect of altered RGC-to-IPC transition on the size of the human neocortex may be complex. Magnetic resonance imaging analysis of FXS patients has revealed widespread bidirectional brain volume changes (Gothelf et al., 2008). Altered RGC-to-IPC transition may contribute to these changes.
Our data (Figs. 9–11) suggest that FMRP maintains the RGC pool at least partially by regulating actin organization in the apical endfeet. F-actin is a core component of adherens junctions, which connect neighboring RGCs at the apical endfeet and support the apical polarity of RGCs. Thus, FMRP may regulate RGCs by controlling the expression and/or localization of proteins important for actin organization at adherens junctions. However, considering that FMRP is also concentrated at the basal endfeet (Fig. 1B,C), additional mechanisms are likely involved.
Footnotes
This work was supported by grants from Boston University to Z.X. We thank L. H. Tsai and I. Delalle for confocal microscopy support, F. B. Gertler for providing the pCAX-EGFP, pCAX-mCherry, and pCAX-Lifeact-EGFP plasmids, and E. M. Pinheiro for critical reading of the manuscript. The Pax6 antibody developed by A. Kawakami and the FMRP antibody 7G1-1 developed by S. T. Warren were obtained from the Developmental Studies Hybridoma Bank, developed under the auspices of the National Institute of Child Health and Human Development, and maintained by the University of Iowa, Department of Biology, Iowa City, IA 52242.
References
- Bassell GJ, Warren ST. Fragile X syndrome: loss of local mRNA regulation alters synaptic development and function. Neuron. 2008;60:201–214. doi: 10.1016/j.neuron.2008.10.004. [DOI] [PMC free article] [PubMed] [Google Scholar]
- Birbach A. Profilin, a multi-modal regulator of neuronal plasticity. Bioessays. 2008;30:994–1002. doi: 10.1002/bies.20822. [DOI] [PubMed] [Google Scholar]
- Callan MA, Cabernard C, Heck J, Luois S, Doe CQ, Zarnescu DC. Fragile X protein controls neural stem cell proliferation in the Drosophila brain. Hum Mol Genet. 2010;19:3068–3079. doi: 10.1093/hmg/ddq213. [DOI] [PMC free article] [PubMed] [Google Scholar]
- Castrén M, Tervonen T, Kärkkäinen V, Heinonen S, Castrén E, Larsson K, Bakker CE, Oostra BA, Akerman K. Altered differentiation of neural stem cells in fragile X syndrome. Proc Natl Acad Sci U S A. 2005;102:17834–17839. doi: 10.1073/pnas.0508995102. [DOI] [PMC free article] [PubMed] [Google Scholar]
- Chenn A, Zhang YA, Chang BT, McConnell SK. Intrinsic polarity of mammalian neuroepithelial cells. Mol Cell Neurosci. 1998;11:183–193. doi: 10.1006/mcne.1998.0680. [DOI] [PubMed] [Google Scholar]
- Deuel TA, Liu JS, Corbo JC, Yoo SY, Rorke-Adams LB, Walsh CA. Genetic interactions between doublecortin and doublecortin-like kinase in neuronal migration and axon outgrowth. Neuron. 2006;49:41–53. doi: 10.1016/j.neuron.2005.10.038. [DOI] [PubMed] [Google Scholar]
- Farkas LM, Huttner WB. The cell biology of neural stem and progenitor cells and its significance for their proliferation versus differentiation during mammalian brain development. Curr Opin Cell Biol. 2008;20:707–715. doi: 10.1016/j.ceb.2008.09.008. [DOI] [PubMed] [Google Scholar]
- Fasano CA, Dimos JT, Ivanova NB, Lowry N, Lemischka IR, Temple S. shRNA knock-down of Bmi-1 reveals a critical role for p21-Rb pathway in NSC self-renewal during development. Cell Stem Cell. 2007;1:87–99. doi: 10.1016/j.stem.2007.04.001. [DOI] [PubMed] [Google Scholar]
- Fish JL, Dehay C, Kennedy H, Huttner WB. Making bigger brains–the evolution of neural-progenitor-cell division. J Cell Sci. 2008;121:2783–2793. doi: 10.1242/jcs.023465. [DOI] [PubMed] [Google Scholar]
- Gal JS, Morozov YM, Ayoub AE, Chatterjee M, Rakic P, Haydar TF. Molecular and morphological heterogeneity of neural precursors in the mouse neocortical proliferative zones. J Neurosci. 2006;26:1045–1056. doi: 10.1523/JNEUROSCI.4499-05.2006. [DOI] [PMC free article] [PubMed] [Google Scholar]
- Gothelf D, Furfaro JA, Hoeft F, Eckert MA, Hall SS, O'Hara R, Erba HW, Ringel J, Hayashi KM, Patnaik S, Golianu B, Kraemer HC, Thompson PM, Piven J, Reiss AL. Neuroanatomy of fragile X syndrome is associated with aberrant behavior and the fragile X mental retardation protein (FMRP) Ann Neurol. 2008;63:40–51. doi: 10.1002/ana.21243. [DOI] [PMC free article] [PubMed] [Google Scholar]
- Koizumi H, Tanaka T, Gleeson JG. Doublecortin-like kinase functions with doublecortin to mediate fiber tract decussation and neuronal migration. Neuron. 2006;49:55–66. doi: 10.1016/j.neuron.2005.10.040. [DOI] [PubMed] [Google Scholar]
- Kriegstein A, Alvarez-Buylla A. The glial nature of embryonic and adult neural stem cells. Annu Rev Neurosci. 2009;32:149–184. doi: 10.1146/annurev.neuro.051508.135600. [DOI] [PMC free article] [PubMed] [Google Scholar]
- Lee A, Li W, Xu K, Bogert BA, Su K, Gao FB. Control of dendritic development by the Drosophila fragile X-related gene involves the small GTPase Rac1. Development. 2003;130:5543–5552. doi: 10.1242/dev.00792. [DOI] [PubMed] [Google Scholar]
- Luo Y, Shan G, Guo W, Smrt RD, Johnson EB, Li X, Pfeiffer RL, Szulwach KE, Duan R, Barkho BZ, Li W, Liu C, Jin P, Zhao X. Fragile X mental retardation protein regulates proliferation and differentiation of adult neural stem/progenitor cells. PLoS Genet. 2010;6:e1000898. doi: 10.1371/journal.pgen.1000898. [DOI] [PMC free article] [PubMed] [Google Scholar]
- Mientjes EJ, Willemsen R, Kirkpatrick LL, Nieuwenhuizen IM, Hoogeveen-Westerveld M, Verweij M, Reis S, Bardoni B, Hoogeveen AT, Oostra BA, Nelson DL. Fxr1 knockout mice show a striated muscle phenotype: implications for Fxr1p function in vivo. Hum Mol Genet. 2004;13:1291–1302. doi: 10.1093/hmg/ddh150. [DOI] [PubMed] [Google Scholar]
- Miyama S, Takahashi T, Nowakowski RS, Caviness VS., Jr A gradient in the duration of the G1 phase in the murine neocortical proliferative epithelium. Cereb Cortex. 1997;7:678–689. doi: 10.1093/cercor/7.7.678. [DOI] [PubMed] [Google Scholar]
- Reeve SP, Bassetto L, Genova GK, Kleyner Y, Leyssen M, Jackson FR, Hassan BA. The Drosophila fragile X mental retardation protein controls actin dynamics by directly regulating profilin in the brain. Curr Biol. 2005;15:1156–1163. doi: 10.1016/j.cub.2005.05.050. [DOI] [PubMed] [Google Scholar]
- Riedl J, Crevenna AH, Kessenbrock K, Yu JH, Neukirchen D, Bista M, Bradke F, Jenne D, Holak TA, Werb Z, Sixt M, Wedlich-Soldner R. Lifeact: a versatile marker to visualize F-actin. Nat Methods. 2008;5:605–607. doi: 10.1038/nmeth.1220. [DOI] [PMC free article] [PubMed] [Google Scholar]
- Riedl J, Flynn KC, Raducanu A, Gärtner F, Beck G, Bösl M, Bradke F, Massberg S, Aszodi A, Sixt M, Wedlich-Söldner R. Lifeact mice for studying F-actin dynamics. Nat Methods. 2010;7:168–169. doi: 10.1038/nmeth0310-168. [DOI] [PubMed] [Google Scholar]
- Satyanarayana A, Kaldis P. Mammalian cell-cycle regulation: several Cdks, numerous cyclins and diverse compensatory mechanisms. Oncogene. 2009;28:2925–2939. doi: 10.1038/onc.2009.170. [DOI] [PubMed] [Google Scholar]
- Schenck A, Bardoni B, Langmann C, Harden N, Mandel JL, Giangrande A. CYFIP/Sra-1 controls neuronal connectivity in Drosophila and links the Rac1 GTPase pathway to the fragile X protein. Neuron. 2003;38:887–898. doi: 10.1016/s0896-6273(03)00354-4. [DOI] [PubMed] [Google Scholar]
- Spencer CM, Serysheva E, Yuva-Paylor LA, Oostra BA, Nelson DL, Paylor R. Exaggerated behavioral phenotypes in Fmr1/Fxr2 double knockout mice reveal a functional genetic interaction between Fragile X-related proteins. Hum Mol Genet. 2006;15:1984–1994. doi: 10.1093/hmg/ddl121. [DOI] [PubMed] [Google Scholar]
- Suetsugu S, Miki H, Takenawa T. The essential role of profilin in the assembly of actin for microspike formation. EMBO J. 1998;17:6516–6526. doi: 10.1093/emboj/17.22.6516. [DOI] [PMC free article] [PubMed] [Google Scholar]
- Tervonen TA, Louhivuori V, Sun X, Hokkanen ME, Kratochwil CF, Zebryk P, Castrén E, Castrén ML. Aberrant differentiation of glutamatergic cells in neocortex of mouse model for fragile X syndrome. Neurobiol Dis. 2009;33:250–259. doi: 10.1016/j.nbd.2008.10.010. [DOI] [PubMed] [Google Scholar]
- Walantus W, Castaneda D, Elias L, Kriegstein A. In utero intraventricular injection and electroporation of E15 mouse embryos. J Vis Exp. 2007;6:239. doi: 10.3791/239. [DOI] [PMC free article] [PubMed] [Google Scholar]
- Zang JB, Nosyreva ED, Spencer CM, Volk LJ, Musunuru K, Zhong R, Stone EF, Yuva-Paylor LA, Huber KM, Paylor R, Darnell JC, Darnell RB. A mouse model of the human Fragile X syndrome I304N mutation. PLoS Genet. 2009;5:e1000758. doi: 10.1371/journal.pgen.1000758. [DOI] [PMC free article] [PubMed] [Google Scholar]
- Zarnescu DC, Jin P, Betschinger J, Nakamoto M, Wang Y, Dockendorff TC, Feng Y, Jongens TA, Sisson JC, Knoblich JA, Warren ST, Moses K. Fragile X protein functions with lgl and the par complex in flies and mice. Dev Cell. 2005;8:43–52. doi: 10.1016/j.devcel.2004.10.020. [DOI] [PubMed] [Google Scholar]
- Zhang Y, O'Connor JP, Siomi MC, Srinivasan S, Dutra A, Nussbaum RL, Dreyfuss G. The fragile X mental retardation syndrome protein interacts with novel homologs FXR1 and FXR2. EMBO J. 1995;14:5358–5366. doi: 10.1002/j.1460-2075.1995.tb00220.x. [DOI] [PMC free article] [PubMed] [Google Scholar]