

Abstract
The detection of differences between predictions and actual outcomes is important for associative learning and for selecting actions according to their potential future reward. There are reports that tonically active neurons (TANs) in the primate striatum may carry information about errors in the prediction of rewards. However, this property seems to be expressed in classical conditioning tasks but not during performance of an instrumental task. To address this issue, we recorded the activity of TANs in the putamen of two monkeys performing an instrumental task in which probabilistic rewarding outcomes were contingent on an action in block-design experiments. Behavioral evidence suggests that animals adjusted their performance according to the level of probability for reward on each trial block. We found that the TAN response to reward was stronger as the reward probability decreased; this effect was especially prominent on the late component of the pause–rebound pattern of typical response seen in these neurons. The responsiveness to reward omission was also increased with increasing reward probability, whereas there were no detectable effects on responses to the stimulus that triggered the movement. Overall, the modulation of TAN responses by reward probability appeared relatively weak compared with that observed previously in a probabilistic classical conditioning task using the same block design. These data indicate that instrumental conditioning was less effective at demonstrating prediction error signaling in TANs. We conclude that the sensitivity of the TAN system to reward probability depends on the specific learning situation in which animals experienced the stimulus–reward associations.
Introduction
The ability to predict rewarding outcomes is essential for learning and consolidation of stimulus–response associations. Neurophysiological studies in animals indicate that midbrain dopamine neurons seem to detect the extent to which rewards occur differently than predicted, thus coding an error in the prediction of reward that is critical to associative learning (Schultz, 2002). Functional brain imaging studies have identified prediction error-related activity in target structures of dopamine neurons, especially the striatum (Knutson et al., 2000; Pagnoni et al., 2002; McClure et al., 2003; O'Doherty et al., 2003, 2004; Schönberg et al., 2007). However, it remains unclear whether striatal neurons encode this type of prediction error (Schultz and Dickinson, 2000; Niv and Schoenbaum, 2008; Roesch et al., 2010), although it was recently reported that the activity of a group of striatal neurons in rats, presumed projection neurons, was linked to discrepancies between outcomes and their predictions, which suggests a coding of prediction error (Oyama et al., 2010). Single-neuron recording studies in monkeys have also implicated the changes in activity of a particular class of striatal neurons, termed tonically active neurons (TANs) and thought to be cholinergic interneurons, as a possible neuronal substrate of the prediction error signal (Joshua et al., 2008; Apicella et al., 2009). However, as in the study by Oyama et al. (2010), these findings were reported in Pavlovian (i.e., classical) conditioning in which no behavioral response is required for reward, whereas no evidence of prediction error signaling has been observed during an instrumental task in which the rewarding outcome depends on an action (Morris et al., 2004). Thus, an intriguing question is whether the processing of prediction error signals by TANs occurs preferentially in specific learning situations.
In our previous study, we showed that some TANs responded to reward and no reward with decreases and increases in firing, respectively (Apicella et al., 2009). These opposite response patterns may reflect positive and negative errors in prediction of reward, consistent with the rules of temporal difference models of associative learning (Schultz et al., 1997; Dayan and Balleine, 2002; Montague and Berns, 2002). However, Joshua et al. (2008) reported that both reward delivery and omission produced the same response pattern, suggesting that TAN responses cannot be described as encoding a full reward-prediction error. To account for these different findings, we considered the possibility that the testing procedures in which animals experienced changes in reward probability may introduce limitations on the encoding properties of TANs.
The goal of this study was to examine the sensitivity of TANs to probability of instrumentally delivered reward. Our findings provide evidence that the responsiveness of TANs to reward delivery and omission was dependent on probability during instrumental task performance. However, TANs appeared less involved in signaling reward-prediction errors in this form of learning than has been reported previously in classical conditioning, suggesting that TAN expression of prediction error signals depends on the type of associative learning specific to the behavioral situations in which animals experienced the stimulus–reward associations.
Materials and Methods
Behavioral procedures.
Two adult male macaque monkeys (Macaca fascicularis) weighing 8 and 10 kg were used in the present experiments (monkeys P and G). Experimental protocols were in accordance with the National Institutes of Health's Guide for the Care and Use of Laboratory Animals and the French laws on animal experimentation. Both monkeys were trained in an instrumental task in which they performed arm-reaching movements toward a target to obtain a liquid reward. They were seated in a Plexiglas restraining box facing a panel. A red light-emitting diode (LED) and a contact-sensitive metal knob were located in the center of the panel at arm's length and at eye level of the animal. A metal bar was mounted on the lower part of the panel at waist level. A tube positioned directly in front of the monkey's mouth dispensed small amounts of fruit juice (0.3 ml) as a reward. The tube was equipped with force transducers with which licking at the spout was monitored. As illustrated in Figure 1A, trials were initiated when the animal kept a hand on the bar until the illumination of the LED. In response to this stimulus, the animal released the bar and touched the target below the illuminated LED. Target contact was accompanied by the delivery of reward and extinction of the light. The trial duration was fixed at 5 s and the next trial could start only if this duration had elapsed and the monkey had moved back the hand on the bar. The interval between reward delivery and the subsequent trigger stimulus varied between 4.0 and 4.7 s, making the timing of the trigger stimulus relatively uncertain.
Figure 1.
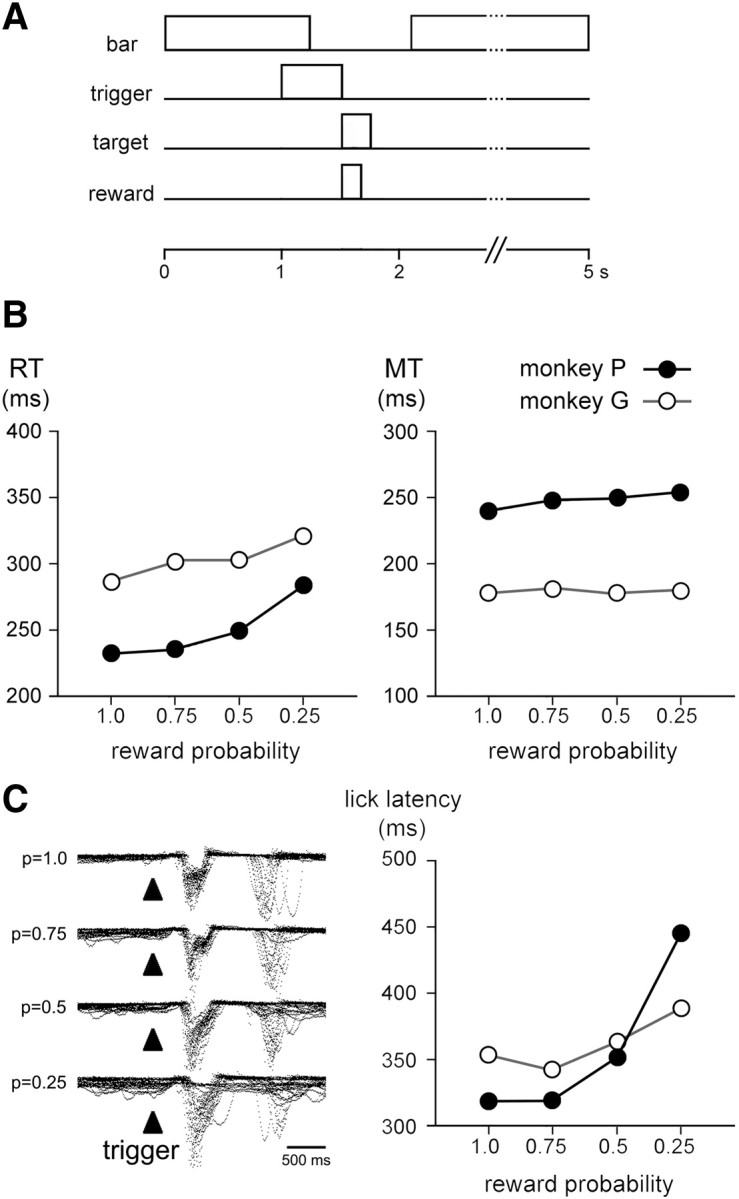
Temporal sequence of task events and behavior at different reward probabilities. A, Reaching task used for behavioral testing. A trial started with the monkey with its hand on a bar waiting for the trigger stimulus. In response to the presentation of this stimulus, the animal released the bar and reached the target. Depending upon the reward probabilities, target contact resulted in either the delivery or omission of reward. Four different probabilities of reward (0.25, 0.5, 0.75, and 1.0) were tested in separate blocks of 40–70 trials and the same stimulus served as a trigger for movement. Irregular time intervals of 4.0–4.7 s occurred between reward delivery and the subsequent trigger stimulus. B, Reaching task performance as a function of the reward probability for the two monkeys. Each value was obtained by calculating the mean for all trials. The data for each probability condition were taken from 689, 1333, 1240, and 526 trials for monkey P and 792, 1432, 1041, and 1394 trials for monkey G at p = 1.0, 0.75, 0.5, and 0.25, respectively. Error bars representing SEM are too small to be visible. C, Licking behavior at different reward probabilities. Left, Superimposed traces of mouth movement records are aligned on the onset of the trigger stimulus. Data were obtained from ∼20 consecutive trials in each condition collected in monkey P. Right, Latencies of licking movements for each animal and each probability condition. Data were obtained from 266, 305, 296, and 216 trials for monkey P and 159, 158, 149, and 135 trials for monkey G at p = 1.0, 0.75, 0.5, and 0.25, respectively. Error bars representing SEM are too small to be visible.
Each block consisted of 40–70 trials during which monkeys received rewards at a fixed probability, this probability being changed between blocks (p = 1.0, 0.75, 0.5, or 0.25). In such a block presentation design, the trigger stimulus provided no advance information about probability level. Thus, although reward predictions in most previous studies using probabilistic conditioning tasks were driven by explicit cues, they were considered to be internally generated in the present experiments and the probability of reward was determined through experiencing repeating stimulus–outcome associations within each trial block. Transition from one block to the other was not indicated to the monkey by any external cue, except that blocks were separated by a short time break during which the experimenter modified the probability condition. This unusual long intertrial interval could represent a warning stimulus to the animal for the switch in reward probabilities.
Neuronal recordings.
After overtraining in the instrumental task, the two monkeys were implanted with a stainless steel recording chamber (outer diameter, 25 mm) and a head-restraining device under pentobarbital anesthesia (35 mg/kg i.v.; Sanofi) and sterile surgical conditions. The chamber was stereotaxically positioned to permit vertical access with microelectrodes to the striatum, mostly the putamen. Two metal head-holding cylinders were embedded into the acrylic cap to permit head stabilization during the subsequent recording sessions. Following surgery, monkeys were given antibiotics (Ampicillin, 17 mg/kg every 12 h; Bristol-Myer Squibb) and analgesics (Tolfedine, 2 mg/kg; Vetoquinol) on the day of surgery and for the following 5 d.
Single-neuron recording was performed using custom-made, glass-coated tungsten electrodes passed inside a guide cannula (outer diameter, 0.6 mm) at the beginning of each recording session. A hydraulic microdrive (MO-95; Narishige) was used to advance electrodes toward the striatum. Signals from neuronal activity were amplified (×5000), bandpass filtered (0.3–1.5 kHz), and spikes were detected on-line by threshold crossing using a window discriminator (Neurolog; Digitimer). Continuous monitoring of the spike waveform on a digital oscilloscope during recording allowed us to check the isolation quality of spikes. Mouth contacts with the spout were digitized at 100 Hz and stored during each block of trials, concomitant with neuronal activity, for off-line quantitative analysis of the oral behavior. A computer controlled the behavioral task and data acquisition. The task relationships of neuronal discharges were assessed on-line in the form of rasters aligned on each task event. We used well established criteria to identify TANs (Aosaki et al., 1994; Apicella et al., 1997). Every TAN isolated was examined while the monkey performed the task with reward at p = 1.0. We then tested the neurons in separate blocks of trials using lower probability levels, the order of the p < 1.0 conditions being counterbalanced across sessions to avoid order effects. No neuron was rejected because it appeared to be unresponsive in the initial p = 1.0 condition. After recording from a TAN, the electrode was advanced until another TAN was encountered.
Data analysis.
Performance in the task was assessed by calculating the mean of reaction time (RT), corresponding to the time between trigger onset and bar release, and movement time (MT), corresponding to the time between bar release and target contact, of correct responses for each probability condition. Excessively long RTs or MTs (>500 ms) were excluded from analysis. We also assessed the timing characteristics of the mouth movements that monkeys performed in the different conditions by measuring lick latencies from onset of the visual stimulus to onset of licking. ANOVA served to compare RTs, MTs, and lick latencies pooled from several trial blocks from several sessions separately for probability conditions and monkeys. A linear regression analysis was also used to analyze the relationship between performance indices and the different probability levels.
We evaluated TAN responsiveness to task events in terms of changes in firing detected on the basis of a Wilcoxon signed-rank test (Apicella et al., 1997) and only neurons with statistically significant changes against control activity were considered responsive. The baseline activity was calculated during the 0.5 s before the presentation of the trigger stimulus. A test window of 100 ms duration was moved in steps of 10 ms, starting at the onset of the trigger stimulus or the delivery of reward. We considered an increase or decrease as significant if it lasted for at least five consecutive 10 ms steps showing a significant difference (p < 0.05) against the baseline activity. The magnitude of changes in activity for each responding TAN was expressed as a percentage below or above the baseline. Differences in fractions of responding neurons among the probability conditions were tested with the χ2 test. A linear regression analysis was used to analyze the relationship between magnitudes of changes in TAN activity and the different probability levels. The magnitude of TAN responses was also compared with one-way ANOVA, using probability level as a factor.
To give a description of the responsiveness of the population of TANs sampled, we calculated the average activity of all neurons recorded in each probability condition. For each neuron, a normalized perievent time histogram was obtained by dividing the content of each bin by the number of trials, and the population histogram was constructed by averaging all normalized histograms. We also used a time-window analysis to statistically assess and compare changes in the average population response between conditions (Apicella et al., 2009). First, latency and duration of these changes were determined for each population histogram. This analysis was performed in 10 ms bins to identify whether and when the population significantly changed its activity. The onset time of a change was determined at the first bin from which a significant difference (paired t test, p < 0.05) continued consecutively for at least three bins (i.e., 30 ms). Offset time was defined in a similar fashion for the return to control. Then we determined a common time window that included all onset and offset times for each component of the population response to task events, separately for each monkey (trigger stimulus, reward delivery), or for both monkeys (reward omission). We denoted these time periods as standard time windows that enabled comparison of changes in the average population response at the different levels of probability. The magnitude of activity change was determined in every time window by comparing the number of spikes between the standard time window (normalized for durations of time windows) and a control period of 100 ms preceding the trigger stimulus. The magnitudes of activity changes obtained from this standard time window method were compared with one-way ANOVA using probability level as a factor.
Histological verification.
After completion of the experiments, small electrolytic lesions were made into the striatum of monkey P by passing negative currents through the microelectrode (20 μA for 20–30 s). These lesions were used as landmarks for the reconstruction of recording sites. This animal was given a lethal dose of sodium pentobarbital and perfused transcardially with isotonic saline followed by a fixative (4% paraformaldehyde, pH 7.4 phosphate buffer). The brain was removed and frozen coronal sections (50 μm thickness) were stained with cresyl violet. Histological examination was not been done with monkey G, which is still used in recording experiments, but we identified the recording striatal area as being mainly located in the posterior putamen on the basis of the activity of easily recognized landmark structures (globus pallidus, anterior commissure) and the presence of movement-related neuronal activities encountered during microelectrode penetrations.
Results
Influence of changes in reward prediction between blocks
Figure 1B shows the mean RTs and MTs in the instrumental task at the four probability levels for the two animals. Linear regression analyses performed on the performance indices versus reward probability indicated that the RT increased linearly as probability decreased (correlation coefficients, r = 0.375 and 0.243 in monkeys P and G, respectively, p < 0.01). A weak but significant correlation between the MT and probability was found in monkey P (r = 0.112, p < 0.01) but not in monkey G (r = 0.006, p > 0.05). One-way ANOVA revealed a significant effect of probability on RT (monkey P, F(3,3784) = 269.98, p < 0.01; monkey G, F(3,4655) = 107.83, p < 0.01), so that animals had longer RTs in the p = 0.25 and 0.5 conditions (monkey P) and in all three p < 1.0 conditions (monkey G) compared with the p = 1.0 condition. There was also a significant effect of probability on MT (monkey P, F(3,3784) = 19.96, p < 0.01; monkey G, F(3,4655) = 10.12, p < 0.01), but differences in MT among probability conditions were small compared with RT, suggesting that the execution phase of movement was weakly influenced by the probability of reward.
The pattern of licking activity at the different reward probabilities appeared comparable in the two monkeys and is illustrated in Figure 1C (left). Animals started to lick the spout after trigger onset in >90% of the trials in all probability conditions, except in the p = 0.25 condition in which licking occurred in 84 and 86% of trials in monkeys G and P, respectively. We analyzed, separately for the two monkeys, the correlation between the latency of licking movements and the probability of reward and found that this latency increased linearly with decreasing probability for both animals (r = 0.568 and 0.268 in monkeys P and G, respectively, p < 0.01). ANOVA revealed a significant effect of probability on the latency of the licking movements (monkey P, F(3,1079) = 259.12, p < 0.01; monkey G, F(3,597) = 24.58, p < 0.01), the latency being significantly longer at p = 0.25 and 0.5 than at p = 0.75 and 1.0. It therefore appears that, even without explicit cues indicating the probability of reward, the monkeys' behavior was sensitive to the level of probability experienced for several trials on any block.
We recorded the activity of 68 neurons that had electrophysiological features characteristic of TANs (32 and 36 neurons in monkeys P and G, respectively). Histological data for monkey P are presented in Figure 2. Most recordings were in the dorsolateral putamen at the level of and posterior to the anterior commissure, over the entire mediolateral extent of the nucleus. The responsiveness of TANs to task events was evaluated on the basis of the two consecutive phasic components typically seen in these neurons: a decrease followed by an increase in firing rate, termed pause and rebound activation, respectively (Aosaki et al., 1994; Apicella et al., 1997; Morris et al., 2004). Although a more varied pattern of response has been described previously (Aosaki et al., 1995; Yamada et al., 2004), TANs recorded in the present study rarely showed a brief excitation preceding the pause–rebound response to task stimuli.
Figure 2.

Recording sites of TANs in monkey P. TANs responding to reward that were or were not influenced by probability are indicated by symbols on coronal sections of the putamen. AC −5 to 0, Levels posterior to the anterior commissure.
As summarized in Table 1, in both monkeys, the percentage of TANs displaying a pause and a rebound activation after the presentation of the trigger stimulus did not vary significantly across the different probability conditions (χ2 test, p > 0.05). There were also no significant differences in the fraction of neurons showing a pause response to reward among the conditions (p > 0.05), whereas a significantly higher percentage of TANs showed a rebound activation as the probability of reward decreased (monkey P, χ2 = 8.94, df = 3, p < 0.05; monkey G, χ2 = 11.49, df = 3, p < 0.01). A typical example of a responding neuron tested at the four probability levels is shown in Figure 3. After the trigger stimulus, the magnitudes of the two response components appeared independent of reward probability. On the other hand, both the pause response to reward and following rebound activation tended to increase with decreasing reward probability.
Table 1.
Responses of TANs to the trigger stimulus and reward
| Probability level | Trigger response |
Reward response |
||||||
|---|---|---|---|---|---|---|---|---|
| Pause |
Rebound |
Pause |
Rebound |
|||||
| Monkey P | Monkey G | Monkey P | Monkey G | Monkey P | Monkey G | Monkey P | Monkey G | |
| 1.0 | 25 (78%) | 27 (75%) | 15 (47%) | 22 (61%) | 17 (53%) | 20 (56%) | 10 (31%) | 5 (14%) |
| 0.75 | 17 (81%) | 25 (81%) | 10 (48%) | 18 (58%) | 10 (48%) | 15 (48%) | 10 (48%) | 15 (48%)a |
| 0.5 | 26 (90%) | 29 (88%) | 7 (24%) | 20 (61%) | 19 (66%) | 18 (55%) | 19 (66%)a | 12 (36%)b |
| 0.25 | 10 (100%) | 23 (85%) | 4 (40%) | 16 (59%) | 8 (80%) | 15 (56%) | 7 (70%)b | 13 (48%)a |
Values correspond to number and percentage of responding neurons. Significant differences (ap < 0.01, bp < 0.05, χ2 test) against p = 1.0.
Figure 3.

Influence of changing the probability of reward on TAN responses to the trigger stimulus and reward. An example of a responding TAN tested in the four reward probability conditions. The change in reward probability occurred over four successive blocks of trials and only rewarded trials are shown. The TAN response to reward was decreased when the reward was fully predictable. Each dot indicates a neuronal impulse and each line of dots gives the neuronal activity recorded during a single trial. Dot displays and perievent time histograms are aligned on the onset of the trigger stimulus (left) and reward (right). In each block, rasters are in chronological order from top to bottom. Dots in raster displays indicate movement onset (bar release). Histogram scale is in impulses/s. Bin width for histograms is 10 ms.
We compared magnitudes of activity changes for samples of neurons that were responsive to the trigger stimulus and/or reward. Regression correlation coefficients for the data are shown in Figure 4A and revealed that the magnitude of the response to reward increased linearly with decreasing probability for both the pause and the rebound activation in monkey P and only for the rebound activation in monkey G. In contrast, the magnitude of neither component of the response to the trigger stimulus was correlated with reward probability in both monkeys.
Figure 4.
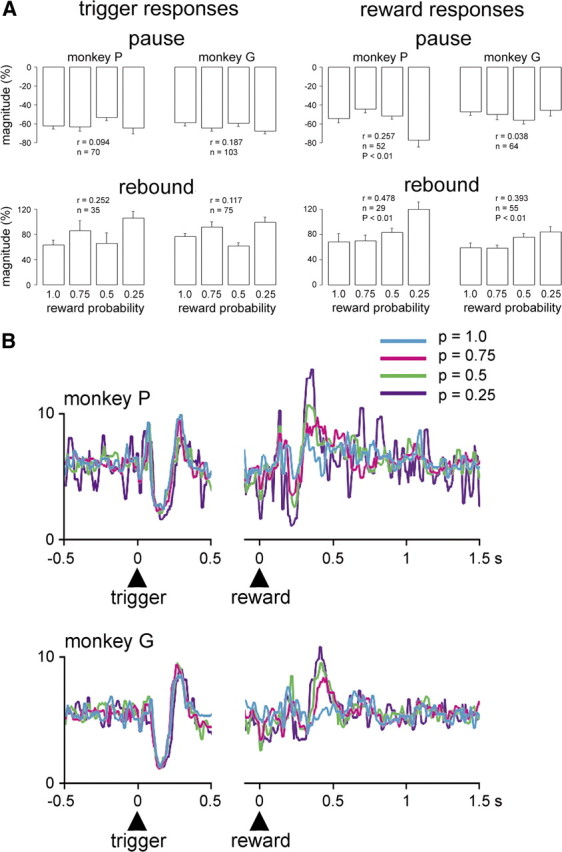
Modulation by reward probability of population responses of TANs to task events in rewarded trials. A, Comparison of magnitudes of the two components of TAN responses to the trigger stimulus and reward delivery in relation to different reward probability levels. The magnitude of initial pauses (monkey P) and later rebound activations (monkeys P and G) following reward delivery increased linearly with decreasing probability. In contrast, the magnitude of both response components to the trigger stimulus was not significantly correlated with the probability of reward. Each bar represents the mean ± SEM. Numbers of values at the different probability levels varied between 4 and 23 in monkey P and 11 and 29 in monkey G. r, Correlation coefficient. B, Population activities for all TANs recorded at each level of probability are superposed and separately referenced to the trigger stimulus (left) and reward (right). Numbers of neurons at p = 1.0, 0.75, 0.5, and 0.25 for monkey P are as follows: n = 32, 21, 29, and 10, respectively; for monkey G, n = 36, 31, 33, and 27, respectively. Vertical scale denotes impulses/s.
Data from the two monkeys were also analyzed separately at the level of the entire population of neurons tested in the different probability conditions, regardless of the responsiveness of individual neurons. As shown in Figure 4B, the population responses to the trigger stimulus overlapped almost completely in the four probability conditions in both monkeys, whereas there was an enhancement of the population responses to reward when the probability decreased. To assess this apparent difference quantitatively, we rated the magnitude of activity changes using specific time windows (see Materials and Methods, above) for each component of the population response to reward (monkey P: pause, 210–250 ms; rebound, 310–460 ms; monkey G: pause, 260–330 ms; rebound, 340–490 ms). The results of a linear regression analysis showed that the magnitude of the pause responses to reward increased as probability decreased in monkey P (r = 0.312, p < 0.01) and, to a lesser extent, in monkey G (r = 0.196, p < 0.05). The magnitude of the following rebound activation also increased with decreasing probability in monkeys P (r = 0.415, p < 0.01) and G (r = 0.494, p < 0.01). In monkey P, one-way ANOVA revealed that the magnitudes of pause responses to reward were significantly different among conditions (F(3,88) = 3.21, p < 0.05), being higher at p = 0.25 (p < 0.05) and p = 0.5 (p < 0.01) than at p = 1.0. In contrast, in monkey G, the magnitudes of pause responses to reward were not significantly different among conditions (F(3,122) = 2.16, p > 0.05). The magnitudes of rebound activations after reward delivery were significantly different among conditions in monkey P (F(3,88) = 6.43, p < 0.01) and monkey G (F(3,122) = 13.14, p < 0.01), being higher at p = 0.25, p = 0.5, and p = 0.75 than at p = 1.0 (p < 0.01) in monkey P and higher at p = 0.25 and p = 0.5 than at p = 0.75 and p = 1.0 (p < 0.01) in monkey G. The same analysis for the population response to the trigger stimulus (monkey P: pause, 100–170 ms; rebound, 220–320 ms; monkey G: pause, 110–180 ms; rebound, 230–300 ms) showed that the magnitude of the response to the trigger stimulus showed no consistent relation to probability both for the pause (r = 0.090 and 0.004 in monkeys P and G, respectively, p > 0.05) and following rebound activation (r = 0.038 and 0.045 in monkeys P and G, respectively, p > 0.05) and the magnitude of each response component was also not significantly different when comparing conditions of different reward probabilities (ANOVA, p > 0.05).
We found that the absence of expected reward at p < 1.0 elicited significant changes in TAN activity expressed as either decreases or increases in firing. We separated neurons responding to the omitted reward according to the direction of their response before examining the influence of reward probability. As indicated in Table 2, no significant differences were observed in the proportion of TANs responding to reward omission among the three p < 1.0 conditions (χ2 test, p > 0.05). Because the number of each type response was insufficient to perform an analysis of data from the two monkeys separately, results were pooled for the two animals. As indicated in Figure 5A, linear regression analyses of the magnitudes of decreases and increases in TAN activity after reward omission for the two samples of neurons responding to no reward revealed that the magnitude of activity changes increased significantly with the probability of reward. Although individual TAN responses displayed significant differences in their magnitude among probability conditions, the modulation of activity was not clear at the level of the population of TANs responding to reward omission (Fig. 5B). Using specific time windows for each type of activity changes after reward omission (depression, 190–320 ms; activation, 320–470 ms), nonsignificant low correlations were found between probability and magnitudes of depression (r = 0.071, p > 0.05) and activation (r = 0.095, p > 0.05) and the magnitudes of the population response to no reward were not significantly different among probability conditions for increasing (F(2,53) = 0.94; p > 0.05) and decreasing (F(2,46) = 0.68; p > 0.05) types of response.
Table 2.
Responses of TANs to the omission of reward
| Probability level | Decrease |
Increase |
||
|---|---|---|---|---|
| Monkey P | Monkey G | Monkey P | Monkey G | |
| 0.75 | 4 (19%) | 13 (42%) | 9 (43%) | 7 (23%) |
| 0.5 | 8 (28%) | 14 (42%) | 11 (38%) | 13 (39%) |
| 0.25 | 1 (10%) | 8 (30%) | 3 (30%) | 9 (33%) |
Values correspond to number and percentage of responding neurons. The number of decreases or increases in activity after reward omission varied insignificantly among the three p < 1.0 conditions (p > 0.05, χ2 test).
Figure 5.

Changes in TAN activity when expected rewards were omitted in unrewarded trials. A, Comparison of magnitudes of changes in activity following the omission of reward as a function of reward probability. Results are pooled for the two monkeys. Numbers of values at p = 0.75, 0.5, and 0.25 for neurons showing a decrease in activity after reward omission are 17, 22, and 9, respectively (left); for neurons showing an increase in activity after reward omission, 16, 24, and 12, respectively (right). Values are given as means ± SEM. r, Correlation coefficient. B, Population activities for TANs responding to reward omission. Neurons were separated into two groups according to the direction of their response to no reward, namely increase or decrease in activity. Same numbers of neurons as in A. Vertical scale denotes impulses/s.
In summary, the responsiveness of TANs to the delivery of reward was increased with decreasing reward probability in both monkeys, in terms of fraction of neurons showing a rebound activation and magnitude of these rebounds. On the other hand, the fraction of TANs showing a pause response to reward was not significantly influenced by probability and the magnitude of pauses increased with decreasing reward probability in only one monkey. The proportion of TANs responding to reward omission did not vary, with respect to probability, whereas the magnitude of these responses increased with increasing reward probability at the level of single neurons but not at the level of the population average. Finally, we found no evidence that the sensitivity of TANs to the trigger stimulus was influenced by the probability of reward either at the single neuron level or as a population.
Influence of changes in reward prediction in instrumental versus classical conditioning tasks
Because previous studies have suggested that instrumental conditioning could be less efficient at demonstrating modulation of TAN responses by reward probability compared with classical conditioning (Morris et al., 2004; Joshua et al., 2008), we specifically examined whether the probability-dependent modulation of TAN responses was influenced by the learning situation in which monkeys experienced stimulus–reward associations. The two monkeys used in the present experiment were also trained in a classical conditioning task [monkeys 2 and 3 in Apicella et al. (2009)]. The activity of 59 TANs (31 in monkey P and 28 in monkey G) was examined during performance of the classical conditioning task while varying reward probability in a similar way, using the same block design. These TANs were recorded in the posterior putamen where we collected the bulk of our data. We compared the two task conditions to directly test for differences in prediction-error signaling. Anticipatory licking behavior confirmed that the monkeys discriminated the conditions according to reward probability in the two learning situations, as suggested by significant correlations found between the latency of licks and the probability of reward (classical conditioning task: monkey P, r = 0.652; monkey G, r = 0.390; instrumental task: monkey P, r = 0.568; monkey G, r = 0.268). Because of the relatively small number of neurons in some datasets, we grouped the data of the two animals. We rated the magnitude of TAN responses at the level of population, using time windows for each component of TAN response to the trigger stimulus, reward delivery, and omission, and compared magnitudes for the two tasks. To this end, we adjusted the time windows as appropriate to the activity of the samples of TANs recorded in each monkey and each task (stimulus: pause, 100–210 ms; rebound, 230–360 ms; reward: pause, 180–260 ms; rebound, 300–440 ms; no reward: depression, 100–190 ms; activation, 460–530 ms). The results of this population analysis are given separately for the two tasks in Figure 6, according to the probability of reward.
Figure 6.

Comparison of magnitudes of each component of population responses of TANs during performance of the instrumental and classical tasks. Plots show, separately for the two tasks, mean magnitude of population responses to the stimulus, reward delivery, and reward omission according to the probability of reward. Values correspond to pooled data from monkeys P and G trained in the two tasks. Error bars represent SEs of mean magnitude. In the instrumental task, the numbers of neurons contributing to the graph are the same as those in Figures 4 and 5. In the classical conditioning task, number of neurons at p = 1.0, 0.75, 0.5, and 0.25 are 61, 36, 44, and 40, respectively; Number of neurons at p = 0.75, 0.5, and 0.25 for activity changes after reward omission are as follows: for depression, n = 11, 8, and 3, respectively; for activation, 11, 18, and 17, respectively.
Two-way ANOVA revealed a significant effect of task on the magnitude of the pause response to reward (F(1,385) = 40.97, p < 0.01) and following rebound activation (F(1,391) = 44.82, p < 0.01), reflecting decreased response magnitude in instrumental versus classical tasks. There was also a significant interaction between task and probability for the pause (F(3,385) = 3.60, p < 0.05) but not for the rebound activation (F(3,391) = 2.35, p > 0.05). An influence of task in the same direction was also apparent on the pause response to the stimulus preceding reward delivery (F(1,391) = 7.02, p < 0.01), with a significant interaction between task and probability (F(3,391) = 4.29, p < 0.01), whereas there was no significant effect of task on the rebound activation (F(1,391) = 0.48, p > 0.05). Although not illustrated in Figure 6, a small number of neurons tested in the classical conditioning task showed a brief excitation before the pause response to the stimulus (Apicella et al., 2009). We rated the magnitude of this early response component during a 50–80 ms period after stimulus onset in the latter task and found that there was a trend toward greater magnitude than the TAN firing during the same period in the instrumental task (F(1,391) = 3.85, p = 0.050) and a significant interaction between task and probability (F(3,391) = 2.68, p < 0.05). Two-way ANOVA revealed a significant effect of task on the magnitude of activations after reward omission (F(1,91) = 39.19, p < 0.01), the magnitude being enhanced in the classical versus instrumental tasks, with a significant interaction between task and probability (F(2,91) = 3.41, p < 0.05). In contrast, there was no significant effect of task (F(1,61) = 1.20, p > 0.05) on the magnitude of depressions after reward omission.
It therefore appeared that the effect of the learning situation on the magnitude of both components of the response to reward was greater in the classical conditioning task than in the instrumental task. This effect was also observed for the pause response to the stimulus preceding reward delivery. The magnitude of increased firing following reward omission was higher in the classical conditioning task than in the instrumental task, whereas the magnitude of decreased firing following reward omission was similar between task conditions. These results provide evidence that TANs displayed stronger prediction error-related changes in their activity in the classical conditioning task, in which the association is only between cue and outcome, than in the instrumental task, in which the outcome depends on an action, suggesting that TANs report reward-prediction errors less efficiently in the latter learning situation.
Discussion
To determine whether TANs are a possible neuronal substrate for reward-prediction error signaling in the context of instrumental conditioning tasks, we manipulated the probability of reward in monkeys performing visually triggered movements to obtain the reward in a situation in which the assessment of probabilistic outcomes relied on trial-by-trial feedback. Under those circumstances, it appears that TANs showed relatively weak sensitivity to reward probability compared with that observed previously in classical conditioning experiments. This indicates that the capacity of the TAN system to express reward-prediction error signals depends on the form of associative learning.
The sensitivity of TANs to internally generated reward predictions
We found that the response of TANs to reward was stronger as the probability of reward decreased, this effect being most prominent on the rebound activation that followed the pause, suggesting that the late TAN response component may be particularly important for signaling a positive prediction error. In addition, although the absence of expected reward has a smaller effect on TANs than reward delivery, both increased and decreased firing of single neurons following reward omission were enhanced with increasing reward probability, indicating that TANs are also capable of signaling negative prediction error. Previously, Morris et al. (2004) reported that neither component of the TAN response to reward delivery nor response to reward omission was modulated with changing reward probability during instrumental task performance. Because the sampled region of the putamen was comparable to that explored in the present study, we can rule out that differences between studies were attributable to different anatomical locations of the recorded TANs. In fact, some of the task conditions may themselves impose the limitations on TAN expression of prediction error signals. In particular, we emphasize that the probabilistic reward structure in our experiments varied between trial blocks, whereas distinct stimuli indicated the probability of reward on every trial in the Morris et al.'s (2004) study. Therefore, differences in TAN responses between studies could be due mainly to different acquired representations of reward probabilities, being internally generated during the course of a block or externally driven by explicit cues. We suggest that TANs may provide the signals specifying whether the actual outcome matches internally attributed types of predictions.
Our results raise the possibility that the rebound activation of the TAN response to reward may be more closely related to coding prediction errors compared with the early pause. Joshua et al. (2008) also noticed that the influence of probability was especially prominent on the late excitatory phase of the TAN responses to reward. Although further work is needed to examine whether the two response components each may contribute to distinct aspects of event processing, it might be speculated that the biphasic response combines two distinct signals, the earlier one being related to saliency coding and the later one to prediction error coding. But, on this interpretation, it is unclear why the effect of changing reward probability was apparent on the pause response, albeit at a lesser degree compared with the rebound activation. One explanation may be that less frequent events are more salient because their occurrence is less expected than that of frequent ones. Therefore, the increased pause response to infrequent rewards at low probability levels might be related to heightened attention to these unexpected events. Determining the inputs that are potentially integrated by TANs to give rise to each response component is a critical next step to understanding the way these neurons process distinct reward attributes. Much attention has focused on the cellular mechanisms of the initial pause generation (Bennett and Wilson, 1998; Suzuki et al., 2001; Reynolds et al., 2004; Deng et al., 2007), whereas little is known about the origin of the subsequent rebound in TAN firing. A main source of excitatory input to cholinergic interneurons of the striatum comes from the intralaminar nuclei of the thalamus (Lapper and Bolam, 1992; Sidibé and Smith, 1999) and it has recently been shown that electrical stimulation of this thalamic region in the monkey evokes multiphasic responses of TANs that are quite similar to those seen in behavioral situations (Nanda et al., 2009). It is also known that inactivation of this input eliminates both the pause and rebound activation of TANs (Matsumoto et al., 2001). By the way of thalamic inputs, it has been suggested that the cholinergic interneurons are in the position to supply the striatum with signals related to attention (Matsumoto et al., 2001; Minamimoto and Kimura, 2002; Ding et al., 2010). Thus, in the search for the origin of prediction error signals in TANs, it remains to determine the extent to which TAN response components might encode some form of attention.
Can instrumental conditioning make prediction error encoding by TANs less efficient?
In the present study, the modulation of TAN responses by reward probability appeared much less clear than has been reported in a classical conditioning task using a similar block design (Apicella et al., 2009), as indicated by the following observations. First, in the instrumental task, TAN responses to the trigger stimulus did not vary across the different probability conditions, whereas the response to the predictive stimulus is modulated by reward probability in classical conditioning. Second, in the instrumental task, a robust influence of decreasing reward probability, was most prominently observed on the late component of the TAN response to reward, whereas this effect was seen on both pauses and rebound activations in classical conditioning. Third, in the instrumental task, the sensitivity to reward omission at various probabilities was apparent in the data from single neurons, but not in population averages of TAN responses, whereas it was observed at the level of the population and the individual neuron responses in classical conditioning. Other work also suggests that a relationship to the level of reward probability emerges more clearly in classical conditioning than in instrumental conditioning (Morris et al., 2004; Joshua et al., 2008).
It is not clear why TAN expression of prediction error signals is different between the two forms of associative learning, but it could be related at least partially to the impact of temporal predictability of outcomes. We have pointed out in previous work that TANs respond maximally to motivating events that occurred at unpredictable times (Sardo et al., 2000; Ravel et al., 2001). The difference between learning situations may reflect the fact that the monkeys used the target reaching to precisely time the expected outcome in the instrumental task, whereas such a temporal indicator is lacking in a Pavlovian trace conditioning procedure in which the stimulus and reward were separated in time. We therefore suggest that the high degree of temporal predictability of outcomes has contributed to diminished TAN encoding of prediction errors in instrumental conditioning.
A large number of neuroimaging studies have provided evidence of activity related to prediction errors in both ventral and dorsal striatum during reinforcement learning (for review, see O'Doherty, 2004) and some of them have suggested that striatal prediction error-related activation is stronger during learning situations where outcomes are determined by instrumental reactions (Elliott et al., 2003; Tricomi et al., 2004; Haruno and Kawato, 2006; Bjork and Hommer, 2007). These activations have been shown to be most consistent in the caudate nucleus, whereas our results suggest that intrinsic processing within the posterior putamen might contribute to the encoding of the reward-prediction error in tasks that involve instrumental reactions. The fact that TANs linked to reward-prediction errors were found in a part of the striatum closely associated with the control of movement raise the possibility that this region is not only a critical site for selecting the action (Samejima et al., 2005; Pasquereau et al., 2007) but also for updating expectations of rewarding outcomes (Daw and Doya, 2006).
Together with our preceding study (Apicella et al., 2009), the present data are consistent with the proposal that TANs encode the prediction error preferentially in tasks in which rewards are not contingent upon instrumental reactions. It therefore appears that TAN responses do not follow task events only in terms of their motivational relevance, but rather do so only under certain circumstances, thus emphasizing the context dependency of these responses (Apicella, 2007). Although the precise nature of the interaction between several aspects of rewards, including their probability, timing, and action contingency remains to be worked out, it is possible that the expression of prediction error-related TAN activity is more prominent in conditions in which error detections rely on internally attributed types of predictions leading to automatic encoding of information about probability of outcome. If so, it would be consistent with the idea that TANs may be important for the performance of behaviors in specific learning modes, especially those subserving motor skills and habit formation.
Footnotes
This work was supported by Centre National de la Recherche Scientifique and Association France Parkinson. We thank Dr. J. F. Espinosa-Parrilla for help with behavioral training and Dr. I. Balansard for assistance with surgery. We also thank H. Bergman, M. Joshua, and J. Reynolds for helpful discussions.
References
- Aosaki T, Tsubokawa H, Ishida A, Watanabe K, Graybiel AM, Kimura M. Responses of tonically active neurons in the primate's striatum undergo systematic changes during behavioral sensorimotor conditioning. J Neurosci. 1994;14:3969–3984. doi: 10.1523/JNEUROSCI.14-06-03969.1994. [DOI] [PMC free article] [PubMed] [Google Scholar]
- Aosaki T, Kimura M, Graybiel AM. Temporal and spatial characteristics of tonically active neurons of the primate's striatum. J Neurophysiol. 1995;73:1234–1252. doi: 10.1152/jn.1995.73.3.1234. [DOI] [PubMed] [Google Scholar]
- Apicella P. Leading tonically active neurons of the striatum from reward detection to context recognition. Trends Neurosci. 2007;30:299–306. doi: 10.1016/j.tins.2007.03.011. [DOI] [PubMed] [Google Scholar]
- Apicella P, Legallet E, Trouche E. Responses of tonically discharging neurons in the monkey striatum to primary rewards delivered during different behavioral states. Exp Brain Res. 1997;116:456–466. doi: 10.1007/pl00005773. [DOI] [PubMed] [Google Scholar]
- Apicella P, Deffains M, Ravel S, Legallet E. Tonically active neurons in the striatum differentiate between delivery and omission of expected reward in a probabilistic task context. Eur J Neurosci. 2009;30:515–526. doi: 10.1111/j.1460-9568.2009.06872.x. [DOI] [PubMed] [Google Scholar]
- Bennett BD, Wilson CJ. Synaptic regulation of action potential timing in neostriatal cholinergic interneurons. J Neurosci. 1998;18:8539–8549. doi: 10.1523/JNEUROSCI.18-20-08539.1998. [DOI] [PMC free article] [PubMed] [Google Scholar]
- Bjork JM, Hommer DW. Anticipating instrumentally obtained and passively-received rewards: a factorial fMRI investigation. Behav Brain Res. 2007;177:165–170. doi: 10.1016/j.bbr.2006.10.034. [DOI] [PMC free article] [PubMed] [Google Scholar]
- Daw ND, Doya K. The computational neurobiology of learning and reward. Curr Opin Neurobiol. 2006;16:199–204. doi: 10.1016/j.conb.2006.03.006. [DOI] [PubMed] [Google Scholar]
- Dayan P, Balleine BW. Reward, motivation, and reinforcement learning. Neuron. 2002;36:285–298. doi: 10.1016/s0896-6273(02)00963-7. [DOI] [PubMed] [Google Scholar]
- Deng P, Zhang Y, Xu ZC. Involvement of I(h) in dopamine modulation of tonic firing in striatal cholinergic interneurons. J Neurosci. 2007;27:3148–3156. doi: 10.1523/JNEUROSCI.5535-06.2007. [DOI] [PMC free article] [PubMed] [Google Scholar]
- Ding JB, Guzman JN, Peterson JD, Goldberg JA, Surmeier DJ. Thalamic gating of corticostriatal signaling by cholinergic interneurons. Neuron. 2010;67:294–307. doi: 10.1016/j.neuron.2010.06.017. [DOI] [PMC free article] [PubMed] [Google Scholar]
- Elliott R, Newman JL, Longe OA, Deakin JF. Differential response patterns in the striatum and orbitofrontal cortex to financial reward in humans: a parametric functional magnetic resonance imaging study. J Neurosci. 2003;23:303–307. doi: 10.1523/JNEUROSCI.23-01-00303.2003. [DOI] [PMC free article] [PubMed] [Google Scholar]
- Haruno M, Kawato M. Different neural correlates of reward expectation and reward expectation error in the putamen and caudate nucleus during stimulus-action-reward association learning. J Neurophysiol. 2006;95:948–959. doi: 10.1152/jn.00382.2005. [DOI] [PubMed] [Google Scholar]
- Joshua M, Adler A, Mitelman R, Vaadia E, Bergman H. Midbrain dopaminergic neurons and striatal cholinergic interneurons encode the difference between reward and aversive events at different epochs of probabilistic classical conditioning trials. J Neurosci. 2008;28:11673–11684. doi: 10.1523/JNEUROSCI.3839-08.2008. [DOI] [PMC free article] [PubMed] [Google Scholar]
- Knutson B, Westdorp A, Kaiser E, Hommer D. fMRI visualization of brain activity during a monetary incentive delay task. Neuroimage. 2000;12:20–27. doi: 10.1006/nimg.2000.0593. [DOI] [PubMed] [Google Scholar]
- Lapper SR, Bolam JP. Input from the frontal cortex and the parafascicular nucleus to cholinergic interneurons in the dorsal striatum of the rat. Neuroscience. 1992;51:533–545. doi: 10.1016/0306-4522(92)90293-b. [DOI] [PubMed] [Google Scholar]
- Matsumoto N, Minamimoto T, Graybiel AM, Kimura M. Neurons in the thalamic CM-Pf complex supply striatal neuons with information about behaviorally significant sensory events. J Neurophysiol. 2001;85:960–976. doi: 10.1152/jn.2001.85.2.960. [DOI] [PubMed] [Google Scholar]
- McClure SM, Berns GS, Montague PR. Temporal prediction errors in a passive learning task activate human striatum. Neuron. 2003;38:339–346. doi: 10.1016/s0896-6273(03)00154-5. [DOI] [PubMed] [Google Scholar]
- Minamimoto T, Kimura M. Participation of the thalamic CM-Pf complex in attentional orienting. J Neurophysiol. 2002;87:3090–3101. doi: 10.1152/jn.2002.87.6.3090. [DOI] [PubMed] [Google Scholar]
- Montague PR, Berns GS. Neural economics and the biological substrates of valuation. Neuron. 2002;36:265–284. doi: 10.1016/s0896-6273(02)00974-1. [DOI] [PubMed] [Google Scholar]
- Morris G, Arkadir D, Nevet A, Vaadia E, Bergman H. Coincident but distinct messages of midbrain dopamine and striatal tonically active neurons. Neuron. 2004;43:133–143. doi: 10.1016/j.neuron.2004.06.012. [DOI] [PubMed] [Google Scholar]
- Nanda B, Galvan A, Smith Y, Wichmann T. Effects of stimulation of the centromedian nucleus of the thalamus on the activity of striatal cells in awake rhesus monkeys. Eur J Neurosci. 2009;29:588–598. doi: 10.1111/j.1460-9568.2008.06598.x. [DOI] [PMC free article] [PubMed] [Google Scholar]
- Niv Y, Schoenbaum G. Dialogues on prediction errors. Trends Cogn Sci. 2008;12:265–272. doi: 10.1016/j.tics.2008.03.006. [DOI] [PubMed] [Google Scholar]
- O'Doherty JP. Reward representations and reward-related learning in the human brain: insights from neuroimaging. Curr Opin Neurobiol. 2004;14:769–776. doi: 10.1016/j.conb.2004.10.016. [DOI] [PubMed] [Google Scholar]
- O'Doherty JP, Dayan P, Friston K, Critchley H, Dolan RJ. Temporal difference models and reward-related learning in the human brain. Neuron. 2003;38:329–337. doi: 10.1016/s0896-6273(03)00169-7. [DOI] [PubMed] [Google Scholar]
- O'Doherty J, Dayan P, Schultz J, Deichmann R, Friston K, Dolan RJ. Dissociable roles of ventral and dorsal striatum in instrumental conditioning. Science. 2004;304:452–454. doi: 10.1126/science.1094285. [DOI] [PubMed] [Google Scholar]
- Oyama K, Hernádi I, Iijima T, Tsutsui K. Reward prediction error coding in dorsal striatal neurons. J Neurosci. 2010;30:11447–11457. doi: 10.1523/JNEUROSCI.1719-10.2010. [DOI] [PMC free article] [PubMed] [Google Scholar]
- Pagnoni G, Zink CF, Montague PR, Berns GS. Activity in human ventral striatum locked to errors of reward prediction. Nat Neurosci. 2002;5:97–98. doi: 10.1038/nn802. [DOI] [PubMed] [Google Scholar]
- Pasquereau B, Nadjar A, Arkadir D, Bezard E, Goillandeau M, Bioulac B, Gross CE, Boraud T. Shaping of motor responses by incentive values through the basal ganglia. J Neurosci. 2007;27:1176–1183. doi: 10.1523/JNEUROSCI.3745-06.2007. [DOI] [PMC free article] [PubMed] [Google Scholar]
- Ravel S, Sardo P, Legallet E, Apicella P. Reward unpredictability inside and outside of a task context as a determinant of the responses of tonically active neurons in the monkey striatum. J Neurosci. 2001;21:5730–5739. doi: 10.1523/JNEUROSCI.21-15-05730.2001. [DOI] [PMC free article] [PubMed] [Google Scholar]
- Reynolds JN, Hyland BI, Wickens JR. Modulation of an afterhyperpolarization by the substantia nigra induces pauses in the tonic firing of striatal cholinergic interneurons. J Neurosci. 2004;24:9870–9877. doi: 10.1523/JNEUROSCI.3225-04.2004. [DOI] [PMC free article] [PubMed] [Google Scholar]
- Roesch MR, Calu DJ, Esber GR, Schoenbaum G. All that glitters: dissociating attention and outcome-expectancy from prediction errors signals. J Neurophysiol. 2010;104:587–595. doi: 10.1152/jn.00173.2010. [DOI] [PMC free article] [PubMed] [Google Scholar]
- Samejima K, Ueda Y, Doya K, Kimura M. Representation of action-specific reward values in the striatum. Science. 2005;310:1337–1340. doi: 10.1126/science.1115270. [DOI] [PubMed] [Google Scholar]
- Sardo P, Ravel S, Legallet E, Apicella P. Influence of the predicted time of stimuli eliciting movements on responses of tonically active neurons in the monkey striatum. Eur J Neurosci. 2000;12:1801–1816. doi: 10.1046/j.1460-9568.2000.00068.x. [DOI] [PubMed] [Google Scholar]
- Schönberg T, Daw ND, Joel D, O'Doherty JP. Reinforcement learning signals in the human striatum distinguish learners from nonlearners during reward-based decision making. J Neurosci. 2007;27:12860–12867. doi: 10.1523/JNEUROSCI.2496-07.2007. [DOI] [PMC free article] [PubMed] [Google Scholar]
- Schultz W. Getting formal with dopamine and reward. Neuron. 2002;36:241–263. doi: 10.1016/s0896-6273(02)00967-4. [DOI] [PubMed] [Google Scholar]
- Schultz W, Dickinson A. Neuronal coding of prediction errors. Annu Rev Neurosci. 2000;23:473–500. doi: 10.1146/annurev.neuro.23.1.473. [DOI] [PubMed] [Google Scholar]
- Schultz W, Dayan P, Montague PR. A neural substrate of prediction and reward. Science. 1997;275:1593–1599. doi: 10.1126/science.275.5306.1593. [DOI] [PubMed] [Google Scholar]
- Sidibé M, Smith Y. Thalamic inputs to striatal interneurons in monkeys: synaptic organization and co-localization of calcium binding proteins. Neuroscience. 1999;89:1189–1208. doi: 10.1016/s0306-4522(98)00367-4. [DOI] [PubMed] [Google Scholar]
- Suzuki T, Miura M, Nishimura K, Aosaki T. Dopamine-dependent synaptic plasticity in the striatal cholinergic interneurons. J Neurosci. 2001;21:6492–6501. doi: 10.1523/JNEUROSCI.21-17-06492.2001. [DOI] [PMC free article] [PubMed] [Google Scholar]
- Tricomi EM, Delgado MR, Fiez JA. Modulation of caudate activity by action contingency. Neuron. 2004;41:281–292. doi: 10.1016/s0896-6273(03)00848-1. [DOI] [PubMed] [Google Scholar]
- Yamada H, Matsumoto N, Kimura M. Tonically active neurons in the primate caudate nucleus and putamen differentially encode instructed motivational outcomes of action. J Neurosci. 2004;24:3500–3510. doi: 10.1523/JNEUROSCI.0068-04.2004. [DOI] [PMC free article] [PubMed] [Google Scholar]