

Abstract
Agonists at μ-opioid receptors (MORs) represent the gold standard for the treatment of severe pain. A key element of opioid analgesia is the depression of nociceptive information at the first synaptic relay in spinal pain pathways. The underlying mechanisms are, however, largely unknown. In spinal cord slices with dorsal roots attached prepared from young rats, we determined the inhibitory effect of the selective MOR agonist [d-Ala2, N-Me-Phe4, Gly5-ol]-enkephalin (DAMGO) on monosynaptic Aδ- and C-fiber-evoked EPSCs in lamina I neurons. DAMGO depressed presynaptically Aδ- and C-fiber-mediated responses, indicating that MORs are expressed on central terminals of both fiber types. We next addressed the mechanisms of presynaptic inhibition. The effect of DAMGO at both Aδ- and C-fiber terminals was mainly mediated by an inhibition of N-type voltage-dependent Ca2+ channels (VDCCs), and to a lesser extent of P/Q-type VDCCs. Inhibition by DAMGO was not reduced by K+ channel blockers. The rate of miniature EPSCs was reduced by DAMGO in a dose-dependent manner. The opioid also reduced Ca2+-dependent, ionomycin-induced EPSCs downstream of VDCCs. DAMGO had no effect on the kinetics of vesicle exocytosis in C-fiber terminals, but decreased the rate of unloading of Aδ-fiber boutons moderately, as revealed by two-photon imaging of styryl dye destaining. Together, these results suggest that binding of opioids to MORs reduces nociceptive signal transmission at central Aδ- and C-fiber synapses mainly by inhibition of presynaptic N-type VDCCs. P/Q-type VDCCs and the transmitter release machinery are targets of opioid action as well.
Introduction
Several lines of evidence suggest that inhibition in the spinal cord is a crucial mode of opioid action leading to analgesia (Yaksh, 1981). Unequivocally, opioids bind to spinal μ-opioid receptors (MORs), of which 40–70% are located on central terminals of primary afferent nociceptive nerve fibers (Besse et al., 1990; Gouardères et al., 1991). The opioid inhibition at the first synapses in pain pathways is key to opioid analgesia as intrathecal injection of MOR antagonists abolishes the analgesic action produced by systemic opioid administration (Chen and Pan, 2006). However, little is known about the mechanism(s) by which opioids mediate inhibition at these critical relay stations of nociception (Julius and Basbaum, 2001; Ikeda et al., 2003, 2006).
In other synaptic systems, opioids may reduce presynaptic Ca2+ influx through inhibition of voltage-dependent Ca2+ channels (VDCCs), facilitate presynaptic K+ conductances, or inhibit the neurotransmitter release machinery (Law et al., 2000; Schlicker and Kathmann, 2008). Which of these mechanisms accounts for suppression of signal transmission varies considerably depending on the synaptic system studied. For instance, in calyx presynaptic terminals of embryonic chick ciliary ganglions, opioids act mainly through N-type VDCCs (Endo and Yawo, 2000). On the other hand, excitatory as well as inhibitory input is often reduced presynaptically in rat brain neurons exclusively through a facilitation of K+ conductances (Vaughan et al., 1997; Barral et al., 2003; Zhu and Pan, 2005; Finnegan et al., 2006). In GABAergic neurons of the rat ventral tegmental area and in rat central amygdala neurons, opioids mainly act on presynaptic K+ channels as well as on the transmitter release machinery (Bergevin et al., 2002; Zhu and Pan, 2005).
A controversy exists about the expression of MORs in Aδ-fiber afferents terminating in superficial spinal dorsal horn. Electrophysiology has shown a presynaptic inhibition of monosynaptically evoked EPSCs at Aδ-fiber synapses on spinal lamina II neurons by MOR activation (Kohno et al., 1999; Ikoma et al., 2007). Immunohistochemical and binding studies have demonstrated MORs on small dorsal root ganglion cells, which could give rise to both Aδ- and C-fibers (Besse et al., 1990; Gouardères et al., 1991; Ding et al., 1996; Abbadie et al., 2001). A recent study has shown that in mice, MOR expression is almost exclusively concentrated in unmyelinated peptidergic TRPV1-positive nociceptors, but a few of the MOR-positive dorsal root ganglion neurons were of large diameter, usually considered as A-fibers (Scherrer et al., 2009). The key finding that δ-opioid receptors (DORs) and MORs are expressed by a different subset of primary afferents has, however, been challenged by a recent publication (Wang et al., 2010).
Here we report that the potency and the efficacy of presynaptic inhibition by [d-Ala2, N-Me-Phe4, Gly5-ol]-enkephalin (DAMGO) were higher on C-fiber terminals than on Aδ-fiber terminals. We found that the presynaptic inhibition by DAMGO at both Aδ- and C-fiber terminals involves an inhibition of N-type, and to a lesser extent of P/Q-type VDCCs. In addition, DAMGO causes a direct inhibition of the downstream transmitter release machinery without major slowing of vesicle trafficking in synaptic terminals.
Materials and Methods
Spinal cord slice preparation.
Young male Sprague Dawley rats (aged 17–25 d) were killed by decapitation, and the lumbar spinal cord was quickly removed. Transverse slices (∼500 μm thick) from segments L2–L6 with dorsal roots (10–15 mm) attached were cut using a vibrating microslicer (DTK-1000, Dosaka EM). Slices were incubated in a solution kept at 33°C containing the following (in mm): NaCl, 95; KCl, 1.8; KH2PO4, 1.2; CaCl2, 0.5; MgSO4, 7; NaHCO3, 26; glucose, 15; sucrose, 50; pH was 7.4, osmolarity 310–320 mOsmol · l−1, and oxygenated with 95% O2 and 5% CO2. A single slice was placed in the recording chamber and continuously superfused with oxygenated recording solution at a rate of 3–4 ml/min. The recording solution was identical to the incubation solution except for the following (in mm): NaCl, 127; CaCl2, 2.4; MgSO4, 1.3; and sucrose, 0. All experiments were performed at room temperature (22–25°C).
Experiments were in accordance with European Communities Council directives (86/609/EEC).
Electrophysiology.
Neurons of the dorsal horn were visualized with “Dodt” infrared optics (Dodt et al., 1998) using a ×40, 0.80 water-immersion objective on an Olympus BX50WI upright microscope equipped with a video camera. Only neurons at a distance of <20 μm from the dorsal white/gray matter border were considered as being lamina I neurons (Chéry et al., 2000) and used for the experiments. This spatial restriction corresponds to the zone in the superficial dorsal horn where the tangential orientation of the neuropil typical of lamina I was observed (Dahlhaus et al., 2005). All recordings were made in the whole-cell patch-clamp configuration at a holding potential of −70 mV using an Axopatch 200B patch-clamp amplifier and the pCLAMP 9 software package (both Molecular Devices). No correction for the liquid junction potential was made. Signals were low-pass filtered at 2–10 kHz, sampled at 10–20 kHz, and analyzed offline using pCLAMP 9. Patch pipettes (2–5 MΩ) from borosilicate glass were pulled on a horizontal puller (P-87, Sutter Instruments) and filled with a K+-free solution composed of the following (in mm): CsMeSO3, 120; TEA-Cl, 20; MgCl2, 2; HEPES, 10; EGTA, 10; Na2ATP, 2; and GDPβS, 0.5. The potassium-free GDPβS-solution was used to prevent postsynaptic MOR-mediated effects (Ataka et al., 2000; Ikoma et al., 2007).
Afferent-evoked EPSCs in lamina I neurons were elicited by stimulating dorsal roots electrically via a suction electrode with an isolated current stimulator (A360, World Precision Instruments). After determination of the threshold to elicit an EPSC, test pulses of 0.1 ms were given at intervals of 15 s for Aδ-fiber signals, and of 30 s for C-fiber signals. Stimulus intensity was adjusted to 200% of the threshold value. EPSCs were classified as Aδ-fiber evoked when the calculated conduction velocity was >1.5 m/s, and as C-fiber evoked when the conduction velocity was <0.5 m/s. Monosynaptic input was identified by the absence of failures in response to 10 stimuli at 10 Hz (Aδ-fiber input) or at 2 Hz (for C-fiber input) stimulation of dorsal roots, and a jitter in response latencies <10% of the response delay (Fig. 1D).
Figure 1.

Actions of MOR agonist DAMGO on presynaptic inhibition of monosynaptic Aδ- and C-fiber EPSCs. A, Time course of the reversible inhibition of DAMGO at different concentrations on evoked monosynaptic Aδ-fiber EPSCs. Right, Original traces taken from the indicated time points before (1), during (2), and after (3) the application of 1 μm DAMGO. B, Representative time course of the inhibitory effect of DAMGO (100 nm) on monosynaptic C-fiber EPSCs. Inset shows the corresponding original traces. C, Differential inhibition by DAMGO (100 nm) on Aδ- and C-fiber EPSCs recorded simultaneously from the same neuron. Inset, The corresponding original traces with Aδ- and C-fiber peaks. D, Dose–response curves of presynaptic DAMGO inhibition on monosynaptic C- (black circles) and Aδ-fiber (white circles)-evoked EPSCs. Numbers in parenthesis indicate the numbers of neurons tested. IC50 = 157 nm for C-fiber EPSCs and IC50 = 215 nm for Aδ-fiber EPSCs. Inset, The characterization of monosynaptic Aδ- and C-fiber-evoked EPSCs. Ten traces superimposed show a jitter of <10% of the response latency and no failures. Calibration: A, D (inset), 100 pA, 5 ms; B, C, 100 pA, 10 ms.
Measurements were made from only one neuron per spinal cord slice in all experiments performed.
Two-photon imaging of styryl dye destaining.
The dye loading and imaging procedure is outlined in Figure 6A and was similar to the protocol originally described by Zakharenko et al. (2001). Here spinal cord slices with dorsal root attached were placed into a recording chamber, mounted on a DMLFS A microscope (Leica Microsystems), and continuously perfused with standard recording solution. Patch-pipettes were filled with recording solution containing 25 μm Synaptogreen-C4 (an equivalent to FM1-43; Sigma Aldrich). Pipettes were inserted into the superficial spinal dorsal horn at a depth of ∼100 μm. After measuring C-fiber-evoked field potential to verify C-fiber input to the recording site, 20 μm 6-cyano-7-nitroquinoxaline-2,3-dione (CNQX) was bath applied for the rest of the experiments to restrict dye staining to afferent terminals and to prevent synaptically driven action potentials from accelerating dye release. After 10 min of CNQX application, positive pressure of 100–150 mbar was applied for 4 min to the pipette to eject styryl dye into the slice. This leads to a brightly stained area of ∼100 μm in diameter around the pipette tip. After 90 s of dye ejection, synaptic vesicles in the afferent terminals were loaded by applying a train of 1200 stimuli (3 mA, 0.5 ms) at 10 Hz to the attached dorsal root. Pressure was maintained for another 30 s to ensure that endocytosis (and dye uptake) was complete. The slices were then superfused for ∼20 min with 100 μm ADVASEP-7 (Sigma Aldrich) to reduce unspecific dye binding to extracellular tissue. ADVASEP-7 was present in the recording solution also during the unloading procedure to prevent the reuptake of Synaptogreen into the afferent terminals. To separate the destaining properties of A- and C-fiber terminals, we first applied 1800 stimuli (0.3 mA, 0.1 ms) at 10 Hz to the dorsal root, to destain afferent A-fiber boutons. Then C-fiber boutons were unloaded by stimulating the dorsal root with 3 mA for 0.5 ms using stimulation frequencies specified in the text.
Figure 6.
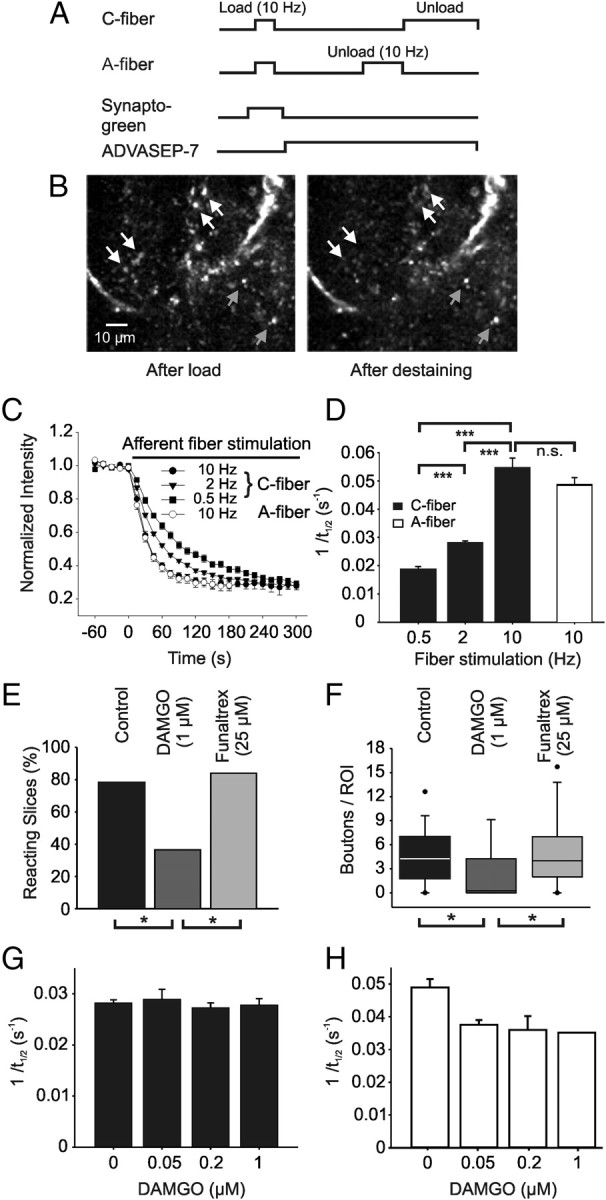
MOR agonist DAMGO reduced the amount of vesicle exocytosis in A- and C-fiber boutons but did not alter the kinetics of styryl dye destaining in C-fiber terminals. A, Protocol for determining kinetics of styryl dye release from afferent C-fiber terminals. Terminals were labeled by exposure to Synaptogreen during 10 Hz stimulation of the dorsal root for 2 min (load). ADVASEP-7 (100 μm) was applied to remove bound extracellular dye. Subsequent electrical stimulation in dye-free solution then released dye (unload). B, Fluorescent images of the same field within the superficial lamina of the spinal dorsal horn before and after an unloading C-fiber stimulation. White arrows show some of the unloading boutons; gray arrows point to puncta not affected by the stimulation. C, Decay of average intensity of the fluorescent puncta during unloading C-fiber stimulation using 0.5 Hz (black squares), 2 Hz (black triangles), and 10 Hz (black circles) stimulation, respectively. Destaining of puncta induced by stimulation (10 Hz) with A-fiber intensity shows similar kinetics (white circles). Each point represents the average of a total of 99–535 boutons from 5–32 different slices. D, Average rates of puncta unloading (1/t1/2) for the different stimulation frequencies applied with C-fiber (black bars) and A-fiber (white bar) intensity, respectively. E, Bath application of DAMGO (1 μm) reduced the proportion of slices reacting to dorsal root stimulation with C-fiber intensity at 2 Hz. Pretreatment with the specific MOR antagonist β-funaltrexamine (Funaltrex, 25 μm) abolished this effect. F, Box plot showing the decrease of the mean number of destaining C-fiber boutons per slice after DAMGO application and blockade of this effect by β-funaltrexamine. Frequency of unloading stimulation was 2 Hz. G, Bar chart showing average rates of puncta unloading (1/t1/2) during stimulation (2 Hz) with C-fiber intensity for different DAMGO concentrations. H, Bar chart showing average rates of puncta unloading (1/t1/2) during stimulation (10 Hz) with A-fiber intensity for increasing DAMGO concentrations. Number of slices tested: E, F, n = 32 for control, n = 11 for DAMGO, n = 25 for funaltrexamine, *p < 0.05; G, n = 25 for control, n = 4 for 50 nm, n = 6 for 200 nm, n = 4 for 1 μm DAMGO; H, n = 19 for control, n = 3 for 50 nm, n = 5 for 200 nm, n = 1 for 1 μm DAMGO.
Synaptogreen fluorescence was visualized using a Leica TCS SP2 system (Leica Microsystems) for two-photon microscopy combined with a Chameleon-XR femtosecond Ti-sapphire laser (Coherent) operating at 90 MHz repeat frequency. A FemtoControl pulse compressor (APE—Angewandte Physik & Elektronik) was used for the correction of the strong dispersion occurring of femtosecond pulses passing through optical material, e.g., the microscope. Excitation light was focused by an ×63 water-immersion objective (0.9 NA). The excitation wavelength was set to 840 nm. The average power delivered to the spinal cord surface was <100 mW. All imaged fields were within the first 100 μm depth, typically 40–80 μm. Scanning and image acquisition were controlled with Leica Confocal Software (version 2.61). Emitted light was collected with non-descanned detectors. We acquired 1024 × 512 pixel images (0.18 μm/pixel in the x- and y-axes) at time intervals of 15 s. Because z-axis drift differed from experiment to experiment, a series of 10 images at different focal planes, separated by 0.25 μm steps in the z direction, was acquired at the end of each experiment. During offline analysis, this stack was used to estimate the drift in z direction. All datasets, showing a movement of >0.5 μm/6 min, were discarded. ImageJ software (from NIH and available at http://rsb.info.nih.gov/ij/) was used to align acquired images over time to compensate potential shifts in x and/or y direction. Data were further analyzed using the Leica Confocal Software.
The area of the slice in which fluorescence intensity of puncta was analyzed was limited by the extension of the dye staining and restricted to the superficial spinal dorsal horn usually spreading to ∼100 μm in young rats from the border of the overlaying white matter. We first determined and counted those puncta that showed stimulus-dependent unloading. Because of the strong background staining in the spinal cord slice (see Fig. 6B), it was not possible to clearly identify all loaded boutons and therefore the proportion of unloading could not be estimated. Circular regions of interest (ROIs; diameter 0.5–1.5 μm) were drawn around punctate fluorescent spots (basic intensity more than two SDs above the mean background), which showed a decrease in intensity, temporally correlated to the afferent fiber stimulation. Additionally two background ROIs were selected per slice, and the averaged intensity values were subtracted from each punctum measured at each time point during the experiment. The activity-dependent components of Synaptogreen fluorescence were generated by normalizing each ROI time course to the maximal intensity of the punctum just before the onset of the stimuli. The halftime of decay of intensity during unloading (t1/2) was calculated for each punctum from single exponential fits to the curve starting after the control period. For data presentation, the rate of unloading (1/t1/2) was calculated as an index of presynaptic function.
Drug application.
All drugs were applied to the bath solution at known concentrations. Drugs used were bicuculline and verapamil (Fluka); tetrodotoxin (TTX, Ascent Scientific); ω-conotoxin GVIA (Bachem); ω-agatoxin TK and calciseptine (Alomone Labs); β-funaltrexamine and d-Phe-Cys-Tyr-d-Trp-Orn-Thr-Pen-Thr-NH2 (CTOP, both Tocris Bioscience), CdCl2, BaCl2, and CsCl (all Merck); and DAMGO, nifedipine, strychnine, GDPβS, CNQX, and ionomycin (all Sigma Aldrich).
Analysis of the electrophysiological data.
Amplitudes of dorsal root-evoked monosynaptic EPSCs were calculated by subtracting the baseline from the peak amplitude. Effects of DAMGO were quantified as a percentage change in EPSC amplitude compared to the baseline.
Miniature EPSCs (mEPSCs) were counted and analyzed using MiniAnalysis software (Synaptosoft). Each mEPSC event was visually accepted or rejected based upon the rise and decay times after an automatic screening by the software.
Curve fitting for the concentration–inhibition relationship of DAMGO was performed using Sigmaplot software (SPSS). Best matches were obtained by application of the Chapman equation with four parameters:
 |
where F is the inhibition ratio of DAMGO on EPSCs amplitudes, and x is the respective concentration.
Statistical analysis.
Analysis of the data was performed using SigmaStat 3.1 (SPSS). Values are given as means ± 1 SEM. Statistical comparison of mean values of the electrophysiological data was assessed by applying Student's paired t test. Tests used for statistical analysis of the two-photon imaging data are stated in the text. The critical value for statistical significance was set at p < 0.05 (*), p < 0.01 (**), or p < 0.001 (***).
Results
In a spinal cord slice preparation whole-cell patch-clamp recordings were made from lamina I neurons, which play a pivotal role in hyperalgesia and allodynia (Sandkühler, 2009). Monosynaptically evoked EPSCs in response to electrical stimulation of the dorsal root afferents were measured. All EPSCs were recorded in the presence of bicuculline (10 μm) and strychnine (10 μm) in the bath solution to prevent inhibitory network activity. To isolate the presynaptic effects of opioid action, a modified intracellular solution was used: (1) GDPβS was added to block G-protein-coupled postsynaptic effects of MOR activation, (2), K+ channel inhibitors were included to block activation of these channels, and (3) a high EGTA concentration in the recording pipette was used to block any postsynaptic Ca2+-dependent mechanism. To confirm that any effects of MORs on the postsynaptic membrane potential were abolished, we monitored the holding current of the amplifier throughout the entire experiments. This revealed that no outward currents were induced by DAMGO in any of the 173 neurons tested. Application of 20 μm CNQX abolished EPSCs, suggesting that the recorded postsynaptic events were AMPA receptor mediated (n = 6, data not shown).
Different potency and efficacy of opioid-mediated inhibition at central terminals of afferent Aδ- and C-fibers
To determine the dose–response relationship of the MOR agonist DAMGO on evoked EPSCs, we first recorded a response baseline (control) of at least 2 min followed by the application of the opioid for a duration of 2 min and an additional wash-out period of at least 5 min (Fig. 1A–C).
DAMGO was applied at concentrations of 10 nm, 100 nm, 500 nm, 1 μm, 5 μm, or 10 μm. Successful recordings from 84 lamina I neurons with monosynaptic C-fiber input and from 37 lamina I neurons with monosynaptic Aδ-fiber input revealed dose–response relationships of DAMGO on Aδ- and C-fiber EPSCs (Fig. 1D).
Presynaptic inhibition of C-fiber-evoked EPSCs by DAMGO was, on average, by 16 ± 12.6% (n = 5) at a concentration of 10 nm, and reached a maximum inhibition by 87.1 ± 4.3% (n = 12) at 10 μm. Pretreating the slices with the specific MOR antagonists β-funaltrexamine (25 μm, n = 6) or CTOP (1 μm, n = 6) for at least 10 min abolished the inhibition of C-fiber-evoked EPSCs by DAMGO (10 μm) (mean change in EPSC amplitude by −1.7 ± 4.4% and −5.5 ± 11.8%, respectively; data not shown).
DAMGO had no effect on Aδ-fiber EPSCs at a concentration of 10 nm (n = 4) and produced a maximum inhibition at 10 μm by 62.8 ± 5.2% (n = 8). DAMGO application had no effect, even at the highest concentration (10 μm), after pretreatment with 25 μm β-funaltrexamine (n = 5, data not shown).
Analyses of the dose–response curve for DAMGO (Fig. 1D) revealed a maximum efficacy of presynaptic inhibition at C-fiber terminals of 89 ± 4.5%, and of 64 ± 3.2% at Aδ-fiber synapses. According to the equation F = −0.6 + 90.4 · (1 − e−0.0006 · x)0.29 for C-fibers, the IC50 value amounted to 157 nm. Analogously, the IC50 value for Aδ-fibers amounted to 215 nm according to the equation F = −0.66 + 64.6 · (1 − e−0.0036 · x)1.1.
Voltage-dependent Ca2+ channels are targets of presynaptic inhibition by DAMGO
Multiple types of VDCCs are crucially involved in action potential-dependent neurotransmitter release. A blockade of these channels by the unspecific VDCC-blocker Cd2+ (200 μm) abolished EPSCs in all neurons tested (n = 6, data not shown). Aδ- and C-fiber synapses on spinal lamina I neurons have been shown to express mainly N-type, P/Q-type, and to a lesser extent L-type VDCCs (Heinke et al., 2004). All three types of VDCCs express the subunit α1, which is thought to be the target of βγ subunits of activated G-proteins, making them candidates for opioid-mediated inhibition (Tedford and Zamponi, 2006). To test the involvement of these presynaptic VDCCs, the inhibition of monosynaptically evoked EPSCs by DAMGO was compared in the absence and presence of specific VDCC blockers (Fig. 2). The two inhibitory effects of DAMGO were quantitatively compared by the ratio of the EPSC amplitudes recorded during blocker application to the control (Gompf et al., 2005). The combined inhibitory effect of the opioid and the VDCC blocker was also analyzed to examine the extent to which the blocked VDCCs contribute to the inhibitory effect of DAMGO. To account for the different IC50 values (Fig. 1D), DAMGO was applied at different concentrations to test the contribution of presynaptic VDCCs to the inhibition of C-fiber-evoked EPSCs (100 nm) and of Aδ-fiber-evoked EPSCs (250 nm), respectively.
Figure 2.

Blockers of VDCCs reduced the inhibitory effect of MOR agonist DAMGO on monosynaptic C- and Aδ-fiber-evoked EPSCs, respectively. A, Representative time course of EPSC amplitudes (Aa) and corresponding bar graph (black bars, Ab) demonstrating the reduced inhibition of C-fiber-evoked EPSCs by DAMGO (100 nm) in the presence of the N-type-specific VDCC blocker ω-conotoxin GVIA (ω-CTX GVIA, 1 μm; n = 7). Ac, Bar graph (white bars) summarizes the effect of ω-CTX GVIA on the inhibition of Aδ-fiber-evoked EPSCs by 250 nm DAMGO (n = 8). B, Typical recording of EPSC amplitudes (Ba) and corresponding bar graph (black bars, Bb) showing the reduced inhibition of C-fiber-evoked EPSCs by 100 nm DAMGO in the presence of the P/Q-type-specific VDCC blocker ω-agatoxin (ω-AgTx, 300 nm; n = 5). Bc, Bar graph (white bars) summarizes the effect of ω-AgTx on the inhibition of Aδ-fiber-evoked EPSCs by 250 nm DAMGO (n = 6). C, Time course of EPSC amplitudes (Ca) and corresponding bar graph (black bars, Cb) demonstrating that the L-type-specific VDCC blocking toxin calciseptine (0.5 μm) has no effect on the inhibition of C-fiber-evoked EPSCs by 100 nm DAMGO (n = 5). Cc, Bar graph (white bars) shows the effect of calciseptine on the inhibition of Aδ-fiber-evoked EPSCs by 250 nm DAMGO (n = 5). *p < 0.05; **p < 0.01; n.s., not significant.
We first showed that the inhibition of monosynaptic C-fiber-evoked EPSCs by DAMGO can be reproduced in the same neuron. The inhibition by the first application of DAMGO was by 46.5 ± 6.9% and not different from the inhibition by the second application (by 45.7 ± 7.6%; n = 5, p = 0.52; data not shown).
To assess the role of N-type VDCCs, the specific blocker ω-conotoxin GVIA (1 μm) was added to the bath solution. The first application of DAMGO induced on average an inhibition by 46.3 ± 7.2% (n = 7). After washout of DAMGO and recovery of the response, DAMGO was applied a second time in the presence of ω-conotoxin GVIA. Under these conditions, DAMGO further inhibited the remaining C-fiber signal, which was already reduced by the blocker, additionally by a mean of 24.4 ± 2.7% of the initial amplitude, that is a reduction of the initial effect of DAMGO by 47.3% (p < 0.01) (Fig. 2Aa,Ab). The fact that DAMGO can induce further inhibition under blockade of N-type VDCCs suggests that the N-type VDCC is not the only target of the opioid. The combined inhibitory effect of the opioid and the ω-conotoxin amounted to 72.3 ± 4.6%, suggesting that not all available N-type VDCCs are blocked by DAMGO at the concentration tested. The inhibition of monosynaptic Aδ-fiber-evoked EPSCs by DAMGO under blockade of ω-conotoxin GVIA (1 μm) revealed similar results (Fig. 2Ac). MOR activation inhibited the initial Aδ-fiber EPSC amplitudes on average by 54.5 ± 5.2% and by 30 ± 5.9%, when the toxin was present in the bath, meaning a significant reduction of the opioid effect by 45% (n = 8, p < 0.05).
In an analog set of experiments, the effect of DAMGO on Aδ- and C-fiber-evoked EPSCs was tested in the presence of the P/Q-type-specific blocker ω-agatoxin TK (300 nm). On average, DAMGO inhibited the initial C-fiber EPSCs by 53.4 ± 6.8% before the application of the blocker and by 40.6 ± 3.5% in the presence of the toxin. On average, the P/Q-type-specific blocker reduced the effect of the opioid significantly by 24% (n = 5, p < 0.05). There was no difference between the inhibition by DAMGO alone and the combined effect of DAMGO and ω-agatoxin, suggesting that P/Q-type VDCCs were blocked by the opioid as effectively as by ω-agatoxin (Fig. 2Ba,Bb). DAMGO inhibited the initial Aδ-fiber-evoked EPSCs on average by 49.1 ± 5.9% and by 35.2 ± 6.6% in the presence of ω-agatoxin (Fig. 2Bc). The P/Q-type blocker reduced the effect of the MOR agonist significantly by 28.3% (n = 6, p < 0.05).
None of the used VDCC blockers alone were able to completely occlude the action of the opioid, neither on C-fiber- (n = 12) nor on Aδ-fiber- (n = 14) evoked EPSCs.
We next determined the involvement of L-type VDCCs. Verapamil is often used in an attempt to block these Ca2+ channels. We found in the presence of this blocker a significant reduction by 29% of the DAMGO effect on Aδ-fiber and by 14% on C-fiber terminals, respectively. The specificity of verapamil has, however, been challenged (Cai et al., 1997; Dobrev et al., 1999; Gutman et al., 2005). We therefore used additional, more specific inhibitors of L-type VDCCs. In the presence of the L-type blocker nifedipine (40 μm), DAMGO inhibited the C-fiber signal on average by 44.8 ± 6.3% and by 43.6 ± 7% in the absence of the blocker (n = 5, p = 0.73). DAMGO reduced the Aδ-fiber EPSCs on average by 41.6 ± 7.7% and in the presence of nifedipine by 40.2 ± 9.7% (n = 5, p = 0.83). Since the selectivity of dihydropyridines for L-type currents has also been questioned recently, especially in sensory neurons (Zhang and Gold, 2009), we next used the L-type-specific toxin calciseptine (de Weille et al., 1991). DAMGO inhibited the C-fiber-evoked EPSCs by 42.5 ± 8.6%, and in the presence of the toxin (0.5 μm) by 43.7 ± 7.9%. The difference between the two actions of the opioid was not statistically significant (n = 5, p = 0.77) (Fig. 2Ca,Cb). The inhibition of Aδ-fiber-evoked signals by the first application of DAMGO was by 45.9 ± 9.8% and not different from the inhibition by the second application in the presence of calciseptine (by 51.1 ± 12.5%; n = 5, p = 0.43) (Fig. 2Cc). The use of specific blockers thus revealed that L-type VDCCs are no significant targets of presynaptic inhibition at Aδ-fibers or C-fibers by DAMGO.
Opioids directly target the neurotransmitter release machinery of synapses in lamina I of the spinal cord
To test whether opioids are able to reduce Ca2+-triggered neurotransmitter release independent of VDCCs, we used the Ca2+ ionophore ionomycin, which bypasses Ca2+ entry through VDCCs (Capogna et al., 1996). mEPSCs were recorded in the presence of TTX (1 μm) and Cd2+ (200 μm) to prevent action potential-dependent effects. These mEPSCs were completely blocked by CNQX, suggesting that they were mediated by AMPA receptors (n = 5, data not shown). Within a period of 20 min, a stable baseline of 2 min was first recorded as control, followed by an application of DAMGO for 2 min, and a subsequent wash-out period for ∼15 min. On average, ionomycin (2 μm) added to the bath solution increased the rate of mEPSCs by 403 ± 52%, from a baseline of 1.8 ± 0.4 events · s−1 to 7 ± 1.6 events · s−1. Application of 10 μm DAMGO to the bath solution for 2 min reduced the rate of mEPSC events significantly to 4.6 ± 1.6 events · s−1, i.e., by 39 ± 4.2% (n = 7, p < 0.01) (Fig. 3A–C). The amplitudes of the ionomycin-induced EPSCs were not altered significantly (Fig. 3D). We recorded mEPSCs under control conditions with a mean amplitude of 40.1 ± 11.2 pA, in the presence of ionomycin with a mean of 35.1 ± 8.7 pA, and further in the presence of DAMGO with a mean of 27.7 ± 8.4 pA. The paired t test revealed no significance between mean amplitude of the group of ionomycin-induced EPSCs and that with additional DAMGO application (n = 6, p = 0.25).
Figure 3.

MOR agonist DAMGO (10 μm) reduced the rate of ionomycin-induced mEPSCs in rat spinal lamina I neurons. A, Representative traces of mEPSC events (control), and mEPSCs, induced by 2 μm ionomycin, before, during, and after application of DAMGO, showing a reduction of ionomycin-induced mEPSCs (VHold = −70 mV). TTX (1 μm) and Cd2+ (200 μm) were included in the bath solution. B, Bar graph summarizes the mean mEPSC rates. C, Typical time course of the action of ionomycin (2 μm) and DAMGO on mEPSC rate. D, Bar graph shows the lacking effect of DAMGO on mEPSC amplitudes. Calibration: A, 50 pA, 1 s. Number of neurons tested: B, D, n = 6; **p < 0.01.
Next we tested the action of DAMGO on spontaneous neurotransmitter release at resting intracellular Ca2+ concentrations, i.e., independent of any presynaptic Ca2+ rise. Application of DAMGO under these conditions, in the presence of TTX (1 μm), also reduced the mEPSC rate significantly in a dose-dependent manner. DAMGO at 100 nm reduced the mEPSC rate on average by 48.2 ± 7.2% (n = 4, p < 0.05) from initially 2.7 ± 0.4 events · s−1 to 1.4 ± 0.3 events · s−1 (Fig. 4A,B). Washout of DAMGO seemed to restore mEPSC rate in three out of four cells within 10–12 min. This is in line with a study showing recovery of mEPSC rate within 10 min after washout of 1 μm DAMGO in lamina II cells (Zhou et al., 2008). Application of 10 μm DAMGO reduced the mEPSC rate by 68.7 ± 2.7% (n = 7, p < 0.01) from initially 3.4 ± 0.2 events · s−1 to 1.1 ± 0.1 events · s−1 (Fig. 4C). Washout of 10 μm DAMGO for 15 min restored mEPSC rates to 53.7% of control (2.3 ± 0.2 Hz, p < 0.001) (Fig. 4C). The amplitudes of the mEPSCs were not affected by DAMGO. Before application of 100 nm DAMGO, the mean amplitude was 36 ± 4.7 pA, and in the presence of the opioid 33.7 ± 3.8 pA (n = 5, p = 0.09) (Fig. 4B). The amplitude of mEPSCs before application of 10 μm DAMGO was 42 ± 2.5 pA, and under presence of the opioid 40.7 ± 1.5 pA (n = 7, p = 0.24) (Fig. 4C).
Figure 4.

MOR agonist DAMGO reduced the rate of mEPSCs in rat spinal lamina I neurons also under resting Ca2+ concentrations. A, Representative traces of mEPSCs recorded before (control), during, and after (wash) DAMGO (100 nm) application, demonstrating a reduction of mEPSC rates (VHold = −70 mV). TTX (1 μm) was included in the bath solution. B, Bar graphs show the mean rates and amplitudes of mEPSCs before, during, and after application of 100 nm DAMGO. C, Effect of 10 μm DAMGO on the mean rate and amplitude of mEPSCs. Calibration: A, 50 pA, 1 s. Number of neurons tested: B, n = 4; C, n = 7. *p < 0.05; **p < 0.01.
Potassium conductances are not involved in the presynaptic inhibitory action of opioids
The contribution of presynaptic K+ conductances to the action of DAMGO on monosynaptic C-fiber EPSCs was tested by using Ba2+ and Cs+ as blockers of inward rectifying potassium conductances (Hagiwara et al., 1978). Inactivation of K+ channels led to a slight enhancement of the EPSC-amplitude in most neurons tested (Fig. 5). Following the same experimental design as for the VDCCs experiments, we first determined the magnitude of inhibition by DAMGO alone, and then assessed the effect in the presence of the respective blocker. DAMGO inhibited the C-fiber signal by 55.8 ± 8% initially, and by 51.6 ± 7% in the presence of Ba2+ (1 mm). The difference between the two actions of the opioid was not statistically significant (n = 5, p = 0.8) (Fig. 5A). We also applied Cs+ (5 mm) in some experiments to further test the role of inward rectifying potassium conductances. DAMGO inhibited the C-fiber-evoked signal by 50.3 ± 9.9%, and in the presence of 5 mm Cs+ by 52.3 ± 8.9%. The difference was not significant (n = 3, p = 0.37) (Fig. 5B). Together, these results suggest that presynaptic K+ conductances are not modified upon MOR activation.
Figure 5.

Blockers of K+ conductances did not reduce the inhibitory effect of MOR agonist DAMGO (100 nm) on monosynaptic C-fiber-evoked EPSCs. Aa, Ba, Representative time courses of the amplitudes of evoked EPSCs showing no reduction of the inhibition by DAMGO in the presence of the inward rectifying K+ channel blockers Ba2+ (1 mm) and Cs+ (5 mm), respectively. Ab, Bb, Bar graphs illustrate no change in DAMGO action before and after application of Ba2+ and Cs+, respectively. Number of neurons tested: n = 5 for Ba2+, n = 3 for Cs+. n.s., not significant.
Presynaptic inhibitory action of opioids does alter kinetics of vesicle exocytosis at terminals of afferent A-fibers, but not of C-fibers
Activity-dependent exocytosis of synaptic vesicles can be imaged by the destaining of styryl dyes. The early phase of destaining is explained by the exocytosis of vesicles from the readily releasable and the mobilization pools, while the later, slow phase represents exocytosis of the reserve pool of synaptic vesicles. Here we compared the release of the styryl dye Synaptogreen before and after the application of DAMGO. We first evaluated the sensitivity of this method in primary afferent nerve terminals by measuring the effect of different frequencies of dorsal root stimulation with C-fiber intensity on the rate of dye unloading in superficial dorsal horn (Zakharenko et al., 2001). The experimental protocol is shown in Figure 6A. During a train of stimuli, the intensity of puncta staining decayed depending on the applied frequency and intensity, respectively (Fig. 6B,C). The average rate of dye unloading (1/t1/2) increased significantly from 0.019 ± 0.001 s−1 (n = 5 slices) at 0.5 Hz to 0.028 ± 0.001 s−1 (n = 32 slices) at 2 Hz and to 0.055 ± 0.003 s−1 (n = 30 slices) at 10 Hz (p < 0.001, Kruskal–Wallis test) (Fig. 6D). The average destaining rate in superficial dorsal horn during dorsal root stimulation with A-fiber intensity (10 Hz) was not different from corresponding C-fiber destaining (0.049 ± 0.003 s−1, n = 19 slices; p = 0.23, Mann–Whitney test) (Fig. 6D). Application of DAMGO (1 μm) to the bathing solution reduced the proportion of slices reacting to the destaining train of stimuli (2 Hz, C-fiber strength) from 78% (control, n = 32) to 36% (n = 11) (Fig. 6E) significantly (p < 0.05; Fisher's exact test). In addition, DAMGO reduced the number of destaining boutons per imaging window from 4.58 ± 0.65 (n = 32) to 2.25 ± 0.9 (n = 11; p < 0.05; Mann–Whitney test) (Fig. 6F). Similar results could be obtained with A-fiber destaining. DAMGO (1 μm) reduced the proportion of slices reacting to the train of stimuli (10 Hz, A-fiber strength) from 79% (control, n = 24) to 18% (n = 11) significantly (p < 0.01; Fisher's exact test). In addition, DAMGO reduced the number of destaining boutons per imaging window from 5.9 ± 1.1 (n = 24) to 0.5 ± 0.3 (n = 11; p < 0.05; Mann–Whitney test). These findings suggest a presynaptic inhibition at some but not all C-fiber and A-fiber terminals, respectively. Pretreating the slices with the specific MOR antagonist β-funaltrexamine (25 μm) abolished the effect of DAMGO application on the number of slices reacting to stimulation with C-fiber strength (84%, n = 25) (Fig. 6E) and on the average number of unloading boutons per imaging window (5.2 ± 0.9) (Fig. 6F). Interestingly, the rate of bouton destaining of C-fiber terminals in superficial spinal dorsal horn, i.e., the kinetics of vesicle exocytosis, was not affected by DAMGO tested over a wide range of concentrations (Fig. 6G). In contrast, application of DAMGO slowed the kinetics of bouton destaining when stimulating the dorsal root with A-fiber intensity (Fig. 6H).
Discussion
The present study addressed mechanisms of MOR-mediated presynaptic inhibition at Aδ- and C-fiber terminals, i.e., at the first synaptic relay in pain pathways. Our data revealed similar mechanisms of inhibition by DAMGO at the terminals of both afferent fiber types.
Potency and efficacy of opioid inhibition is higher on C-fiber than on Aδ-fiber terminals
The potency and the efficacy of the MOR agonist DAMGO were higher at C-fiber synapses than at Aδ-fiber synapses. This may explain the observation that C-fiber-mediated pain is well controlled by opioids, whereas Aδ-fiber-mediated nociception requires higher doses (Yeomans et al., 1996). A recent electrophysiological study also showed that the inhibition is higher at C-fiber synapses than at Aδ-fiber synapses contacting lamina II neurons (Ikoma et al., 2007). Possibly the preferential inhibition of C-fiber-evoked EPSCs by opioids could be due to higher density of MORs on the terminals of C-fibers relative to Aδ-fibers (Ikoma et al., 2007). A recent publication demonstrated MOR expression almost exclusively on TRPV1-positive peptidergic unmyelinated nociceptors (Scherrer et al., 2009). Only a few of the MOR-positive dorsal root ganglion neurons in that study were putatively A-fibers. We recorded from lamina I neurons where peptidergic but not nonpeptidergic C-fibers terminate (Lorenzo et al., 2008), which is in line with those data. The presynaptic inhibition of monosynaptic Aδ-fiber-evoked EPSCs in lamina I (the present data) and lamina II (Kohno et al., 1999; Ikoma et al., 2007) and the blockade of the inhibition by specific MOR antagonists in our experiments strongly suggest that in the rat a significant proportion of Aδ-fiber terminals express functional MORs and that the inhibition by DAMGO is not mediated by DORs, which are also expressed on thinly myelinated afferent fibers. The present and previous work (Wang et al., 2010) seems to challenge the conclusion drawn by Scherrer et al. (2009) that in mice A-fibers largely express DORs but only marginally MORs. It could either indicate significant species differences in the expression of MORs on Aδ-fibers or a preferred input of MOR-expressing A-fibers to superficial dorsal horn neurons investigated in this and previous studies (Kohno et al., 1999; Ikoma et al., 2007).
Lamina I neurons comprise inhibitory and excitatory interneurons and projection neurons. The fact that DAMGO depressed Aδ- or C-fiber-evoked responses of virtually all neurons recorded in this and in previous studies (e.g., Drdla et al., 2009) strongly suggests that MOR agonists may inhibit nociceptive responses of all neurons, thus leading to a global reduction in activity but keeping the relative balance of excitation and inhibition intact.
Cellular mechanisms underlying the inhibitory effect of opioids at C-fiber synapses
We next studied signal transduction mechanisms of opioid inhibition at Aδ- and C-fiber terminals. The presented results suggest that 45–48% of the DAMGO effect on Aδ- and C-fiber terminals is mediated through N-type and 24–28% through P/Q-type VDCCs. L-type VDCCs do not contribute to the inhibiting effect of μ-opioid agonists on Aδ- and C-fiber-evoked EPSCs in lamina I neurons. In addition, blocking L-type VDCCs selectively with calciseptine had no effect on normal synaptic transmission between primary afferents and lamina I neurons. When we used verapamil at 50 μm in the present and in a previous study (Heinke et al., 2004), basal synaptic transmission was, however, mildly reduced. Since this phenylalkylamine at the concentration used may also block P/Q-type Ca2+ channels (Cai et al., 1997; Dobrev et al., 1999) and various K+ channels (Gutman et al., 2005), we now conclude that L-type VDCCs do not significantly contribute to synaptic transmission at Aδ- and C-fiber terminals. The different contributions of the VDCC subtypes to the DAMGO effect thus reflect the quantitative composition of N- and P/Q- Ca2+ channel subtypes expressed on Aδ- and C-fiber terminals (Heinke et al., 2004). A similar sensitivity of VDCCs to μ-opioids was shown in cell cultures of acutely isolated dorsal root ganglion cells (Rusin and Moises, 1995; Wu et al., 2004).
In the present study, we found a smaller effect of ω-conotoxin GVIA on Aδ- and C-fiber-evoked EPSCs than in our previous data (Heinke et al., 2004). An incomplete block by the toxin in the present study is unlikely, since we used the very same concentration and measured under steady-state conditions. Possibly developmental changes in the contribution of N-type channels to neurotransmission at some central synapses may be involved (Iwasaki et al., 2000; Momiyama, 2010). Alternatively, the use of cytochrome C to prevent unspecific peptide binding to tubing in our previous as well as in other studies (Su et al., 2002) could have played a role. In any case, N-type VDCCs, which contribute most to signal transmission of both Aδ- and C-fibers, are also the main target of presynaptic inhibition by MOR agonists.
Inhibition of Ca2+ currents triggered by activation of G-proteins is a widespread phenomenon in nerve endings. The most prominent mechanism leading to inhibition of VDCCs is via a fast, voltage-dependent G-protein βγ-mediated inactivation of these channels (De Waard et al., 1997; Brown and Sihra, 2008). Gβγ-subunits directly bind to α1 subunits of VDCCs (Tedford and Zamponi, 2006), and depolarization favors the dissociation of the respective G-protein subunits (Brown and Sihra, 2008).
The relative contribution of VDCC subtypes to synaptic strength may, however, not be linearly related to the presynaptic Ca2+ entry, since the relationship between Ca2+ influx and transmitter release can be described by a power law, where n of the function may be different for different VDCCs (n ≈ 2.5 for N-type and n ≈ 4 for P/Q-type channels) (Mintz et al., 1995).
Another substantial effect on transmitter release may arise from the fact that synaptic Ca2+ currents strongly depend on the amplitude and width of action potentials (Borst and Sakmann, 1999). Action potential repolarization and duration is critically controlled by K+ channels. These K+ channels are not directly controlled by G-protein subunits. Instead, a pathway involving phospholipase A2, arachidonic acid, and 12-lipoxygenase is suggested, at least for the opioid inhibition of GABAergic synaptic currents in the PAG, mediated by MORs (Vaughan et al., 1997). For the inhibition at Aδ- and C-fiber terminals, we found no involvement of these K+ channels. Most widely distributed are G-protein-gated inwardly rectifying K+ channels (GIRK channels), which are activated by βγ-subunits of G-proteins. These channels are common in nerve endings (Meir et al., 1999), but in the superficial layers of the spinal cord they are mainly expressed postsynaptically (Marker et al., 2005). And indeed, our results suggest that presynaptic K+ channels do not contribute significantly to the inhibition by DAMGO. Postsynaptic GIRK2 channels may likewise be dispensable. There is evidence that the analgesic effect of μ-opioids is fully preserved in mice lacking GIRK2 channels, which are responsible for postsynaptic hyperpolarization upon MOR activation (Mitrovic et al., 2003).
Neurotransmitter release can also be modulated by a direct effect of G-protein-coupled receptor activation on the release apparatus downstream of VDCCs (Brown and Sihra, 2008). This effect can be determined by recording mEPSCs, a measure of quantal vesicle release independent of VDCCs, at the global and unidentified excitatory input of neurons. Interestingly, [Met5]enkephalin had no effect on the mEPSC rate recorded in marginal neurons from slices of rat lumbar spinal cord under conditions where external Ca2+ was replaced by Mg2+ (Hori et al., 1992). In our study, a dose-dependent reduction of mEPSC events by DAMGO was observed under blockade of Ca2+ influx through VDCCs by Cd2+ in lamina I neurons of the spinal cord, which normally receive input from Aδ- and C-fibers. This suggests that opioids may also target the transmitter release machinery directly. G-protein-coupled receptor regulation seems to act at the neurotransmitter release cycle. Well documented is a pathway involving direct Gβγ-mediated regulation of SNARE complex assembly and exocytosis, and changes in vesicle fusion properties (Blackmer et al., 2001; Gerachshenko et al., 2005; Photowala et al., 2006).
The present results with styryl dye destaining suggest that DAMGO over a wide range of concentrations fully blocked transmitter release at some C-fiber terminals. The lack of DAMGO effects at some C-fiber terminals is in line with immunocytochemical data, demonstrating coexpression of MORs and substance P or calcitonin gene-related peptide, respectively, only in a subset of primary afferent neurons (Li et al., 1998; Abbadie et al., 2001). Interestingly, MOR activation did not affect the kinetics of exocytosis at the remaining C-fiber synapses. Such an all-or-none effect has been shown, e.g., at glutamatergic synapses of hippocampal pyramidal neurons, where adaptation of glutamate release to ongoing depolarization alters the number of active synapses but not the FM1-43 destaining of the remaining active synapses (Moulder et al., 2006). In rat hippocampal slices and culture, the destaining rate of FM1-43 from GABAergic and glutamatergic synaptic boutons did not change when vesicle filling was blocked. This led to a reduced synaptic transmission as indicated by a dramatic reduction of mPSC rates (Zhou et al., 2000). MORs are G-protein-coupled receptors (Brown and Sihra, 2008) and heterotrimeric G-proteins have been shown to inhibit vesicular glutamate transport, e.g., in different cerebellar synapses (Pahner et al., 2003). In contrast, at A-fiber synapses, activation of MORs decreased the destaining rate to some extent, suggesting a possible effect on vesicle filling and/or a slowing of transmitter release from these terminals.
Here we showed that DAMGO inhibits signal transmission at Aδ- and C-fiber synapses very effectively by a dual intracellular mechanism including the main subtypes of VDCCs and the neurotransmitter release apparatus. Better understanding of the molecular mechanisms of presynaptic inhibition by opioids at crucial relay stations of nociception may lead to more effective pain treatment.
Footnotes
This work was supported by grants from Austrian Science Fund (FWF) to J.S. (P22306-B19), and by the Hochschuljubiläumsstiftung of the City of Vienna to E.G.
References
- Abbadie C, Pasternak GW, Aicher SA. Presynaptic localization of the carboxy-terminus epitopes of the μ opioid receptor splice variants MOR-1C and MOR-1D in the superficial laminae of the rat spinal cord. Neuroscience. 2001;106:833–842. doi: 10.1016/s0306-4522(01)00317-7. [DOI] [PubMed] [Google Scholar]
- Ataka T, Kumamoto E, Shimoji K, Yoshimura M. Baclofen inhibits more effectively C-afferent than Aδ-afferent glutamatergic transmission in substantia gelatinosa neurons of adult rat spinal cord slices. Pain. 2000;86:273–282. doi: 10.1016/S0304-3959(00)00255-4. [DOI] [PubMed] [Google Scholar]
- Barral J, Mendoza E, Galarraga E, Bargas J. The presynaptic modulation of corticostriatal afferents by μ-opioids is mediated by K+ conductances. Eur J Pharmacol. 2003;462:91–98. doi: 10.1016/s0014-2999(02)02877-7. [DOI] [PubMed] [Google Scholar]
- Bergevin A, Girardot D, Bourque M-J, Trudeau L-E. Presynaptic μ-opioid receptors regulate a late step of the secretory process in rat ventral tegmental area GABAergic neurons. Neuropharmacology. 2002;42:1065–1078. doi: 10.1016/s0028-3908(02)00061-8. [DOI] [PubMed] [Google Scholar]
- Besse D, Lombard M-C, Zajac J-M, Roques BP, Besson J-M. Pre- and postsynaptic distribution of μ, δ and κ opioid receptors in the superficial layers of the cervical dorsal horn of the rat spinal cord. Brain Res. 1990;521:15–22. doi: 10.1016/0006-8993(90)91519-m. [DOI] [PubMed] [Google Scholar]
- Blackmer T, Larsen EC, Takahashi M, Martin TF, Alford S, Hamm HE. G protein βγ subunit-mediated presynaptic inhibition: regulation of exocytotic fusion downstream of Ca2+ entry. Science. 2001;292:293–297. doi: 10.1126/science.1058803. [DOI] [PubMed] [Google Scholar]
- Borst JGG, Sakmann B. Effect of changes in action potential shape on calcium currents and transmitter release in a calyx-type synapse of the rat auditory brainstem. Philos Trans R Soc Lond B Biol Sci. 1999;354:347–355. doi: 10.1098/rstb.1999.0386. [DOI] [PMC free article] [PubMed] [Google Scholar]
- Brown DA, Sihra TS. Presynaptic signaling by heterotrimeric G-proteins. Handb Exp Pharmacol. 2008;184:207–260. doi: 10.1007/978-3-540-74805-2_8. [DOI] [PubMed] [Google Scholar]
- Cai D, Mulle JG, Yue DT. Inhibition of recombinant Ca2+ channels by benzothiazepines and phenylalkylamines: class-specific pharmacology and underlying molecular determinants. Mol Pharmacol. 1997;51:872–881. [PubMed] [Google Scholar]
- Capogna M, Gähwiler BH, Thompson SM. Presynaptic inhibition of calcium-dependent and -independent release elicited with ionomycin, gadolinium, and α-latrotoxin in the hippocampus. J Neurophysiol. 1996;75:2017–2028. doi: 10.1152/jn.1996.75.5.2017. [DOI] [PubMed] [Google Scholar]
- Chen S-R, Pan H-L. Blocking μ opioid receptors in the spinal cord prevents the analgesic action by subsequent systemic opioids. Brain Res. 2006;1081:119–125. doi: 10.1016/j.brainres.2006.01.053. [DOI] [PubMed] [Google Scholar]
- Chéry N, Yu XH, De Koninck Y. Visualization of lamina I of the dorsal horn in live adult rat spinal cord slices. J Neurosci Methods. 2000;96:133–142. doi: 10.1016/s0165-0270(99)00195-8. [DOI] [PubMed] [Google Scholar]
- Dahlhaus A, Ruscheweyh R, Sandkühler J. Synaptic input of rat spinal lamina I projection and unidentified neurons in vitro. J Physiol. 2005;566:355–368. doi: 10.1113/jphysiol.2005.088567. [DOI] [PMC free article] [PubMed] [Google Scholar]
- De Waard M, Liu H, Walker D, Scott VE, Gurnett CA, Campbell KP. Direct binding of G-protein βγ complex to voltage-dependent calcium channels. Nature. 1997;385:446–450. doi: 10.1038/385446a0. [DOI] [PubMed] [Google Scholar]
- de Weille JR, Schweitz H, Maes P, Tartar A, Lazdunski M. Calciseptine, a peptide isolated from black mamba venom, is a specific blocker of the L-type calcium channel. Proc Natl Acad Sci U S A. 1991;88:2437–2440. doi: 10.1073/pnas.88.6.2437. [DOI] [PMC free article] [PubMed] [Google Scholar]
- Ding Y-Q, Kaneko T, Nomura S, Mizuno N. Immunohistochemical localization of μ-opioid receptors in the central nervous system of the rat. J Comp Neurol. 1996;367:375–402. doi: 10.1002/(SICI)1096-9861(19960408)367:3<375::AID-CNE5>3.0.CO;2-2. [DOI] [PubMed] [Google Scholar]
- Dobrev D, Milde AS, Andreas K, Ravens U. The effects of verapamil and diltiazem on N-, P- and Q-type calcium channels mediating dopamine release in rat striatum. Br J Pharmacol. 1999;127:576–582. doi: 10.1038/sj.bjp.0702574. [DOI] [PMC free article] [PubMed] [Google Scholar]
- Dodt H-U, Frick A, Kampe K, Zieglgänsberger W. NMDA and AMPA receptors on neocortical neurons are differentially distributed. Eur J Neurosci. 1998;10:3351–3357. doi: 10.1046/j.1460-9568.1998.00338.x. [DOI] [PubMed] [Google Scholar]
- Drdla R, Gassner M, Gingl E, Sandkühler J. Induction of synaptic long-term potentiation after opioid withdrawal. Science. 2009;325:207–210. doi: 10.1126/science.1171759. [DOI] [PubMed] [Google Scholar]
- Endo K, Yawo H. μ-Opioid receptor inhibits N-type Ca2+ channels in the calyx presynaptic terminal of the embryonic chick ciliary ganglion. J Physiol. 2000;524:769–781. doi: 10.1111/j.1469-7793.2000.00769.x. [DOI] [PMC free article] [PubMed] [Google Scholar]
- Finnegan TF, Chen S-R, Pan H-L. μ Opioid receptor activation inhibits GABAergic inputs to basolateral amygdala neurons through Kv1.1/1.2 channels. J Neurophysiol. 2006;95:2032–2041. doi: 10.1152/jn.01004.2005. [DOI] [PubMed] [Google Scholar]
- Gerachshenko T, Blackmer T, Yoon E-J, Bartleson C, Hamm HE, Alford S. Gβγ acts at the C terminus of SNAP-25 to mediate presynaptic inhibition. Nat Neurosci. 2005;8:597–605. doi: 10.1038/nn1439. [DOI] [PubMed] [Google Scholar]
- Gompf HS, Moldavan MG, Irwin RP, Allen CN. Nociceptin/orphanin FQ (N/OFQ) inhibits excitatory and inhibitory synaptic signaling in the suprachiasmatic nucleus (SCN) Neuroscience. 2005;132:955–965. doi: 10.1016/j.neuroscience.2004.11.057. [DOI] [PubMed] [Google Scholar]
- Gouardères C, Beaudet A, Zajac J-M, Cros J, Quirion R. High resolution radioautographic localization of [125I]FK-33–824-labelled mu opioid receptors in the spinal cord of normal and deafferented rats. Neuroscience. 1991;43:197–209. doi: 10.1016/0306-4522(91)90427-p. [DOI] [PubMed] [Google Scholar]
- Gutman GA, Chandy KG, Grissmer S, Lazdunski M, McKinnon D, Pardo LA, Robertson GA, Rudy B, Sanguinetti MC, Stühmer W, Wang X. International Union of Pharmacology. LIII. Nomenclature and molecular relationships of voltage-gated potassium channels. Pharmacol Rev. 2005;57:473–508. doi: 10.1124/pr.57.4.10. [DOI] [PubMed] [Google Scholar]
- Hagiwara S, Miyazaki S, Moody W, Patlak J. Blocking effects of barium and hydrogen ions on the potassium current during anomalous rectification in the starfish egg. J Physiol. 1978;279:167–185. doi: 10.1113/jphysiol.1978.sp012338. [DOI] [PMC free article] [PubMed] [Google Scholar]
- Heinke B, Balzer E, Sandkühler J. Pre- and postsynaptic contributions of voltage-dependent Ca2+ channels to nociceptive transmission in rat spinal lamina I neurons. Eur J Neurosci. 2004;19:103–111. doi: 10.1046/j.1460-9568.2003.03083.x. [DOI] [PubMed] [Google Scholar]
- Hori Y, Endo K, Takahashi T. Presynaptic inhibitory action of enkephalin on excitatory transmission in superficial dorsal horn of rat spinal cord. J Physiol. 1992;450:673–685. doi: 10.1113/jphysiol.1992.sp019149. [DOI] [PMC free article] [PubMed] [Google Scholar]
- Ikeda H, Heinke B, Ruscheweyh R, Sandkühler J. Synaptic plasticity in spinal lamina I projection neurons that mediate hyperalgesia. Science. 2003;299:1237–1240. doi: 10.1126/science.1080659. [DOI] [PubMed] [Google Scholar]
- Ikeda H, Stark J, Fischer H, Wagner M, Drdla R, Jäger T, Sandkühler J. Synaptic amplifier of inflammatory pain in the spinal dorsal horn. Science. 2006;312:1659–1662. doi: 10.1126/science.1127233. [DOI] [PubMed] [Google Scholar]
- Ikoma M, Kohno T, Baba H. Differential presynaptic effects of opioid agonists on Aδ- and C-afferent glutamatergic transmission to the spinal dorsal horn. Anesthesiology. 2007;107:807–812. doi: 10.1097/01.anes.0000286985.80301.5e. [DOI] [PubMed] [Google Scholar]
- Iwasaki S, Momiyama A, Uchitel OD, Takahashi T. Developmental changes in calcium channel types mediating central synaptic transmission. J Neurosci. 2000;20:59–65. doi: 10.1523/JNEUROSCI.20-01-00059.2000. [DOI] [PMC free article] [PubMed] [Google Scholar]
- Julius D, Basbaum AI. Molecular mechanisms of nociception. Nature. 2001;413:203–210. doi: 10.1038/35093019. [DOI] [PubMed] [Google Scholar]
- Kohno T, Kumamoto E, Higashi H, Shimoji K, Yoshimura M. Actions of opioids on excitatory and inhibitory transmission in substantia gelatinosa of adult rat spinal cord. J Physiol. 1999;518:803–813. doi: 10.1111/j.1469-7793.1999.0803p.x. [DOI] [PMC free article] [PubMed] [Google Scholar]
- Law P-Y, Wong YH, Loh HH. Molecular mechanisms and regulation of opioid receptor signaling. Annu Rev Pharmacol Toxicol. 2000;40:389–430. doi: 10.1146/annurev.pharmtox.40.1.389. [DOI] [PubMed] [Google Scholar]
- Li J-L, Ding Y-Q, Li Y-Q, Li J-S, Nomura S, Kaneko T, Mizuno N. Immunocytochemical localization of μ-opioid receptor in primary afferent neurons containing substance P or calcitonin gene-related peptide. A light and electron microscope study in the rat. Brain Res. 1998;794:347–352. doi: 10.1016/s0006-8993(98)00332-1. [DOI] [PubMed] [Google Scholar]
- Lorenzo L-E, Ramien M, St Louis M, De Koninck Y, Ribeiro-Da-Silva A. Postnatal changes in the Rexed lamination and markers of nociceptive afferents in the superficial dorsal horn of the rat. J Comp Neurol. 2008;508:592–604. doi: 10.1002/cne.21691. [DOI] [PubMed] [Google Scholar]
- Marker CL, Luján R, Loh HH, Wickman K. Spinal G-protein-gated potassium channels contribute in a dose-dependent manner to the analgesic effect of μ- and δ- but not κ-opioids. J Neurosci. 2005;25:3551–3559. doi: 10.1523/JNEUROSCI.4899-04.2005. [DOI] [PMC free article] [PubMed] [Google Scholar]
- Meir A, Ginsburg S, Butkevich A, Kachalsky SG, Kaiserman I, Ahdut R, Demirgoren S, Rahamimoff R. Ion channels in presynaptic nerve terminals and control of transmitter release. Physiol Rev. 1999;79:1019–1088. doi: 10.1152/physrev.1999.79.3.1019. [DOI] [PubMed] [Google Scholar]
- Mintz IM, Sabatini BL, Regehr WG. Calcium control of transmitter release at a cerebellar synapse. Neuron. 1995;15:675–688. doi: 10.1016/0896-6273(95)90155-8. [DOI] [PubMed] [Google Scholar]
- Mitrovic I, Margeta-Mitrovic M, Bader S, Stoffel M, Jan LY, Basbaum AI. Contribution of GIRK2-mediated postsynaptic signaling to opiate and α2-adrenergic analgesia and analgesic sex differences. Proc Natl Acad Sci U S A. 2003;100:271–276. doi: 10.1073/pnas.0136822100. [DOI] [PMC free article] [PubMed] [Google Scholar]
- Momiyama T. Developmental increase in D1-like dopamine receptor-mediated inhibition of glutamatergic transmission through P/Q-type channel regulation in the basal forebrain of rats. Eur J Neurosci. 2010;32:579–590. doi: 10.1111/j.1460-9568.2010.07306.x. [DOI] [PubMed] [Google Scholar]
- Moulder KL, Jiang X, Taylor AA, Olney JW, Mennerick S. Physiological activity depresses synaptic function through an effect on vesicle priming. J Neurosci. 2006;26:6618–6626. doi: 10.1523/JNEUROSCI.5498-05.2006. [DOI] [PMC free article] [PubMed] [Google Scholar]
- Pahner I, Höltje M, Winter S, Takamori S, Bellocchio EE, Spicher K, Laake P, Nürnberg B, Ottersen OP, Ahnert-Hilger G. Functional G-protein heterotrimers are associated with vesicles of putative glutamatergic terminals: implications for regulation of transmitter uptake. Mol Cell Neurosci. 2003;23:398–413. doi: 10.1016/s1044-7431(03)00059-9. [DOI] [PubMed] [Google Scholar]
- Photowala H, Blackmer T, Schwartzf E, Hamm HE, Alford S. G protein βγ-subunits activated by serotonin mediate presynaptic inhibition by regulating vesicle fusion properties. Proc Natl Acad Sci U S A. 2006;103:4281–4286. doi: 10.1073/pnas.0600509103. [DOI] [PMC free article] [PubMed] [Google Scholar]
- Rusin KI, Moises HC. μ-Opioid receptor activation reduces multiple components of high-threshold calcium current in rat sensory neurons. J Neurosci. 1995;15:4315–4327. doi: 10.1523/JNEUROSCI.15-06-04315.1995. [DOI] [PMC free article] [PubMed] [Google Scholar]
- Sandkühler J. Models and mechanisms of hyperalgesia and allodynia. Physiol Rev. 2009;89:707–758. doi: 10.1152/physrev.00025.2008. [DOI] [PubMed] [Google Scholar]
- Scherrer G, Imamachi N, Cao Y-Q, Contet C, Mennicken F, O'Donnell D, Kieffer BL, Basbaum AI. Dissociation of the opioid receptor mechanisms that control mechanical and heat pain. Cell. 2009;137:1148–1159. doi: 10.1016/j.cell.2009.04.019. [DOI] [PMC free article] [PubMed] [Google Scholar]
- Schlicker E, Kathmann M. Presynaptic neuropeptide receptors. Handb Exp Pharmacol. 2008;184:409–434. doi: 10.1007/978-3-540-74805-2_13. [DOI] [PubMed] [Google Scholar]
- Su H, Sochivko D, Becker A, Chen J, Jiang Y, Yaari Y, Beck H. Upregulation of a T-type Ca2+ channel causes a long-lasting modification of neuronal firing mode after status epilepticus. J Neurosci. 2002;22:3645–3655. doi: 10.1523/JNEUROSCI.22-09-03645.2002. [DOI] [PMC free article] [PubMed] [Google Scholar]
- Tedford HW, Zamponi GW. Direct G protein modulation of Cav2 calcium channels. Pharmacol Rev. 2006;58:837–862. doi: 10.1124/pr.58.4.11. [DOI] [PubMed] [Google Scholar]
- Vaughan CW, Ingram SL, Connor MA, Christie MJ. How opioids inhibit GABA-mediated neurotransmission. Nature. 1997;390:611–614. doi: 10.1038/37610. [DOI] [PubMed] [Google Scholar]
- Wang H-B, Zhao B, Zhong Y-Q, Li K-C, Li Z-Y, Wang Q, Lu Y-J, Zhang Z-N, He S-Q, Zheng H-C, Wu S-X, Hökfelt TG, Bao L, Zhang X. Coexpression of δ- and μ-opioid receptors in nociceptive sensory neurons. Proc Natl Acad Sci U S A. 2010;107:13117–13122. doi: 10.1073/pnas.1008382107. [DOI] [PMC free article] [PubMed] [Google Scholar]
- Wu Z-Z, Chen S-R, Pan H-L. Differential sensitivity of N- and P/Q-type Ca2+ channel currents to a μ opioid in isolectin B4-positive and -negative dorsal root ganglion neurons. J Pharmacol Exp Ther. 2004;311:939–947. doi: 10.1124/jpet.104.073429. [DOI] [PubMed] [Google Scholar]
- Yaksh TL. Spinal opiate analgesia: characteristics and principles of action. Pain. 1981;11:293–346. doi: 10.1016/0304-3959(81)90633-3. [DOI] [PubMed] [Google Scholar]
- Yeomans DC, Cooper BY, Vierck CJ., Jr Effects of systemic morphine on responses of primates to first or second pain sensations. Pain. 1996;66:253–263. doi: 10.1016/0304-3959(96)03082-5. [DOI] [PubMed] [Google Scholar]
- Zakharenko SS, Zablow L, Siegelbaum SA. Visualization of changes in presynaptic function during long-term synaptic plasticity. Nat Neurosci. 2001;4:711–717. doi: 10.1038/89498. [DOI] [PubMed] [Google Scholar]
- Zhang X-L, Gold MS. Dihydropyridine block of voltage-dependent K+ currents in rat dorsal root ganglion neurons. Neuroscience. 2009;161:184–194. doi: 10.1016/j.neuroscience.2009.03.012. [DOI] [PMC free article] [PubMed] [Google Scholar]
- Zhou H-Y, Chen S-R, Chen H, Pan H-L. Sustained inhibition of neurotransmitter release from nontransient receptor potential vanilloid type 1-expressing primary afferents by μ-opioid receptor activation-enkephalin in the spinal cord. J Pharmacol Exp Ther. 2008;327:375–382. doi: 10.1124/jpet.108.141226. [DOI] [PubMed] [Google Scholar]
- Zhou Q, Petersen CC, Nicoll RA. Effects of reduced vesicular filling on synaptic transmission in rat hippocampal neurones. J Physiol. 2000;525(Pt 1):195–206. doi: 10.1111/j.1469-7793.2000.t01-1-00195.x. [DOI] [PMC free article] [PubMed] [Google Scholar]
- Zhu W, Pan ZZ. μ-Opioid-mediated inhibition of glutamate synaptic transmission in rat central amygdala neurons. Neuroscience. 2005;133:97–103. doi: 10.1016/j.neuroscience.2005.02.004. [DOI] [PubMed] [Google Scholar]