

Abstract
Despite recent advances in harnessing cortical motor-related activity to control computer cursors and robotic devices, the ability to decode and execute different grasping patterns remains a major obstacle. Here we demonstrate a simple Bayesian decoder for real-time classification of grip type and wrist orientation in macaque monkeys that uses higher-order planning signals from anterior intraparietal cortex (AIP) and ventral premotor cortex (area F5). Real-time decoding was based on multiunit signals, which had similar tuning properties to cells in previous single-unit recording studies. Maximum decoding accuracy for two grasp types (power and precision grip) and five wrist orientations was 63% (chance level, 10%). Analysis of decoder performance showed that grip type decoding was highly accurate (90.6%), with most errors occurring during orientation classification. In a subsequent off-line analysis, we found small but significant performance improvements (mean, 6.25 percentage points) when using an optimized spike-sorting method (superparamagnetic clustering). Furthermore, we observed significant differences in the contributions of F5 and AIP for grasp decoding, with F5 being better suited for classification of the grip type and AIP contributing more toward decoding of object orientation. However, optimum decoding performance was maximal when using neural activity simultaneously from both areas. Overall, these results highlight quantitative differences in the functional representation of grasp movements in AIP and F5 and represent a first step toward using these signals for developing functional neural interfaces for hand grasping.
Introduction
The development of neural prostheses to restore voluntary movements in paralyzed patients is an increasingly realistic prospect. Such devices harness neural signals from intact brain areas to manipulate artificial devices and ultimately could control the patient's own limbs (Hatsopoulos and Donoghue, 2009). Since our hands play a central role for interacting with the world (Lemon, 1993), improvement of hand function remains a high priority for patients with motor deficits, e.g., amputees, spinal cord injury patients, stroke victims, and others (Snoek et al., 2004; Anderson, 2009). Neural prostheses for grasping could greatly improve their quality of life.
Recent years have seen a multitude of studies on neural interfaces (NIs) for movement control (Schwartz et al., 2006; Scherberger, 2009; Hatsopoulos and Donoghue, 2009). Besides EEG- and electrocorticograph-based systems in humans (Leuthardt et al., 2004; Wolpaw and McFarland, 2004; Bai et al., 2008), invasive NIs in nonhuman primates have been developed using neural population activity in primary motor cortex (M1) to reconstruct continuous 2D and 3D arm and hand position (Wessberg et al., 2000; Serruya et al., 2002; Taylor et al., 2002; Carmena et al., 2003), and monkeys have learned to use these signals to control a gripper-equipped robotic arm to feed themselves (Velliste et al., 2008). This approach has generally not yet been extended to decode sophisticated grasping patterns, which is attributable to the complex nature of dexterous finger movements and the large number of degrees of freedom of the hand (Schieber and Santello, 2004); however, see Vargas-Irwin et al. (2010) and Carpaneto et al. (2011) for first examples of such an approach. Furthermore, the exact mechanisms by which grasping movements are learned and retrieved are quite unclear, making effective decoding hard.
Alternatively, cognitive motor control signals can be extracted by tapping into “higher-order” planning signals in premotor and parietal cortex (Musallam et al., 2004; Santhanam et al., 2006; Mulliken et al., 2008; Andersen et al., 2010). For grasping, key areas for such high-level control are ventral premotor cortex (area F5) and anterior intraparietal cortex (AIP), which are strongly interconnected (Luppino et al., 1999) and form a frontoparietal network for transforming visual signals into hand grasping instructions (Jeannerod et al., 1984; Kakei et al., 1999; Brochier and Umilta, 2007). Unlike M1, these areas represent upcoming hand movements at a conceptual or categorical level well before their execution (Musallam et al., 2004; Baumann et al., 2009; Fluet et al., 2010). Targeting these areas could therefore considerably simplify the decoding of complex movements.
With this in mind, we developed a simple decoder for hand grasping in macaques that can distinguish various grip types and wrist orientations in real time. Using predominantly multiunit activity recorded simultaneously from AIP and F5, we demonstrated real-time decoding by maximum likelihood estimation. The tuning properties of these multiunit data were largely similar to single-unit studies (Baumann et al., 2009; Fluet et al., 2010), with neural activity in F5 being better suited for the decoding of grip type and that in AIP being more accurate for predicting object orientation.
Materials and Methods
Basic procedures
Hand grasping movements were decoded in real time using neural activity recorded simultaneously from area F5 and area AIP in two female rhesus macaque monkeys (Animals Z and S; body weight, 6.5 and 8.0 kg, respectively). All procedures and animal care were in accordance with guidelines set by the Veterinary Office of the Canton of Zurich and the Guidelines for the Care and Use of Mammals in Neuroscience and Behavioral Research (National Research Council, 2003).
Basic experimental methods have been described previously (Baumann et al., 2009; Fluet et al., 2010). Briefly, we trained animals to perform a delayed grasping task. They were seated in a primate chair and trained to grasp a handle with their right hand. This handle was placed in front of the monkey at chest level, at a distance of ∼30 cm, and could be grasped either with a power grip (opposition of fingers and palm) or precision grip (opposition of index finger and thumb). Two clearly visible recessions on either side of the handle contained touch sensors that were used to detect contact of thumb and forefinger during precision grips, whereas power grips were detected using an infrared light barrier inside the handle aperture. The monkey was instructed which grip type to make by means of two colored LED-like patterns projected from a LCD screen onto the center of the handle via a half mirror positioned between the animal's eyes and the target. Since the current study required a digital display to present visual feedback during real-time decoding, task cues were presented by means of small colored light dots on the screen. The handle could be rotated into one of five discrete orientations (upright and 25° and 50° to the left and right) and was illuminated by two spotlights placed on either side. Apart from these light sources, the experimental room was completely dark. In addition, two capacitive touch sensors (Model EC3016NPAPL; Carlo Gavazzi) were placed at the level of the animals' waist and functioned as handrest buttons. The behavioral task was controlled by means of custom-written software implemented in LabView Realtime (National Instruments).
Behavioral paradigms
In the delayed grasping task, the monkey was required to grasp the handle in one of the five orientations with either a power grip or a precision grip (Fig. 1A). This gave a total of 10 different grasp conditions that were presented on a trial-by-trial basis in pseudorandom order. The animal began a trial by placing each hand on a handrest button while sitting in darkness. In the baseline period, a red dot was illuminated and the handle positioned in one of the five orientations. From this point on the animal had to keep both hands at rest for a variable period of time (700–1100 ms; mean, 900 ms). In the following cue period (duration, 600 ms), the object was illuminated to reveal its orientation and an additional dot was presented adjacent to the red dot, which instructed the type of grip to be performed: for power grip the dot was green, whereas for precision grip it was white. Then, the spotlights and the cue dot were extinguished while the red dot remained illuminated for a variable time period (700–1100 ms; mean, 900 ms), during which the monkey was required to remember the grasping instructions (planning period). The red dot was then switched off, instructing the animal to reach and grasp the handle in the dark (movement period). Upon activation of the handle sensors, the handle was then illuminated again to allow visual feedback of the executed grasping movement. If the animal performed the correct grasp, this feedback was given together with a fixed amount of fluid (water or juice) as a reward, and the animal could initiate another trial by placing both hands at the hand rest buttons. Execution of the wrong grasp resulted in handle illumination together with presentation of the red dot, but in this case no reward was given. Failure to activate the handle sensors (e.g., when no movement was initiated) led to trial abortion without visual feedback. Animals were considered fully trained once task performance exceeded 80%.
Figure 1.

Task paradigm and FMA implantation details. Animals were trained to perform two tasks. A, Delayed grasping task, consisting of four epochs: baseline, cue, planning, and movement. The task was performed in the dark, except for the cue period when the handle was visible together with an instruction for grasp type (green dot, power grip; white dot, precision grip; red dot, fixation light). B, Brain control task. This task proceeded as in A, except at the end of the planning epoch, where the planned grasp was decoded and visually fed back to the monkey (photograph of grasp) without requiring the animal to actually execute the movement. C, Placement of FMAs in Animal S. Two arrays were placed in F5 on the bank of the arcuate sulcus (AS). Two further arrays were placed in AIP toward the lateral end of the intraparietal sulcus (IPS). CS, Central sulcus. The cross shows medial (M), lateral (L), anterior (A), and posterior (P) directions. D, Schematic of FMA placement in Animal S including FMA numbering. The dark edge on each FMA indicates the row of electrodes with the greatest lengths (see Fig. 2). Annotations are the same as in C. E, Schematic of FMA placement in Animal Z.
For real-time decoding, each session began by sampling spike data from F5 and AIP during the planning phase in the standard delayed grasping task. These first 100–150 trials were used to train the classifier (see Real-time decoding, below) by calculating the average firing rates during the planning epoch separately for each of the 10 grasp conditions and each unit.
Once this process was completed, the brain control task was started (Fig. 1B). In this real-time decoding task, baseline and cue epochs were identical to the delayed grasping task. However, during the planning epoch, spiking activity was sampled and used to make a prediction at the end of this period about which grasp condition (grip type and object orientation) had been instructed to the monkey. Note that, during planning, any hand movement (lifting from handrest sensor) let to trial abortion. If the instructed and decoded conditions matched, the monkey was rewarded without being required to execute the movement, and movement execution was almost never observed (monitored by infrared camera). Instead, a static photograph of the animal's hand executing the decoded grasp was presented on the LCD screen from the perspective of the animal, i.e., as if the animal was actually performing the grasp movement.
Alternatively, if the decoded condition failed to match the instructed condition, the trial was either aborted or the red dot was extinguished, as in the delayed grasping task, which instructed the animal to grasp the target with its own hand. The latter was intended to maintain interest and motivation in the task, in particular when the overall decoding performance was low (e.g., Animal Z; see Results).
Surgical procedures and imaging
Upon completion of behavioral training, each animal received an MRI scan to locate anatomical landmarks, for subsequent chronic implantation of microelectrode arrays. Each monkey was sedated (10 mg/kg ketamine and 0.5 mg/kg xylazine, i.m.) and placed in the scanner (GE Healthcare 1.5T) in a prone position. T1-weighted volumetric images of the brain and skull were obtained as described previously (Baumann et al., 2009). We measured the stereotaxic location of the arcuate and intraparietal sulci to guide placement of the electrode arrays.
Chronic electrode implantation
An initial surgery was performed to implant a head post (titanium cylinder; diameter, 18 mm). After recovery from this procedure and subsequent training of the task in the head-fixed condition, each animal was implanted with floating microelectrode arrays (FMAs; Microprobe) in a separate procedure. We used different types and numbers of arrays in each animal. Animal S was implanted with 32 electrode FMAs and received two arrays in each area (Fig. 1C,D). The arcuate sulcus of Animal S did not present a spur, but in the MRI a small indentation was visible in the posterior bank, about 2 mm medial to the knee, which we treated as the spur. We placed both anterior FMAs lateral to that mark. Animal Z was implanted with five electrode arrays, each with 16 electrodes. Three such arrays were implanted in area F5, and two in area AIP (Fig. 1E). Both types of FMAs consisted of nonmoveable monopolar platinum-iridium electrodes with initial impedances ranging between 300 and 600 kΩ at 1 kHz measured before implantation. Lengths of electrodes in the 16-electrode FMA were between 1.0 and 4.5 mm, and between 1.5 and 7.1 mm in the 32-electrode arrays.
All surgical procedures were performed under sterile conditions and general anesthesia (induction with 10 mg/kg ketamine, i.m., and 0.05 mg/kg atropine, s.c., followed by intubation, 1–2% isofluorane, and analgesia with 0.01 mg/kg buprenorphene, s.c.). Heart and respiration rate, electrocardiogram, oxygen saturation, and body temperature were monitored continuously, and systemic antibiotics and analgesics were administered for several days after each surgery. To prevent brain swelling while the dura was open, the animal was mildly hyperventilated (end-tidal CO2, ∼30 mmHg) and mannitol was kept at hand. Animals were allowed to recover for at least 2 weeks before behavioral training or recording experiments recommenced.
Neural recordings
From the implanted FMAs, we recorded spiking activity (single and multiunits) in area F5 and area AIP simultaneously from many electrodes while the monkey performed the grasping or decoding task. Neural signals were amplified (300×) and digitized with 16 bit resolution (0.25 μV/bit) at 30 kS/s using a Cerebus Neural Signal Processor (Blackrock) and stored to disc together with the behavioral data. At the same time, we streamed spike and task data with gigabit Ethernet to a separate decoding computer for real-time decoding (see Real-time decoding, below). Spike sorting was conducted on-line by manually setting time-amplitude discrimination windows for Animal Z, and by using proprietary automated spike-sorting features of the Cerebus system for Animal S.
Real-time decoding
Our goal for decoding was to predict most accurately the intended grip type and object orientation (10 possible conditions) form the neural ensemble activity on a given trial. We formalized it as a classification problem and chose the mean spike rate during the planning epoch of each trial and multiunit as our input signal (Taylor et al., 2002; Brown et al., 2004; Musallam et al., 2004; Hochberg et al., 2006; Achtman et al., 2007; Velliste et al., 2008).
Since it was likely that some of the input multiunits were unrelated to the task (i.e., nontuned units), we implemented a feature selection layer and accepted as classifier input only units that were significantly tuned in the training data to either grip type or object orientation (one-way ANOVA with factor grasp condition 1–10; p < 0.05).
For classification, we used a parametric supervised learning scheme, the naive Bayesian (NB) classifier. We assumed Poisson spike statistics for the spiking activity input and statistical independence between different recording units. Under these assumptions, the NB classifier was easy to implement, a robust learner, and fast on training and classification, and has been shown to be one of the best performers for this kind of data (Subasi et al., 2010).
To estimate the grasp conditions, we defined the scalar c ∈ {1, …, 10} to denote the condition. The vector r = {r1, …, rn} represented the neural activity of the ensemble on a given trial with n denoting the size of the input population. Then Bayes' rule gives the following expression for the conditional probability of c, given r:
Pi is the Poisson distribution of ri, and C(a) is a normalization factor that ensures the sum of all probabilities to be one; P(c) is the prior distribution of the task conditions, which is uniform (i.e., constant) for our task design. To estimate the underlying Poissonian distributions Pi(ri|c), we determined for each task condition c and unit i the rate parameter λi,c of the Poisson distribution from the mean firing rate in the planning epoch of the delayed grasping task (training data). This determined all probability distributions Pi. In our experience, ∼10 samples per condition were sufficient for a proper estimation of the rate parameters λi,c.
For decoding, the classifier output ĉ was determined as the most probable grasp condition given the observed activities r, i.e., the condition for which the likelihood P(c|r) became maximal (Shenoy et al., 2003):
 |
Finally, to improve numerical stability, we used the log-likelihood (log(P) instead of P), which preserves the maximum location since the logarithm is strictly monotonic:
 |
We benchmarked decoder performance off-line before commencing real-time experiments by using a custom-written spike simulator tool that was capable of creating artificial Poisson-distributed spike trains as well as loading and replaying previous neuronal recordings (Townsend et al., 2008). Both decoder and simulator were implemented in C++, including the Neuroshare library for reading files, the Cerebus Network Protocol, and a graphical user interface.
Decoder performance in real-time sessions was evaluated by the total percentage of correctly decoded trials achieved by the end of the session. In addition, we tested changes in decoder accuracy within each session by using a sliding window that averaged across the previous 10 trials.
Off-line data analysis
Spike sorting.
All data recorded during real-time decoding sessions were stored to disk for off-line analysis. Raw signals were band-pass filtered (pass band, 300–3000 Hz), and single and multiunits were isolated using superparamagnetic clustering techniques (Waveclus software running in Matlab) (Quiroga et al., 2004). The quality of single-unit isolation was evaluated using three criteria: first, the absence of short (1–2 ms) intervals in the interspike interval histogram; second, the degree of homogeneity of the detected spike waveforms; and third, the separation of waveform clusters in the projection of the first 10 wavelet coefficients with largest deviation from normality (Quiroga et al., 2004). In the majority of cases, it was not possible to isolate single units due to indistinguishable shapes of waveforms, especially with low amplitude. Waveforms were thus pooled into a larger “multiunit” that comprised recordings from several individual neurons simultaneously. However, care should be taken to distinguish this point-process signal from continuous “multiunit activity” data generated from envelope functions applied to the low-pass-filtered voltage trace (Super and Roelfsema, 2005; Stark and Abeles, 2007; Choi et al., 2010). Finally, the predominance of multiunit recordings in our data set was in part due to the fixed (nonmovable) nature of the electrodes, which did not allow optimization of unit isolation during recordings.
Visualization.
To visualize neural activity during the task, peristimulus time histograms (PSTHs) were generated by replacing each spike time ts with a kernel function and averaging all such functions across all spikes and trials (Kass et al., 2003). We used a gamma distribution function as a kernel:
 |
The shape (α = 1.5) and rate parameter (β = 30) were chosen to achieve a small amount of delay (kernel peak at 16 ms) and an SD of ∼40 ms. This procedure ensured that the resulting PSTH curve was smooth, continuous, and causal, i.e., the value at any time point was only influenced by spikes that had occurred before that moment in time, but not afterward (Baumann et al., 2009). However, note that all quantitative analysis and statistical tests were based on the exact spike times without any smoothing.
Tuning.
To characterize the underlying tuning properties of each unit, we examined its spiking activity during the planning period in the delayed grasping task. We parameterized each cell's tuning to the task parameters in terms of its preferred and nonpreferred grip type and orientation. These were determined for each cell from the mean firing rate during the planning period, which was averaged across all trials of the same grip type or orientation. The preferred grip type was determined as the grip with the highest mean firing rate, leaving the other grip as the nonpreferred type. Similarly, the preferred orientation was defined as the orientation with the highest mean firing rate, while the nonpreferred orientation was defined as the orientation located at a 75° angular distance from the preferred one. This definition was chosen so that the nonpreferred orientation was not taken exclusively from the extreme orientations (±50°). If the preferred condition was 0°, we randomly selected either −50° or +50° as the nonpreferred condition (Baumann et al., 2009).
We tested the statistical significance of each cell's tuning with a two-way ANOVA with factors grip type and orientation and significance p < 0.01, with the additional requirement that the cell fired at least five spikes per second in the preferred condition.
As a further measure of the tuning strength, we performed a receiver operator characteristic (ROC) analysis (Dayan and Abbott, 2001). This tested how well one can discriminate, based on the spiking activity of a given cell, between trials with the preferred grip type (or orientation) and trials with the nonpreferred grip type (or orientation). We used the area under the curve (ROC score) as a measure of discriminatory power ranging from 0.5 (for chance performance) to 1 (for perfect discrimination). For grip type tuning, we computed the ROC score separately for each orientation and then averaged across all orientations for each grip type. For hand orientation, we averaged the ROC score across all trials for the preferred and nonpreferred orientation regardless of grip type. To assess the significance of ROC scores (p < 0.05), we used a Monte Carlo procedure, in which 1000 repetitions of the same ROC analysis were performed with random shuffling of the labels “preferred grip type” and “nonpreferred grip type” (or preferred/nonpreferred orientation), to determine the null distribution of our hypothesis.
Off-line decoding
To test the performance of the NB classifier under optimal conditions (optimized spike sorting) and as a comparison to the real-time decoding results, we decoded the grasp condition also off-line and using the off-line spike-sorted data. A naive Bayesian classifier was implemented in Matlab and trained and tested on the same data used to train and test the original classifier. However, instead of using spike data streamed from the Cerebus Neural Signal Processor, this off-line classifier could also operate on spike data extracted from the off-line spike sorter Waveclus. In addition, off-line decoding was done on restricted data sets, such as AIP or F5 data only. When a one-way ANOVA was performed to compare decoding performance using each area independently versus both areas combined, additional post hoc testing was done to locate significant differences via multiple comparisons at the p < 0.05 level (Tukey–Kramer correction).
Results
The data presented in the current study are based on a total of 26 real-time decoding sessions conducted in two animals (Monkey S, 12 sessions; Monkey Z, 14 sessions) that were chronically implanted in AIP and F5 with FMAs (Monkey S, 128 channels; Monkey Z, 80 channels). Across these sessions, in Monkey S we recorded 819 units in F5 and 898 units in AIP; in Monkey Z, we recorded a total of 491 units in F5 and 133 units in AIP. Of these, the vast majority were classified as multiunits (80–85%; see Table 1). Previous studies have examined in detail the tuning properties of single units in both AIP (Sakata et al., 1995; Murata et al., 2000; Baumann et al., 2009) and F5 (Rizzolatti et al., 1988; Fluet et al., 2010). Therefore, the current analyses will focus on the large population of multiunit data that we sampled with chronically implanted FMAs, with a view to comparing and contrasting these results with respect to single-unit data recorded previously, and with respect to using these signals to maximize the amount of information available for real-time decoding.
Table 1.
Number of single units and multiunits recorded from area F5 and AIP of each monkey
| Monkey S |
Monkey Z |
|||
|---|---|---|---|---|
| F5 | AIP | F5 | AIP | |
| Single units | 130 | 134 | 88 | 19 |
| Multiunits | 689 | 764 | 403 | 114 |
| Total | 819 | 898 | 491 | 133 |
Data are from 12 (Monkey S) and 14 sessions (Monkey Z).
Distribution of tuned activity
The distribution of yielded multiunits varied in both monkeys and areas as follows. In Monkey S, the implanted FMAs yielded an average of 57 (SD, 7) and 64 (SD, 7) multiunits recorded per session from area F5 and AIP, respectively. These were located on 45 (SD, 4) and 46 (SD 3) electrodes in F5 and AIP, respectively, out of a total of 64 implanted in each area. In both areas, ∼20% of these multiunits showed significant modulation of their firing rate to the factors grip type or orientation during the planning period (two way ANOVA, p < 0.01). In Monkey Z, we found in F5, on average, 29 (SD, 8) single-unit or multiunit signals per session located on 27 (SD, 8) of 48 implanted electrodes. Of these multiunits, 26% were significantly tuned. In area AIP, fewer implanted electrodes were able to sample neural signals (8 of 32 electrodes; SD, 4; 25%), resulting in a low number of multiunits per session (8 electrodes; SD, 4). Despite the relatively small sample size, the proportion of significantly tuned multiunits was similar to F5 (29%). Overall, the chronically implanted electrodes in both monkeys were able to record samples of tuned multiunits in both areas, indicating that information about grip type and orientation was present in the neural data, which we then used for the real-time decoding experiment.
Figure 2 summarizes the spatial distribution of tuned multiunit activity across FMAs and within each array. For each electrode, we measured the mean number of tuned multiunits per session and averaged that yield across all sessions. For both monkeys, we found that some implanted arrays sampled more tuned activity than others. For example, in Monkey S, FMAs 1 and 4 yielded the most tuned activity on average (yields of 0.29 and 0.37 tuned units, respectively, per electrode and session) compared to FMAs 2 and 3 (yields of 0.07 and 0.11, respectively) (Fig. 2A). Similarly, in Monkey Z, the average yield of tuned units was 0.32 and 0.18 in arrays 1 and 3 in F5, respectively, whereas it was only 0.05 in array 2 (Fig. 2B). Furthermore, FMAs 4 and 5, implanted in area AIP of this monkey, had a relatively low yield of tuned units (average of 0.09 and 0.05, respectively).
Figure 2.

FMA electrode layout and distribution of tuned multiunits. Rectangles represent a “top down” view of each FMA (looking down onto the cortical surface) with approximate electrode locations as circles. Electrodes within each row alternated in length (steps, 0.8 mm) with the mean length in each row displayed in the horizontal bar chart for each FMA type. Electrode shading represents the yield (mean number) of tuned multiunits per session (grip type or orientation) across all recording sessions. Crossed-out electrodes are reference and ground. Dashed lines represent the approximate sulcus location (arcuate for F5, intraparietal for AIP) relative to the FMA. FMA numbering is as in Figure 1. M, Medial; L, lateral. A, Distribution of tuned units for Animal S. B, The same distribution for Animal Z.
Within the arrays that sampled more tuned units, we found that sampling of tuned activity was concentrated on certain individual electrodes or groups of electrodes. For example, in FMA 1 in Monkey S, most tuned activity was picked up by two groups of electrodes located at the medial and lateral sides of the array, and relatively little tuned data were recorded by the electrodes in the middle (Fig. 2A). In FMA 4 of the same animal, a “hot spot” for tuned activity was located in the mid-to-medial section of the array. Thus, there was no consistent spatial pattern in the distribution of high-yield electrodes within each FMA; instead, we found a rather heterogeneous distribution of tuned activity across the arrays, which is consistent with their fixed and permanent implantation.
Grasp properties of multiunit activity
Example units
Figure 3 illustrates two example multiunits from F5 and AIP that were modulated by grip type and orientation. Both units were sampled during the standard delayed grasping task as well as during real-time decoding. The F5 unit showed a transient increase in firing rate during the planning period relative to baseline activity that was much stronger for power grips than for precision grips (Fig. 3A). This unit was therefore strongly tuned for grip type during the planning period. Consistent with this tuning, the unit also showed a clear burst of firing around the time of grasping for power grip trials. However, modulation by orientation was absent. The observed strong modulation by grip type has been well characterized in previous single-unit studies of F5 (Murata et al., 1997; Raos et al., 2006; Umilta et al., 2007; Fluet et al., 2010).
Figure 3.
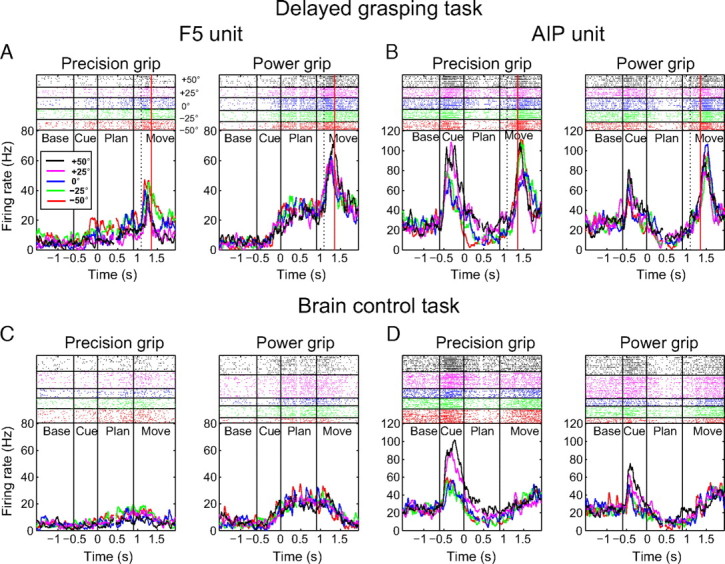
Firing rate histograms and raster plots of two example multiunits from F5 and AIP during the delayed grasping task and the brain control task. A–D, Each panel shows precision grip trials (left) and power grip trials (right) separately. Each color represents a particular handle orientation in the spike rasters (top) and for the averaged firing rates (bottom). The dashed line within each movement epoch represents the mean time of hand rest release, and the solid red line indicates the mean time of handle contact. All trials are doubly aligned to the end of the cue epoch (at 0 s) and the start of movement (at 0.9 s); gaps in the curves and rasters (at ∼0.4 s) indicate realignment. A, Multiunit recorded in F5 in the delayed grasping task showing tuning for grip type during the planning period, with greater firing rates for power grip trials than precision grips. B, Multiunit recorded in AIP in the delayed grasping task showing orientation tuning during cue, planning, and movement. C, Activity of the same F5 unit as in A, but during brain control trials. Note the similar activity modulation for grip type during the planning phase, but a lack of movement-related activity. D, Activity of the same AIP unit as in B during brain control trials. Note the separation of average firing rate profiles according to handle orientation during the cue and planning epochs and the absence of movement-related activity.
The example unit from AIP (Fig. 3B,D) had a different activity profile compared to the F5 unit, with a much stronger modulation by handle orientation. It showed an increase of its firing rate immediately after presentation of the instructed grasp (cue period), with increased firing for rightward handle positions (+50° and +25°). This tuning for orientation was sustained throughout much of the planning period and was somewhat clearer for precision grip trials than power grip trials. Finally, the unit showed a burst of activity around the time of movement execution with a similar modulation by object orientation and grip type. This rather complex firing pattern, i.e., simultaneous modulation by orientation and grip type, is consistent with previous observations in AIP (Baumann et al., 2009).
Figure 3, C and D, shows the activity of the same F5 and AIP multiunits during real-time decoding trials. For the F5 unit, we observed the same grip type modulation during the planning period. Note, however, the absence of an activity “peak” during movement execution, since no grasp was actually performed. The AIP multiunit also showed broadly similar activity during decoding trials, maintaining its preference for rightward handle positions especially during precision grips. As in F5, movement-related activity was clearly absent. Overall, these data demonstrate that information about grip type and orientation were present at the multiunit level in F5 and AIP during the planning period, including during decoding trials, when no movement was made.
Population activity
Similar findings were observed at the population level. Figure 4 shows the population firing rates across all 244 tuned multiunits from area F5 and 210 multiunits from AIP of both monkeys (two-way ANOVA on activity in the planning epoch; p < 0.01) separately for each unit's preferred and nonpreferred grip type and orientation. In both areas, the mean firing rate of the population was modulated by both grip type and orientation, starting shortly after the beginning of cue presentation and lasting until the end of movement execution. As was observed for individual units, important differences could be seen between the two areas. In F5, cue-related activity was relatively small, although there was a large peak of activity during movement execution (Fig. 4A). Moreover, the key parameter that modulated the firing rate during the planning period was the preferred grip type. Note that in particular the mean firing rate for the preferred type/nonpreferred orientation condition (blue curve) was higher than for the nonpreferred grip type and preferred orientation (green curve). This effect became even more pronounced during movement execution, where the four curves clearly separated into a preferred grip type group (blue and red) and a nonpreferred grip type group (green and black).
Figure 4.

Population firing rate activity. A–D, Average activity of tuned multiunits from F5 (A, C, n = 244) and AIP (B, D, column, n = 210) in the delayed grasping task (A, B) and the brain control task (C, D) is presented for each combination of the unit's preferred and nonpreferred grip type and handle orientation. Epoch definitions are as in Figure 3; tuning was determined from delay activity by two-way ANOVA (p < 0.01). The dashed line within each movement epoch represents the mean time of hand rest release.
In the population of 210 multiunits from AIP, cue-related activity was more pronounced than in F5, whereas movement-related firing (although still present) was weaker (Fig. 4B). In contrast to F5, orientation and grip type both modulated the mean activity in AIP. This separation of the curves began early in the cue period and persisted throughout the planning phase and movement execution.
In summary, F5 showed moderate tuning to orientation early in the task and strong grip type tuning with a peak during movement execution, whereas AIP showed a clear tuning for grip type and orientation throughout the task. These data indicate that distinct representations of both task parameters exist in the multiunit activity of both areas during movement planning, which we explored for real-time decoding of grip type and orientation.
Figure 4, C and D, shows the population firing rate of the same multiunits during real-time decoding. As for individual multiunits (Fig. 3), the population activity showed similar tuning to grip type and orientation in both areas during the cue and planning epochs in both tasks, even though the monkey did not perform a grip (note the absence of movement-related activity). This clear modulation of firing rate by the task in the absence of movement execution provided the means by which we were able to decode grasp in real time using only activity from the planning epoch.
Multiunit coding properties
To further investigate the tuning properties of F5 and AIP multiunits, we examined the distribution of preferred grip types and orientations across all tuned multiunits during the planning period (Fig. 5). In area F5, the majority of cells (67%) had a preference for precision grip (Fig. 5A, left), which was consistent with the finding that more complex grip types tend to be overrepresented in motor areas (Muir and Lemon, 1983; Umilta et al., 2007). However, in contrast to previous single-unit work in F5 (Fluet et al., 2010), we did not observe a clear preference for extreme handle orientations in our multiunit data. Instead, the distribution of preferred orientations across the population was relatively uniform (Fig. 5B, left).
Figure 5.

Distribution of preferred grip type and orientation during grasp planning for F5 (left) and AIP multiunits (right). A, Ratio of multiunits preferring precision grip (white) versus power grip (black). B, Distribution of multiunits preferring a particular object orientation.
In AIP, the distributions of preferred grips and orientations were somewhat different from those in F5. First, there was no clear preference for either grip type in the population during the planning period (Fig. 5A, right). Second, the majority of AIP multiunits (60%) coded predominantly for the extreme handle orientations during planning (Fig. 5B, right), which was in strong contrast to the F5 data. Together, these population data confirm that both grip type and orientation were somewhat differently represented in the multiunit activity of AIP and F5.
This tuning pattern during movement planning remained essentially constant while the monkey performed the real-time decoding task (Fig. 6). For all tuned units of the delayed grasping task, we also measured the preferred grip type and the preferred orientation during movement planning in the real-time decoding task. In both areas F5 and AIP, only a small minority of multiunits showed a change in preferred grip type (8% of cells) (Fig. 6A,B, respectively), and the preferred orientation stayed either the same or shifted by a single position at most; few cells showed larger shifts in their preferred handle position (Fig. 6C,D). Thus, the patterns of spiking activity across the population of cells in the two areas remained similar in the real grasping task and during grasp decoding, and could be reliably accessed for decoding in real time.
Figure 6.
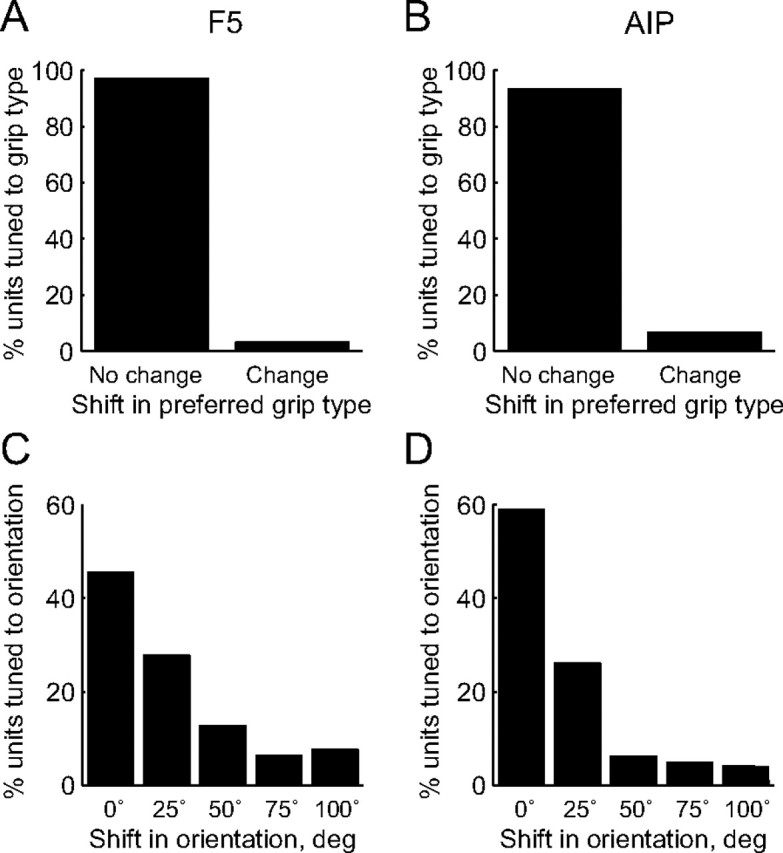
Consistency of tuning preferences during grasp planning across the delayed grasping task and the brain control task. A, Consistency of grip type tuning in F5. The histogram indicates the proportion of multiunits that maintained the same preference for grip type in both tasks versus those that changed to the opposite type. B, Consistency of grip type tuning in AIP. In both areas, the vast majority of units did not change their preferred grip. C, Change of orientation tuning in F5 between delayed grasping and brain control. The histogram shows the proportion of units for which the preferred orientations were the same (0ο shift), highly similar (25ο shift), or further apart (50–100ο shift) in both tasks. D, Change of orientation tuning in AIP. Shifts of preferred orientation exceeding 25ο were rare.
On-line grasp decoding
Representative performances during a single real-time decoding session are shown in Figure 7 for Monkeys S and Z. The output of the decoder is compared to the instructed condition for all trials of this session using a confusion matrix (Fig. 7A,C) (see Materials and Methods). Correctly classified trials appear along the diagonal of this matrix. Using multiunit spiking activity from F5 and AIP during the planning period, grip type and orientation were decoded with an overall mean accuracy of 62.0% in Monkey S and with an accuracy of 30.8% in Monkey Z. For the latter animal, the confusion matrix revealed that the main type of error responsible for the somewhat low performance was confusion of neighboring orientations, while grip type was rarely misclassified (Fig. 7C). Figure 7D shows the trial-by-trial success rate of the decoder during the same session (see Materials and Methods). Although there was some variability in performance, trials were generally decoded above chance level (10%). Decoder performance was markedly better in Monkey S: again, there was almost no confusion of the grip type but, in contrast to Monkey Z, a much better classification of orientation was observed (Fig. 7A). The trialwise performance of the decoder was also more stable compared to that for the other animal, and remained well above chance throughout the session (Fig. 7B).
Figure 7.

Two example sessions of real-time decoding. A–D, One session from Animal S (A, B) and one from Animal Z (C, D). A, Confusion matrix depicting the decoding performance for grip type (precision vs power) and handle orientations (here labeled 1–5), i.e., 10 grasp conditions in total. The color code indicates the percentage of how often a particular decoding condition was predicted for a given instructed (true) condition. Correct classifications therefore line up along the diagonal. Note that classification errors were mainly made between neighboring orientations but rarely between grip types. B, Trialwise classification performance for the same session as in A. Classification accuracy was measured using a sliding window that averaged performance in the previous 10 trials. Performance is displayed separately for all 10 conditions (thick gray line), grip type only (thin black line), and orientation only (dotted line). Note, however, that the monkey always performed the full 10-condition decoding task. The dashed line shows the chance level for 10-condition decoding. Performance errors were mainly due to errors in orientation classification rather than grip type. C, D, The same analysis for a session from Animal Z.
Figure 8 summarizes the real-time decoding performance of both animals across all sessions. Average confusion matrices for Monkeys Z and S are shown in Figure 8, A and B. The same qualitative features of decoding performance exhibited within the example sessions were also observed in the average across all recordings: the decoder was highly accurate in grip type classification but tended to misclassify orientation, especially in Monkey Z. Decoding accuracy across sessions is given in Figure 8, C and D (thick gray curves). It remained consistently above chance level, with a mean performance of 50.4% (SD, 7.6%) in Monkey S and 33.5% (SD, 5.9%) in Monkey Z.
Figure 8.
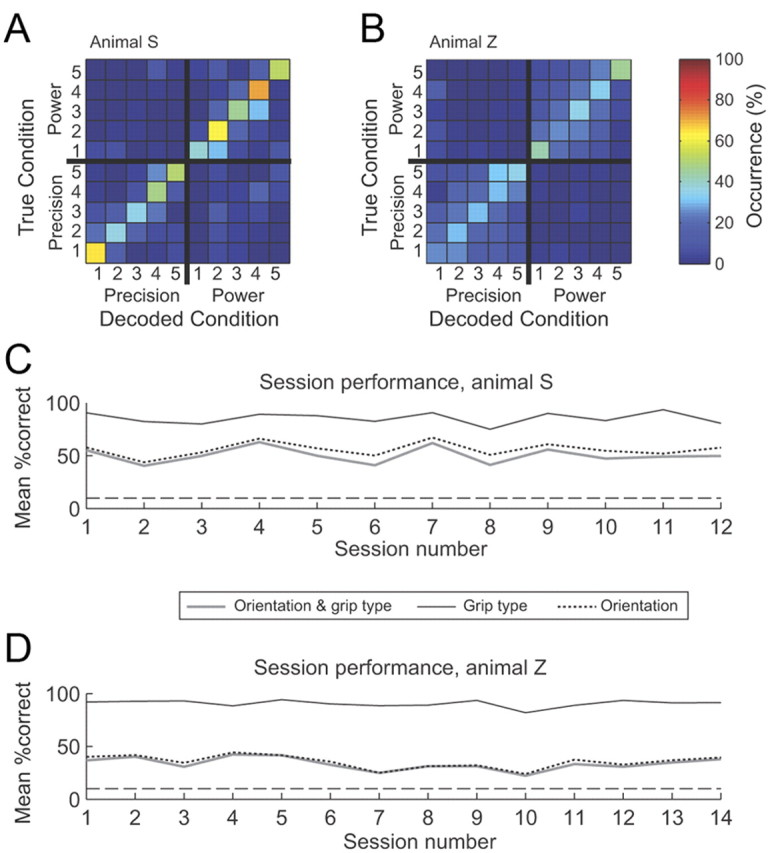
Real-time decoding performance across all sessions. A, Average decoding predictability across all sessions of Animal S (n = 12), computed by averaging individual confusion matrices across sessions. Conventions are as in Figure 7A. B, Average decoding predictability across all sessions in Animal Z (n = 14). Note that compared to Animal S, decoding in this animal showed low predictability of the five handle orientations, but still high predictability of grip type. C, Sessionwise classification performance of Animal S. Each point represents the mean percentage of correctly classified trials. Classification performance was measured separately for grip type decoding only, orientation decoding only, and both. As evident in the confusion matrix, the overall decoding performance was limited by errors in orientation decoding, while grip type classification was highly accurate. D, The same analysis for the sessions for Animal Z. Horizontal dashed lines in C and D represent the chance level for 10-condition decoding (10%).
To gain more detailed information about decoder performance, we quantified the decoding accuracy also separately for grip type and orientation (Fig. 8C,D, solid black and dotted curves). As expected, classification of the grip type was always highly accurate in both monkeys (Monkey S mean, 85.5%; Monkey Z mean, 90.6%). In contrast, decoding of handle orientation was performed less accurately in both animals, which is not surprising given that there were more orientations (five) than grip type conditions (two) to classify. However, there was a considerable performance difference between the two animals; while orientation could be classified with an accuracy of 56% in Monkey S, it was only 35.5% in Monkey Z, very similar to the overall observed performance of 33.5%. This suggests that in Monkey S, information about both grip type and orientation was available to the decoder, while the decoding of orientation information was rather poor in Monkey Z.
Off-line decoding
To investigate how these differences in classification of grasp parameters were related to the information available within each cortical area, we evaluated the decoding performance in an off-line analysis separately for AIP and F5 and in combination with improved (off-line) spike sorting (see Materials and Methods). As a first step, we investigated how much the decoding performance improved if we replaced the real-time spike-sorting (RS) procedure with an off-line, optimized spike-sorting (OS) technique that used superparamagnetic clustering (see Materials and Methods). Superparamagnetic clustering can provide high-quality spike sorting but is currently not implemented to run fast enough and unsupervised in real-time mode.
Figure 9 shows the off-line decoding performance observed using spike data originally sorted on-line (RS) versus data sorted off-line (OS). In both animals, decoding performance for OS versus RS increased in 22 of 26 decoding sessions, with a mean increase of 6.25 percentage points. Although this was a relatively small performance gain, the difference was highly significant (two-tailed matched-samples t test, p < 1 × 10⁻⁴).
Figure 9.

Scatter plot comparing mean decoding performance using RS versus OS data. In both animals, most points fall above the unity line, but close to it, indicating that decoding performance was only marginally improved by performing off-line spike-sorting procedures (mean increase, 6.25 percentage points).
Next, we performed off-line decoding of grip type, orientation, or all 10 grasp conditions using the Matlab implementation of the same Bayesian classifier that was used on-line. Figure 10 summarizes the results of this analysis. Mean RS and OS performances are shown for off-line decoding (RS-OD and OS-OD, respectively) and compared to data sorted and decoded in the real-time experiment (RS-RD). Certain key differences between F5 and AIP were readily apparent. During decoding of grip type alone, performance was better using only F5 data than only AIP data (Fig. 10A,B). For example, in Monkey Z, grip type classification accuracy was 90.9% (SD, 6.1%) for F5 RS data, compared to 63.6% (SD, 8.2%) for AIP RS data. The same superior performance for F5 versus AIP during grip type decoding was observed in the OS data. However, decoding grip type with information from both areas combined did not lead to significantly better performance than using F5 alone, neither for RS nor OS data (two-tailed t tests, p > 0.05). Finally, we did not see obvious performance increases at this stage when using OS data, with the exception of area AIP in Monkey S (Fig. 10A); here, grip type decoding accuracy increased to 81.9% (SD, 6.5%). To summarize, these results suggest that maximum classification of grip type could be achieved using data from F5 alone, and it was not possible to extract further information via off-line spike-sorting routines or by the inclusion of AIP activity.
Figure 10.

Summary of decoding performance results. Each bar chart shows the mean classification accuracy across all sessions, analyzed separately for different spike-sorting methods (RS vs OS), decoding types (grip type vs orientation), and cortical areas (AIP vs F5). Actual observed real-time decoding (RD) results are included for comparison (RS-RD; gray bars). Respective chance levels are indicated with dashed lines. Error bars represent SD. A, Grip type decoding performance in Animal S. Classification of grip type was performed with high accuracy, particularly when using data from F5. Off-line spike sorting (OS) did not significantly increase decoding performance. C, Orientation decoding performance in Animal S. AIP performed significantly better than F5. E, Decoding performance for all 10 grasp conditions (type and orientation). In both C and E, performance was greater using data from both AIP and F5 than using either area alone. In addition, application of off-line spike sorting resulted in a moderate performance gain. B, D, F, Same analysis for Monkey Z.
In contrast to grip-type decoding, results obtained during orientation-only decoding were more accurate when using data from AIP than from F5 (Fig. 10C,D). This effect was strongest in Monkey S, with decoding performance averaging 53.9% (SD, 7.7%) with AIP RS data, compared to only 42.7% (SD, 8.0%) with F5 RS data. Here, combining signals from both areas gave the most accurate orientation classification (57.9%; SD, 7.7%), although this difference was not significant compared to performance with AIP alone (two-tailed t test, p > 0.05). The same effect of area on orientation decoding accuracy was observed with OS data. In addition, there was a marked increase in decoding accuracy in Monkey S with OS compared to RS data. This was true for both AIP and for AIP and F5 combined; using OS data increased decoding performance by 8.6 percentage points for AIP and 8.7 percentage points for AIP and F5 combined from what was observed using RS data. (For AIP and F5 combined, a similar increase was seen compared with real-time decoding performance). In contrast, there was no performance increase for OS versus RS data in F5 (Fig. 10C).
In Monkey Z, accuracy of orientation decoding with RS data from AIP alone was lower (30.3%; SD, 6.8%), but still larger than from F5 (27.5%; SD, 5.2%). No significant differences were found between accuracies for the different areas or for both areas combined. Finally, in contrast to Monkey S, no improvement was observed for decoding with OS data (Fig. 10D).
Decoding of the full 10 conditions produced similar results to orientation-only decoding, with the addition of an overall reduction in accuracy due to the more complex nature of classifying both parameters simultaneously. In Monkey S, mean performance using F5 alone with RS data was relatively poor (39.5%; SD, 9%); this increased somewhat to 42.1% using OS data (Fig. 10E). AIP accuracy using RS data was greater than F5 (42.4%; SD, 7.2%). However, applying off-line spike sorting to the AIP data here resulted in a much larger performance increase of 8.5 percentage points (to 51.0%; SD, 8.4%). For Monkey Z, the decoder performed better using data from F5 alone compared to AIP alone [25.9% (SD, 5.9%) vs 21.0% (SD 6.9%), respectively; Fig. 10F]. In this animal, performance levels using either area alone were relatively low, and only minimal improvements were observed for off-line spike sorting.
A key finding was that in both animals we observed the best decoding performance, whether real-time or off-line, by combining data from both areas (Fig. 10E,F). In Monkey S, the mean real-time decoding performance measured across sessions (in which we used data from both areas by experimental design) was 50.4% (SD, 7.6%). Off-line performance using RS data was not significantly different (54.8%; SD, 7.4%; two-tailed t test, p > 0.05), and the best observed performance was for OS data (61.1%; SD, 6.2%). Unlike the previous decodings, where performance using the combined information from AIP and F5 was always statistically indistinguishable from the performance achieved with the best area alone (F5 for grip type, AIP for orientation), we found that performance with AIP and F5 combined was significantly better than performances achieved with either area alone. This was true for both the RS data and the OS data (one-way ANOVA, p < 0.001; see Materials and Methods). A similar trend was observed in Monkey Z, albeit with lower overall performance levels (Fig. 10F). Overall best performance was again achieved using off-line sorted and combined F5 plus AIP data. In summary, our results indicate that F5 tended to perform better than AIP at grip type-only decoding, AIP consistently outperformed F5 during orientation-only decoding, and utilization of data from both areas was necessary to maximize decoding accuracy of grip type and orientation in the 10-condition task.
ROC analysis
As shown above, we observed clear differences in the decoding accuracy between the AIP and F5 neural populations. To investigate whether these differences could be observed at the level of individual units, we performed an ROC analysis that quantified the classification accuracy of each individual multiunit for grip type and object orientation (Fig. 11). Only multiunits that were significantly tuned to either parameter (two-way ANOVA, p < 0.01) were included in this analysis (nontuned units would tend to perform at chance levels). Results were comparable for both animals and are presented together. Each histogram shows the ROC score (area under the curve values) across the population (F5, 244 units; AIP, 210 units) separately for significant and nonsignificant ROC scores (Monte Carlo analysis; see Materials and Methods). For grip type, the majority of units from F5 and AIP were able to distinguish between power and precision grip based on their spiking activity during the planning period (F5, 95% of units; AIP, 83%; Fig. 11A,B). However, in F5, the ROC score distribution was skewed toward larger values, with a mean of 0.77 (SD, 0.10) for F5 and 0.73 for AIP (SD, 0.07), for the units with significant scores. A t test revealed that this difference was highly significant (two-tailed t test, p < 10−6). This indicates that individual F5 units could predict grip type with higher accuracy than AIP units.
Figure 11.
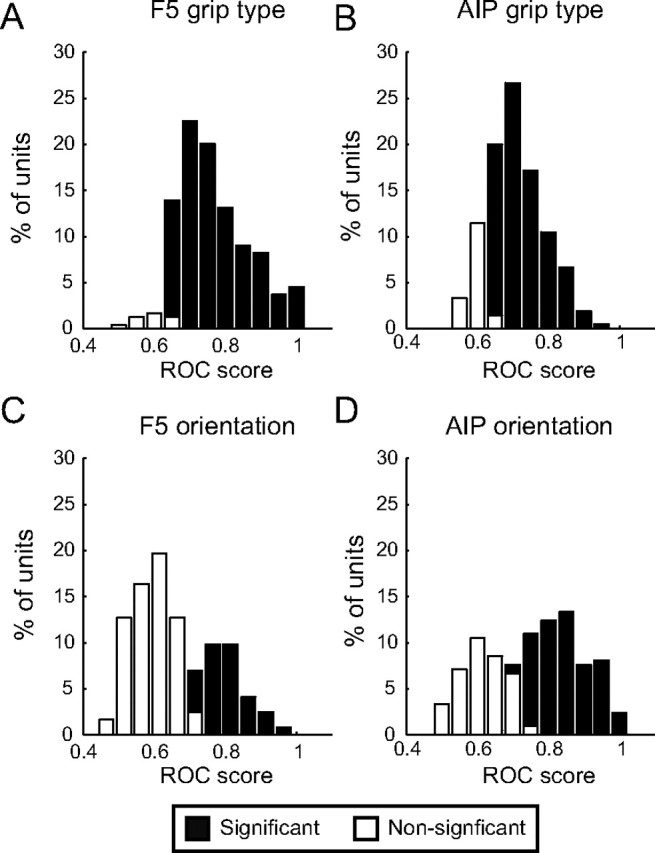
ROC analysis of classification accuracy for F5 and AIP multiunits. The ability of each significantly tuned multiunit to correctly classify grip type (precision vs power) and handle orientation (preferred vs nonpreferred) was measured in an ROC analysis. Each histogram shows the ROC score distribution in terms of the area under the curve values across the population; significant and nonsignificant ROC scores (Monte Carlo analysis) are represented by black and white bars, respectively. A, Grip type classification in F5. Ninety-five percent of tuned F5 multiunits could classify grip type with significant accuracy. B, Grip type classification in AIP. ROC score distribution was less skewed toward higher values, indicating lower accuracy of grip type classification in AIP compared to F5. C, Orientation classification in F5. In contrast to grip type, F5 multiunits performed relatively poorly at orientation classification, with a majority of nonsignificant ROC scores in the distribution. D, Orientation classification in AIP. Unlike F5, the majority of ROC scores were significant, indicating higher classification accuracy for orientation. Note that in both areas the ROC score distribution for orientation was bimodal.
In contrast, we observed a bimodal distribution of ROC scores for orientation classification. Each population of multiunits could be divided into significant and nonsignificantly tuned units (Fig. 11C,D). This separation was much more obvious in F5, where only a minority of units (34%) could classify object orientation reliably. In AIP, the reverse was true: a majority of units (63%) had ROC scores significantly larger than 0.5. The mean ROC score of these significantly tuned units in AIP was 0.83 (SD, 0.08), compared to only 0.79 (SD, 0.06) in F5, a statistically significant difference (two-tailed t test, p < 0.01). Thus, individual AIP units predicted orientation with greater accuracy than F5 units.
These findings demonstrate that the observed differences in decoding performance between the F5 and AIP populations were reflected in the properties of individual units and did not simply originate from an underrepresentation of tuned units in our data sample from AIP and F5.
Discussion
We demonstrated real-time decoding of grip type and orientation in monkeys using neural activity recorded from higher-order cortical areas F5 and AIP that are involved in grasp movement planning (Fig. 1). The fixed nature of the chronically implanted electrode arrays (Fig. 2) favored multiunit over single-unit signals, which showed broad similarities to previous single-unit studies in AIP and F5 (Baumann et al., 2009; Fluet et al., 2010). Distinct representations of grip type and object orientation were found in both areas during grasp movement planning (Fig. 3), which also became apparent at the population level (Fig. 4): precision grip was overrepresented in F5, but not in AIP, whereas AIP units tended to prefer more extreme orientations compared to F5 (Fig. 5). These tuning preferences were maintained during real-time decoding in the absence of movement execution (Figs. 6, 7). Across all decoding sessions, grip type was consistently decoded with a high level of accuracy, whereas orientation decoding was significantly worse (Fig. 8). This could indicate that object orientation might be represented more optimally elsewhere, e.g., in dorsal premotor cortex (PMd) or parietal area V6A (Raos et al., 2004; Fattori et al., 2009). An off-line analysis of decoder performance revealed moderate improvements when using advanced spike-sorting methods (Fig. 9) and demonstrated an effect of cortical area on decoder performance (Fig. 10): signals from F5 yielded the highest accuracy for grip type decoding and the lowest for orientation, whereas AIP activity yielded better decoding of orientation plus highly accurate grip type predictions. Finally, an ROC analysis confirmed that F5 units were better at classifying grip type than AIP, while AIP units outperformed F5 units at orientation classification (Fig. 11). These results demonstrate that real-time decoding of intended grasping movements is possible using multiunit signals from higher-order motor areas and underscore the advantage of using multiple cortical areas for NI control.
Nature of decoded signals
Preparatory activity in F5 and AIP encodes high-level grasp intentions. AIP neurons represent grasping movements in terms of visual properties of target objects and contain context-related information for the appropriate selection of actions (Taira et al., 1990; Sakata et al., 1995; Murata et al., 2000; Baumann et al., 2009). Similarly, F5 represents visual properties of graspable objects well before movement execution (Murata et al., 1997; Raos et al., 2006; Umilta et al., 2007; Fluet et al., 2010). The representation of hand movements in these areas is therefore based on the overall motor goal, instead of a more intrinsic (muscle-like) representation as in M1 (Kakei et al., 1999, 2003; Morrow et al., 2007), which makes these signals interesting potential targets for prosthetic applications (Shenoy et al., 2003).
Neural activity during motor planning might simply reflect sensory properties of the cue, such as the dot color instructing the grasp type. Yet, spiking in AIP and F5 showed sustained modulation for several hundred milliseconds after the end of the cue period (Fig. 4), well outside the range of transient visual activity (Thorpe et al., 1996; Schmolesky et al., 1998). Similarly, delay period firing could be associated with anticipatory hand muscle activity as the animal prepares for the upcoming movement. Decoded information might then reflect an efferent command or afferent feedback signal. However, previous work has demonstrated that hand and arm muscles are selective for different grasp patterns only after reach movement initiation, i.e., during hand preshaping (Brochier et al., 2004). In contrast, F5 neurons show tuning hundreds of milliseconds before either M1 or muscles become active (Umilta et al., 2007). Thus, preparatory grasping activity in AIP and F5 cannot be explained by simple sensory or anticipatory processes, but reflects most likely their involvement in sensorimotor transformation.
Multiunit signals
In our study, multiunit signals comprised ∼85% of the recorded spiking activity. This was chiefly due to difficulty in separating and classifying multiple spike waveforms as individual neurons in low signal-to-noise conditions. Permanently implanted electrodes are particularly susceptible to this problem since they cannot be repositioned to improve signal quality (Super and Roelfsema, 2005; Ventura, 2008).
Several studies have shown that the tuning properties of multiunits are similar to single units (Desimone and Gross, 1979; Super and Roelfsema, 2005; Zeitler et al., 2006; Stark and Abeles, 2007). Our data confirm this view for grasping in AIP and F5. A notable difference, however, was the relatively uniform distribution of preferred orientations among F5 multiunits during the planning period, contrasting with the tendency of F5 single units to prefer extreme orientations (Fluet et al., 2010). One plausible explanation is that the summation over individual neurons weakens or perturbs the orientation tuning measured in the multiunit data (Ventura, 2008; Fraser et al., 2009). However, multiunit activity may encode additional information not present at the single-unit level (Zeitler et al., 2006; Stark and Abeles, 2007), and therefore may represent a viable decoding source in its own right. Our finding that classification performance was only modestly improved by additional off-line sorting (Figs. 9, 10) supports this view.
Multiunit data could be a useful control signal for neuroprosthetic applications, since spike sorting is computationally intensive (Quiroga et al., 2004; Santhanam et al., 2006), and tissue reactions or other processes can severely weaken single-unit recording capabilities over months and years after implantation (Polikov et al., 2005; Schwartz et al., 2006; Scherberger, 2009; Hatsopoulos and Donoghue, 2009). The use of multiunit activity can therefore be regarded as a trade-off between ease of signal acquisition and tuning fidelity, with the hope that the latter could be improved by advanced decoding paradigms and statistical models (Stark and Abeles, 2007; Ventura, 2008; Fraser et al., 2009).
Neural decoding
NIs for motor control have seen rapid expansion in recent years (Hatsopoulos and Donoghue, 2009; Nicolelis and Lebedev, 2009; Scherberger, 2009). A key approach has used closed-loop decoding of 2D and 3D hand kinematics, mainly from M1 activity, to control robotic arm and hand movements (Serruya et al., 2002; Taylor et al., 2002; Carmena et al., 2003; Wolpaw and McFarland, 2004; Hochberg et al., 2006; Velliste et al., 2008; Aggarwal et al., 2009; Vargas-Irwin et al., 2010). Yet it is still unclear which movement representation in M1 is optimal for effective hand control (Moran and Schwartz, 1999; Scott, 2000; Morrow and Miller, 2003; Paninski et al., 2004; Townsend et al., 2006) or how M1 activity is translated into activations of the relevant muscles (Yanai et al., 2007; Lemon, 2008; Asher et al., 2010).
In contrast, our real-time decoding study used signals simultaneously from parietal and premotor cortex, which contain more abstract representations of intended grasping actions. These can be extracted without accessing low-level motor control signals in M1 or the spinal cord (Baumann et al., 2009; Fluet et al., 2010). Such an approach has been shown previously for arm-reaching movements with signals from the parietal reach region or PMd (Shenoy et al., 2003; Musallam et al., 2004; Scherberger et al., 2005; Santhanam et al., 2006; Mulliken et al., 2008).
Furthermore, we used ensemble activity in F5 and AIP to decode grip type in a discrete fashion, as opposed to continuous kinematics (Vargas-Irwin et al., 2010). Discrete decoding was used previously for reach or eye movement categorizations (Shenoy et al., 2003; Musallam et al., 2004; Scherberger et al., 2005; Santhanam et al., 2006) and for a recent decoding simulation of grip type from single-unit activity in F5 (Carpaneto et al., 2011). Discrete decoding is well suited for prosthetics applications where the user selects quickly from individual categories, e.g., during typing or remote control operations (Santhanam et al., 2006), and where discrete motor goals can be translated into kinematic control signals by an external controller. Our study advances this concept toward developing more sophisticated grasp prostheses, which in the future could include larger numbers of grasp types or hand orientations.
Comparison between AIP and F5
Our approach to decode simultaneously from F5 and AIP was motivated by the fact that these areas exhibit important differences in terms of anatomical and functional connectivity and their representation of grasp movements. AIP receives input from parietal visual areas (in particular lateral intraparietal area, caudal intraparietal area, and V6A) and inferior temporal cortex (TEa, TEm) (Nakamura et al., 2001; Borra et al., 2008) that represents spatial and feature information of visible objects (Sakata et al., 1997; Tsutsui et al., 2001, 2002; Galletti et al., 2003). Consistent with this, AIP units predicted object orientation better than F5 units (Fig. 10, 11). Our results are therefore compatible with AIP's representation of the grasp target in visual terms (Baumann et al., 2009).
In contrast, F5 is anatomically strongly connected with M1 and exerts a powerful influence over M1 corticospinal output (Cerri et al., 2003; Shimazu et al., 2004). Concordant with these properties, F5 showed a strong representation of the grip type (Fig. 5) and was better than AIP at discriminating grip type (Fig. 11), consistent with a more direct role of F5 in hand movement execution (Brochier and Umilta, 2007; Fluet et al., 2010). Overall, activities in F5 and AIP were complementary; indeed, we observed maximal decoding performance by combining signals from both areas, and the overall lower performance of Animal Z is likely due to the underrepresentation of AIP (Fig. 10). This suggests that targeting multiple cortical structures for different types of information may be advantageous for NI development (Hatsopoulos et al., 2004; Nicolelis and Lebedev, 2009; Andersen et al., 2010).
Footnotes
This work was supported by Swiss National Science Foundation Grants 108323/1 and 120652/1, the Swiss National Center of Competence in Research “Neural Plasticity and Repair,” the European Commission (International Reintegration Grant 13072, “NeuroGrasp”), and University of Zürich Grant FK2004. We thank B. Disler and G. Stichel for animal care and S. Lehmann for help with experiments.
References
- Achtman N, Afshar A, Santhanam G, Yu BM, Ryu SI, Shenoy KV. Free-paced high-performance brain-computer interfaces. J Neural Eng. 2007;4:336–347. doi: 10.1088/1741-2560/4/3/018. [DOI] [PubMed] [Google Scholar]
- Aggarwal V, Tenore F, Acharya S, Schieber MH, Thakor NV. Cortical decoding of individual finger and wrist kinematics for an upper-limb neuroprosthesis. Conf Proc IEEE Eng Med Biol Soc. 2009;2009:4535–4538. doi: 10.1109/IEMBS.2009.5334129. [DOI] [PMC free article] [PubMed] [Google Scholar]
- Andersen RA, Hwang EJ, Mulliken GH. Cognitive neural prosthetics. Annu Rev Psychol. 2010;61:169–190. doi: 10.1146/annurev.psych.093008.100503. [DOI] [PMC free article] [PubMed] [Google Scholar]
- Anderson KD. Consideration of user priorities when developing neural prosthetics. J Neural Eng. 2009;6 doi: 10.1088/1741-2560/6/5/055003. 055003. [DOI] [PubMed] [Google Scholar]
- Asher I, Zinger N, Yanai Y, Israel Z, Prut Y. Population-based corticospinal interactions in macaques are correlated with visuomotor processing. Cereb Cortex. 2010;20:241–252. doi: 10.1093/cercor/bhp095. [DOI] [PubMed] [Google Scholar]
- Bai O, Lin P, Vorbach S, Floeter MK, Hattori N, Hallett M. A high performance sensorimotor beta rhythm-based brain-computer interface associated with human natural motor behavior. J Neural Eng. 2008;5:24–35. doi: 10.1088/1741-2560/5/1/003. [DOI] [PubMed] [Google Scholar]
- Baumann MA, Fluet MC, Scherberger H. Context-specific grasp movement representation in the macaque anterior intraparietal area. J Neurosci. 2009;29:6436–6448. doi: 10.1523/JNEUROSCI.5479-08.2009. [DOI] [PMC free article] [PubMed] [Google Scholar]
- Borra E, Belmalih A, Calzavara R, Gerbella M, Murata A, Rozzi S, Luppino G. Cortical connections of the macaque anterior intraparietal (AIP) area. Cereb Cortex. 2008;18:1094–1111. doi: 10.1093/cercor/bhm146. [DOI] [PubMed] [Google Scholar]
- Brochier T, Umilta MA. Cortical control of grasp in non-human primates. Curr Opin Neurobiol. 2007;17:637–643. doi: 10.1016/j.conb.2007.12.002. [DOI] [PubMed] [Google Scholar]
- Brochier T, Spinks RL, Umilta MA, Lemon RN. Patterns of muscle activity underlying object-specific grasp by the macaque monkey. J Neurophysiol. 2004;92:1770–1782. doi: 10.1152/jn.00976.2003. [DOI] [PubMed] [Google Scholar]
- Brown EN, Kass RE, Mitra PP. Multiple neural spike train data analysis: state-of-the-art and future challenges. Nat Neurosci. 2004;7:456–461. doi: 10.1038/nn1228. [DOI] [PubMed] [Google Scholar]
- Carmena JM, Lebedev MA, Crist RE, O'Doherty JE, Santucci DM, Dimitrov DF, Patil PG, Henriquez CS, Nicolelis MAL. Learning to control a brain-machine interface for reaching and grasping by primates. Plos Biology. 2003;1:193–208. doi: 10.1371/journal.pbio.0000042. [DOI] [PMC free article] [PubMed] [Google Scholar]
- Carpaneto J, Umilta MA, Fogassi L, Murata A, Gallese V, Micera S, Raos V. Decoding the activity of grasping neurons recorded from the ventral premotor area F5 of the macaque monkey. Neuroscience. 2011;188:80–94. doi: 10.1016/j.neuroscience.2011.04.062. [DOI] [PubMed] [Google Scholar]
- Cerri G, Shimazu H, Maier MA, Lemon RN. Facilitation from ventral premotor cortex of primary motor cortex outputs to macaque hand muscles. J Neurophysiol. 2003;90:832–842. doi: 10.1152/jn.01026.2002. [DOI] [PubMed] [Google Scholar]
- Choi YS, Koenig MA, Jia XF, Thakor NV. Quantifying time-varying multiunit neural activity using entropy-based measures. IEEE Trans Biomed Eng. 2010;57:2771–2777. doi: 10.1109/TBME.2010.2049266. [DOI] [PMC free article] [PubMed] [Google Scholar]
- Dayan P, Abbott L. Cambridge, MA: MIT; 2001. Theoretical neuroscience: computational and mathematical modeling of neural systems. [Google Scholar]
- Desimone R, Gross CG. Visual areas in the temporal cortex of the macaque. Brain Res. 1979;178:363–380. doi: 10.1016/0006-8993(79)90699-1. [DOI] [PubMed] [Google Scholar]
- Fattori P, Breveglieri R, Marzocchi N, Filippini D, Bosco A, Galletti C. Hand orientation during reach-to-grasp movements modulates neuronal activity in the medial posterior parietal area V6A. J Neurosci. 2009;29:1928–1936. doi: 10.1523/JNEUROSCI.4998-08.2009. [DOI] [PMC free article] [PubMed] [Google Scholar]
- Fluet MC, Baumann MA, Scherberger H. Context-specific grasp movement representation in macaque ventral premotor cortex. J Neurosci. 2010;30:15175–15184. doi: 10.1523/JNEUROSCI.3343-10.2010. [DOI] [PMC free article] [PubMed] [Google Scholar]
- Fraser GW, Chase SM, Whitford A, Schwartz AB. Control of a brain-computer interface without spike sorting. J Neural Eng. 2009;6 doi: 10.1088/1741-2560/6/5/055004. 055004. [DOI] [PubMed] [Google Scholar]
- Galletti C, Kutz DF, Gamberini M, Breveglieri R, Fattori P. Role of the medial parieto-occipital cortex in the control of reaching and grasping movements. Exp Brain Res. 2003;153:158–170. doi: 10.1007/s00221-003-1589-z. [DOI] [PubMed] [Google Scholar]
- Hatsopoulos NG, Donoghue JP. The science of neural interface systems. Annu Rev Neurosci. 2009;32:249–266. doi: 10.1146/annurev.neuro.051508.135241. [DOI] [PMC free article] [PubMed] [Google Scholar]
- Hatsopoulos N, Joshi J, O'Leary JG. Decoding continuous and discrete motor behaviors using motor and premotor cortical ensembles. J Neurophysiol. 2004;92:1165–1174. doi: 10.1152/jn.01245.2003. [DOI] [PubMed] [Google Scholar]
- Hochberg LR, Serruya MD, Friehs GM, Mukand JA, Saleh M, Caplan AH, Branner A, Chen D, Penn RD, Donoghue JP. Neuronal ensemble control of prosthetic devices by a human with tetraplegia. Nature. 2006;442:164–171. doi: 10.1038/nature04970. [DOI] [PubMed] [Google Scholar]
- Jeannerod M, Michel F, Prablanc C. The control of hand movements in a case of hemianesthesia following a parietal lesion. Brain. 1984;107:899–920. doi: 10.1093/brain/107.3.899. [DOI] [PubMed] [Google Scholar]
- Kakei S, Hoffman DS, Strick PL. Muscle and movement representations in the primary motor cortex. Science. 1999;285:2136–2139. doi: 10.1126/science.285.5436.2136. [DOI] [PubMed] [Google Scholar]
- Kakei S, Hoffman DS, Strick PL. Sensorimotor transformations in cortical motor areas. Neurosci Res. 2003;46:1–10. doi: 10.1016/s0168-0102(03)00031-2. [DOI] [PubMed] [Google Scholar]
- Kass RE, Ventura V, Cai C. Statistical smoothing of neuronal data. Network. 2003;14:5–15. doi: 10.1088/0954-898x/14/1/301. [DOI] [PubMed] [Google Scholar]
- Lemon RN. Cortical control of the primate hand. Exp Physiol. 1993;78:263–301. doi: 10.1113/expphysiol.1993.sp003686. [DOI] [PubMed] [Google Scholar]
- Lemon RN. Descending pathways in motor control. Annu Rev Neurosci. 2008;31:195–218. doi: 10.1146/annurev.neuro.31.060407.125547. [DOI] [PubMed] [Google Scholar]
- Leuthardt EC, Schalk G, Wolpaw JR, Ojemann JG, Moran DW. A brain-computer interface using electrocorticographic signals in humans. J Neural Eng. 2004;1:63–71. doi: 10.1088/1741-2560/1/2/001. [DOI] [PubMed] [Google Scholar]
- Luppino G, Murata A, Govoni P, Matelli M. Largely segregated parietofrontal connections linking rostral intraparietal cortex (areas AIP and VIP) and the ventral premotor cortex (areas F5 and F4) Exp Brain Res. 1999;128:181–187. doi: 10.1007/s002210050833. [DOI] [PubMed] [Google Scholar]
- Moran DW, Schwartz AB. Motor cortical representation of speed and direction during reaching. J Neurophysiol. 1999;82:2676–2692. doi: 10.1152/jn.1999.82.5.2676. [DOI] [PubMed] [Google Scholar]
- Morrow MM, Miller LE. Prediction of muscle activity by populations of sequentially recorded primary motor cortex neurons. J Neurophysiol. 2003;89:2279–2288. doi: 10.1152/jn.00632.2002. [DOI] [PMC free article] [PubMed] [Google Scholar]
- Morrow MM, Jordan LR, Miller LE. Direct comparison of the task-dependent discharge of M1 in hand space and muscle space. J Neurophysiol. 2007;97:1786–1798. doi: 10.1152/jn.00150.2006. [DOI] [PMC free article] [PubMed] [Google Scholar]
- Muir RB, Lemon RN. Corticospinal neurons with a special role in precision grip. Brain Res. 1983;261:312–316. doi: 10.1016/0006-8993(83)90635-2. [DOI] [PubMed] [Google Scholar]
- Mulliken GH, Musallam S, Andersen RA. Decoding trajectories from posterior parietal cortex ensembles. J Neurosci. 2008;28:12913–12926. doi: 10.1523/JNEUROSCI.1463-08.2008. [DOI] [PMC free article] [PubMed] [Google Scholar]
- Murata A, Fadiga L, Fogassi L, Gallese V, Raos V, Rizzolatti G. Object representation in the ventral premotor cortex (area F5) of the monkey. J Neurophysiol. 1997;78:2226–2230. doi: 10.1152/jn.1997.78.4.2226. [DOI] [PubMed] [Google Scholar]
- Murata A, Gallese V, Luppino G, Kaseda M, Sakata H. Selectivity for the shape, size, and orientation of objects for grasping in neurons of monkey parietal area AIP. J Neurophysiol. 2000;83:2580–2601. doi: 10.1152/jn.2000.83.5.2580. [DOI] [PubMed] [Google Scholar]
- Musallam S, Corneil BD, Greger B, Scherberger H, Andersen RA. Cognitive control signals for neural prosthetics. Science. 2004;305:258–262. doi: 10.1126/science.1097938. [DOI] [PubMed] [Google Scholar]
- Nakamura H, Kuroda T, Wakita M, Kusunoki M, Kato A, Mikami A, Sakata H, Itoh K. From three-dimensional space vision to prehensile hand movements: The lateral intraparietal area links the area V3A and the anterior intraparietal area in macaques. J Neurosci. 2001;21:8174–8187. doi: 10.1523/JNEUROSCI.21-20-08174.2001. [DOI] [PMC free article] [PubMed] [Google Scholar]
- National Research Council. Washington, DC: National Academies; 2003. Guidelines for the care and use of mammals in neuroscience and behavioral research. [PubMed] [Google Scholar]
- Nicolelis MAL, Lebedev MA. Principles of neural ensemble physiology underlying the operation of brain-machine interfaces. Nat Rev Neurosci. 2009;10:530–540. doi: 10.1038/nrn2653. [DOI] [PubMed] [Google Scholar]
- Paninski L, Shoham S, Fellows MR, Hatsopoulos NG, Donoghue JP. Superlinear population encoding of dynamic hand trajectory in primary motor cortex. J Neurosci. 2004;24:8551–8561. doi: 10.1523/JNEUROSCI.0919-04.2004. [DOI] [PMC free article] [PubMed] [Google Scholar]
- Polikov VS, Tresco PA, Reichert WM. Response of brain tissue to chronically implanted neural electrodes. J Neurosci Methods. 2005;148:1–18. doi: 10.1016/j.jneumeth.2005.08.015. [DOI] [PubMed] [Google Scholar]
- Quiroga RQ, Nadasdy Z, Ben-Shaul Y. Unsupervised spike detection and sorting with wavelets and superparamagnetic clustering. Neural Comp. 2004;16:1661–1687. doi: 10.1162/089976604774201631. [DOI] [PubMed] [Google Scholar]
- Raos V, Umilta MA, Gallese V, Fogassi L. Functional properties of grasping-related neurons in the dorsal premotor area f2 of the macaque monkey. J Neurophysiol. 2004;92:1990–2002. doi: 10.1152/jn.00154.2004. [DOI] [PubMed] [Google Scholar]
- Raos V, Umilta MA, Murata A, Fogassi L, Gallese V. Functional properties of grasping-related neurons in the ventral premotor area F5 of the macaque monkey. J Neurophysiol. 2006;95:709–729. doi: 10.1152/jn.00463.2005. [DOI] [PubMed] [Google Scholar]
- Rizzolatti G, Camarda R, Fogassi L, Gentilucci M, Luppino G, Matelli M. Functional-organization of inferior area-6 in the macaque monkey. II. Area F5 and the control of distal movements. Exp Brain Res. 1988;71:491–507. doi: 10.1007/BF00248742. [DOI] [PubMed] [Google Scholar]
- Sakata H, Taira M, Murata A, Mine S. Neural mechanisms of visual guidance of hand action in the parietal cortex of the monkey. Cereb Cortex. 1995;5:429–438. doi: 10.1093/cercor/5.5.429. [DOI] [PubMed] [Google Scholar]
- Sakata H, Taira M, Kusunoki M, Murata A, Tanaka Y. The TINS lecture. The parietal association cortex in depth perception and visual control of hand action. Trends Neurosci. 1997;20:350–357. doi: 10.1016/s0166-2236(97)01067-9. [DOI] [PubMed] [Google Scholar]
- Santhanam G, Ryu SI, Yu BM, Afshar A, Shenoy KV. A high-performance brain-computer interface. Nature. 2006;442:195–198. doi: 10.1038/nature04968. [DOI] [PubMed] [Google Scholar]
- Scherberger H. Neural control of motor prostheses. Curr Opin Neurobiol. 2009;19:629–633. doi: 10.1016/j.conb.2009.10.008. [DOI] [PubMed] [Google Scholar]
- Scherberger H, Jarvis MR, Andersen RA. Cortical local field potential encodes movement intentions in the posterior parietal cortex. Neuron. 2005;46:347–354. doi: 10.1016/j.neuron.2005.03.004. [DOI] [PubMed] [Google Scholar]
- Schieber MH, Santello M. Hand function: peripheral and central constraints on performance. J Appl Physiol. 2004;96:2293–2300. doi: 10.1152/japplphysiol.01063.2003. [DOI] [PubMed] [Google Scholar]
- Schmolesky MT, Wang YC, Hanes DP, Thompson KG, Leutgeb S, Schall JD, Leventhal AG. Signal timing across the macaque visual system. J Neurophysiol. 1998;79:3272–3278. doi: 10.1152/jn.1998.79.6.3272. [DOI] [PubMed] [Google Scholar]
- Schwartz AB, Cui XT, Weber DJ, Moran DW. Brain-controlled interfaces: Movement restoration with neural prosthetics. Neuron. 2006;52:205–220. doi: 10.1016/j.neuron.2006.09.019. [DOI] [PubMed] [Google Scholar]
- Scott SH. Reply to “One motor cortex, two different views.”. Nat Neurosci. 2000;3:964–965. doi: 10.1038/79888. [DOI] [PubMed] [Google Scholar]
- Serruya MD, Hatsopoulos NG, Paninski L, Fellows MR, Donoghue JP. Instant neural control of a movement signal. Nature. 2002;416:141–142. doi: 10.1038/416141a. [DOI] [PubMed] [Google Scholar]
- Shenoy KV, Meeker D, Cao SY, Kureshi SA, Pesaran B, Buneo CA, Batista AR, Mitra PP, Burdick JW, Andersen RA. Neural prosthetic control signals from plan activity. Neuroreport. 2003;14:591–596. doi: 10.1097/00001756-200303240-00013. [DOI] [PubMed] [Google Scholar]
- Shimazu H, Maier MA, Cerri G, Kirkwood PA, Lemon RN. Macaque ventral premotor cortex exerts powerful facilitation of motor cortex outputs to upper limb motoneurons. J Neurosci. 2004;24:1200–1211. doi: 10.1523/JNEUROSCI.4731-03.2004. [DOI] [PMC free article] [PubMed] [Google Scholar]
- Snoek GJ, IJzerman MJ, Hermens HJ, Maxwell D, Biering-Sorensen F. Survey of the needs of patients with spinal cord injury: impact and priority for improvement in hand function in tetraplegics. Spinal Cord. 2004;42:526–532. doi: 10.1038/sj.sc.3101638. [DOI] [PubMed] [Google Scholar]
- Stark E, Abeles M. Predicting movement from multiunit activity. J Neurosci. 2007;27:8387–8394. doi: 10.1523/JNEUROSCI.1321-07.2007. [DOI] [PMC free article] [PubMed] [Google Scholar]
- Subasi E, Townsend B, Scherberger H. In search of more robust decoding algorithms for neural prostheses, a data driven approach. Conf Proc IEEE Eng Med Biol Soc. 2010;2010:4172–4175. doi: 10.1109/IEMBS.2010.5627386. [DOI] [PubMed] [Google Scholar]
- Super H, Roelfsema PR. Chronic multiunit recordings in behaving animals: advantages and limitations. Prog Brain Res. 2005;147:263–282. doi: 10.1016/S0079-6123(04)47020-4. [DOI] [PubMed] [Google Scholar]
- Taira M, Mine S, Georgopoulos AP, Murata A, Sakata H. Parietal cortex neurons of the monkey related to the visual guidance of hand movement. Exp Brain Res. 1990;83:29–36. doi: 10.1007/BF00232190. [DOI] [PubMed] [Google Scholar]
- Taylor DM, Tillery SIH, Schwartz AB. Direct cortical control of 3D neuroprosthetic devices. Science. 2002;296:1829–1832. doi: 10.1126/science.1070291. [DOI] [PubMed] [Google Scholar]
- Thorpe S, Fize D, Marlot C. Speed of processing in the human visual system. Nature. 1996;381:520–522. doi: 10.1038/381520a0. [DOI] [PubMed] [Google Scholar]
- Townsend BR, Paninski L, Lemon RN. Linear encoding of muscle activity in primary motor cortex and cerebellum. J Neurophysiol. 2006;96:2578–2592. doi: 10.1152/jn.01086.2005. [DOI] [PubMed] [Google Scholar]
- Townsend BR, Subasi E, Scherberger H. Real time decoding of hand grasping signals from macaque premotor and parietal cortex. Biomed Eng. 2008;53(Suppl 1):203–205. [Google Scholar]
- Tsutsui KI, Jiang M, Yara K, Sakata H, Taira M. Integration of perspective and disparity cues in surface-orientation-selective neurons of area CIP. J Neurophysiol. 2001;86:2856–2867. doi: 10.1152/jn.2001.86.6.2856. [DOI] [PubMed] [Google Scholar]
- Tsutsui KI, Sakata H, Naganuma T, Taira M. Neural correlates for perception of 3D surface orientation from texture gradient. Science. 2002;298:409–412. doi: 10.1126/science.1074128. [DOI] [PubMed] [Google Scholar]
- Umilta MA, Brochier T, Spinks RL, Lemon RN. Simultaneous recording of macaque premotor and primary motor cortex neuronal populations reveals different functional contributions to visuomotor grasp. J Neurophysiol. 2007;98:488–501. doi: 10.1152/jn.01094.2006. [DOI] [PubMed] [Google Scholar]
- Vargas-Irwin CE, Shakhnarovich G, Yadollahpour P, Mislow JM, Black MJ, Donoghue JP. Decoding complete reach and grasp actions from local primary motor cortex populations. J Neurosci. 2010;30:9659–9669. doi: 10.1523/JNEUROSCI.5443-09.2010. [DOI] [PMC free article] [PubMed] [Google Scholar]
- Velliste M, Perel S, Spalding MC, Whitford AS, Schwartz AB. Cortical control of a prosthetic arm for self-feeding. Nature. 2008;453:1098–1101. doi: 10.1038/nature06996. [DOI] [PubMed] [Google Scholar]
- Ventura V. Spike train decoding without spike sorting. Neural Comp. 2008;20:923–963. doi: 10.1162/neco.2008.02-07-478. [DOI] [PMC free article] [PubMed] [Google Scholar]
- Wessberg J, Stambaugh CR, Kralik JD, Beck PD, Laubach M, Chapin JK, Kim J, Biggs J, Srinivasan MA, Nicolelis MAL. Real-time prediction of hand trajectory by ensembles of cortical neurons in primates. Nature. 2000;408:361–365. doi: 10.1038/35042582. [DOI] [PubMed] [Google Scholar]
- Wolpaw JR, McFarland DJ. Control of a two-dimensional movement signal by a noninvasive brain-computer interface in humans. Proc Natl Acad Sci U S A. 2004;101:17849–17854. doi: 10.1073/pnas.0403504101. [DOI] [PMC free article] [PubMed] [Google Scholar]
- Yanai Y, Adamit N, Harel R, Israel Z, Prut Y. Connected corticospinal sites show enhanced tuning similarity at the onset of voluntary action. J Neurosci. 2007;27:12349–12357. doi: 10.1523/JNEUROSCI.3127-07.2007. [DOI] [PMC free article] [PubMed] [Google Scholar]
- Zeitler M, Fries P, Gielen S. Assessing neuronal coherence with single-unit, multiunit, and local field potentials. Neural Comp. 2006;18:2256–2281. doi: 10.1162/neco.2006.18.9.2256. [DOI] [PubMed] [Google Scholar]