

Abstract
Trial-to-trial variability in decision making can be caused by variability in information processing as well as by variability in response caution. In this paper, we study which neural components code for trial-to-trial adjustments in response caution using a new computational approach that quantifies response caution on a single-trial level. We found that the frontostriatal network updates the amount of response caution. In particular, when human participants were required to respond quickly, we found a positive correlation between trial-to-trial fluctuations in response caution and the hemodynamic response in the presupplementary motor area and dorsal anterior cingulate. In contrast, on trials that required a change from a speeded response mode to a more accurate response mode or vice versa, we found a positive correlation between response caution and hemodynamic response in the anterior cingulate proper. These results indicate that for each decision, response caution is set through corticobasal ganglia functioning, but that individual choices differ according to the mechanisms that trigger changes in response caution.
Introduction
Even in the simplest, controlled environments, human decision making is profoundly variable. For example, when making a sequence of decisions about identical stimuli, the speed of information processing commonly fluctuates from one decision to the next, perhaps due to noise in the perceptual system or shifts in attention. Another aspect of the decision-making process that could differ from one decision to the next is the level of response caution that is exercised by the decision maker, that is, the amount of information that is required to make the decision. If response caution is low, a decision is made based on only a limited amount of information, but when response caution is high, more information is required before a decision is made. This trade-off between fast and cautious response modes is commonly referred to as the speed-accuracy trade-off (SAT) (Wickelgren, 1977; Bogacz et al., 2010). This paper studies the neural dynamics that relate to fluctuations in response caution from decision to decision using functional magnetic resonance imaging (fMRI).
Previous research has shown that frontostriatal networks are engaged in setting response caution to accommodate a change in response emphasis (Forstmann et al., 2008, 2010; Ivanoff et al., 2008; van Veen et al., 2008). In particular, higher activation is observed in the presupplementary motor area (pre-SMA) when participants are encouraged to respond quickly than during trials in which participants are encouraged to respond accurately.
While these studies have elicited the role of pre-SMA in adjusting response caution, it is less clear how this process unfolds on a moment-to-moment basis. However, methods have recently been developed to study fluctuations in the hemodynamic response (HR) on a trial-to-trial basis (Eichele et al., 2008), thereby providing insights into the dynamics of the role that a given area has in behavior. Here, we use this method to relate dynamic changes in the HR to fluctuations in response caution in an SAT task, with a particular focus on the comparison between trials in which response caution changes and trials on which response caution remains in a default state (Fleming et al., 2010).
Although new methods have been developed to examine trial-to-trial changes in the HR, computational models of different latent decision processes such as response caution have traditionally collapsed data within each experimental condition, discarding information about trial-to-trial variability (Vickers, 1970; Ratcliff, 1978; Usher and McClelland, 2001; Palmer et al., 2005; Brown and Heathcote, 2008; Ratcliff and McKoon, 2008). Thus, current models of decision making do not provide access to the trial-to-trial dynamics of latent cognitive processes, because the models are applied at the level of conditions: decisions within a condition are almost always treated as statistically identical. To overcome this limitation, we developed a novel approach to estimating latent decision-related parameters that we refer to as the single-trial linear ballistic accumulator (STLBA) model. Using this method, we probe trial-to-trial fluctuations in decision making. This allows us to understand how variability in the HR relates to the temporal dynamics of response caution.
Materials and Methods
Participants.
Seventeen participants (seven female; mean age, 23.1; SD age, 3.1) gave informed consent before the experiment (the study was approved by the University of Amsterdam Ethics Committee). Participants had normal or corrected-to-normal vision, and none of them had a history of neurological, major medical, or psychiatric disorders. All participants were right handed, as confirmed by the Edinburgh Inventory (Oldfield, 1971).
Behavioral task.
Participants performed a moving dots task, popular in neuroscience and research with primates (Britten et al., 1992). This task required participants to decide whether a cloud of dots appears to move to the left or the right. Out of 120 dots, 60 moved coherently and 60 moved randomly. From one 50 ms frame to the next, the “coherent set” of 60 dots was moved 1 pixel in the target direction, whereas the remaining “random set” of 60 dots was relocated randomly. On the subsequent frame, the coherent set and the random set switched roles, such that each dot was displaced coherently on one frame and displaced randomly on the next. This scheme ensures that the cloud remains centered, even though it gives the impression of moving systematically in one direction. Each dot consisted of three pixels, and the diameter of the entire cloud circle was 250 pixels. In this circle, pixels were uniformly distributed (Forstmann et al., 2008, 2010). Participants indicated their response by pressing one of two spatially compatible buttons with their left or right index finger. In the SAT blocks, a cue (i.e., “SP” for speed and “AC” for accuracy) instructed participants to adopt different levels of cautiousness on a trial-to-trial basis. On SP trials, participants received feedback according to their response speed (either “in time” or “too late”), and on AC trials participants received feedback according to their response (“correct” or “incorrect”). There were also some blocks in which a perceptual manipulation was included (perception blocks). Because this manipulation does not relate to the SAT, we do not discuss those data here.
Timing and scanning procedure of the fMRI experiment.
The timing of the sequence of trials was triggered from the MRI control every 10 s. The trials started with a variable oversampling interval of 0, 500, 1000, or 1500 ms to obtain an interpolated temporal resolution of 500 ms. During the variable oversampling interval, a fixation cross was presented. Participants were asked to maintain fixation. Then a cue was presented in the middle of the screen for 2000 ms. Cue presentation was followed by a jittered interval between 0 and 3000 ms in steps of 1000 ms. In the SAT blocks, the imperative stimulus (i.e., the moving dot pattern) was presented for 1500 ms and followed by a jittered interval between 200 and 1700 ms in steps of 500 ms, and finally feedback was provided for 350 ms. On the speed-stress trials, participants were required to respond within 400 ms after stimulus onset. On the accuracy-stressed trials participants were required to respond within 1000 ms. After the response a jittered interval between 200 and 1700 ms in steps of 500 ms was introduced, which was followed by feedback for 350 ms. The experiment consisted of four blocks with two SAT and two perception blocks, each including 40 trials. The experiment lasted ∼45 min. Every block started out with two dummy trials that were excluded from further analysis.
The fMRI measurements were acquired in a single scanning session on a 3T scanner (Philips). Thirty axial slices were acquired (222 × 222 mm FOV; 96 × 96 in-plane resolution; 3 mm slice thickness; 0.3 mm slice spacing) parallel to the AC–PC plane and covering the whole brain. We used a single-shot, gradient-recalled echo planar imaging (EPI) sequence [repetition time (TR), 2000 ms; echo time (TE), 28 ms; 90° flip angle (FA), transversal orientation]. Before the functional runs, a 3D T1 scan was acquired (T1 TFE; 25 × 25 cm FOV; 256 × 256 in-plane resolution; 182 slices; slice thickness, 1.2 mm; TR, 9.69; TE, 4.6; FA, 8, sagittal orientation).
Single-trial linear ballistic accumulation model.
One well-validated and well-known model of decision making is the linear ballistic accumulator (LBA) model (Brown and Heathcote, 2008; see also Forstmann et al., 2008, 2010; Donkin et al., 2009). The LBA model assumes that each decision is made by accumulating evidence for the different response options, with one accumulator for each option (Fig. 1A). During a decision process, evidence for each option accumulates with a fixed rate (drift rate v) until a critical value (called the response threshold b) is reached. To account for the variability in the data, the LBA model assumes that the drift rates are normally distributed from trial to trial (with different distributions for the different accumulators). In addition, the LBA model assumes that the start points of accumulation are drawn from a uniform distribution. These two sources of variability are sufficient to account for many benchmark phenomena in decision-making tasks (Brown and Heathcote, 2008). The LBA model also estimates the time that cannot be explained by any of the other components (t0, commonly referred to as nondecision time).
Figure 1.

The STLBA model. A, Evidence for each response alternative that is present in the stimulus differentially determines the drift rate on a trial. The decision time is the time needed for the fastest accumulator to reach threshold and equals (b − ai)/di. B, Time series obtained with the STLBA model for one representative participant (top to bottom, response times, drift rates, start points, HR for a representative IC).
In the LBA model, response caution can be quantified by the minimal difference between the threshold (b) and the start point of accumulation. Because the start point is drawn from a uniform distribution ranging from 0 to an upper bound of A, the minimal difference is b − A. If b − A is small, the accumulator associated with the incorrect response sometimes samples a start point that is close to the threshold. This increases the probability of selecting the incorrect accumulator, as the role of the drift rate (sampled form a normal distribution with mean v and variance s) is relatively small. In contrast, a high response caution (large value for b − A) ensures that both accumulators begin well below threshold. This decreases the probability of selecting the incorrect accumulator, but at the cost of longer overall decision times.
We extend the LBA model to provide estimates of response caution (and drift rate) for every trial. First, we estimate LBA parameter values for the full response time (RT) distribution in the usual manner (Donkin et al., 2009). Next, these LBA parameter values are used to compute the maximum likelihood values of drift and start point of each trial. Because the LBA model assumes a normal distribution, drift rates close to the mean of the distribution are more likely than values from the tails of the distribution. In addition, the uniform distribution sets limits on start points (0 and A). These considerations yield the following maximum likelihood estimates for a single-trial drift rate (d̂i) and a single-trial start point (âi), for a trial with response time ti:
 |
 |
where b, A, v, and t0 are the parameters of the LBA model. Parameter recovery studies show that these estimates recover substantial variance in the data-generating parameter values for a large range of parameter values (Fig. 2).
Figure 2.

Single-trial values in synthetic data generated with the LBA model correlate with the STLBA single-trial parameter estimates for a large range of reasonable values (Donkin et al., 2011). The ratio of the two parameters that define the level of response caution in the LBA model (b/A) are presented on the x-axis. This reflects that in the absence of a scaling parameter, b and A can take different values to obtain a particular model fit, but the ratio b/A remains constant. The colors code for the ratio between drift rate v and drift variance s. Analogously to the response caution parameters b and A, the ratio v/s remains constant for a particular model fit. Noticeable is that the success of the STLBA model depends on where one is in the parameter space. In particular, for small values of A relative to b, the STLBA model is not able to estimate single-trial drift rates. Similarly, for large values of v relative to s, the model fails to captures start point variability. In the limit of b/A → 0 (or similarly in the limit of v/s → 0), however, this does not pose a problem, since under those conditions all variability in the data is due to drift rate fluctuations (start point fluctuations). Overlaid crosses represent correlation coefficients under LBA parameter values estimated for the participants in the experiment. Gray, Speed condition; black, accuracy condition.
The single-trial extension to the LBA model enables investigation of the temporal dynamics of response caution. The model attributes variance in the response times to either strategic adjustments in response caution (b − âi) or fluctuations in processing speed (d̂i). Here, we focus our analysis on strategic adjustments in response caution; the single-trial drift rates can be used to study fluctuations in processing speed (T. Ho, S.D. Brown, L. van Maanen, B.U. Forstmann, E.-J. Wagenmakers, and J.T. Serences, unpublished observations). To indicate which areas in the brain code for response caution, we correlate single-trial estimates of response caution with single-trial HR in specific brain areas that are identified using independent component analysis (ICA) (Eichele et al., 2008; Danielmeier et al., 2011).
We fit the LBA model to the data of the speed and accuracy condition for each participant separately. Following Forstmann et al. (2008, 2010), the only parameter that was free to differ between conditions was the response threshold, b, and all other parameters were fit to the joint data set of speed and accuracy trials. We fit the data using maximum likelihood estimation. Start points for SIMPLEX searches (Nelder and Mead, 1965) were generated using automatic heuristics. The predicted RT distributions and response probabilities from the model, using the maximum likelihood parameters, closely resembled the data, for all participants. The parameter estimates were then used in the maximum likelihood computation of the single-trial parameter estimates. To measure how well the STLBA model was able to recover single-trial parameter values for these particular combinations of LBA parameters, we generated data from the model, using the parameter values that were estimated for each participant separately. The overlaid crosses in Figure 2 demonstrate that the STLBA model recovers response caution particularly well for the participants: the overall proportion of correlations that are stronger than 0.5 is 0.74 (for drift rate correlations, 0.61; for start point correlations, 0.85). This shows that, under the LBA assumptions and for the parameter values estimated from our data, the single-trial estimates correlate with the true parameters underlying the behavior, in particular for the start point estimates with which we are concerned in this paper.
ICA.
We first decomposed the data using the group spatial ICA rationale proposed by Calhoun et al. (2001), which was implemented in GIFT (http://icatb.sourceforge.net), running in Matlab (www.mathworks.com). For each individual separately, the preprocessed fMRI data were prewhitened and reduced via temporal principal component analysis (PCA) to 60 components. Then, group-level aggregate data were generated by concatenating and reducing individual principal components in a second PCA step. Infomax ICA (Bell and Sejnowski, 1995) was performed in this set with a model order of 60 components (Kiviniemi et al., 2009). To estimate robust components we used ICASSO (Himberg et al., 2004), i.e., the decomposition was performed 100 times with random initial conditions, and identified centroids with a canonical correlation-based clustering. All components that we interpret in this data set have a robustness index of higher than 0.9. Individual independent component (IC) maps and time courses were back-reconstructed by multiplying the corresponding data with the respective portions of the estimated demixing matrix. The group average maps were inspected to identify and discard those ICs primarily associated with artifacts representing signals from large vessels, ventricles, motion, and susceptibility (three ICs). From the remaining ICs, only those that had a cluster extent of at least 27 contiguous voxels and had significant random effects t statistics of their maps were considered further (thresholded at t(19) >5; uncorrected p = 4 · 10−5). This uncorrected t threshold equaled or exceeded the threshold estimated for a false discovery rate (FDR) corrected value of p < 0.05 in any of the maps (since FDR varies somewhat across maps as a function of the distribution of the p values). Overall, this yielded 30 ICs that were considered in the main analyses. In the time courses of these ICs, we focused on the frequency range relevant for event-related hemodynamic responses and filtered the individual time courses with a 64 s Butterworth high-pass filter.
Single-trial estimate of the hemodynamic response.
To obtain single-trial estimates of the HR amplitudes, we used the method reported by Danielmeier et al. (2011) and Eichele et al. (2008). For each participant and component separately, the empirical event-related HRs were deconvolved by forming the convolution matrix of all trial onsets with a length of 20 s and multiplying the Moore–Penrose pseudoinverse of this matrix with the filtered and normalized IC time course. Estimation of single-trial amplitudes was performed in all ICs where consistent event-related activations, i.e., significant positive peaks in the hemodynamic response, were present in the time range of 3–12 s. In this set, single-trial amplitudes were recovered by fitting a design matrix containing separate predictors for each trial onset convolved with the estimated HR onto the IC time course, estimating the scaling coefficients (β) by using multiple linear regression.
Inference.
We computed correlations between single-trial start point estimates obtained with the STLBA model and the amplitudes of single-trial HR for each participant. Only those ICs for which the distribution of correlation coefficients over participants differed from zero were considered further (one-sample t test, adjusted p < 0.05). Corrections for multiple comparisons were made by estimating the proportion of false positives among the rejected null hypotheses at a cutoff level of 0.1 (Van der Laan et al., 2005).
Results
We performed a random-dot motion experiment with an SAT manipulation (for similar manipulations, see Forstmann et al., 2008, 2010). Participants were cued before each trial whether to respond fast (“speed stress”) or accurately (“accuracy stress”). If participants adjust their level of response caution in response to the specific task instruction (i.e., the cue), then mixing speed-stress and accuracy-stress trials should maximize the number of response caution updates.
We applied the STLBA model to the behavioral data of every participant individually to obtain single-trial start points. Because the threshold parameter b was fixed over trials, this provides an index of response caution, with high start point values indicating low response caution (close to threshold) and vice versa. For the fMRI data, we used ICA (see Materials and Methods) to obtain single-trial estimates of the amplitude of the HR for every component and participant. This analysis yielded 30 spatially separated ICs. To study which ICs code for response caution fluctuations that are captured by the single-trial start point estimates, we computed correlations between single-trial start point estimates and single-trial HR for each IC and each participant separately. Correlation indicates a systematic relationship between the start points obtained from the model and the HR in a particular area, suggesting that that area is involved in response caution adjustments. We first consider the trials under speed stress and accuracy stress separately, particularly to study which areas are involved in response caution under speed stress. Previous research on the SAT (Forstmann et al. 2008, 2010; Ivanoff et al., 2008; van Veen et al., 2008) indicates that the frontostriatal network plays a role in response caution adjustments. Cue-induced changes in metabolic activity in pre-SMA have been hypothesized to induce changes in striatum (Bogacz et al., 2010). Therefore, we expect to find ICs in the frontomedian wall as well as in striatum to encode start point fluctuations under speed stress. Next, we focus on those trials on which participants were instructed to change their response mode from speed to accurate or vice versa (change trials). We hypothesize that a change in response mode requires an update of response caution. Frank et al. (2007) speculated that the anterior cingulate cortex (ACC) is involved in signaling the need for a response caution update, and we therefore expect to find correlations between single-trial start points and HR in ACC for the change trials, but not for the trials in which there is no cue-induced need to update the level of response caution (no change trials).
Table 1 presents MNI coordinates and approximate regions for the ICs for which the correlation coefficients significantly differed from zero (t test, adjusted p < 0.05 after correcting for multiple comparisons; see Materials and Methods).
Table 1.
MNI coordinates, maximum t value, and volume of activated areas of independent components showing significant correlations of trial-to-trial fluctuations in single-trial start point
| IC | Region | Conditiona | Volume (mm3) | Max t valueb | x | y | z |
|---|---|---|---|---|---|---|---|
| IC1 | MFG orb | Speed/change | 5814 | 8.61 | 30 | 60 | −4 |
| IC2 | pre-SMA/dACC | Speed/no change | 3252 | 10.99 | −2 | 20 | 30 |
| IC3 | Putamen | Speed/speed and change | 313 | 7.07 | 30 | −12 | 0 |
| 63 | 7.07 | −16 | −2 | −14 | |||
| 79 | 5.72 | −14 | 4 | 10 | |||
| IC4 | ACC | Accuracy/change | 3306 | 7.00 | 2 | 16 | 32 |
| 463 | 6.81 | −32 | 22 | −8 | |||
| 162 | 5.09 | 0 | −16 | 36 | |||
| 240 | 5.08 | −26 | 48 | 26 | |||
| IC5 | SOG | Accuracy | 3499 | 6.26 | 18 | −72 | 44 |
| 3247 | 5.69 | −22 | −72 | 28 | |||
| IC6 | PCun, Ang | No change | 1232 | 7.95 | 0 | −60 | 18 |
| 166 | 7.43 | 30 | −38 | −12 | |||
| 983 | 7.27 | −42 | −80 | 32 | |||
| 1114 | 7.19 | 42 | −62 | 24 | |||
| 180 | 6.45 | −22 | 14 | 52 |
Ang, Angular gyrus; MFG orb, middle frontal gyrus pars orbitalis; PCun, precuneus; SOG, superior occipital gyrus.
aAccuracy, Significant correlation with only accuracy trials included; speed, significant correlation with only speed trials included; change, significant correlation with only trials included in which response mode changed; no change, significant correlation with only trials included in which response mode did not change.
bNote that all ICs have a false discovery rate-corrected p value (p < 0.05) with a cluster extent threshold of at least 27 contiguous voxels.
Speed-stressed and accuracy-stressed trials
In line with the SAT manipulation, we first considered all speed-stressed trials and accuracy-stressed trials separately. In line with previous research (Forstmann et al. 2008, 2010; Ivanoff et al., 2008; van Veen et al., 2008), the speed-stressed trials showed positive correlations between start point estimates and HR for three components (labeled IC1, IC2, and IC3; Fig. 3). These components can be identified as the middle frontal gyrus pars orbitalis (IC1) and a component in the pre-SMA and dorsal anterior cingulate cortex (dACC) that we will refer to as pre-SMA/dACC (IC2). IC3 comprises the putamen. The pre-SMA and putamen have been identified previously to be involved in response caution.
Figure 3.
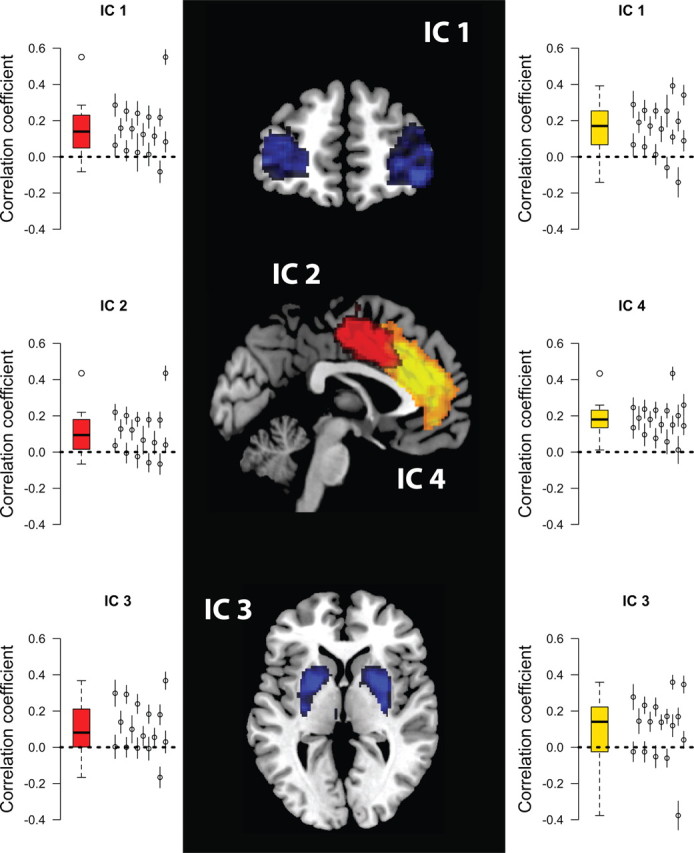
Significant correlations between single-trial start point estimates and HR amplitude. Left, Tukey box plot of correlation coefficients for the speed-stressed trials. The whiskers extend to 1.5× the interquartile range. On the right-hand side of each panel, individual participants are represented as additional data points, and 95% confidence intervals around each individual correlation coefficient were obtained through bootstrapping. Middle, ICs in which start points and HR amplitude correlate significantly. Right, Tukey box plot of correlation coefficients for the change trials. Red, Speed trials; yellow, change trials; blue, both speed and change trials.
For the accuracy-stressed trials, another area in anterior cingulate cortex (IC4) exhibited a positive correlation between single-trial start points and HR. We we will refer to this area as ACC proper. The correlation between IC4 activation and HR is driven by posterror trials. We found the correlation for trials following an error (t = 3.6, adjusted p < 0.05), but not on the remaining trials. Because ICA ensures independence of the components, IC2 and IC4 comprise different areas, although they are located close together. Also we found a component in superior occipital gyrus in which single-trial start point estimates correlated positively with single-trial HR (IC5).
Change and no-change trials
Of particular interest are those trials in which the cue changes from speed to accuracy or from accuracy to speed. Single-trial start points for the change trials correlated positively with HR in IC1 and IC4 (Fig. 3). Based on the hypothesis that we should observe frontostriatal network activity, we additionally examined IC3 and found that the correlation was not significant (p = 0.18). However, there was a significant positive correlation when including only the speed change trials (that is, all trials in which the previous trial was accuracy stressed and the current trial was speed stressed, p = 0.036). This suggests that change-related effects are asymmetric; changes from speed stress to accuracy stress might be different than vice versa, which would be supportive of a view in which accuracy-stressed settings are the default state (Forstmann et al., 2008; Fleming et al., 2010).
In addition, in two ICs HR and start point correlated positively for those trials in which there was no change in the response regime. These were the pre-SMA/dACC component (IC2) and a component that covers the part of precuneus that is connected to angular gyrus (IC6).
These results again suggest involvement of the frontostriatal network with response caution adjustments, but with a different role for the ICs in the frontomedian wall (IC2 and IC4) compared to the previous analysis.
Comparison to response time as a proxy for response caution
The trial-to-trial parameter estimates from the STLBA model are calculated by simple transformations of the observed RT. However, the particulars of the transformation are dictated by the constraint provided by the LBA model, which takes into account the RT distribution and error proportion. Thus, although the single-trial estimates are based on more information than the single-trial RT, one might wonder whether the transformation is necessary at all; that is, perhaps raw RT might serve as a simpler proxy for fluctuations in response caution, with high response caution indicated by slow RT and vice versa. Indeed previous studies have made this assumption (Gold et al., 2008; Summerfield and Koechlin, 2010). Therefore, as a control on the STLBA method, we also computed correlations between raw RT and HR. If the transformation of RT used in the STLBA model really does disentangle the effects of start points and drift rates in the accumulation process, then the correlations with these variables should be more specific than raw RT correlations.
For the change trials, 15 different ICs showed a significant negative correlation between HR and RT, compared with just three ICs when the model parameters were used (Table 2). In addition, we found 22 significant negative correlations for the no-change trials, compared with just two ICs when the model parameters were used. While there is overlap between the ICs in which the HR correlates with start point and response time, this analysis clearly illustrates the lack of specificity inherent in using raw RT as a proxy for response caution. Similar observations can be made for the other analyses. Overall, 26 of 30 ICs show significant correlations between HR and RT in one or more of the subsets of the data that we tested, whereas only six ICs were significant for the model-based correlations with start point.
Table 2.
MNI coordinates, maximum t value, and volume of activated areas of independent components showing significant correlations of trial-by-trial fluctuations in response time
| IC | Region | Conditiona | Volume (mm3) | Max t valueb | x | y | z |
|---|---|---|---|---|---|---|---|
| IC1 | MFG orb | Speed/change/no change | 5814 | 8.61 | 30 | 60 | −4 |
| IC2 | pre-SMA/dACC | Speed/change/no change | 3252 | 10.99 | −2 | 20 | 30 |
| IC3 | Putamen | Change/no change | 313 | 7.07 | 30 | −12 | 0 |
| 63 | 7.07 | −16 | −2 | −14 | |||
| 79 | 5.72 | −14 | 4 | 10 | |||
| IC4 | ACC | Change/no change | 3306 | 7.00 | 2 | 16 | 32 |
| 463 | 6.81 | −32 | 22 | −8 | |||
| 162 | 5.09 | 0 | −16 | 36 | |||
| 240 | 5.08 | −26 | 48 | 26 | |||
| IC5 | SOG | Change/no change | 3499 | 6.26 | 18 | −72 | 44 |
| 3247 | 5.69 | −22 | −72 | 28 | |||
| IC6 | PCun, Ang | Speed/change/no change | 1232 | 7.95 | 0 | −60 | 18 |
| 166 | 7.43 | 30 | −38 | −12 | |||
| 983 | 7.27 | −42 | −80 | 32 | |||
| 1114 | 7.19 | 42 | −62 | 24 | |||
| 180 | 6.45 | −22 | 14 | 52 | |||
| IC7 | Thalamus | Change/no change | 2032 | 7.46 | 4 | −16 | 20 |
| IC8 | IFG, MTG | No change | 5840 | 8.74 | −34 | 24 | −18 |
| 576 | 6.92 | −2 | 12 | 68 | |||
| 391 | 6.53 | 52 | 24 | −10 | |||
| 196 | 5.82 | 62 | −30 | −6 | |||
| IC9 | PCun, MFC | Change/no change | 1324 | 9.34 | 0 | −60 | 28 |
| 4288 | 9.01 | 0 | 54 | −18 | |||
| 262 | 6.99 | −66 | −16 | −16 | |||
| 436 | 6.10 | 52 | −64 | 26 | |||
| 214 | 6.09 | 66 | −6 | −18 | |||
| IC10 | Lingual IOC | Speed | 3243 | 17.32 | 22 | −100 | −10 |
| 2165 | 16.01 | −24 | −94 | −20 | |||
| 78 | 6.76 | 26 | −28 | −6 | |||
| 115 | 6.33 | 20 | −54 | 2 | |||
| IC11 | MFC orb | Change/no change | 5283 | 11.89 | 8 | 52 | −2 |
| IC12 | Caudate | Change/no change | 3471 | 17.79 | 2 | −2 | 14 |
| 141 | 7.89 | 0 | 32 | 2 | |||
| IC13 | Motor (left) | Change | 5929 | 15.37 | −50 | −24 | 58 |
| 2180 | 10.73 | 56 | −20 | 50 | |||
| 725 | 9.26 | −2 | −14 | 52 | |||
| 630 | 8.87 | 20 | −52 | −22 | |||
| 150 | 5.92 | 0 | −56 | 12 | |||
| IC14 | Paracentral | Change | 5962 | 8.99 | −4 | −32 | 78 |
| IC14 | Paracentral | Change | 161 | 7.04 | −4 | −48 | −14 |
| IC15 | Cerebellum | Change/no change | 1770 | 6.81 | 24 | −40 | −18 |
| 1687 | 6.68 | −26 | −36 | −16 | |||
| IC16 | PCun | No change | 6992 | 18.46 | 0 | −62 | 62 |
| 393 | 8.02 | 28 | 4 | 64 | |||
| 196 | 5.82 | −22 | −6 | 62 | |||
| 131 | 5.74 | 32 | 34 | 44 | |||
| IC17 | IFG tri | No change | 2839 | 9.13 | −56 | 20 | 24 |
| 2181 | 7.41 | 56 | 22 | 24 | |||
| 389 | 6.07 | 40 | −62 | 50 | |||
| 418 | 5.54 | 62 | −10 | −18 | |||
| IC18 | SMA | No change | 9049 | 9.12 | 10 | 12 | 56 |
| 204 | 6.15 | 4 | −44 | 14 | |||
| IC19 | Postcentral | Change | 2543 | 13.16 | −40 | −16 | 46 |
| 2726 | 11.67 | 68 | −2 | 14 | |||
| 108 | 7.64 | −16 | −70 | −22 | |||
| IC20 | Thalamus, nucleus ruber | No change | 2413 | 10.06 | 14 | −22 | −2 |
| 111 | 7.46 | 38 | 4 | −8 | |||
| 51 | 6.23 | −48 | −26 | 4 | |||
| IC21 | Ang, MTG | Change/no change | 3417 | 7.67 | 58 | −36 | −12 |
| 333 | 6.78 | 2 | −56 | 38 | |||
| 613 | 6.65 | 56 | 30 | 2 | |||
| 100 | 6.04 | −62 | −48 | 34 | |||
| 143 | 5.75 | 44 | 14 | 42 | |||
| IC22 | PCC | No change | 185 | 7.02 | 0 | −20 | 32 |
| IC23 | Cerebellum | No change | 4831 | 24.40 | 2 | −80 | −16 |
| IC24 | IPL (right) | No change | 6637 | 20.88 | 42 | −46 | 48 |
| 4117 | 16.61 | 50 | 40 | 24 | |||
| 794 | 13.97 | 6 | 24 | 44 | |||
| 1801 | 12.10 | −44 | −48 | 48 | |||
| 387 | 8.69 | 8 | −42 | 38 | |||
| 854 | 7.89 | 64 | −40 | −12 | |||
| IC25 | PCun | No change | 4211 | 21.37 | 2 | −36 | 46 |
| 589 | 9.21 | −28 | 34 | 48 | |||
| 202 | 8.42 | −52 | −14 | −12 | |||
| 452 | 8.39 | −40 | −16 | 44 | |||
| 1147 | 7.40 | 34 | 34 | 50 | |||
| IC26 | PCun | No change | 114 | 6.60 | 10 | 46 | −6 |
| 134 | 6.46 | −60 | −38 | 46 | |||
| 123 | 6.45 | 40 | −16 | 36 |
Ang, Angular gyrus; IFG tri, inferior frontal gyrus pars triangularis; IOC, inferior occipital cortex; IPL, inferior parietal lobule; MFC, middle frontal cortex; MFG orb, middle frontal gyrus pars orbitalis; MTG, medial temporal gyrus; PCun, precuneus, SOG, superior occipital gyrus.
aAccuracy, Significant correlation with only accuracy trials included; speed, significant correlation with only speed trials included; change, significant correlation with only trials included in which response mode changed; no change, significant correlation with only trials included in which response mode did not change.
bNote that all ICs have a false discovery rate-corrected p value (p < 0.05) with a cluster extent threshold of at least 27 contiguous voxels.
Discussion
Here we examined the neural mechanisms that mediate trial-to-trial fluctuations in response caution. To achieve this, we combined a novel extension of the LBA model that quantifies moment-to-moment variations in behavior with trial-to-trial HR measurements. Correlations between single-trial response caution parameters and single-trial HR estimates revealed a set of ICs that are involved in dynamically adjusting response caution. In particular, our study shows that pre-SMA/dACC (IC2) and ACC proper (IC4) have different functional roles. Pre-SMA/dACC is involved in actively maintaining a lower level of response caution when speed is at a premium, whereas ACC proper is involved in switching from one response caution regime to another in either direction. ACC proper seems also to be involved in response caution setting during accuracy-stressed trials.
These results can be explained by a combination of the striatal theory and the subthalamic nucleus (STN) theory of response caution adjustments (Bogacz et al., 2010). The striatal theory suggests that, with speed emphasis, the striatum receives excitatory input from cortical (nonintegrator) neurons, increasing striatal activity and thus decreasing the inhibitory control of the basal ganglia over the brain. This process facilitates faster but possibly premature responses (Forstmann et al., 2008; van Veen et al., 2008). Forstmann et al. (2008) speculated that the input to the striatum controlling the SAT could be provided by pre-SMA. Here we provide supporting evidence for this hypothesis by showing that pre-SMA/dACC and striatal activity both positively correlate with trial-to-trial fluctuations in response caution. However, we found this correlation only for trials under a speed-stressed regime. One explanation for this might be that pre-SMA/dACC is involved in actively maintaining a response caution level that reflects the speed stress. Thus, an accuracy-stressed trial might be considered the default, and pre-SMA/dACC only engages when the default level of response caution does not suffice (Fleming et al., 2010). However, based on the present data, this hypothesis cannot be fully substantiated.
The STN theory proposes that with accuracy emphasis, the STN receives additional excitatory input from frontal areas (Frank et al., 2007). Increased STN activity produces slower and more accurate choices because of the excitatory connections to the basal ganglia's output nuclei. Frank et al. (2007) speculated that the input to STN controlling SAT could be provided by ACC proper. When response conflict increases, the anterior cingulate cortex promotes, via the STN, a more careful mode of responding. The STN theory of corticobasal ganglia functioning is also supported by our data. We observed that activity in ACC proper correlated with response caution adjustments, but only when changing from a liberal response regime to a conservative regime or vice versa. These trials could be considered more demanding, because the task instruction on those trials differs from the instruction on the previous trial (Johnston et al., 2007; Hyafil et al., 2009). Independent of a change in instruction, ACC activation also correlated with response caution fluctuations in accuracy-stressed trials. Similar to fluctuations due to the change in task instruction, these fluctuations may represent changes in response caution, perhaps due to events before the current trial, such as incorrect responses on a previous trial (Botvinick et al., 2001; Ridderinkhof et al., 2004). This interpretation is supported by the finding that ACC activation correlates with response caution on trials following an error, but not on the remaining trials.
Based on the STN theory, one might expect a negative correlation between STN activity and single-trial start points, reflecting the inhibitory role of the STN on the basal ganglia output nuclei; in that case, a high start point correlates with less inhibition from the STN, and a low start point correlates with strong inhibition from STN. In the current experiment, the spatial resolution of the 3T EPI images combined with standard preprocessing and decomposition of the data with ICA does not allow for a robust extraction of components as small as the STN (Kiviniemi et al., 2009). Therefore, we used probability maps of the left and right STN (B.U. Forstmann, M.C. Keuken, S. Jahfari, P.-L. Bazin, J. Neumann, A. Schäfer, A. Anwander, and R. Turner, unpublished observations) to estimate single-trial HR in the STN within a general linear model framework. This analysis could not confirm our hypothesis: the small size of these STN masks makes it difficult to find correlations with model parameters due to a lack of power, particularly since the model parameters that are correlated with activation are the maximum likelihood values, which may introduce some additional uncertainty. We speculate that for these reasons, the hypothesis that STN activation and the STLBA start point are negatively correlated cannot be confirmed with the current data set.
The LBA model is a useful descriptive model of choice behavior. Many other models exist that are equally good descriptive models, but are in general less analytically tractable (Vickers, 1970; Ratcliff, 1978; Usher and McClelland, 2001; Ratcliff and McKoon, 2008; Van Maanen et al., 2009; Van Maanen and Van Rijn, 2010). These models could perhaps also have been used to obtain single-trial parameter estimates. For example, a popular model of choice response time is the drift diffusion model (Ratcliff, 1978; Ratcliff and McKoon, 2008). Contrary to the LBA model, this model assumes that evidence accumulation is stochastic, rather than ballistic as in the LBA model. The stochastic nature of the diffusion model (and others) makes it less suitable for single-trial parameter estimation, because it allows for additional noise within a trial. Nevertheless it is theoretically possible to quantify trial-to-trial fluctuations as changes in the mean drift rate and changes in start point, because, similar to the LBA model, these parameters are drawn from a normal and a uniform distribution, respectively (Ratcliff and McKoon, 2008).
Because the STLBA model infers values for two parameters from a single datum (RT), we trade precise but potentially uninformative estimates (that is, RT) for less precise but more informative parameter estimates. As Table 2 shows, many of the areas in which HR and RT correlate are not associated with decision making at all. For example, RT correlates with activation in left primary motor cortex; however, this correlation is typically interpreted as related to response execution rather than decision making. Also, RT correlates with activation in posterior cingulate cortex (PCC) activation; however, PCC has been implicated previously in drift rate, rather than response caution (Heekeren et al., 2004). These examples illustrate that a correlation between HR and RT is too unspecific to serve as a proxy for fluctuations in response caution. In contrast, the use of a decision-making model allows us to quantify latent cognitive processes on a trial-to-trial basis, thereby disentangling the different processes involved in making a decision.
The transformation from raw RT to the parameter estimates in the STLBA model is constrained by the parameter distributions defined in the LBA architecture, making it possible to compute which pairs of latent variables are more likely than others. This crucially entails that the parameter pairs we estimated are dependent, whereas we assume independence in the data-generating model. Although the single-trial parameter estimates are dependent, we demonstrated that these estimates correlate with the true values in simulation studies (Fig. 2). This finding makes the STLBA model a useful tool for computational neuroscientists. On the one hand, it specifies a process on the single-trial level that has been modeled on the RT distribution level. On the other hand, it provides a new continuous measure of response caution and trial-to-trial information processing that can be used to query the functional consequences of fluctuations in event-related responses.
By studying the trial-to-trial fluctuations in activation in regions involved in strategic adjustments of control, we found that ACC proper and pre-SMA/dACC code for different forms of strategic control. Although the mechanisms that perform adjustment of response caution through basal ganglia are the same, the trigger for these may differ depending on the environmental demands. ACC proper may trigger increased control due to an increased attentional demand, for example, due to a change in response regime; pre-SMA/dACC activates to obtain less control and faster responding.
Footnotes
This work was supported by VENI (B.U.F.) and VIDI (E.-J.W.) grants from the Netherlands Organization for Scientific Research, Australian Research Council Discovery Project DP0878858 (S.D.B.), and the Norwegian Research Council (T.E.). Roger Ratcliff is acknowledged for fruitful discussions on the topic, and Max Keuken is acknowledged for technical assistance.
References
- Bell A, Sejnowski T. An information-maximization approach to blind separation and blind deconvolution. Neural Comput. 1995;7:1129–1159. doi: 10.1162/neco.1995.7.6.1129. [DOI] [PubMed] [Google Scholar]
- Bogacz R, Wagenmakers EJ, Forstmann BU, Nieuwenhuis S. The neural basis of the speed-accuracy tradeoff. Trends Neurosci. 2010;33:10–16. doi: 10.1016/j.tins.2009.09.002. [DOI] [PubMed] [Google Scholar]
- Botvinick MM, Braver TS, Barch DM, Carter CS, Cohen JD. Conflict monitoring and cognitive control. Psychol Rev. 2001;108:624–652. doi: 10.1037/0033-295x.108.3.624. [DOI] [PubMed] [Google Scholar]
- Britten KH, Shadlen MN, Newsome WT, Movshon JA. The analysis of visual motion: a comparison of neuronal and psychophysical performance. J Neurosci. 1992;12:4745–4765. doi: 10.1523/JNEUROSCI.12-12-04745.1992. [DOI] [PMC free article] [PubMed] [Google Scholar]
- Brown S, Heathcote A. The simplest complete model of choice response time: Linear ballistic accumulation. Cogn Psychol. 2008;57:153–178. doi: 10.1016/j.cogpsych.2007.12.002. [DOI] [PubMed] [Google Scholar]
- Calhoun VD, Adali T, Pearlson G, Pekar J. A method for making group inferences from functional MRI data using independent component analysis. Hum Brain Mapp. 2001;14:140–151. doi: 10.1002/hbm.1048. [DOI] [PMC free article] [PubMed] [Google Scholar]
- Danielmeier C, Eichele T, Forstmann BU, Tittgemeyer M, Ullsperger M. Posterior medial frontal cortex activity predicts post-error adaptations in task-related visual and motor areas. J Neurosci. 2011;31:1780–1789. doi: 10.1523/JNEUROSCI.4299-10.2011. [DOI] [PMC free article] [PubMed] [Google Scholar]
- Donkin C, Averell L, Brown S, Heathcote A. Getting more from accuracy and response time data: Methods for fitting the linear ballistic accumulator. Behav Res Methods. 2009;41:1095–1110. doi: 10.3758/BRM.41.4.1095. [DOI] [PubMed] [Google Scholar]
- Donkin C, Brown S, Heathcote A, Wagenmakers E. Diffusion versus linear ballistic accumulation: Different models but the same conclusions about psychological processes? Psychon Bull Rev. 2011;18:61–69. doi: 10.3758/s13423-010-0022-4. [DOI] [PMC free article] [PubMed] [Google Scholar]
- Eichele T, Debener S, Calhoun VD, Specht K, Engel AK, Hughdahl K, von Cramon DY, Ullsperger M. Prediction of human errors by maladaptive changes in event-related brain networks. Proc Natl Acad Sci U S A. 2008;105:6173–6178. doi: 10.1073/pnas.0708965105. [DOI] [PMC free article] [PubMed] [Google Scholar]
- Fleming SM, Thomas CL, Dolan RJ. Overcoming status quo bias in the human brain. Proc Natl Acad Sci U S A. 2010;107:6005–6009. doi: 10.1073/pnas.0910380107. [DOI] [PMC free article] [PubMed] [Google Scholar]
- Forstmann BU, Dutilh G, Brown S, Neumann J, von Cramon DY, Ridderinkhof KR, Wagenmakers EJ. Striatum and pre-SMA facilitate decision-making under time pressure. Proc Natl Acad Sci U S A. 2008;105:17538–17542. doi: 10.1073/pnas.0805903105. [DOI] [PMC free article] [PubMed] [Google Scholar]
- Forstmann BU, Anwander A, Schäfer A, Neumann J, Brown SD, Wagenmakers EJ, Bogacz R, Turner R. Cortico-striatal connections predict control over speed and accuracy in perceptual decision making. Proc Natl Acad Sci U S A. 2010;107:15916–15920. doi: 10.1073/pnas.1004932107. [DOI] [PMC free article] [PubMed] [Google Scholar]
- Frank MJ, Scheres A, Sherman SJ. Understanding decision-making deficits in neurological conditions: Insights from models of natural action selection. Philos Trans R Soc Lond B Biol Sci. 2007;362:1641–1654. doi: 10.1098/rstb.2007.2058. [DOI] [PMC free article] [PubMed] [Google Scholar]
- Gold JI, Law CT, Connolly P, Bennur S. The relative influences of priors and sensory evidence on an oculomotor decision variable during perceptual learning. J Neurophysiol. 2008;100:2653–2668. doi: 10.1152/jn.90629.2008. [DOI] [PMC free article] [PubMed] [Google Scholar]
- Heekeren HR, Marrett S, Bandettini PA, Ungerleider LG. A general mechanism for perceptual decision-making in the human brain. Nature. 2004;431:859–862. doi: 10.1038/nature02966. [DOI] [PubMed] [Google Scholar]
- Himberg J, Hyvarinen A, Esposito F. Validating the independent components of neuroimaging time series via clustering and visualization. Neuroimage. 2004;22:1214–1222. doi: 10.1016/j.neuroimage.2004.03.027. [DOI] [PubMed] [Google Scholar]
- Hyafil A, Summerfield C, Koechlin E. Two mechanisms for task switching in the prefrontal cortex. J Neurosci. 2009;29:5135–5142. doi: 10.1523/JNEUROSCI.2828-08.2009. [DOI] [PMC free article] [PubMed] [Google Scholar]
- Ivanoff J, Branning P, Marois R. fMRI evidence for a dual process account of the speed-accuracy tradeoff in decision-making. PLoS One. 2008;3:e2635. doi: 10.1371/journal.pone.0002635. [DOI] [PMC free article] [PubMed] [Google Scholar]
- Johnston K, Levin HM, Koval MJ, Everling S. Top-down control-signal dynamics in anterior cingulate and prefrontal cortex neurons following task switching. Neuron. 2007;53:453–462. doi: 10.1016/j.neuron.2006.12.023. [DOI] [PubMed] [Google Scholar]
- Kiviniemi V, Starck T, Remes J, Long X, Nikkinen H, Haapea M, Veijola J, Moilanen I, Isohanni M, Zang YF, Tervonen O. Functional segmentation of the brain cortex using high model order group PICA. Hum Brain Mapp. 2009;30:3865–3886. doi: 10.1002/hbm.20813. [DOI] [PMC free article] [PubMed] [Google Scholar]
- Nelder J, Mead R. A simplex method for function minimization. Comput J. 1965;7:308–313. [Google Scholar]
- Oldfield RC. The assessment and analysis of handedness: the Edinburgh inventory. Neuropsychologia. 1971;9:97–113. doi: 10.1016/0028-3932(71)90067-4. [DOI] [PubMed] [Google Scholar]
- Palmer J, Huk AC, Shadlen MN. The effect of stimulus strength on the speed and accuracy of a perceptual decision. J Vis. 2005;5:376–404. doi: 10.1167/5.5.1. [DOI] [PubMed] [Google Scholar]
- Ratcliff R. A theory of memory retrieval. Psychol Rev. 1978;85:59–108. [Google Scholar]
- Ratcliff R, McKoon G. The diffusion decision model: theory and data for two-choice decision tasks. Neural Comput. 2008;20:873–922. doi: 10.1162/neco.2008.12-06-420. [DOI] [PMC free article] [PubMed] [Google Scholar]
- Ridderinkhof KR, Ullsperger M, Crone EA, Nieuwenhuis S. The role of the medial frontal cortex in cognitive control. Science. 2004;306:443–447. doi: 10.1126/science.1100301. [DOI] [PubMed] [Google Scholar]
- Summerfield C, Koechlin E. Economic value biases uncertain perceptual choices in the parietal and prefrontal cortices. Front Hum Neurosci. 2010;4:208. doi: 10.3389/fnhum.2010.00208. [DOI] [PMC free article] [PubMed] [Google Scholar]
- Usher M, McClelland JL. The time course of perceptual choice: the leaky, competing accumulator model. Psychol Rev. 2001;108:550–592. doi: 10.1037/0033-295x.108.3.550. [DOI] [PubMed] [Google Scholar]
- Van der Laan MJ, Birkner MD, Hubbard AE. Empirical Bayes and resampling based multiple testing procedure controlling tail probability of the proportion of false positives. Stat Appl Genet Mol Biol 4. 2005 doi: 10.2202/1544-6115.1143. Article 29. [DOI] [PubMed] [Google Scholar]
- Van Maanen L, Van Rijn H. The locus of the Gratton effect in picture-word interference. Top Cogn Sci. 2010;2:168–180. doi: 10.1111/j.1756-8765.2009.01069.x. [DOI] [PubMed] [Google Scholar]
- Van Maanen L, Van Rijn H, Borst JP. Stroop and picture-word interference are two sides of the same coin. Psychon Bull Rev. 2009;16:987–999. doi: 10.3758/PBR.16.6.987. [DOI] [PubMed] [Google Scholar]
- Van Veen V, Krug MK, Carter CS. The neural and computational basis of controlled speed-accuracy tradeoff during task performance. J Cogn Neurosci. 2008;20:1952–1965. doi: 10.1162/jocn.2008.20146. [DOI] [PubMed] [Google Scholar]
- Vickers D. Evidence for an accumulator model for psychophysical discrimination. Ergonomics. 1970;13:37–58. doi: 10.1080/00140137008931117. [DOI] [PubMed] [Google Scholar]
- Wickelgren W. Speed-accuracy tradeoff and information-processing dynamics. Acta Psychol. 1977;41:67–85. [Google Scholar]