

Abstract
Coincident pairing of presynaptic and postsynaptic activity selectively strengthens synaptic connections, a key mechanism underlying cortical plasticity. Using paired associative transcranial magnetic stimulation (TMS), we demonstrate selective potentiation of physiological connectivity between two human brain regions, ventral premotor cortex (PMv) and primary motor cortex (M1) after repeated paired-pulse TMS of PMv and M1. The effect was anatomically specific: paired stimulation of the presupplementary motor area and M1 did not induce changes in PMv–M1 pathway connectivity. The effect was dependent on stimulation order: repeated stimulation of PMv before M1 led to strengthening of the PMv–M1 pathway, while repeated stimulation of M1 before PMv diminished the strength of the PMv–M1 pathway. The expression of the change in the pathway depended on the cognitive state of the subject at the time of testing: when the subject was tested at rest, paired PMv–M1 stimulation led to an increased inhibitory influence of PMv over M1, but when the subject was tested while engaged in a visuomotor task, PMv–M1 stimulation led to an increased facilitatory influence of PMv over M1. Plasticity evolved rapidly, lasted for at least 1 h, and began to reverse 3 h after intervention.
Introduction
Synchronous and asynchronous activity in interconnected neurons leads, respectively, to strengthening and weakening of their shared synapses (Hebb, 1949; Markram et al., 1997), and such changes may underlie behavioral plasticity. Evidence for Hebbian-like plasticity has been found at various scales of neural organization, from single synapses in slice preparations to in vivo expression in mammals (Bliss and Lomo, 1973; Jackson et al., 2006). The aim of the current investigation was to test whether paired associative stimulation (PAS) of connected cortical regions might induce similar changes in human subjects.
Typically in PAS experiments, electrical stimulation of the median nerve is repeatedly paired with M1 transcranial magnetic stimulation (TMS), inducing changes in M1 corticospinal excitability (Stefan et al., 2000). Dependent on latencies of paired stimuli, coincident or noncoincident excitation of median nerve input and corticospinal output induce potentiation- or depression-like effects, respectively (Wolters et al., 2003). PAS effects are usually measured as excitability changes at the second stimulation site (M1), however, it has been difficult to determine whether such protocols induce changes in the strength of specific anatomical pathways as might be expected (Wolters et al., 2005). To examine whether changes in pathway strength have occurred, one possibility is to assess the impact of the first pulse on the effects induced by the second pulse, both before and after repeated pairings of stimulation. This simple test, however, has only been conducted in one study to date and with equivocal results (Rizzo et al., 2009). Other features of such plasticity, such as dependence on cognitive state, are unknown.
Neurophysiological interactions between premotor regions, such as the PMv or presupplementary motor area (pre-SMA), and M1 can be characterized with paired-pulse TMS (ppTMS) (Davare et al., 2008; Mars et al., 2009). For example, at rest, an initial “conditioning” TMS pulse to PMv, followed by a subsequent “test” TMS pulse to M1, inhibits M1 corticospinal output relative to that elicited by M1 TMS alone (Davare et al., 2008). This effect depends on cognitive state. When the PMv–M1 pathway is endogenously activated during grasping, an excitatory effect is observed (Davare et al., 2009; Buch et al., 2010). Projections from premotor cortex to M1 are glutamatergic, but while some synapse directly onto corticospinal neurons, many synapse onto GABAergic interneurons within M1 (Tokuno and Nambu, 2000). The state-dependent effects of identical PMv TMS pulses probably reflect changes in input patterns to PMv that bias its output toward one of these two projection types (Duque and Ivry, 2009; Duque et al., 2010). The pathway from PMv and adjacent inferior frontal cortex to M1 is important when unwanted actions are inhibited (Swann et al., 2009; Buch et al., 2010; Neubert et al., 2010).
We therefore examined effects of repeated pairings of PMv and M1 TMS on PMv–M1 physiological connectivity. In addition, we examined whether changes in PMv–M1 connectivity were pathway specific by testing whether they were also induced by repeated pairings of pre-SMA and M1 TMS, whether such changes depended on cognitive state, whether such changes depended on stimulation order during pairing, and for how long these effects persisted.
Materials and Methods
Volunteers.
Thirty-five healthy, right-handed adults (mean age, 26.09 years; SD, 6.26 years; 18 females) participated. All volunteers underwent high-resolution, T1-weighted structural MRI scans. Written informed consent was obtained before participation (National Research Ethics Service, Oxford RECC, No. 05-Q1606-96). Some subjects participated in more than one experimental session for Experiments 1–5, but in these cases sessions were, on average, 123 ± 130 d (mean ± SD) apart. The numbers of naive and nonnaive (participated in more than one experiment) volunteers were similar across experiments. Additional statistical analyses are presented to demonstrate that effects do not depend on subjects participating in more than one experiment.
Summary of experimental design.
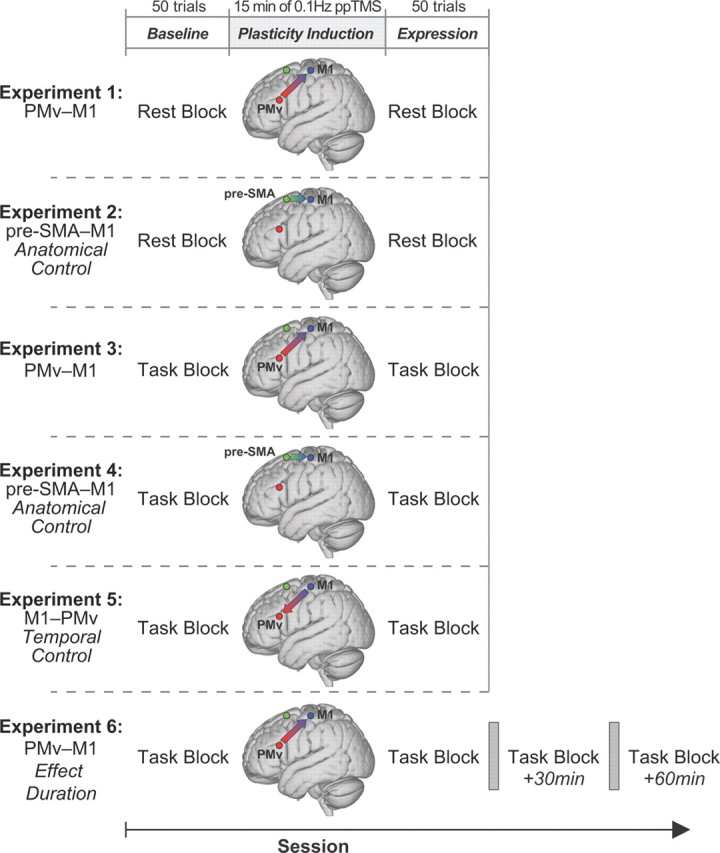
All experiments started with a baseline block, followed by a plasticity induction period, and a plasticity expression block (Fig. 1). Baseline and plasticity expression blocks consisted of 50 trials with volunteers either at rest (Experiments 1 and 2) or performing a reaching and grasping task (Experiments 3, 4, 5, and 6). In all cases, the effect of PMv stimulation on the effect of M1 stimulation was determined by comparing motor-evoked potentials (MEPs) recorded from right first dorsal interosseus (FDI) muscle, when either single-pulse TMS (spTMS; 25 trials) was applied to left M1 or ppTMS was delivered over both left PMv and M1 [25 trials; 8 ms interpulse interval (IPI)]. Both spTMS and ppTMS trials were administered in pseudorandom order within the same block of trials. Precise interpulse timing is critical if both PMv and M1 pulses are to produce coincident influences on corticospinal activity; both resting-state and task-state interactions emerge at 6–8 ms intervals (Davare et al., 2008, 2009; Buch et al., 2010; Neubert et al., 2010). The plasticity induction period that intervened between baseline and plasticity expression periods consisted of 15 min of ppTMS applied at 0.1 Hz (90 total stimulus pairings) with the same 8 ms IPI.
Figure 1.

Experimental design and setup for all experiments. The plasticity induction period was preceded (baseline) and followed (plasticity expression) by rest or task blocks. In Experiment 6 (bottom row), multiple plasticity expression task blocks were used to assess the duration of any plasticity effects.
Experiment 1 (11 volunteers; 6 females) tested for changes in PMv–M1 interactions at rest, following the PMv–M1 plasticity induction period. Experiment 2 (9 volunteers; 5 females) tested whether PMv–M1 potentiation also occurred after the same plasticity induction protocol was applied to a different pathway, between the pre-SMA and M1. In Experiment 3 (12 volunteers; 5 females), we exploited the fact that PMv exerts an excitatory influence over M1 during grasping and assessed whether plasticity induction would be expressed differently. Indeed, a different effect of plasticity induction was observed in Experiment 3, so Experiment 4 (10 volunteers; 6 females) was conducted as an analogous control experiment to Experiment 2 (induction protocol applied to the pre-SMA–M1 pathway) and tested whether the effects observed during the expression task block in Experiment 3 were also specific to application of the induction protocol to the PMv–M1 pathway. In Experiment 5 (nine volunteers; two females), the order of stimulation during plasticity induction was reversed (each PMv pulse was preceded by an M1 pulse) to see if this diminished, rather than augmented, PMv–M1 connection strength during grasping. Experiment 6 (11 volunteers; 6 females) investigated how long the increase in excitability lasted after plasticity induction. The effect duration was measured in additional expression blocks identical to the first expression block at 30 and 60 min following the conclusion of the plasticity induction period [as in the study by Rizzo et al. (2009)]. Furthermore, as the effects appeared to still persist after 60 min, data from a fourth expression block commencing 3 h after the end of the plasticity period were acquired in five subjects.
Task blocks.
Volunteers sat in a darkened room and made right-hand reaching and grasping movements (Fig. 2a,b) cued by illumination of one of two concentrically arranged cylinders (15 and 65 mm diameter) located 30 cm in front of the starting hand position (Buch et al., 2010). Each trial was initiated by pressing a touch bar with the right hand. Intertrial intervals (ITIs) were therefore variable (mean ± SD, 6.90 ± 0.79 s) but did not differ significantly across phases of each experiment. Following a variable delay of 5–7 s (uniformly distributed), one cylinder was illuminated. Volunteers responded by grasping it with their thumb and index finger before lifting it from its pedestal. Reaction and movement times were recorded. All trials were accompanied by either spTMS or ppTMS, with the pulse applied to M1 always occurring 100 ms after cylinder illumination, which was before movement onset (Fig. 2b).
Figure 2.
a, Stimuli and coil arrangement. b, Event timeline for task trials. c, Individual subject TMS locations (filled circles) and 95% group confidence ellipses for TMS locations for all experiments in standardized MNI space.
Rest blocks.
For rest blocks, volunteers attended to cylinder illumination while simply maintaining a static hand posture. To control for the overall temporal nature of the TMS, ITIs for rest blocks were defined as the sum of the ITIs used in task blocks plus a reaction and movement time sample drawn from probability density functions [based on the study by Buch et al. (2010)] defined for these variables. ITIs were therefore variable (mean ± SD, 6.23 ± 0.07 s) but did not differ significantly across phases of each experiment.
Plasticity induction period.
During plasticity induction, volunteers attended to cylinder illumination, while maintaining a relaxed hand position. Again, TMS pulses were applied to M1 100 ms after cylinder illumination.
TMS and electromyography recordings.
TMS was applied using two Magstim 200 stimulators, each connected to 50 mm figure-eight coils. The M1 “hot spot” was the scalp location where stimulation evoked the largest right FDI MEP amplitude. This scalp location was projected onto high-resolution, T1-weighted MRIs of each volunteer's brain using frameless stereotactic neuronavigation (Brainsight; Rogue Research). The mean Montreal Neurological Institute (MNI) location for left M1 “hot spot” (−38.21, −23.16, 62.33; Fig. 2c) was similar to that reported previously (Davare et al., 2009; Buch et al., 2010).
Since the TMS intensity used for PMv produced no measurable MEP, PMv coil location was determined anatomically. A marker was placed on each individual's MRI and adjusted with respect to individual sulcal landmarks to a location immediately anterior to the inferior precentral sulcus. The mean MNI location (−53.84, 20.51, 23.33; Fig. 2c) lies within the region defined previously as human PMv (Mayka et al., 2006), but is close to area 44, which resembles PMv in cytoarchitecture and connections (Croxson et al., 2005; Petrides et al., 2005). Plasticity induction in Experiments 2 and 4 involved pre-SMA TMS, with the coil located 4 cm anterior to the scalp vertex (Mars et al., 2009; Neubert et al., 2010) at the mean MNI location (−1.60, 7.17, 68.14; Fig. 2c).
Resting motor threshold (RMT) of left M1 was determined (mean ± SD, 38.47 ± 6.96% stimulator output) as described previously (Rossini et al., 1994). As in previous ppTMS studies, PMv and pre-SMA TMS was proportional to RMT (110%) (Mars et al., 2009; Neubert et al., 2010). M1 stimulation intensity during experiments was set to elicit single-pulse MEPs of ∼1 mV (45.5 ± 7.56% stimulator output).
TMS coils were positioned tangential to the skull, with the M1 coil angled at ∼45° (handle pointing posteriorly), and the PMv coil at ∼0° relative to the midline (handle pointing anteriorly) (Fig. 2c). The pre-SMA coil was angled at ∼30°, the handle pointing anteriorly toward the right hemisphere. Coils were fixed in place by adjustable metal arms and monitored throughout the experiment. It is has been shown that PMv–M1 ppTMS effects cannot be attributed just to a direct effect of the PMv coil inducing activity in the M1 coil. We and others have tried applying two pulses of TMS to the M1 coil itself at the same interpulse latency while subjects are at rest, performing a similar behavioral task, and while they are performing other behavioral tasks (Davare et al., 2008, Buch et al., 2010, Catmur et al., 2011). In all cases, an initial conditioning pulse that is applied directly to M1 does not exert the same task-dependent effects over M1 corticospinal excitability as does a PMv pulse. Similarly pre-SMA–M1 ppTMS effects cannot be attributed to the indirect activation of the M1 coil by the conditioning pulse because they are not mimicked by direct application of both conditioning and test pulses via the same TMS coil placed over M1 (Mars et al., 2009).
Right FDI electromyography (EMG) activity was recorded with bipolar surface Ag-AgCl electrode montages. Responses were bandpass filtered between 10 and 1000 Hz, with additional 50 Hz notch filtering, sampled at 5000 Hz, and recorded using a CED 1902 amplifier, a CED micro1401 Mk.II A/D converter, and PC running Spike2 (Cambridge Electronic Design). Analysis focused on peak-to-peak amplitudes of MEPs. Trials in which test pulses failed to elicit reliable MEPs were discarded (<5% of trials in all subjects). As no effect of cylinder size has been observed, MEPs from small and large cylinder trials were combined.
Statistical analysis.
The MEP amplitude distribution was positively skewed, so MEPs were log-transformed and analyzed with repeated-measures ANOVAs. Greenhouse–Geisser corrections were used to correct for nonsphericity.
Results
Experiment 1: PMv–M1 plasticity induction and PMv–M1 interactions measured at rest
For both baseline and expression blocks, ppTMS inhibited MEP amplitudes relative to spTMS trials: ANOVA with within-subject factors BLOCK (baseline and expression) and PULSE (single or paired pulse) revealed a main effect of PULSE (F(1,10) = 5.83, p < 0.05; Fig. 3). After plasticity induction, this inhibitory effect was potentiated (BLOCK by PULSE interaction, F(1,10) = 5.56, p < 0.05), while overall corticospinal excitability remained unchanged (absence of main effect of BLOCK, F(1,10) = 0.65, p = 0.44; Fig. 3). To further clarify that this interaction is driven by relative changes in ppTMS trial excitability, for each individual, the mean ppTMS trial MEP amplitude was reexpressed as a ratio of spTMS amplitude. Direct contrast of ppTMS trial ratios across baseline and expression blocks confirmed that the inhibitory effect was significantly lower after plasticity induction (t(10) = 2.34, p < 0.05). Hence, repeated coincident activation of PMv and M1 did not induce a simple change in M1 corticospinal excitability, but instead selectively enhanced physiological connectivity between PMv and M1. The potentiated ppTMS effect occurred without significant change in MEP variability (F(1,10) = 0.13, p = 0.73), suggesting it was not a consequence of changed coil placement.
Figure 3.

Experiment 1. The figure shows group mean MEP amplitudes measured with either spTMS over M1 or ppTMS over PMv and then, with an 8 ms IPI, M1 before (baseline) and after (expression) plasticity induction in the PMv-to-M1 pathway. Measurements were taken while the subjects were at rest and refrained from movement. *p < 0.05 (significant effects). Error bars represent 1 SEM.
It is possible that plasticity is being induced during the baseline and expression blocks themselves. Such a possibility may be thought unlikely though, because plasticity induction is expected to be maximal when there is a prolonged period of coinciding presynaptic and postsynaptic activity on the PMv–M1 synapse, and this is not the case in baseline and expression blocks, where 50% of M1 pulses are presented in the absence of any preceding PMv pulse. Nevertheless we checked for this possibility by rerunning our analyses after dividing the baseline and expression periods into early and late periods. There was no significant main effect of the block PERIOD (early versus late) or interaction of the block PERIOD with the factors of preplasticity and postplasticity induction BLOCK and PULSE for either baseline or expression blocks (F(1,10) < 2.522; p > 0.143).
Experiment 2: pre-SMA–M1 plasticity induction and PMv–M1 interactions measured at rest
The absence of change in M1 corticospinal excitability in Experiment 1 suggested plasticity was specific to a particular pathway into M1. To further assess anatomical specificity, Experiment 2 tested whether PMv–M1 potentiation also occurred after the same plasticity induction protocol was applied to a different pathway, between the pre-SMA and M1. Significant pre-SMA–M1 ppTMS interactions are also observed at 8 ms interstimulus intervals (Mars et al., 2009; Neubert et al., 2010), thus allowing application of the same repetitive ppTMS protocol. No changes in PMv–M1 interactions followed pre-SMA–M1 plasticity induction (absence of main effect of BLOCK, F(1,8) = 0.18, p = 0.92; BLOCK by PULSE interaction, F(1,8) = 1.27, p = 0.29; Fig. 4).
Figure 4.

Experiment 2. The figure shows group mean MEP amplitudes measured with either spTMS over M1 or ppTMS over PMv and then, with an 8 ms IPI, M1 before (baseline) and after (expression) plasticity induction in the pre-SMA-to-M1 pathway. Measurements were taken while the subjects were at rest and refrained from movement. Error bars represent 1 SEM.
Comparison of Experiments 1 and 2
As a final check, we also compared the results of Experiments 1 and 2 directly in an ANOVA with the between-subject factor EXPERIMENT and within-subject factors BLOCK and PULSE. A significant three-way EXPERIMENT by BLOCK by PULSE interaction (F(1,18) = 5.93, p < 0.05) confirmed potentiation of PMv–M1 physiological connectivity occurred selectively in Experiment 1. A main effect of PULSE (F(1,18) = 8.38, p = 0.010) in the absence of a two-way interaction of PULSE by EXPERIMENT (F(1,18) = 0.54, p = 0.47) suggested that PMv exerted an inhibitory influence over subsequent M1 pulses. Such an effect has been described previously (Davare et al., 2008, 2009). While statistically significant, the effect reported here appears smaller in magnitude, but it should be noted that the coil sizes and procedures followed were not identical to those followed by Davare et al. (2008, 2009).
Three subjects participated in both Experiments 1 and 2. Differences in results between the two experiments cannot be attributed to participation in more than one experiment for three reasons. First, the mean interval between participation was 75 ± 21 d (mean ± SD), and there is no evidence for TMS-induced metaplastic effects over such a period. Second, the significant three-way interaction remained after exclusion of all subjects participating in more than one experiment (F(1,15) = 7.13, p < 0.05), and equally after inclusion of all data plus a covariate indicating order of experimental participation (ANCOVA; F(1,17) = 5.60, p = 0.03).
Background EMG activity could potentially confound MEP measurements if it differed systematically between experimental sessions at the time TMS pulses were applied. A three-way ANOVA (EXPERIMENT by BLOCK by PULSE) was conducted on medians of the root mean square of the background EMG in 100 ms windows ending 10 ms before the first TMS pulse (first pulse artifact not included). There were no significant main or interaction effects related to these factors (F(1,18) ≤ 1.90, p ≥ 0.19). The selective potentiation of PMv–M1 pathway strength at rest after plasticity induction cannot be explained by differences in background EMG activity. In brief, plasticity induction was specific to a particular input pathway.
Experiment 3: PMv–M1 plasticity induction and PMv–M1 interactions measured during movement
Up to this point, plasticity expression has been described as potentiation of PMv's resting-state inhibitory influence over M1. As stated earlier, however, it has been documented in more than one laboratory with replicable results that PMv–M1 interactions change when observed in the context of behavior (Davare et al., 2008, 2009; Buch et al., 2010; Neubert et al., 2010). In Experiments 3, 4, 5, and 6, we exploited the fact that PMv exerts an excitatory influence over M1 100 ms after the illumination of a target for grasping and assessed whether plasticity induction would be expressed differently in a task context. If the PMv–M1 plasticity induction protocol induces pathway strengthening, then two dramatic changes to the expression of that effect should be observed in the task context. First, plasticity induction should potentiate the excitatory influence of PMv over M1. Second, this potentiation effect might also be apparent on spTMS trials, because MEPs induced by spTMS during grasping also reflect PMv's endogenous functional influence over M1 (Grol et al., 2007).
In Experiment 3, PMv–M1 plasticity induction significantly increased corticospinal excitability on both spTMS and ppTMS trials (main effect of BLOCK, F(1,11) = 9.02, p < 0.05; Fig. 5a). In this task context, the PMv–M1 pathway is intrinsically activated by grasping and has been strengthened by the prior plasticity induction protocol. Hence, the impact of even spTMS to M1 is twice what it was before plasticity induction. Under such circumstances, it is not surprising that there was a ceiling effect, such that addition of another TMS pulse to PMv, on ppTMS trials, could not excite the PMv–M1 pathway in the expression block any more than it was already excited intrinsically by the act of grasping and by M1 TMS.
Figure 5.

Experiment 3. The figure shows group mean MEP amplitudes measured with either spTMS over M1 or ppTMS over PMv and then, with an 8 ms IPI, M1 before (baseline) and after (expression) plasticity induction in the PMv-to-M1 pathway. Measurements were taken while the subject initiated reaching and grasping movements. a, b, Data from all trials (a) and after matching of spTMS MEP sizes in the baseline and expression periods (b) are shown. c, spTMS trials are plotted against temporal nearest-neighbor ppTMS trials for baseline and expression blocks for all subjects. *p < 0.05 (significant effects). Error bars represent 1 SEM.
If it is correct that the PMv–M1 plasticity induction protocol really does induce a change in pathway connectivity between the two regions, analogous to that seen in Experiment 1 but that is confounded by a ceiling effect related to task performance, then two predictions can be made. The first prediction is tested in the next experiment (Experiment 4; see below). The second prediction is that it should be possible to identify a subset of the data where the ceiling effect is minimized. Most subjects exhibit endogenous fluctuation in the sizes of their MEPs during testing sessions. If one assumes that these time-related fluctuations are common to both spTMS and ppTMS trials, then it should be possible to identify portions of the testing session when ceiling effects are least likely.
We split the spTMS trials in the postplasticity induction phase into two halves on the basis of their size and selected those trials where the MEPs were smaller in size and close to 1 mV. We then identified the ppTMS trials that occurred in closest proximity to the selected spTMS trials and compared their sizes. A similar procedure was performed on the preinduction data. The idea was that comparison between portions of the data where overall excitability (as assessed spTMS trials) was similar would unmask any BLOCK by PULSE interaction that was present. The end result for each subject was a subset of 40 trials, with 10 each from the baseline block spTMS condition, baseline block ppTMS condition, induction block spTMS condition, and induction block ppTMS condition. The medians of these condition subsets were determined for each participant and subjected to a group analysis. For Experiment 3, a BLOCK by PULSE repeated-measures ANOVA revealed the significant main effects for BLOCK (F(1,11) = 5.46, p < 0.05) and PULSE (F(1,11) = 14.36, p < 0.01), as observed in the complete data set, as well as a significant BLOCK by PULSE interaction (F(1,11) = 5.02, p < 0.05; data not shown). This supports the contention that pathway-specific plasticity induction effects occurred in Experiment 3 as in Experiment 1, but were initially obscured by excitability changes related to performance of the reaching and grasping task.
Since this initial procedure still did not quite equate spTMS sizes in the preinduction and postinduction blocks, and because a skeptic might argue that the larger ppTMS effect in the postinduction phase was a consequence of the different spTMS MEP distributions, we performed another similar procedure to equate spTMS MEP sizes in the preinduction and postinduction periods. An iterative algorithm was used to alternately remove spTMS trial samples from each of the preinduction and postinduction distributions, so that the scalar difference between the MEP amplitude medians was minimized. Next, as previously, the temporal nearest-neighbor ppTMS trials with respect to the selected spTMS trials were found. The analysis was based on medians of 10 trials from each of the four conditions as in the previous analysis. First, to test whether the selection algorithm worked as intended, baseline and induction period single-pulse MEPs were compared using a paired t test. There was no significant difference between the distributions (t(11) = −1.32, p = 0.21). A BLOCK by PULSE repeated-measures ANOVA, however, again revealed the significant main effect for BLOCK (F(1,11) = 5.04, p < 0.05) observed in the complete data set, as well as a significant BLOCK by PULSE interaction (F(1,11) = 6.71, p < 0.05; Fig. 5b). A scatter plot of spTMS MEP amplitude versus the temporal nearest-neighbor MEP amplitude suggests that the data agree with our assumption, that endogenous fluctuations of MEP amplitudes are related to time, and affect both spTMS and ppTMS trials in a similar manner (Fig. 5c). The scatter plot also makes clear the part of the distribution from which the data are drawn when the subsampling procedure for creating Figure 5b is used. In summary, the results support the contention that pathway-specific plasticity induction effects occurred in Experiment 3.
Experiment 4: pre-SMA–M1 plasticity induction and PMv–M1 interactions measured during movement
If it is true that the facilitated MEPs in Experiment 3 reflected a pathway-specific change in connectivity in a pathway used to perform the reaching and grasping task, then the effects should be anatomically specific and should only occur following plasticity induction in the PMv–M1 pathway. To further assess anatomical specificity of the task-related PMv–M1 plasticity induction effects observed in Experiment 3, we tested whether an overall increase in corticospinal excitability would occur following plasticity induction in the pre-SMA–M1 pathway. The same induction protocol as in Experiment 2 was applied. While data from Experiment 4 were again consistent with the expected task-related facilitatory effect of PMv on M1 (main effect of PULSE, F(1,9) = 8.54, p < 0.05), no changes in excitability or PMv–M1 interactions during performance of the task were observed in the expression block following pre-SMA–M1 plasticity induction (absence of main effect of BLOCK, F(1,9) = 0.46, p = 0.51; BLOCK by PULSE interaction, F(1,9) = 1.15, p = 0.31; Fig. 6a).
Figure 6.

Experiment 4. The figure shows group mean MEP amplitudes measured with either spTMS over M1 or ppTMS over PMv and then, with an 8 ms IPI, M1 before (baseline) and after (expression) plasticity induction in the pre-SMA-to-M1 pathway. Measurements were taken while the subject initiated reaching and grasping movements. a, b, Data from all trials (a) and after matching of spTMS MEP sizes in the baseline and expression periods (b) are shown. c, spTMS trials are plotted against temporal nearest-neighbor ppTMS trials for baseline and expression blocks for all subjects. Error bars represent 1 SEM.
Additional supplementary analyses of the sort used in Experiment 3 were performed on the data from Experiment 4. The use of similar analyses in both Experiments 3 and 4 tests whether any biases in results are introduced via the process of data subset selection. When the postinduction spTMS trials were selected to be the lowest MEP trials or selected to be those that matched the preinduction spTMS trials (there was no significant difference between spTMS effects before and after induction: t(9) = 0.10, p = 0.93), a BLOCK by PULSE repeated-measures ANOVA revealed similar outcomes to the full data set, as only a main effect for PULSE (F(1,9) = 5.08, p < 0.05; Fig. 6b) was observed. Again, changes in MEP excitability appear to be time related (Fig. 6c).
Experiment 5: M1–PMv plasticity induction and PMv–M1 interactions measured during movement
Hebbian plasticity depends on temporally precise activation of presynaptic and postsynaptic neurons. If potentiation of excitation in Experiment 3 is due to Hebbian-like strengthening of a specific corticocortical pathway, then changing the timing of PMv and M1 TMS to an interval that is less likely to lead to the same sequence of presynaptic and postsynaptic events may lead to a diminished, or potentially even a reversed, change in the influence of PMv over M1 during the induction period. In Experiment 5, we chose to reverse the order of stimulation of PMv and M1, but to keep the same relative latency of stimulation (M1 TMS followed 8 ms later by PMv TMS). Such a sequence of stimulation is unlikely to induce the same sequence of presynaptic and postsynaptic activity as in Experiment 3. In fact, it allows us to conduct an additional control test of whether PMv TMS exerted its effect during the plasticity induction period not via PMv, but instead via an effect on the nearby M1 coil. If, in Experiment 3, PMv had been exerting its influence over M1, during the 15 min plasticity induction period, via a direct effect on the M1 coil, then it would not have mattered whether PMv or M1 were stimulated first during each paired pulse delivery in Experiment 5. In this scenario, the M1 coil would have been activated twice in both Experiment 3 (indirectly via the PMv coil first and then directly) and in Experiment 5 (directly first, and then indirectly via the PMv coil second), and the same pattern of plasticity induction would have been expected in both cases. This, however, was not what was observed. In Experiment 5, reversed-order M1–PMv plasticity induction caused a significant decrease in corticospinal excitability (main effect of BLOCK, F(1,8) = 10.54, p < 0.05; Fig. 7a).
Figure 7.

Experiment 5. The figure shows group mean MEP amplitudes measured with either spTMS over M1 or ppTMS over PMv and then, with an 8 ms IPI, M1 before (baseline) and after (expression) plasticity induction in the M1-to-PMv pathway [the opposite order of stimulation of PMv and M1 was used in Experiments 3 (Fig. 5) and 5 (here)]. Measurements were taken while the subject initiated reaching and grasping movements. a, b, Data from all trials (a) and after matching of spTMS MEP sizes in the baseline and expression periods (b) are shown. c, spTMS trials are plotted against temporal nearest-neighbor ppTMS trials for baseline and expression blocks for all subjects. *p < 0.05 (significant effects). Error bars represent 1 SEM.
Additional supplementary analyses, analogous to those used in Experiment 3 and 4, were also performed on the data from Experiment 5. Again, analyses similar to those in Experiments 3, 4, and 5 first test whether any biases in results are introduced via this subset selection process and, second, make it possible to remove a potentially confounding floor effect. A floor effect might obscure differential effects of the plasticity induction procedure on ppTMS and spTMS trials in the postconditioning block. When the postinduction spTMS trials were selected to be the highest MEP trials or selected to be those that matched the preinduction spTMS trials (after the manipulation there was no difference between preinduction and postinduction spTMS effects: t(8) = 1.60, p = 0.15), a BLOCK by PULSE repeated-measures ANOVA revealed the significant main effect for BLOCK (F(1,8) = 6.75, p < 0.05) as observed in the complete data set, as well as a significant BLOCK by PULSE interaction (F(1,8) = 8.90, p < 0.05; Fig. 7b). As in Experiments 3 and 4, the data supported the major assumption of this analysis, as changes in MEP excitability appear to be time related (Fig. 7c). The scatter plot also makes clear the part of the distribution from which the data are drawn when the subsampling procedure for creating Figure 7b is used. In summary, the relative change in spTMS and ppTMS effects after the plasticity induction period again suggests a pathway-specific change in connectivity.
Comparison of Experiments 3, 4, and 5
Finally, direct comparison of Experiments 3, 4, and 5 with a three-factor ANOVA confirmed that while the task-related ppTMS effect was consistent across experiments (significant main effect for PULSE, F(2,28) = 7.64, p < 0.01), the plasticity induction protocols had quite different impacts on changes in excitability with respect to BLOCK, as a significant EXPERIMENT by BLOCK (F(2,28) = 12.30, p < 0.001) interaction was observed.
The observed pattern of effects in Experiments 3 and 5 cannot be explained by the fact that four subjects participated in both experiments. First, the mean interval between participation was 159 ± 172 d (mean ± SD), and there is no evidence of TMS-induced metaplastic effects over such a period. Second, the significant EXPERIMENT by BLOCK interaction remained after exclusion of subjects who participated in more than one experiment (F(1,15) = 29.01, p < 0.001) and after inclusion of all subjects plus a covariate indicating order of experimental participation (F(1,18) = 39.92, p < 0.001). In summary, repeated pairing of PMv and M1 TMS led to a strengthening of the PMv–M1 pathway during grasping, whereas inverting PMv–M1 temporal coupling during plasticity induction depressed PMv–M1 interactions during grasping.
An analysis of background EMG activity in Experiments 3, 4 and 5 found no effect of BLOCK, PULSE, nor interaction of these factors with each other or EXPERIMENT (F(2,28) ≤ 2.01, p ≥ 0.15). Thus, the changes in excitability in the expression blocks observed during performance of the reaching and grasping task cannot be explained by differences in background EMG activity.
Further additional tests were performed to test whether the selection of subsets of data from each of Experiments 3, 4, and 5 for the supplementary analyses investigating ceiling and floor effects had been performed in similar ways. The average distance between spTMS and ppTMS trials selected for each pair of samples was 1.35 ± 0.60 trials (mean ± SD). A BLOCK by EXPERIMENT ANOVA revealed no significant main effects (F ≤ 1.00, p ≥ 0.38) or interaction effect (F = 1.06, p = 0.36) for nearest-neighbor distances. For the expression block, the data subset did not show a consistent tendency toward occurring predominately in the first or second half of the block, as mean location of the median subset trial was trial 24.92 ± 5.8 of the expression block (essentially the midpoint). This suggests that no consistent trend in changes to the post induction excitability occurred while the expression block task was being performed.
Experiment 6: duration of impact of induced plasticity
The duration of PMv–M1 plasticity expression was assessed by collecting identical expression block data on three occasions immediately (0 min) and 30 and 60 min after plasticity induction. Subjects performed the grasping task in all baseline and expression blocks as in Experiment 3. As in the first analysis of the data from Experiment 3, we found an increase in corticospinal activity after plasticity induction; there was a main effect of TIME (four levels: baseline and three expression blocks at 0, 30, and 60 min) in a repeated-measures ANOVA with factors TIME and PULSE (F(3,30) = 3.795; p = 0.028). It can be seen from Figure 8a that the effect of plasticity induction remained at a fairly constant level across the 60 min period in which expression block data were collected. An additional planned comparison revealed that corticospinal activity remained higher even at the time of the 60 min postinduction expression block compared to the baseline block (spTMS, t(10) = −2.657, p = 0.024; ppTMS, t(10) = −2.249, p = 0.048).
Figure 8.
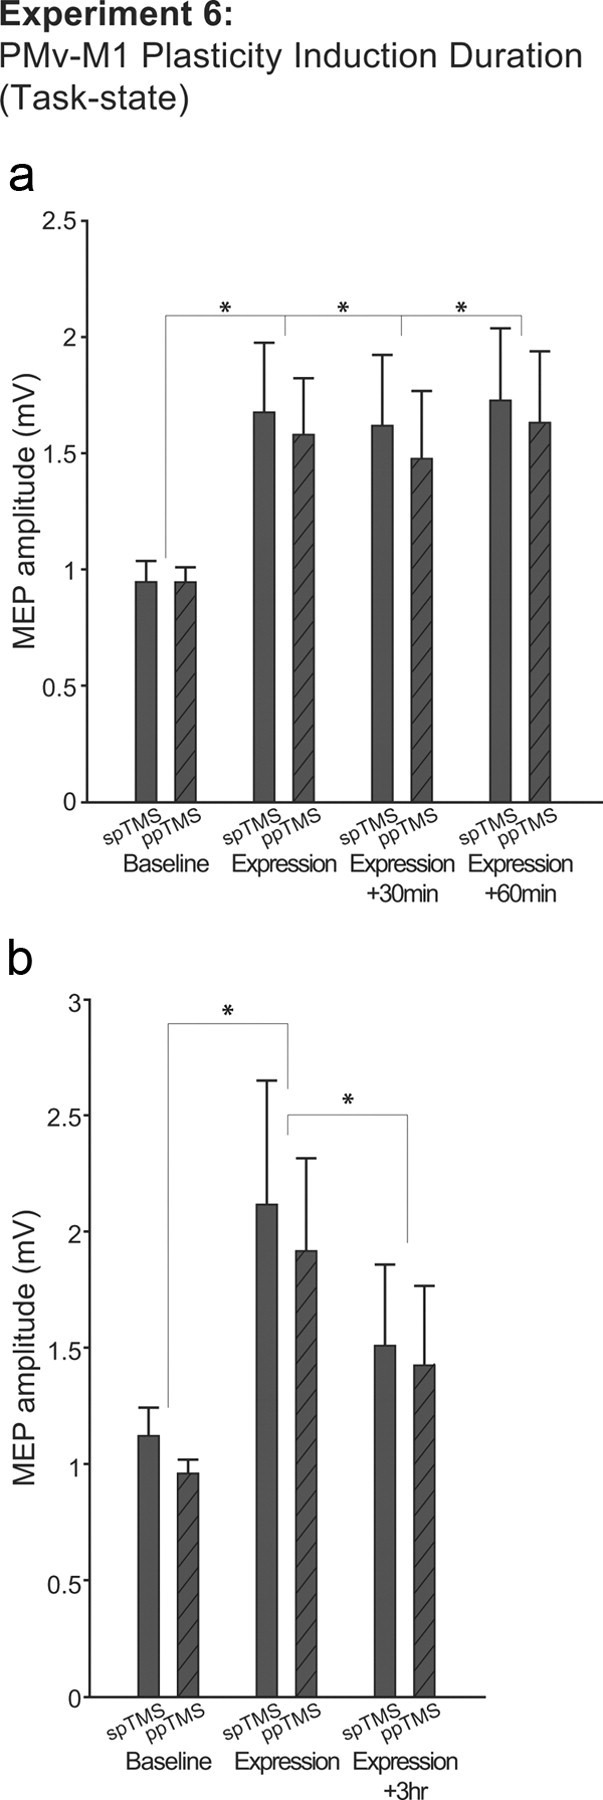
Experiment 6. a, Group mean MEP amplitudes measured with either spTMS over M1 or ppTMS over PMv and then, with an 8 ms IPI, M1 before (baseline block) and in three subsequent expression blocks collected 0, 30, and 60 min after plasticity induction in the PMv-to-M1 pathway. Measurements were taken while the subject initiated reaching and grasping movements. b, Similar data are shown for a subgroup of five participants tested in expression blocks conducted 0 and 3 h after plasticity induction. *p < 0.05 (significant effects). Error bars represent 1 SEM.
Because it soon became apparent that the impact of plasticity induction was protracted, we administered an additional postinduction expression block 180 min after plasticity induction in a subgroup of five subjects to see whether corticospinal excitability eventually began to reverse. First, we tested whether it was possible to detect an increase in corticospinal excitability between the baseline and the first expression block in this small subsample. Second, we tested whether there was evidence of a decrease in plasticity induction in the 180 min expression block compared to the 0 min expression block. We performed the test in this way because we reasoned that it was critical for a claim of reversal to be based on something other than a null effect. We focused on the 180 and 0 min expression blocks, reasoning that some degree of reversal of the effect of plasticity induction might occur a little earlier in some subjects than others (for example, at 60 min), and so the most sensitive test for reversal would entail a comparison of the 0 and 180 min expression blocks. Because of the clear directional nature of each hypothesis, and because each test was predicated on the earlier results reported for this experiment and for Experiment 6, we used one-tailed t tests when examining the results from this subsample of subjects. In summary, we found that PMv–M1 plasticity induction did increase corticospinal excitability during a grasping task in this subgroup of subjects (comparison of baseline and 0 min expression blocks, spTMS, t(4) = 2.077, p = 0.053; ppTMS, t(4) = 2.404, p = 0.037), and that this effect had significantly reversed 180 min later (comparison of 0 and 180 min expression blocks, spTMS, t(4) = 2.749, p = 0.025; ppTMS, t(4) = 2.484, p = 0.034).
Potential confounding effect of participant genders
There were slight differences in the gender ratios for participants in the various experiments. Because the differences were small, it is extremely unlikely that they caused differences in the results of the various experiments. Although there is one report of greater interhemispheric inhibition in females than in males (De Gennaro et al., 2004) there have been no reports of gender effects on intracortical (within hemisphere) interactions measured with paired-pulse TMS. Nevertheless we conducted two additional analyses to check for effects of gender. The results suggested there were neither gender differences in the effects of ppTMS as opposed to spTMS nor gender differences in plasticity induction effects.
The first analysis tested whether there were gender differences in the effect of ppTMS as opposed to spTMS. The difference between ppTMS and spTMS (ppTMS − spTMS) was computed for baseline block data from both TASK and REST conditions, and the effect of gender was tested in an independent samples t test. No significant effects were found either when the grasping task was being performed (16 female and 14 male participants were compared; t(28) = 0.099, p = 0.922) or when the subjects were tested at rest (9 females and 11 males; t(18) = 0.864, p = 0.399).
The second analysis tested whether plasticity induction had a different impact in females and males. Data from Experiment 3 and 6 (n = 19; 10 females, 9 males) were combined, and the amplitudes of spTMS MEPs as well as ppTMS MEPs were compared before and after plasticity induction as a function of gender. There was no significant difference in how females and males responded to plasticity induction, neither for spTMS (t(17) = −0.434, p = 0.670) nor ppTMS (t(17) = − 1.156, p = 0.264).
Discussion
Several TMS protocols induce changes in excitability in M1. Some approaches entail repetitive stimulation of M1 itself (Chen et al., 1997), while others involve stimulation of premotor regions projecting to M1 (Munchau et al., 2002). In addition, it is known that TMS-induced modulation of activity in one area, such as pre-SMA, can have a metaplastic effect on M1; it changes the ease with which plasticity is subsequently induced in M1 (Hamada et al., 2009). It is also known that changes in M1 corticospinal excitability are brought about by paired stimulation of an input into M1, such as the median nerve, and then of M1 itself (Stefan et al., 2000; Wolters et al., 2003).
What has been unclear, however, is whether noninvasive paired TMS protocols can induce plasticity in targeted neural pathways between two brain areas in the absence of induced changes in other pathways. The difference is not arcane. It is just such pathway-specific changes that occur in animal models of synaptic plasticity (Markram et al., 1997; Jackson et al., 2006). Second, it is just such pathway-specific changes that are likely to underlie the self-organization proposed to occur in monosynaptically connected networks in response to regularly occurring input (Sussillo and Abbott, 2009). A potential example of such a network is the one composed of premotor areas centered on the M1 hand representation (Dum and Strick, 2005). Experiments 1 and 3, in conjunction with control Experiments 2 and 4, demonstrated just such pathway-specific induction of plasticity between two cortical regions, PMv and M1. Experiment 6 demonstrated that the effects last for at least 1 h, but begin to reverse 3 h later.
The 8 ms interval between the PMv and M1 TMS pulses was chosen for investigation because this interpulse interval has been used successfully to probe functional connectivity between PMv and M1 with replicable results in more than one laboratory (Davare et al., 2008, 2009; Buch et al., 2010; Neubert et al., 2010). The effect of conditioning TMS pulses applied to PMv on M1 is anatomically specific and differs from the effects of TMS conditioning pulses applied over other adjacent regions, such as dorsal premotor cortex and pre-SMA, and even from the effects of additional conditioning TMS pulses applied directly to M1 itself (Mars et al., 2009; Buch et al., 2010; Neubert et al., 2010). Such a degree of spatial specificity accords with that seen in other types of TMS experiments (Walsh and Cowey, 2000; Walsh and Pascual-Leone, 2003).
PMv–M1 interaction effects are seen throughout a range of IPIs. Although there is evidence that effects at longer IPIs of 12 or 18 ms are mediated by basal ganglia regions including the subthalamic nucleus, relatively short latency IPI effects of 8 ms used in the present experiment are transmitted via more direct corticocortical routes (Buch et al., 2010; Neubert et al., 2010). This is consistent with the latency of the fastest route through the basal ganglia, the hyperdirect route via the subthalamic nucleus and globus pallidus, exceeding the 8 ms IPI (Nambu et al., 2000; Strafella et al., 2004).
Stimulation of the pre-SMA–M1 pathway was used as a control procedure in Experiments 2 and 4. It is an appropriate control for investigating PMv–M1 effects because interactions between pre-SMA and M1 occur at similar IPIs (Davare et al., 2008, 2009; Mars et al., 2009; Buch et al., 2010; Neubert et al., 2010). Pre-SMA–M1 interaction effects at short IPIs are, like short IPI PMv–M1 interaction effects, not mediated by the basal ganglia (Mars et al., 2009; Neubert et al., 2010). In some cognitive states, conditioning pulses applied over either pre-SMA or PMv facilitate M1 (Mars et al., 2009; Buch et al., 2010; Neubert et al., 2010), although there was little reason to expect the pre-SMA–M1 pathway to play a major role in the grasping task used in Experiments 3–6 or maintenance of a resting posture in Experiments 1 and 2.
It is well established that the impact of PMv stimulation on M1 stimulation depends on the cognitive state of the participant (Davare et al., 2008, 2009, 2010; Buch et al., 2010; Neubert et al., 2010). At rest, a PMv conditioning TMS pulse reveals the inhibitory influence of PMv on M1 as a decrease in MEP amplitude relative to an unpaired test pulse applied over M1. When performing a behavioral task, however, a conditioning pulse over PMv facilitates the effects of M1 stimulation when actions are being initiated. These effects, first reported by Davare et al. (2008), were replicated in Experiments 1 and 2 and Experiments 3–6, respectively. Analogous state dependency has been demonstrated in other ppTMS experiments focusing on other brain areas (Koch et al., 2006, 2008; O'Shea et al., 2007; Mars et al., 2009).
The differing impacts of the same PMv stimulation in different cognitive states are easily reconciled with the known anatomy and physiology of premotor connections to M1. Premotor projections to M1 are glutamatergic (Tokuno and Nambu, 2000). Although some projections synapse directly on M1 corticospinal neurons, the majority synapse upon GABAergic interneurons in more superficial layers of M1. If the task context results in patterns of input to PMv that biases its output toward projections to interneurons (for example, when subjects switch from initiating to refraining from movements) (Davare et al., 2008; Duque et al., 2010), then the effect of the PMv pulse will change from facilitating to inhibiting M1 corticospinal neurons.
The antagonistic effects of plasticity induction expressed in the rest-state (Experiments 1 and 2) versus task-state (Experiments 3–6) experiments can be explained in a simple and uniform manner as endogenous, state-related excitability changes in the excitatory premotor–M1 pathway. In both Experiments 1 and 3, paired stimulation of PMv followed 8 ms later by stimulation of M1 should potentiate the physiological impact of the excitatory premotor–M1 pathway. When subjects refrain from movement, as in Experiment 1, inhibitory interneurons within M1 are more active; hence, a potentiation of the excitatory premotor–M1 connection synapsing onto M1 inhibitory interneurons will result in a potentiation of suppression of corticospinal activity. When reaching and grasping movements are initiated, as in Experiment 3, inhibitory interneurons are less active (Duque and Ivry, 2009; Duque et al., 2010). A potentiation of the excitatory PMv–M1 pathway would, for this network state, result in a potentiation of facilitated corticospinal output. In Experiment 5, a reversed order of stimulation led to weakening of the excitatory premotor pathway. Thus, although the task-state PMv–M1 pathway facilitation was still observed, the facilitatory effect was diminished following plasticity induction. Similar effects on the PMv–M1 pathway were not seen when plasticity was induced in another pathway involving the pre-SMA, even though the end point of both pathways was M1 (Experiments 2 and 4). Rapid sequential activation of two brain areas, A and B, during plasticity induction can alter the strength of influence A has over B, but the effects are dependent on the order of stimulation during plasticity induction. They are not seen if the same plasticity induction protocol is applied over another pathway leading into area B, for example from area C, which has little functional relevance in the behavioral conditions examined.
One other experiment looked at similar issues. Rizzo et al. (2009) applied paired pulses to M1 areas in both hemispheres, so that the first conditioning pulse inhibited the impact of the second on corticospinal activity. Repeated paired stimulation did not increase this inhibitory effect further. Instead, after repetitive stimulation, the conditioning pulse impact was diminished. It might be expected that a plasticity induction protocol should have the opposite effect. Why effects emerged in this manner is uncertain. It may reflect induction of homeostatic changes that altered the potential for plasticity. Alternatively, the reciprocal nature of connections between both M1s may make M1–M1 PAS effects particularly complex; a stimulation order optimized for increasing the strength of a pathway from left to right M1 is also likely to be optimal for decreasing strength of the pathway from right to left M1. Either way, the current results are consistent with the suggestion of Rizzo et al. (2009) that a change in pathway strength can be induced by TMS.
It is becoming clear that plasticity can be induced in relatively specific ways, for example, by pairing TMS and endogenous brain activity (Thabit et al., 2010). The present study suggests PAS might be a useful tool for targeting specific corticocortical pathways, not just in healthy individuals, but where recovery of movement depends on establishing new or reestablishing old activity patterns across motor networks (Grefkes et al., 2010). The pathways from PMv and adjacent inferior frontal cortex to M1 and from the pre-SMA to M1 are known to exert complimentary roles in the inhibition of unwanted movements (Aron et al., 2007; Chen et al., 2009; Swann et al., 2009; Neubert et al., 2010), and there have been attempts to modulate the strength of at least one of these areas with transcranial direct current stimulation (Hsu et al., 2011). The present results suggest a way in which directional activity within specific pathways within this network might be modulated.
Footnotes
This work was supported by the Medical Research Council (V.M.J., M.F.S.R.), the NINDS intramural program (E.R.B.), the Henry F. Jackson Foundation Center for Neuroscience and Regenerative Medicine (E.R.B.), the Research Foundation Flanders (N.N.), and the Royal Society (J.O.).
The authors declare no competing financial interests.
References
- Aron AR, Behrens TE, Smith S, Frank MJ, Poldrack RA. Triangulating a cognitive control network using diffusion-weighted magnetic resonance imaging (MRI) and functional MRI. J Neurosci. 2007;27:3743–3752. doi: 10.1523/JNEUROSCI.0519-07.2007. [DOI] [PMC free article] [PubMed] [Google Scholar]
- Bliss TV, Lomo T. Long-lasting potentiation of synaptic transmission in the dentate area of the anaesthetized rabbit following stimulation of the perforant path. J Physiol. 1973;232:331–356. doi: 10.1113/jphysiol.1973.sp010273. [DOI] [PMC free article] [PubMed] [Google Scholar]
- Buch ER, Mars RB, Boorman ED, Rushworth MF. A network centered on ventral premotor cortex exerts both facilitatory and inhibitory control over primary motor cortex during action reprogramming. J Neurosci. 2010;30:1395–1401. doi: 10.1523/JNEUROSCI.4882-09.2010. [DOI] [PMC free article] [PubMed] [Google Scholar]
- Catmur C, Mars RB, Rushworth MF, Heyes C. Making mirrors: premotor cortex stimulation enhances mirror and counter-mirror motor facilitation. J Cogn Neurosci. 2011;23:2352–2362. doi: 10.1162/jocn.2010.21590. [DOI] [PubMed] [Google Scholar]
- Chen CY, Muggleton NG, Tzeng OJ, Hung DL, Juan CH. Control of prepotent responses by the superior medial frontal cortex. Neuroimage. 2009;44:537–545. doi: 10.1016/j.neuroimage.2008.09.005. [DOI] [PubMed] [Google Scholar]
- Chen R, Classen J, Gerloff C, Celnik P, Wassermann EM, Hallett M, Cohen LG. Depression of motor cortex excitability by low-frequency transcranial magnetic stimulation. Neurology. 1997;48:1398–1403. doi: 10.1212/wnl.48.5.1398. [DOI] [PubMed] [Google Scholar]
- Croxson PL, Johansen-Berg H, Behrens TE, Robson MD, Pinsk MA, Gross CG, Richter W, Richter MC, Kastner S, Rushworth MF. Quantitative investigation of connections of the prefrontal cortex in the human and macaque using probabilistic diffusion tractography. J Neurosci. 2005;25:8854–8866. doi: 10.1523/JNEUROSCI.1311-05.2005. [DOI] [PMC free article] [PubMed] [Google Scholar]
- Davare M, Lemon R, Olivier E. Selective modulation of interactions between ventral premotor cortex and primary motor cortex during precision grasping in humans. J Physiol. 2008;586:2735–2742. doi: 10.1113/jphysiol.2008.152603. [DOI] [PMC free article] [PubMed] [Google Scholar]
- Davare M, Montague K, Olivier E, Rothwell JC, Lemon RN. Ventral premotor to primary motor cortical interactions during object-driven grasp in humans. Cortex. 2009;45:1050–1057. doi: 10.1016/j.cortex.2009.02.011. [DOI] [PMC free article] [PubMed] [Google Scholar]
- Davare M, Rothwell JC, Lemon RN. Causal connectivity between the human anterior intraparietal area and premotor cortex during grasp. Curr Biol. 2010;20:176–181. doi: 10.1016/j.cub.2009.11.063. [DOI] [PMC free article] [PubMed] [Google Scholar]
- De Gennaro L, Bertini M, Pauri F, Cristiani R, Curcio G, Ferrara M, Rossini PM. Callosal effects of transcranial magnetic stimulation (TMS): the influence of gender and stimulus parameters. Neurosci Res. 2004;48:129–137. doi: 10.1016/j.neures.2003.10.004. [DOI] [PubMed] [Google Scholar]
- Dum RP, Strick PL. Frontal lobe inputs to the digit representations of the motor areas on the lateral surface of the hemisphere. J Neurosci. 2005;25:1375–1386. doi: 10.1523/JNEUROSCI.3902-04.2005. [DOI] [PMC free article] [PubMed] [Google Scholar]
- Duque J, Ivry RB. Role of corticospinal suppression during motor preparation. Cereb Cortex. 2009;19:2013–2024. doi: 10.1093/cercor/bhn230. [DOI] [PMC free article] [PubMed] [Google Scholar]
- Duque J, Lew D, Mazzocchio R, Olivier E, Ivry RB. Evidence for two concurrent inhibitory mechanisms during response preparation. J Neurosci. 2010;30:3793–3802. doi: 10.1523/JNEUROSCI.5722-09.2010. [DOI] [PMC free article] [PubMed] [Google Scholar]
- Grefkes C, Nowak DA, Wang LE, Dafotakis M, Eickhoff SB, Fink GR. Modulating cortical connectivity in stroke patients by rTMS assessed with fMRI and dynamic causal modeling. Neuroimage. 2010;50:233–242. doi: 10.1016/j.neuroimage.2009.12.029. [DOI] [PMC free article] [PubMed] [Google Scholar]
- Grol MJ, Majdandzic J, Stephan KE, Verhagen L, Dijkerman HC, Bekkering H, Verstraten FA, Toni I. Parieto-frontal connectivity during visually guided grasping. J Neurosci. 2007;27:11877–11887. doi: 10.1523/JNEUROSCI.3923-07.2007. [DOI] [PMC free article] [PubMed] [Google Scholar]
- Hamada M, Hanajima R, Terao Y, Okabe S, Nakatani-Enomoto S, Furubayashi T, Matsumoto H, Shirota Y, Ohminami S, Ugawa Y. Primary motor cortical metaplasticity induced by priming over the supplementary motor area. J Physiol. 2009;587:4845–4862. doi: 10.1113/jphysiol.2009.179101. [DOI] [PMC free article] [PubMed] [Google Scholar]
- Hebb DO. The organization of behavior: a neuropsychological theory. New York: Wiley; 1949. [Google Scholar]
- Hsu TY, Tseng LY, Yu JX, Hung DL, Tzeng OJ, Walsh V, Muggleton NG, Juan CH. Modulating inhibitory control with direct current stimulation of the superior medial frontal cortex. Neuroimage. 2011;56:2249–2257. doi: 10.1016/j.neuroimage.2011.03.059. [DOI] [PubMed] [Google Scholar]
- Jackson A, Mavoori J, Fetz EE. Long-term motor cortex plasticity induced by an electronic neural implant. Nature. 2006;444:56–60. doi: 10.1038/nature05226. [DOI] [PubMed] [Google Scholar]
- Koch G, Franca M, Del Olmo MF, Cheeran B, Milton R, Alvarez Sauco M, Rothwell JC. Time course of functional connectivity between dorsal premotor and contralateral motor cortex during movement selection. J Neurosci. 2006;26:7452–7459. doi: 10.1523/JNEUROSCI.1158-06.2006. [DOI] [PMC free article] [PubMed] [Google Scholar]
- Koch G, Fernandez Del Olmo M, Cheeran B, Schippling S, Caltagirone C, Driver J, Rothwell JC. Functional interplay between posterior parietal and ipsilateral motor cortex revealed by twin-coil transcranial magnetic stimulation during reach planning toward contralateral space. J Neurosci. 2008;28:5944–5953. doi: 10.1523/JNEUROSCI.0957-08.2008. [DOI] [PMC free article] [PubMed] [Google Scholar]
- Markram H, Lubke J, Frotscher M, Sakmann B. Regulation of synaptic efficacy by coincidence of postsynaptic APs and EPSPs. Science. 1997;275:213–215. doi: 10.1126/science.275.5297.213. [DOI] [PubMed] [Google Scholar]
- Mars RB, Klein MC, Neubert FX, Olivier E, Buch ER, Boorman ED, Rushworth MF. Short-latency influence of medial frontal cortex on primary motor cortex during action selection under conflict. J Neurosci. 2009;29:6926–6931. doi: 10.1523/JNEUROSCI.1396-09.2009. [DOI] [PMC free article] [PubMed] [Google Scholar]
- Mayka MA, Corcos DM, Leurgans SE, Vaillancourt DE. Three-dimensional locations and boundaries of motor and premotor cortices as defined by functional brain imaging: a meta-analysis. Neuroimage. 2006;31:1453–1474. doi: 10.1016/j.neuroimage.2006.02.004. [DOI] [PMC free article] [PubMed] [Google Scholar]
- Munchau A, Bloem BR, Irlbacher K, Trimble MR, Rothwell JC. Functional connectivity of human premotor and motor cortex explored with repetitive transcranial magnetic stimulation. J Neurosci. 2002;22:554–561. doi: 10.1523/JNEUROSCI.22-02-00554.2002. [DOI] [PMC free article] [PubMed] [Google Scholar]
- Nambu A, Tokuno H, Hamada I, Kita H, Imanishi M, Akazawa T, Ikeuchi Y, Hasegawa N. Excitatory cortical inputs to pallidal neurons via the subthalamic nucleus in the monkey. J Neurophysiol. 2000;84:289–300. doi: 10.1152/jn.2000.84.1.289. [DOI] [PubMed] [Google Scholar]
- Neubert FX, Mars RB, Buch ER, Olivier E, Rushworth MF. Cortical and subcortical interactions during action reprogramming and their related white matter pathways. Proc Natl Acad Sci U S A. 2010;107:13240–13245. doi: 10.1073/pnas.1000674107. [DOI] [PMC free article] [PubMed] [Google Scholar]
- O'Shea J, Sebastian C, Boorman ED, Johansen-Berg H, Rushworth MF. Functional specificity of human premotor-motor cortical interactions during action selection. Eur J Neurosci. 2007;26:2085–2095. doi: 10.1111/j.1460-9568.2007.05795.x. [DOI] [PubMed] [Google Scholar]
- Petrides M, Cadoret G, Mackey S. Orofacial somatomotor responses in the macaque monkey homologue of Broca's area. Nature. 2005;435:1235–1238. doi: 10.1038/nature03628. [DOI] [PubMed] [Google Scholar]
- Rizzo V, Siebner HS, Morgante F, Mastroeni C, Girlanda P, Quartarone A. Paired associative stimulation of left and right human motor cortex shapes interhemispheric motor inhibition based on a Hebbian mechanism. Cereb Cortex. 2009;19:907–915. doi: 10.1093/cercor/bhn144. [DOI] [PubMed] [Google Scholar]
- Rossini PM, Barker AT, Berardelli A, Caramia MD, Caruso G, Cracco RQ, Dimitrijevic MR, Hallett M, Katayama Y, Lucking CH, Maertens de Noordhout AL, Marsden CD, Murray NM, Rothwell JC, Swash M, Tomberg C. Non-invasive electrical and magnetic stimulation of the brain, spinal cord and roots: basic principles and procedures for routine clinical application. Report of an IFCN committee. Electroencephalogr Clin Neurophysiol. 1994;91:79–92. doi: 10.1016/0013-4694(94)90029-9. [DOI] [PubMed] [Google Scholar]
- Stefan K, Kunesch E, Cohen LG, Benecke R, Classen J. Induction of plasticity in the human motor cortex by paired associative stimulation. Brain. 2000;123:572–584. doi: 10.1093/brain/123.3.572. [DOI] [PubMed] [Google Scholar]
- Strafella AP, Vanderwerf Y, Sadikot AF. Transcranial magnetic stimulation of the human motor cortex influences the neuronal activity of subthalamic nucleus. Eur J Neurosci. 2004;20:2245–2249. doi: 10.1111/j.1460-9568.2004.03669.x. [DOI] [PubMed] [Google Scholar]
- Sussillo D, Abbott LF. Generating coherent patterns of activity from chaotic neural networks. Neuron. 2009;63:544–557. doi: 10.1016/j.neuron.2009.07.018. [DOI] [PMC free article] [PubMed] [Google Scholar]
- Swann N, Tandon N, Canolty R, Ellmore TM, McEvoy LK, Dreyer S, DiSano M, Aron AR. Intracranial EEG reveals a time- and frequency-specific role for the right inferior frontal gyrus and primary motor cortex in stopping initiated responses. J Neurosci. 2009;29:12675–12685. doi: 10.1523/JNEUROSCI.3359-09.2009. [DOI] [PMC free article] [PubMed] [Google Scholar]
- Thabit MN, Ueki Y, Koganemaru S, Fawi G, Fukuyama H, Mima T. Movement-related cortical stimulation can induce human motor plasticity. J Neurosci. 2010;30:11529–11536. doi: 10.1523/JNEUROSCI.1829-10.2010. [DOI] [PMC free article] [PubMed] [Google Scholar]
- Tokuno H, Nambu A. Organization of nonprimary motor cortical inputs on pyramidal and nonpyramidal tract neurons of primary motor cortex: an electrophysiological study in the macaque monkey. Cereb Cortex. 2000;10:58–68. doi: 10.1093/cercor/10.1.58. [DOI] [PubMed] [Google Scholar]
- Walsh V, Cowey A. Transcranial magnetic stimulation and cognitive neuroscience. Nat Rev Neurosci. 2000;1:73–77. doi: 10.1038/35036239. [DOI] [PubMed] [Google Scholar]
- Walsh V, Pascual-Leone A. Transcranial magnetic stimulation: a neurochronometrics of mind. Cambridge, MA: MIT; 2003. [Google Scholar]
- Wolters A, Sandbrink F, Schlottmann A, Kunesch E, Stefan K, Cohen LG, Benecke R, Classen J. A temporally asymmetric Hebbian rule governing plasticity in the human motor cortex. J Neurophysiol. 2003;89:2339–2345. doi: 10.1152/jn.00900.2002. [DOI] [PubMed] [Google Scholar]
- Wolters A, Schmidt A, Schramm A, Zeller D, Naumann M, Kunesch E, Benecke R, Reiners K, Classen J. Timing-dependent plasticity in human primary somatosensory cortex. J Physiol. 2005;565:1039–1052. doi: 10.1113/jphysiol.2005.084954. [DOI] [PMC free article] [PubMed] [Google Scholar]