Abstract
The auditory system represents sound-source directions initially in head-centered coordinates. To program eye–head gaze shifts to sounds, the orientation of eyes and head should be incorporated to specify the target relative to the eyes. Here we test (1) whether this transformation involves a stage in which sounds are represented in a world- or a head-centered reference frame, and (2) whether acoustic spatial updating occurs at a topographically organized motor level representing gaze shifts, or within the tonotopically organized auditory system. Human listeners generated head-unrestrained gaze shifts from a large range of initial eye and head positions toward brief broadband sound bursts, and to tones at different center frequencies, presented in the midsagittal plane. Tones were heard at a fixed illusory elevation, regardless of their actual location, that depended in an idiosyncratic way on initial head and eye position, as well as on the tone's frequency. Gaze shifts to broadband sounds were accurate, fully incorporating initial eye and head positions. The results support the hypothesis that the auditory system represents sounds in a supramodal reference frame, and that signals about eye and head orientation are incorporated at a tonotopic stage.
Introduction
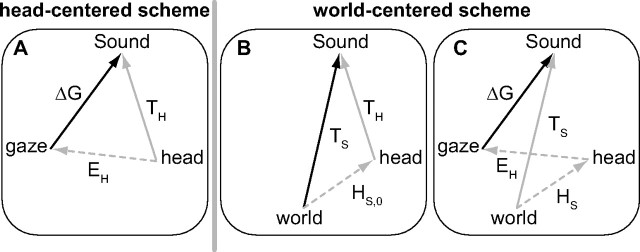
The auditory system is tonotopically organized and relies on implicit acoustic cues to extract sound-source directions from spectral-temporal representations: interaural time and level differences determine directions within the horizontal plane (azimuth), and pinna-related spectral-shape cues in the vertical plane (elevation; Wightman and Kistler, 1989; Middlebrooks and Green, 1991; Middlebrooks, 1992; Blauert, 1997; Hofman and Van Opstal, 1998, 2002; Kulkarni and Colburn, 1998; Langendijk and Bronkhorst, 2002). The acoustic cues define sounds in head-centered coordinates (TH). Because an accurate gaze shift (ΔG) requires an oculocentric command, a coordinate transformation is needed that could be achieved by subtracting eye position (EH; Fig. 1A; the head-centered scheme; Jay and Sparks, 1984):
Alternatively, the auditory system could store sounds in a world-centered representation (Fig. 1B):
with HS,0 the head orientation in space at sound onset. In that case, to program gaze shifts, the audiomotor system should also incorporate the current head orientation (HS; Fig. 1C; the world-centered scheme):
This study addresses the following two questions: (1) is audiomotor behavior determined by a head-centered or world-centered scheme, and (2) is the coordinate transformation implemented at a level where signals are topographically represented, or within the tonotopic stages of the auditory system? These questions cannot be readily answered if gaze shifts are goal directed (regardless of a head- or world-centered goal), and the coordinate transformations are accurate, as in that case the two schemes are equivalent. To dissociate the two models, we here use the peculiarity of the auditory system that spectral-cue analysis for sound elevation results in a spatial illusion for narrow-band sounds. Pure tones are heard at elevations that are unrelated to their physical locations, but instead depend on tone frequency (e.g., Middlebrooks, 1992; Frens and Opstal, 1995). Because of this goal independence, the two transformation schemes are not equivalent for tones, as they predict gaze shifts that are systematically influenced by eye position only for the head-centered scheme, but also by head position for the world-centered scheme. Furthermore, if these transformations take place within the tonotopic stages of the auditory system, the coordinate transformations will likely depend on the sound's spectral content. Conversely, if they take place within topographically organized maps (Sparks, 1986), these influences will be frequency independent.
Figure 1.
Example vector schemes for remapping sound into a goal-directed gaze shift. A, The head-centered scheme. The head-centered sound representation (TH, gray arrow) should be transformed into an oculocentric motor command (ΔG, bold black arrow), by subtracting eye-in-head orientation (EH, gray dotted arrow; Eq. 1). B, C, The world-centered scheme. B, Head-centered sound coordinates are transformed into a supramodal world-centered (TS, bold black arrow) reference frame, by incorporating head orientation at sound onset (HS,0, gray dotted arrow; Eq. 2). C, The world-centered sound (TS, gray arrow) is transformed into an oculocentric motor command (ΔG, bold black arrow) by incorporating both eye and head orientation (EH and HS, gray dotted arrows; Eq. 3).
Previously, Goossens and Van Opstal (1999) elicited saccades to tones under head-fixed conditions following the same reasoning. However, eye-only saccades are limited by the oculomotor range, and head-position effects may therefore not be exclusive to acoustic processing (Tollin et al., 2005; Populin, 2006). Moreover, the role of eye-in-head position was not clear either, since it was not varied. We here elicited head-unrestrained gaze shifts to broadband noises and pure tones in the midsagittal plane, while independently varying initial head and eye positions over a wide range. Our results support the use of a world-centered representation for sounds that arises within the tonotopic auditory system.
Materials and Methods
Subjects
Eight subjects participated in the experiments (age, 21–52 years, median 27 years; 5 male, 3 female). Six subjects were naive about the purpose of the study, but were familiar with the experimental procedures in the laboratory and auditory setup. Subjects had normal hearing (within 20 dB of audiometric zero, standard staircase audiogram test, 10 frequencies, range 0.5–11.3 kHz, 1/2 octave separated), and no uncorrected visual impairments, apart from subject S3, who is amblyopic in his right, recorded, eye. Experiments were conducted after we obtained full understanding and written consent from the subject. The experimental procedures were approved by the Local Ethics Committee of the Radboud University Nijmegen, and adhered to The Code of Ethics of the World Medical Association (Declaration of Helsinki), as printed in the British Medical Journal of July 18, 1964.
Experimental setup
The subject sat comfortably in a modified office chair within a completely dark, sound-attenuated, anechoic room, such that the measured eye was aligned with the center of the auditory stimulus hoop (described below). The walls of the 3 × 3 × 3 m room were covered with black foam (50 mm thick with 30 mm pyramids, AX2250, Uxem) that prevented echoes for frequencies exceeding 500 Hz (Agterberg et al., 2011). The background noise level in the room was about 30 dB SPL.
Three orthogonal pairs of square coils (6 mm2 wires) were attached to the corners of the room and were connected to an eye- and head-movement monitor (EM7; Remmel Labs), which generated three perpendicular oscillating magnetic fields. The magnetic fields induced alternating voltages in small coils that were mounted on the subject (frequencies: horizontal, 80 kHz; vertical, 60 kHz; frontal, 48 kHz). A scleral search coil was used to monitor eye movements (Scalar Instruments). A spectacle frame with a small second search coil attached to the nose bridge was used to monitor head movements. A switchable head-fixed laser pointer (red) was mounted on the nose bridge as well. A removable lightweight aluminum rod, holding a small black plastic cover, blocked the laser beam at ∼30 cm in front of the subject's eyes.
Before inserting the eye coil, the eye was anesthetized with one drop of oxybuprocaine (0.4% HCl; Théa Pharma). To prevent dehydration of the eye and for a better fixation of the coil, a drop of methylcellulose (5 mg/ml; Théa Pharma) was also administered.
The coil signals were connected to nearby preamplifiers (Remmel Labs). Their outputs were subsequently amplified and demodulated into the horizontal and vertical gaze and head orientations by the Remmel system. Finally, the signals were low-pass filtered at 150 Hz (custom built, fourth-order Butterworth) for anti-aliasing purposes. The filtered signals were digitized by a Medusa Head Stage and Base Station (TDT3 RA16PA and RA16; Tucker-Davis Technology) at a rate of 1017.25 Hz per channel. In addition to the analog movement signals, a button press was recorded. Raw coil data and button state were stored on a PC's hard disk (Precision 380; Dell). During the experiments, the raw signals were monitored on an oscilloscope (TDS2004B; Tektronix).
Experimental parameters were set by the PC and fed trial by trial to a stand-alone microcontroller (custom made). This device ensures millisecond timing precision for data acquisition and stimulus selection. The PC also transferred the sound WAV files (16 bits) to the real-time processor (TDT3 RP2.1; Tucker-Davis Technology), which generated the audio signal (48.828125 kHz sampling rate). This signal was fed to the selected speaker on the hoop. Speakers and LEDs were selected via an I2C bus (Philips) that was instructed by the microcontroller.
Stimulus equipment
Auditory stimuli were delivered by a speaker selected at random from a set of 58 speakers (SC5.9; Visaton) that were mounted on a circular hoop with a radius of 1.2 m that could be rotated around the subject along a vertical axis (quantified by angle θH). The hoop is described in detail in Bremen et al. (2010). A green LED was mounted at the center of each speaker and could serve as an independent visual stimulus. The intensity could be controlled by the stimulus computer. The spatial resolution of the hoop speakers in elevation (εH) was 2.5° ranging from −57.5 to +82.5°, while the spatial resolution in azimuth was better than 0.1° over the full range of 360°.
Sound stimuli
Broadband (BB) stimuli were 150 ms of frozen Gaussian white noise at an intensity of 60 dBA (microphone: Brüel & Kjær 4144, located at the position of the subject's head; amplifier: Brüel & Kjær 2610). The stimulus had been generated by Matlab's built-in function “randn” (v7.7; The MathWorks). Narrow band stimuli were sine waves with a frequency of 1, 3, 4, 5, 7, 7.5, or 9 kHz. All sounds had 5 ms sine-squared onset and cosine-squared offset ramps.
Coordinates
Target and response coordinates are expressed in a double-pole azimuth (α) and elevation (ε) coordinate system (Knudsen and Konishi, 1979). The relation between the [θH, εH] coordinates of auditory and visual targets on the hoop and [α, ε] is given by the following:
Calibration
In the calibration experiment, 42 LED locations on the hoop were used to probe the response area. Subjects aligned the eye (by fixating) and head (by pointing the head-fixed laser to the target) with the presented LED. Subjects indicated alignment by a button press, after which 100 ms of data was recorded. Calibration targets were located at all permutations of ε ∈ [−55, −50, −40, −30, … , 50, 60, 70]° and α ∈ [20, 0, −20]°. The average values of the recorded samples were used to calibrate the head and gaze signals offline. The data were used to train four (gaze: [α, ε], head: [α, ε]) three-layer feedforward back-propagation neural networks (each with five hidden units; see Goossens and Van Opstal, 1997). The trained networks served to calibrate the raw data of the experiments off-line. This calibration produced the azimuth and elevation orientation signals of the eye and head with an absolute accuracy of 2°, or better, over the full measurement range.
Experimental paradigm
In the localization blocks, the pointing laser was switched off and the aluminum rod removed. The spatial-temporal layout of the localization trials is schematically illustrated in Figure 2.
Figure 2.
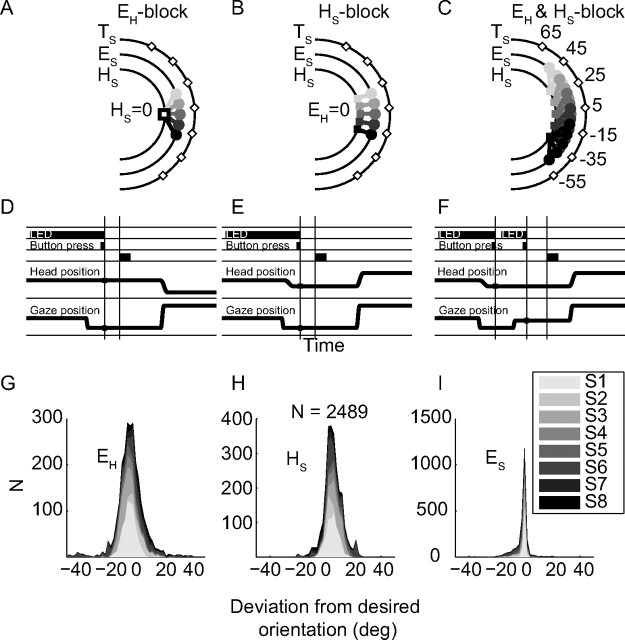
Spatial and temporal layout of experimental trials. A–C, Spatial configurations of EH, HS, and EH&HS variable blocks. Diamonds, Sound locations; head and gaze positions are indicated by squares and dots, respectively. D–F, Temporal events for the same blocks as in A–C. G–I, Distributions of elevation difference between actual and desired eye-in-head (EH, G), head in space (HS, H), and eye-in-space (ES, I). Bins are 2° in elevation and subjects are stacked (gray shades). Because ES = HS + EH, and ES is accurate (i.e., errors are near zero), EH and HS distributions are negatively correlated.
Sound localization with variable static eye-in-head orientations.
During the eye-variable block, participants were asked in each trial (Fig. 2D) to orient their eyes to an LED, pseudorandomly selected from five possible locations ε ∈ [−20, −10, 0, 10, 20]°, while keeping their head at straight ahead (HS = 0°). This ensured variation of the initial eye-in-head positions (Fig. 2A). The subject subsequently pressed the button, which immediately extinguished the LED, and after a delay of 200 ms a sound (BB, or a tone at a frequency of 3, 4, 5, 7, or 9 kHz) was presented, pseudorandomly selected from seven possible locations ε ∈ [−55, −35, −15, 5, 25, 45, 65]°. The subject was asked to reorient gaze with an eye–head saccade to the perceived sound location. To test every permutation (6 sound types × 5 EH orientations × 7 sound locations, see Fig. 2), this experimental block contained 210 trials. Subjects S1, S2, S3, and S6 completed this block.
Sound localization with variable static head-in-space orientations.
After the first block and a short break, in which the room lights were turned on, we ran a head-variable block, in which the eye-in-head orientation was kept constant (EH = 0°), while varying the head-in-space orientation (Fig. 2B). To that end, subjects oriented both their gaze and head to the initial LED in each trial (Fig. 2E). The subject had to reorient gaze with an eye–head saccade to the perceived sound location. Sound locations, sound spectra, data acquisition, and subjects were the same as in the eye-variable block.
Localization with mixed variable static eye-in-head and head-in-space orientations.
Six subjects (S1, S4, S5, S6, S7, and S8) completed experiments in which both eye-in-head (at [−20, −10, 0, +10, +20]°) and head-in-space (at [−30, −15, 0, +15, +30]°) were varied independently within the same block of trials. Subjects had to orient head and eye to different LEDs, and indicate by a button press that they did (Fig. 2C). This yielded 25 different initial eye–head position combinations for the same sound locations as in the other two experiments. Note that initial gaze could thus vary between 50° up and down, relative to straight ahead, and that the required gaze shift to reach the target could be up to 115°. Sound stimuli were 150 ms BB bursts, and three tones at 1, 5, and 7.5 kHz, all randomly intermixed. As it took too long for the eye-coil measurements to test every permutation (4 sound types × 5 EH orientations × 5 HS × 7 sound locations = 700 possibilities) in one session, we divided trials in pseudorandom order into 4 blocks of 175 trials. In one session, the subject performed two of these blocks (350 trials) with a short break in between. As the analysis was robust to the inhomogeneous distribution of parameters, we did not perform a second session with the remaining two blocks.
Since subjects did not have any visual reference to guide their head position, the actual alignment of the initial head-in-space (Fig. 2H) varied from trial to trial, in all blocks. The initial gaze position on the other hand was always well aligned with the spatial location of the LED (Fig. 2E). As a consequence, the eye-in-head also varied from trial to trial (Fig. 2G), in the opposite direction of head-in-space orientation. These small misalignments were not critical for our results, and could actually be used in our multiple linear regression analyses.
Data analysis
Gaze saccades.
Saccade detection was performed offline with a custom-made Matlab routine, which used different onset and offset criteria for radial eye velocity and acceleration. Detected saccades were checked visually and could be corrected manually, if needed. We analyzed only the first gaze shift in a trial. Gaze saccades with a reaction time shorter than 150 ms (deemed anticipatory) or longer than 500 ms (judged inattentive) and response outliers (gaze shifts for which the endpoints were more than three standard deviations away from the regression model of Eq. 5, see below) were discarded from further analysis, leaving in total 2489 gaze shifts. In the Results, we report on the gaze shifts only.
Multiple linear regression.
To determine the reference frame of the localization responses, we performed multiple linear regression analysis (MLR) quantifying the auditory-evoked gaze displacement, ΔG, in elevation as follows:
According to the world-centered reference frame model of Equations 2 and 3, the gaze coefficients a, b, and c should equal +1, −1, and −1, respectively, and the bias should be 0°. To quantify whether the parameters differed from these ideal values (entailing poor spatial remapping), we determined the t-statistics and their associated P values for a − 1, b + 1, and c + 1, respectively.
To quantify the data according to the head-centered model of Equation 1, we also fitted the gaze shifts to
with TH the target with respect to the head. Also the head-centered model can account for accurate goal-directed gaze shifts: the gaze coefficients, k and m, would then equal +1 and −1, respectively, and the bias should be 0°.
For the purposes of this analysis, we pooled the experimental blocks of each subject (see Fig. 2G–I; in each block both eye and head orientation varied as noted before). Results did not differ significantly if we performed the MLR analysis on each block separately, while excluding the variable that was intended to be constant. We also determined R2, F-statistic, and P value for the regression models, and the t and P values for each regression coefficient (including the degrees of freedom).
Model comparison.
As mentioned above, schemes in which sounds are either stored in world-centered coordinates (Eqs. 2 and 3), or in a head-centered reference frame (Eq. 1), can both predict accurate gaze shifts to broadband sounds, which makes it not straightforward to dissociate them. The two schemes could potentially be dissociated on the basis of the tone-evoked responses, which are not expected to be goal directed (see Introduction), so that the target coefficient is expected to be negligible (a of Eq. 5 and k of Eq. 6 both close to 0). If sounds are kept in a head-centered reference frame, the influence of head position on the gaze shift will be negligible (b, Eq. 5 will be close to 0), and both regression models will fit the data nicely. On the other hand, if sounds are stored in world-centered coordinates, head position will systematically (negatively) influence the gaze shift, yielding a good fit for the world-centered regression model (Eq. 5, gain b = −1), but a bad fit for the head-centered regression model (Eq. 6 is not applicable, as head position is not incorporated).
Still, because of unexplained variance in the actual responses, and because the contributions of TS, TH, HS, and EH are likely to deviate from their ideal values, a straightforward dissociation on the basis of the regression coefficients alone might not be so clear-cut. Therefore, we also compared the R2 for the two regression models (Eqs. 5 and 6) by a paired t test, after adjusting for the number of free parameters:
 |
with Radj2 the adjusted coefficient of determination, n the number of responses, and p the number of regression parameters (not counting the bias; p = 3 for Eq. 5; p = 2 for Eq. 6). The highest Radj2 then favors the associated regression model.
Accepted level of significance P was set at 0.05 for all tests.
Results
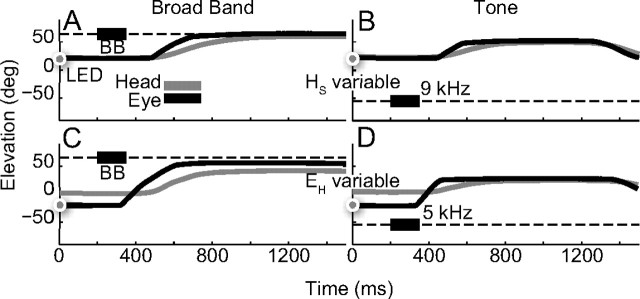
Subjects made head-unrestrained gaze shifts to brief broadband noise bursts and pure-tone sounds at various spatial positions in the midsagittal plane, presented under a variety of initial eye and head orientations (Fig. 2). Figure 3 shows typical gaze saccades (black trace: gaze, gray trace: head) of subject S6 to broadband sounds (Fig. 3A,C) and to pure tones of 9 and 5 kHz, respectively (Fig. 3B,D). The broadband-evoked gaze shifts were directed toward the sound location, and were unaffected by the initial eye and head position. In contrast, the tone responses were clearly not goal directed. To what extent these responses did, or did not, depend in a systematic way on the initial eye and head orientation cannot be inferred from these individual examples, as this requires a wide range of initial positions. In the analyses that follow, we will quantify these aspects of the data.
Figure 3.
Gaze (black) and head (gray) trajectories of example trials of listener S6. Horizontal dashed lines indicate sound-in-space locations (thick black line: target timing). Dots on abscissa, LED location that guided the eye position either with the head aligned or straight-ahead. A, C, Gaze shifts to BB noise stimuli are accurate. B, D, Saccades to tones (9 and 5 kHz) are not goal-directed. A, B, Variable HS, EH centered in head. C, D, Variable EH, HS straight ahead.
Sound localization
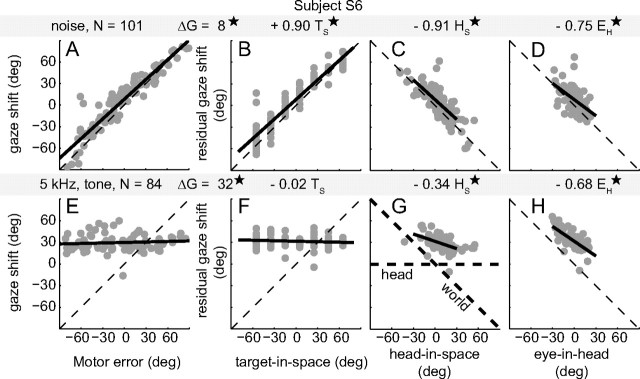
Figure 4A shows that the gaze shift responses of subject S6 for broadband sounds corresponded well with the required motor error. To identify any small, but systematic, effects of changes in head and eye orientation on the broadband-evoked gaze shifts, we performed multiple linear regression on the data (MLR; Eq. 5), in which gaze shift (ΔG) was the dependent variable, and target-in-space location (TS), eye-in-head orientation (EH), and head-in-space position (HS) were the independent variables (Fig. 4B–D, top gray bar). The gaze shifts of subject S6 clearly varied with the actual target-in-space location with a high positive gain (a) of 0.90 (Fig. 4B, black regression line, t(97) = 26.8, P < 10−6). Also, both head and eye-in-head orientation significantly influenced S6's gaze shifts, as shown in Figure 4, C and D (HS: b = −0.91, t(97) = −10.2, P < 10−6; EH: c = −0.75, t(97) = −4.4, P < 10−4). These findings indicate that sound-evoked gaze shifts toward broadband sounds account for a large range of static changes in initial head and eye positions.
Figure 4.
Elevation localization performance to broadband noise (A–D) and the 5 kHz tone (E–H) of listener S6, for all initial eye and head orientations. A, E, Gaze-shift (ΔG) response as a function of gaze-motor error (required gaze shift, TE = TH − EH). Dashed diagonal lines indicate the ideal, accurate response. Solid black lines show the best linear fit to the data. Note the contrast between highly accurate gaze shifts for broadband sounds and highly inaccurate responses for tones. B–D and F–H show the residual effect of a single variable on the gaze shift (after taking into account the other variables through the MLR-analysis) for broadband sounds and tones, respectively. Solid black lines represent the MLR slopes. B, Strong correlation of broadband-evoked gaze shift with target-in-space (TS). C, Strong negative effect of head-in-space orientation (HS). D, Strong negative effect of eye-in-head orientation (EH). For tones, responses are not goal-directed (D), but do vary systematically with HS (G) and EH (H). Diagonal lines with slope −1 indicate the ideal response results. Thick dashed lines in G indicate the predicted influence of head orientation for the head- and world-centered schemes. The coefficients according to the MLR (Eq. 5) are shown above the panels. Values that differ significantly from zero are indicated by an asterisk (*).
In stark contrast to these findings were the tone-evoked responses. In line with the qualitative observations of Figure 3, B and D, the results show that S6 could not localize the 5 kHz tone at all with gaze shifts (Fig. 4D). Figure 4E–H presents the MLR results of subject S6 for the 5 kHz tone. Gaze shifts were independent of the actual stimulus location (TS slope, a, was close to zero; t(80) = −1.0, P = 0.30). Part of the response variability, however, could be attributed to the changes in initial eye orientation (Fig. 4H), as the data showed a significant negative relationship (EH: c = −0.68, t(80) = −7.8, P < 10−6). Importantly, there was also a small but significant correlation for the initial head orientation (Fig. 4G; HS: b = −0.34, t(80) = −5.3, P < 10−5). These data therefore suggest that the auditory system attempts to represent the tone in a world-centered reference frame, albeit by only partially compensating for the eye and head orientations (slopes b and c differ significantly from the ideal value of −1; t(80) = 15.3 and 10.8, both at P < 10−6).
Reference frame for broadband sounds
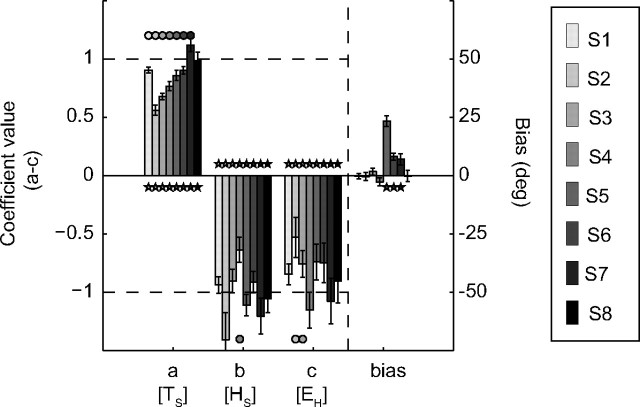
The MLR analysis of Equation 5 was then used to quantify the spatial accuracy of saccadic gaze shifts toward the broadband sounds, and to attribute their response variances to the various experimental factors, for all subjects. The result of this analysis is presented in Figure 5. The regression coefficient of gaze shifts for the world-centered target location was high and positive (a[TS] = 0.85 ± 0.18, a > 0 in 8/8 cases), while the regression coefficients for the static initial eye and head positions were both near −1 (b[HS] = −1.02 ± 0.23, b < 0 for 8/8; and c[EH] = −0.84 ± 0.20, c < 0 for 8/8; respectively). This indicates nearly full compensation of the initial eye and head positions in the broadband-evoked gaze shifts.
Figure 5.
Results of MLR (Eq. 5) for all listeners (gray-coded) to broadband stimuli in elevation for different static initial eye and head orientations. Data from all recording sessions were pooled. Response bias for each subject is indicated at the right side. Note the different scales. Error bars correspond to one standard deviation. Dashed lines at +1 and −1 denote ideal target representation and full compensation of eye and head positions, respectively.
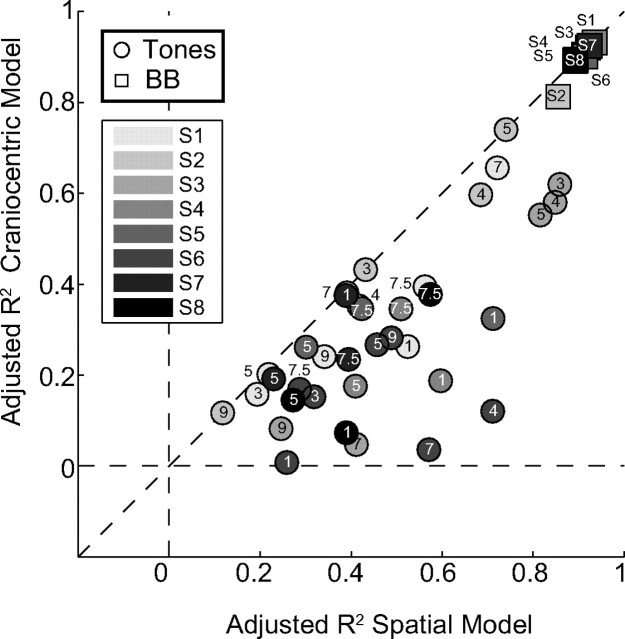
Overall, the world-centered regression model of Equation 5 explained much of the variance of the gaze shifts toward broadband sounds (R2: 0.91 ± 0.03; F > 75, P ≪ 0.0001). However, from this result, one cannot conclude that sounds are represented in a world-centered reference frame in the auditory system, because the head-centered regression model of Equation 6 also explained much of the variance in broadband-evoked gaze shifts (k[TH] = 0.86 ± 0.17, m[EH] = −0.94 ± 0.12, bias = 4.1 ± 7.9; R2: 0.90 ± 0.03, F > 101, P < 10−5). Indeed, the two models cannot be dissociated, even when comparing the goodness-of-fit adjusted for the number of regression parameters (see Materials and Methods; see also below, Fig. 7, squares). Furthermore, whether spatial updating of sounds occurs at a tonotopic or at a topographic stage within the audiomotor system cannot be discerned from these broadband results either.
Figure 7.
Comparison between the goodness of fit for the gaze-shift data by the world-centered (Eq. 5) and head-centered regression model (Eq. 6). Symbols correspond to all broadband noise (squares: N = 8) and pure tone experiments (circles; frequency in kHz indicated; N = 36) for all subjects (gray-shaded uniquely). Each symbol gives the adjusted R2 value for either model (Eq. 7) for each subject and stimulus. Note that the models cannot be dissociated for the broadband-evoked gaze shifts, because the contribution of target location and head orientation are close to the ideal values of +1 and −1, respectively (see Fig. 4B,C). Hence the adjusted R2 values lie along the identity line. The tone responses, however, do provide a clear distinction, as the far majority of points lie below the diagonal. This indicates that the responses can be best explained by the world-centered model.
Reference frame for pure tones
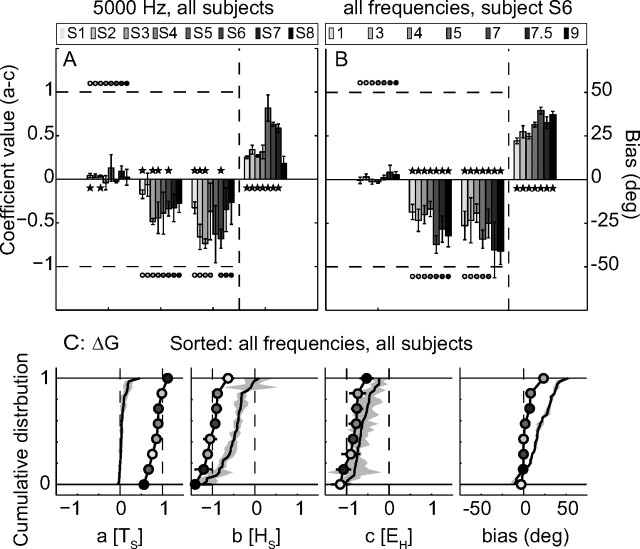
To assess these important points, we performed the same MLR analyses on the tone-evoked gaze shifts. Figure 6A shows the results (Eq. 5) of all subjects for the 5 kHz tone, and Figure 6B summarizes the results of subject S6 for all seven tones, in the same format as in Figure 5. Figure 6A shows that none of the subjects could localize the 5 kHz tone, as the regression coefficient for the target-in-space location was indistinguishable from zero in the majority of the cases (a[TS] = 0.04 ± 0.06, a ≠ 0 2/8). Some subjects accounted for initial head (b[HS] = −0.31 ± 0.14, b < 0 for 4/8) and eye orientation (c[EH] = −0.50 ± 0.19, c < 0 for 4/8). The associated slopes, however, were higher than −1 (b > −1 for 8/8, c > −1 for 7/8), which suggests partial compensation.
Figure 6.
A, MLR results for 5 kHz tone-evoked responses of all listeners (gray-coded). B, MLR results for the responses of listener S6 to all tones. C, Regression coefficients of the gaze shifts for all subjects to broadband noise (black lines and circles) and all tones (black lines and gray patch), presented as cumulative distributions.
Similar observations can be made for the other frequencies. In Figure 6B, we present the regression results of subject S6. There is no effect of target location for all tones (a[TS] = 0.02 ± 0.04, a ≠ 0 for 0/7), but the gaze shifts depended on initial head (b[HS] = −0.51 ± 0.15, b < 0 for 7/7) and eye (c[EH] = −0.60 ± 0.17, c < 0 for 7/7) position in a frequency-dependent way for all cases. Again, the compensation was incomplete for the majority of tones (b > −1 for 7/7, c > −1 for 5/7).
The picture emerging from these data is that the amount of compensation of EH and HS depends in an idiosyncratic way (Fig. 6A) on frequency (Fig. 6B). Also the biases (shown on the right side of the panels) were idiosyncratic and frequency dependent. Figure 6C summarizes all broadband (black lines and circles; symbols indicate listeners as in Fig. 6A) and tone (black lines and gray patch) results, by presenting the regression coefficients (their means and standard deviations) as cumulative distributions (for all subjects, experimental blocks, and frequencies). The contrast between broadband and tone data is immediate: as broadband-evoked gaze shifts closely correspond to the predictions of a spatially accurate motor command ([a, b, c, bias] = [1, −1, −1, 0]), the tone-evoked responses were not goal directed at all. However, there was a systematic influence (negative slopes) of head and eye orientation on the tone-evoked responses. Because compensation was only partial for the tone responses, the regression coefficients almost never equaled the broadband results. Although this is not visible in Figure 6C (due to the sorting of data), it is illustrated in Figure 6B. Here the tone-evoked contributions of eye and head orientation can be seen to be frequency dependent.
As explained in Materials and Methods, the consistent finding that tone-evoked gaze shifts depend on head-in-space orientation (Fig. 6C, coefficient b, second panel) should favor the scheme in which sounds are represented in a world-centered reference frame (Eqs. 2, 3, and 5), rather than in head-centered coordinates (Eqs. 1 and 6). To further dissociate the two models for all experimental conditions, Figure 7 compares the adjusted goodness-of-fit results of the world-centered and head-centered regression models (Eqs. 5 and 6) for each subject and tone (circles; see Materials and Methods, Eq. 7). Because the far majority of data points (36/42) fall below the identity line (and none of the data are above this line), the world-centered representation scheme is by far the best model to represent the data (tones: paired t test, t(35) = 7.1, P = 2.9 × 10⁻⁸). This figure also shows that the two models are indistinguishable for broadband sounds (squares near top-right; paired t test, t(7) = 1.7, P = 0.14).
Discussion
We investigated whether the human auditory system compensates for static head-on-neck and eye-in-head pitch when localizing brief sounds in elevation with rapid eye–head gaze shifts. Subjects accurately localized broadband sounds (Figs. 4–6), even when initial eye and head positions varied over a considerable range. In contrast, tone-evoked gaze shifts did not vary in a systematic way with the actual sound-source location (Figs. 4, 6). Instead, mean response elevations varied idiosyncratically with tone frequency, and response variability could be partially explained by a negative, compensatory relationship between gaze-shift amplitude and static initial eye and head orientations (Fig. 6).
Influence of head position
According to the hypotheses described in Introduction and Materials and Methods, a systematic negative influence of static head orientation is expected for pure-tone localization only if the auditory system represents sounds in a supramodal, world-centered reference frame (Eqs. 2, 3). In contrast, when sounds are kept in head-centered coordinates, the illusory tone locations should only vary with eye position (Eq. 1). Although compensation for head position was incomplete, as gains were higher than −1, they were negative for all tones and subjects (Fig. 6). Moreover, the world-centered model convincingly outperformed the explanatory power of the head-centered model (Fig. 7).
These findings extend the results obtained from head-fixed saccades (Goossens and Van Opstal, 1999). As eye movements are necessarily restricted by the limited oculomotor range, it remained unclear whether the observed partial compensation for head position was exclusively due to acoustic processing, or perhaps also to oculomotor constraints. By measuring head-unrestrained gaze shifts, meanwhile varying initial eye and head positions over a large range, we ensured that the phenomenon of a seemingly intermediate reference frame for tones indeed results from acoustic processing mechanisms, and it allowed us to dissociate eye- and head-position-related effects.
We further hypothesized that if the auditory system incorporated spatial information about head position at a tonotopic stage within the acoustic sensory representations, one would observe incomplete, frequency-dependent compensation of static head orientation for pure-tone-evoked responses, which was indeed the case (Fig. 6). This finding strongly supports the notion of a construction of a world-centered acoustic representation within the tonotopically organized arrays of the auditory pathway. Possibly, accurate incorporation of head position in case of broadband sounds may result from constructive integration across frequency channels.
Influence of eye position
According to Figure 1A, eye-in-head orientation should be incorporated when programming sound-evoked gaze shifts. As this poses motor-specific computational requirements, a potential influence of eye position on sound-localization performance need not depend on the acoustic stimulus properties. Although our results indicated that the compensation for initial eye position was nearly complete for broadband-evoked responses (Figs. 4–6), the contribution of eye position to the pure tone elicited gaze shifts that varied with frequency in a similar way as for head position, albeit with slightly better compensatory gains (Fig. 6).
The broadband results are in line with previous oculomotor (Metzger et al., 2004; Populin et al., 2004; Van Grootel and Van Opstal, 2010) and head-unrestrained gaze-control studies (Goossens and Van Opstal, 1997, 1999; Vliegen et al., 2004). Recent evidence indicated that head-fixed saccades to brief noise bursts after prolonged fixation are accurate, regardless of eccentric fixation time and the number of intervening eye movements (Van Grootel and Van Opstal, 2009, 2010). Those results suggested that the representation of eye position, and the subsequent head-centered-to-oculocentric remapping of sound location, is accurate and dynamic.
However, several psychophysical studies have reported a systematic influence of prolonged eccentric eye position on perceived sound locations, although results appear inconsistent. Whereas in some studies perceived sound location shifted in the same direction as eye position (Lewald and Getzmann, 2006; Otake et al., 2007), others reported an opposite shift (Razavi et al., 2007), or did not observe any systematic effect (Kopinska and Harris, 2003). However, as these studies did not measure gaze shifts, and did not vary the acoustic stimulus properties (e.g., bandwidth, intensity, central frequency), a potential, small, influence of eye position at the motor-execution stage in combination with other factors (e.g., the use of visual pointers to indicate sound locations) could potentially underlie the differences in results.
Neurophysiology
Neurophysiological recordings have demonstrated that an eye-position signal weakly modulates firing rates of cells within the midbrain inferior colliculus (IC) (Groh et al., 2001; Zwiers et al., 2004; Porter et al., 2006). The IC is thought to be involved in sound-localization behavior, as it is pivotal in the ascending auditory pathway for integrating the different sound-localization cues extracted in brainstem nuclei (for review, see Yin, 2002). The IC output also converges on the deep layers of the SC, and this audio-motor pathway could therefore be involved in the programming of rapid sound-evoked eye–head gaze shifts (Sparks, 1986; Hartline et al., 1995; Peck et al., 1995). So far, IC responses have not been recorded with different head orientations, so that it remains unclear whether head-position signals would interact at the same neural stages within the audio-motor system as eye-position signals.
Note that since primate IC cells typically have narrow-band tuning characteristics (e.g., Zwiers et al., 2004; Versnel et al., 2009), it is conceivable that such weak eye-position modulations could underlie incomplete, frequency-dependent compensation of eye position for pure-tone-evoked gaze shifts, as suggested by our data (Fig. 6).
Recent EEG recordings over human auditory cortex suggested that auditory space is represented in a head-centered reference frame (Altmann et al., 2009). If true, our conclusion that the auditory system represents sounds in world-centered coordinates would imply that head-position signals are incorporated at stages upstream from auditory cortex, in the “where” processing pathway (Rauschecker and Tian, 2000). However, we believe that potential frequency-selective modulations of cortical cells by head-position signals, as suggested by our data, may be far too weak to be detected by EEG. We therefore infer that the posterior parietal cortex, and the gaze-motor map within the SC, both of which may be considered upstream from auditory cortex, would not be likely candidates for this frequency-specific behavioral effect.
Interestingly, the auditory system appears to receive vestibular inputs, and hence head-motion information, already at the level of the dorsal cochlear nucleus (Oertel and Young, 2004). This suggests that head-movement signals may be available at frequency-selective channels very early within the tonotopic auditory pathway. We found that full compensation of head orientations occurs when the sound's spatial location is well defined (Fig. 5). Indeed, with broadband noise the eye- and head-position signals would interact with all active frequency channels, rather than with only a narrow band of frequencies, as with pure tones. Such a frequency-dependent effect could be understood from a multiplicative mechanism that only contributes when acoustic input drives the cells (“gain-field” modulations; Zwiers et al., 2004).
Head versus gaze displacement
In contrast with the effect on gaze shifts, eye-in-head position did not affect gaze-shift-associated head displacements (data not shown). As a result, head movements were consistently directed toward the head-centered target coordinates, while at the same time gaze moved toward eye-centered coordinates (Eqs. 1 and 3). This was true for broadband, as well as (partially) for tone stimuli. This is the appropriate motor strategy for the two effectors, and it supports the idea that the respective motor commands are extracted from the same target representation through different computational processes (Guitton, 1992; Goossens and Van Opstal, 1997; Vliegen et al., 2004; Chen, 2006; Nagy and Corneil, 2010).
Figure 8 provides a conceptual scheme that summarizes our findings. The acoustic input is first filtered by the pinnae and subsequently decomposed at the cochlea into the associated frequency channels. At a central auditory stage (possibly early, see above), each frequency channel receives a modulatory input about head-in-space position. These modulations depend on frequency, perhaps reflecting each frequency's (idiosyncratic) reliability for sound localization. For example, if the 5 kHz frequency band contains a clear elevation-related spectral feature in the pinna-related cues, the head-position input to that channel would be strong. In this way, the active population of cells could construct the world-centered target location (Eq. 2). At the auditory system's output stage, e.g., at the IC and at the SC motor map, where all frequency channels converge, the world-centered target is transformed into an eye-centered gaze-motor command by incorporating current eye and head-position signals (Eq. 3). This sensorimotor transformation could be implemented in the form of frequency-specific gain-field modulations of eye and head-position signals at the IC (e.g., Zwiers et al., 2004), or by spatial gain-field eye-position modulations in a subpopulation of gaze-related neurons in the SC (Van Opstal et al., 1995). Presumably, the latter could generate the head-centered head-displacement command. Recent evidence suggests that head-specific sensitivity may exist at the level of the SC motor map (Walton et al., 2007; Nagy and Corneil, 2010). An alternative possibility, not indicated in this scheme, would be that the head-centered head-motor command is constructed at a later processing stage in the brainstem control circuitry, e.g., by subtracting current eye position from a common eye-centered gaze-motor command of the SC motor map (Goossens and Van Opstal, 1997).
Figure 8.
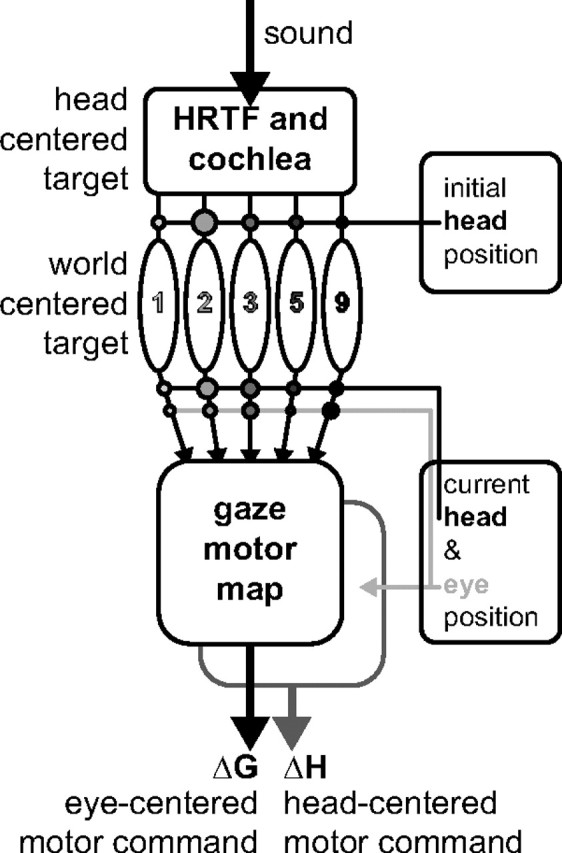
Conceptual scheme of the audio-motor system. Sound is filtered by the pinna-related head-related transfer functions (HRTF) before reaching the cochlea, which encodes a head-centered target location. The ascending auditory pathway is tonotopically organized. Initial head position interacts in a frequency-specific way (connectivity strength indicated by circles) to represent a world-centered target representation in the population of narrow-band channels. To program the eye–head gaze shift, signals about current head and eye position interact with the world-centered target signal at the level of the tonotopic arrays, and at the SC gaze-motor map. The eye-centered gaze command thus depends on eye and head position. The head-motor command only depends on current eye position (light-gray arrow). In this way, the eye-in-space and the head are driven by different neural commands: ΔG and ΔH.
Notes
Supplemental material for this article is available at http://www.mbfys.ru.nl/∼johnvo/papers/jns2011b_suppl.pdf and includes analysis of the head-movement responses for eye–head gaze shifts in elevations toward broadband noise and pure tones. This material has not been peer reviewed.
Footnotes
This research was supported by the Radboud University Nijmegen (A.J.V.O.) and the Netherlands Organization for Scientific Research, NWO, Project Grant 805.05.003 ALW/VICI (A.J.V.O., T.J.V.G., M.M.V.W.). We thank Hans Kleijnen, Dick Heeren, and Stijn Martens for valuable technical assistance, and Maike Smeenk for participating in the data collection and analysis.
References
- Agterberg MJ, Snik AF, Hol MK, van Esch TE, Cremers CW, Van Wanrooij MM, Van Opstal AJ. Improved horizontal directional hearing in bone conduction device users with acquired unilateral conductive hearing loss. J Assoc Res Otolaryngol. 2011;12:1–11. doi: 10.1007/s10162-010-0235-2. [DOI] [PMC free article] [PubMed] [Google Scholar]
- Altmann CF, Wilczek E, Kaiser J. Processing of auditory location changes after horizontal head rotation. J Neurosci. 2009;29:13074–13078. doi: 10.1523/JNEUROSCI.1708-09.2009. [DOI] [PMC free article] [PubMed] [Google Scholar]
- Blauert J. Spatial hearing: the psychophysics of human sound localization. Cambridge, MA: MIT Press; 1997. Revised edition. [Google Scholar]
- Bremen P, van Wanrooij MM, van Opstal AJ. Pinna cues determine orienting response modes to synchronous sounds in elevation. J Neurosci. 2010;30:194–204. doi: 10.1523/JNEUROSCI.2982-09.2010. [DOI] [PMC free article] [PubMed] [Google Scholar]
- Chen LL. Head movements evoked by electrical stimulation in the frontal eye field of the monkey: evidence for independent eye and head control. J Neurophysiol. 2006;95:3528–3542. doi: 10.1152/jn.01320.2005. [DOI] [PubMed] [Google Scholar]
- Frens MA, Van Opstal AJ. A quantitative study of auditory-evoked saccadic eye movements in two dimensions. Exp Brain Res. 1995;107:103–117. doi: 10.1007/BF00228022. [DOI] [PubMed] [Google Scholar]
- Goossens HHLM, Van Opstal AJ. Human eye-head coordination in two dimensions under different sensorimotor conditions. Exp Brain Res. 1997;114:542–560. doi: 10.1007/pl00005663. [DOI] [PubMed] [Google Scholar]
- Goossens HHLM, Van Opstal AJ. Influence of head position on the spatial representation of acoustic targets. J Neurophysiol. 1999;81:2720–2736. doi: 10.1152/jn.1999.81.6.2720. [DOI] [PubMed] [Google Scholar]
- Groh JM, Trause AS, Underhill AM, Clark KR, Inati S. Eye position influences auditory responses in primate inferior colliculus. Neuron. 2001;29:509–518. doi: 10.1016/s0896-6273(01)00222-7. [DOI] [PubMed] [Google Scholar]
- Guitton D. Control of eye head coordination during orienting gaze shifts. Trends Neurosci. 1992;15:174–179. doi: 10.1016/0166-2236(92)90169-9. [DOI] [PubMed] [Google Scholar]
- Hartline PH, Vimal RLP, King AJ, Kurylo DD, Northmore DPM. Effects of eye position on auditory localization and neural representation of space in superior colliculus of cats. Exp Brain Res. 1995;104:402–408. doi: 10.1007/BF00231975. [DOI] [PubMed] [Google Scholar]
- Hofman PM, Van Opstal AJ. Spectro-temporal factors in two-dimensional human sound localization. J Acoust Soc Am. 1998;103:2634–2648. doi: 10.1121/1.422784. [DOI] [PubMed] [Google Scholar]
- Hofman PM, Van Opstal AJ. Bayesian reconstruction of sound localization cues from responses to random spectra. Biol Cybern. 2002;86:305–316. doi: 10.1007/s00422-001-0294-x. [DOI] [PubMed] [Google Scholar]
- Jay MF, Sparks DL. Auditory receptive fields in primate superior colliculus shift with changes in eye position. Nature. 1984;309:345–347. doi: 10.1038/309345a0. [DOI] [PubMed] [Google Scholar]
- Knudsen EI, Konishi M. Mechanisms of sound localization in the barn owl (Tyto alba) J Comp Physiol A Neuroethol Sens Neural Behav Physiol. 1979;133:13–21. [Google Scholar]
- Kopinska A, Harris LR. Spatial representation in body coordinates: evidence from errors in remembering positions of visual and auditory targets after active eye, head, and body movements. Can J Exp Psychol. 2003;57:23–37. doi: 10.1037/h0087410. [DOI] [PubMed] [Google Scholar]
- Kulkarni A, Colburn HS. Role of spectral detail in sound-source localization. Nature. 1998;396:747–749. doi: 10.1038/25526. [DOI] [PubMed] [Google Scholar]
- Langendijk EHA, Bronkhorst AW. Contribution of spectral cues to human sound localization. J Acoust Soc Am. 2002;112:1583–1596. doi: 10.1121/1.1501901. [DOI] [PubMed] [Google Scholar]
- Lewald J, Getzmann S. Horizontal and vertical effects of eye-position on sound localization. Hear Res. 2006;213:99–106. doi: 10.1016/j.heares.2006.01.001. [DOI] [PubMed] [Google Scholar]
- Metzger RR, Mullette-Gillman OA, Underhill AM, Cohen YE, Groh JM. Auditory saccades from different eye positions in the monkey: implications for coordinate transformations. J Neurophysiol. 2004;92:2622–2627. doi: 10.1152/jn.00326.2004. [DOI] [PubMed] [Google Scholar]
- Middlebrooks JC. Narrow-band sound localization related to external ear acoustics. J Acoust Soc Am. 1992;92:2607–2624. doi: 10.1121/1.404400. [DOI] [PubMed] [Google Scholar]
- Middlebrooks JC, Green DM. Sound localization by human listeners. Annu Rev Psychol. 1991;42:135–159. doi: 10.1146/annurev.ps.42.020191.001031. [DOI] [PubMed] [Google Scholar]
- Nagy B, Corneil BD. Representation of horizontal head-on-body position in the primate superior colliculus. J Neurophysiol. 2010;103:858–874. doi: 10.1152/jn.00099.2009. [DOI] [PubMed] [Google Scholar]
- Oertel D, Young ED. What's a cerebellar circuit doing in the auditory system? Trends Neurosci. 2004;27:104–110. doi: 10.1016/j.tins.2003.12.001. [DOI] [PubMed] [Google Scholar]
- Otake R, Saito Y, Suzuki M. The effect of eye position on the orientation of sound lateralization. Acta Otolaryngol. 2007;(Suppl 34–37) doi: 10.1080/03655230701595337. [DOI] [PubMed] [Google Scholar]
- Peck CK, Baro JA, Warder SM. Effects of eye position on saccadic eye movements and on the neuronal responses to auditory and visual stimuli in cat superior colliculus. Exp Brain Res. 1995;103:227–242. doi: 10.1007/BF00231709. [DOI] [PubMed] [Google Scholar]
- Populin LC. Monkey sound localization: head-restrained versus head-unrestrained orienting. J Neurosci. 2006;26:9820–9832. doi: 10.1523/JNEUROSCI.3061-06.2006. [DOI] [PMC free article] [PubMed] [Google Scholar]
- Populin LC, Tollin DJ, Yin TC. Effect of eye position on saccades and neuronal responses to acoustic stimuli in the superior colliculus of the behaving cat. J Neurophysiol. 2004;92:2151–2167. doi: 10.1152/jn.00453.2004. [DOI] [PubMed] [Google Scholar]
- Porter KK, Metzger RR, Groh JM. Representation of eye position in primate inferior colliculus. J Neurophysiol. 2006;95:1826–1842. doi: 10.1152/jn.00857.2005. [DOI] [PubMed] [Google Scholar]
- Rauschecker JP, Tian B. Mechanisms and streams for processing of “what” and “where” in auditory cortex. Proc Natl Acad Sci U S A. 2000;97:11800–11806. doi: 10.1073/pnas.97.22.11800. [DOI] [PMC free article] [PubMed] [Google Scholar]
- Razavi B, O'Neill WE, Paige GD. Auditory spatial perception dynamically realigns with changing eye position. J Neurosci. 2007;27:10249–10258. doi: 10.1523/JNEUROSCI.0938-07.2007. [DOI] [PMC free article] [PubMed] [Google Scholar]
- Sparks DL. Translation of sensory signals into commands for control of saccadic eye-movements: role of primate superior colliculus. Physiol Rev. 1986;66:118–171. doi: 10.1152/physrev.1986.66.1.118. [DOI] [PubMed] [Google Scholar]
- Tollin DJ, Populin LC, Moore JM, Ruhland JL, Yin TC. Sound-localization performance in the cat: the effect of restraining the head. J Neurophysiol. 2005;93:1223–1234. doi: 10.1152/jn.00747.2004. [DOI] [PubMed] [Google Scholar]
- Van Grootel TJ, Van Opstal AJ. Human sound-localization behaviour after multiple changes in eye position. Eur J Neurosci. 2009;29:2233–2246. doi: 10.1111/j.1460-9568.2009.06761.x. [DOI] [PubMed] [Google Scholar]
- Van Grootel TJ, Van Opstal AJ. Human sound localization accounts for ocular drift. J Neurophysiol. 2010;103:1927–1936. doi: 10.1152/jn.00958.2009. [DOI] [PubMed] [Google Scholar]
- Van Opstal AJ, Hepp K, Suzuki Y, Henn V. Influence of eye position on activity in monkey superior colliculus. J Neurophysiol. 1995;74:1593–1610. doi: 10.1152/jn.1995.74.4.1593. [DOI] [PubMed] [Google Scholar]
- Versnel H, Zwiers MP, Van Opstal AJ. Spectrotemporal response properties of inferior colliculus neurons in alert monkey. J Neurosci. 2009;29:9725–9739. doi: 10.1523/JNEUROSCI.5459-08.2009. [DOI] [PMC free article] [PubMed] [Google Scholar]
- Vliegen J, Van Grootel TJ, Van Opstal AJ. Dynamic sound localization during rapid eye-head gaze shifts. J Neurosci. 2004;24:9291–9302. doi: 10.1523/JNEUROSCI.2671-04.2004. [DOI] [PMC free article] [PubMed] [Google Scholar]
- Walton MMG, Bechara B, Gandhi NJ. Role of the primate superior colliculus in the control of head movements. J Neurophysiol. 2007;98:2022–2037. doi: 10.1152/jn.00258.2007. [DOI] [PMC free article] [PubMed] [Google Scholar]
- Wightman FL, Kistler DJ. Headphone simulation of free-field listening. II: Psychophysical validation. J Acoust Soc Am. 1989;85:868–878. doi: 10.1121/1.397558. [DOI] [PubMed] [Google Scholar]
- Yin TCT. Neural mechanisms of encoding binaural localization cues in the auditory brainstem. In: Oertel D, Fay RR, Popper AN, editors. Integrative functions in the mammalian auditory pathway. Heidelberg: Springer; 2002. pp. 99–159. [Google Scholar]
- Zwiers MP, Versnel H, Van Opstal AJ. Involvement of monkey inferior colliculus in spatial hearing. J Neurosci. 2004;24:4145–4156. doi: 10.1523/JNEUROSCI.0199-04.2004. [DOI] [PMC free article] [PubMed] [Google Scholar]


