

Abstract
Our tactual perception of roughness is independent of the manner in which we touch the surface. A brick surface feels rough no matter how slowly or how rapidly we move our fingers, despite the fluctuating sensory inputs that are transmitted to the finger. Current theories of roughness perception rely solely on inputs from the cutaneous afferents, which are highly affected by scan velocity and force. The question then is: how is roughness constancy achieved? To this end, we characterized the subject's perceived roughness in six scanning conditions. These included two modes of touch: direct touch, where the finger is in contact with the surface, and indirect touch, where the surface is scanned with a hand-held probe; and three scanning modes: active (moving the hand across a stationary surface), passive (moving the surface across a stationary hand), and pseudo-passive (subject's hand is moved by the experimenter across a stationary surface). Here, we show that roughness constancy is preserved during active but not passive scanning, indicating that the hand movement is necessary for roughness constancy in both direct and indirect touch. Roughness constancy is also preserved during pseudo-passive scanning, which stresses the importance of proprioceptive input. The results show that cutaneous input provides the signals necessary for roughness perception and that proprioceptive input resulting from hand movement—rather than a motor efference copy—is necessary to achieve roughness constancy. These findings have important implications in providing realistic sensory feedback for prosthetic-hand users.
Introduction
The brain has the capacity to maintain the perceptual constancy of colors, object sizes, contours, and sound levels in a shifting visual and auditory environment (von der Heydt et al., 1984; Kaufman et al., 2006; Eliades and Wang, 2008; Sadagopan and Wang, 2008). In the tactile system, Lederman (1974, 1983) showed that large changes in scanning velocity and contact force have only minimal effects on perceived roughness. However, what determines roughness constancy is not well understood. When subjects palpate surfaces with their fingers (direct touch), roughness is coded spatially by the differential activation of neighboring slowly adapting type 1 (SA1) mechanoreceptor afferents that innervate the finger (for review, see Johnson et al., 2002). Although both spatial and time-varying information from the afferent fibers are available when we scan a textured surface with the finger, changes in scanning velocity pose a problem, since the SA1 afferents increase their firing rate with increases in scanning velocity, which should result in increases in perceived roughness. Roughness is also perceived when surfaces are scanned indirectly with a probe (indirect touch) that is held in the hand (Lederman et al., 1999; Yoshioka et al., 2007). During this scanning mode, roughness is not coded spatially, but instead is coded temporally by vibrations that are transmitted through the probe to receptors in the hand. In the probe scanning mode, increases in scanning velocity change the transmitted vibration spectra and increase the magnitude of vibratory power. This should also increase in the perceived roughness of the surface.
In addition to the roles of spatial and temporal texture information on roughness perception, the mode of scanning (active vs passive) also appears to influence perceived roughness. Studies with direct touch have shown significant effects of scan velocity on perceived roughness during passive scans when the surface is moved and the finger is held stationary (Kudoh, 1988; Cascio and Sathian, 2001), but not during active scans when the finger is moved and the surface is held stationary (Lederman, 1974, 1983; Connor et al., 1990). This could be explained by the scanning mode. During active scanning, the subject has additional information from a motor efference copy of the desired hand movement and proprioceptive information that provides information of the position and speed of the movement. In addition, the previous studies used different types of stimuli (embossed dots, grating patterns, metal, or plastic), making it difficult to interpret how these stimuli might influence roughness perception in different scan conditions. In this paper, we determine the role of hand movement (active vs passive) and contact mode (direct vs indirect touch) in roughness constancy. We also tested subjects in a pseudo-passive scan mode where the experimenter moved the subject's hand, thus providing the subject with proprioceptive input but not a motor efference copy of the movement. We show that proprioceptive input from the hand movement and not motor efference copy is necessary to achieve tactile roughness constancy.
Materials and Methods
Subjects made magnitude estimations of surface roughness of seven texture stimuli (see Stimuli, below). The data were obtained in six different scanning conditions: active finger (AF), active probe (AP), passive finger (PF), passive probe (PP), pseudo-passive finger (PPF), and pseudo-passive probe (PPP). We initially examined perceived roughness in the first four conditions, and then added two pseudo-passive conditions to determine the role of proprioception during probe and finger scans. In addition, we obtained perceived roughness estimates of stationary drum surfaces with the static finger. Two different stimulus setups were used. In the passive scan experiments, textured surfaces were mounted on a servo-controlled drum that moved at a controlled velocity while the finger or probe was held stationary. In the active and pseudo-passive experiments, textured surfaces were mounted on a flat Plexiglas plate and the finger or probe scanned across the surface (Fig. 1). In all six scanning conditions, subjects were presented with the stimulus surface either to the distal finger pad of the index finger (direct touch) or to a probe held by the hand with a pencil-grip (indirect touch). The probe was made of Delrin plastic (10 cm long and 1 cm shaft diameter) with a tip diameter of 3 mm. The subjects could not see the surfaces during any of the experiments.
Figure 1.

A conundrum of perceptual roughness constancy. A, B, With increasing velocity, vibratory power (green) increases, but perceived roughness (purple) remains constant during active scan (A), but not during passive scan (B). The texture information transmitted to the hand is the same in both scanning conditions, with the increasing vibratory power (P0) of textured vibrations at higher scan velocities. Since the cutaneous tactile input to the hand is the same between two scanning conditions, the difference in perceived roughness must be due to hand movement during active scans. The probe scan condition illustrated here illuminates the role of vibrotactile information in roughness perception in that it eliminates the spatial surface information normally available during direct touch. The middle graphs show the vibrations of the probe at different velocities, illustrating that both amplitude and frequency spectra change as scan velocity increases. Note the progressive shift of the fundamental and harmonic frequency peaks. P0, Vibratory power expressed in logarithm; af, acceleration at frequency f; vf, velocity at frequency f. The vibrations illustrated here were obtained by scanning corduroy with an accelerometer mounted on a probe at three scanning velocities (40, 80, 160 mm/s). Modified from Yoshioka et al. (2009).
Psychophysical procedures
The procedure to obtain subjective magnitude estimates of texture roughness has been described in detail previously (Yoshioka et al., 2007). Briefly, in a given scanning condition, subjects were asked to rate perceived roughness using any positive number proportional to their subjective estimate of surface roughness. In the passive scanning condition, stimulus surfaces were presented on a moving drum at one of five velocities (20, 40, 80, 160, or 220 mm/s) at a constant contact force 1.5 ± 0.02 N SEM. A spot of light on the computer screen turned from red to green to indicate the beginning of a trial and that the surface was now contacting the probe or the finger, and the response was recorded on the computer. At the end of each trial, subjects reported their subjective magnitude estimate of the perceived roughness of the surface. Subjects were instructed to use a ratio scale and to provide a numerical score proportional to their perceived roughness estimate. For example, they were told to give a rating twice as large as the previous rating if the surface is felt to be twice as rough as the previous surface. The duration of stimulus presentation was <10 s, after which the trial was terminated. Texture surfaces were randomized within each block of five velocities and seven textures. Each stimulus condition was repeated six times. The data from the first block were regarded as a trial run and were discarded. Only the data from the next five blocks were analyzed.
The psychophysical task in the active and pseudo-passive scans was the same as in the passive scans. A flat textured surface rather than the drum was used (see Stimuli, below). In the active scan condition, the subjects scanned each textured surface at the constant velocity of 20, 40, 80, 160, or 220 mm/s by following a moving dot on the computer screen from left to the right once for the entire length of the surface (220 mm). The moving dot appeared ∼10 mm before the left edge of the stimulus surface so that the subjects could anticipate moving their hand when the dot reached the starting point of the surface. The subjects were instructed to use a moderate contact force in the active scan condition. In the pseudo-passive condition, the subject's hand was moved by the experimenter who followed the moving dot on the computer screen. All of the procedures were identical, as the active scan condition including the moderate force exerted by the experimenter on the subject's hand against the texture surface. The contact force was monitored by four force transducers placed at the four corners of the textured apparatus in both active and pseudo-passive conditions. The mean contact force was 1.7 ± 0.1 N SEM in the finger condition and 2.7 ± 0.1 N SEM in the probe scan condition, averaged across the seven textured surfaces, 10 subjects, and five repeats. The force exerted in the probe condition was higher than that in the finger condition, consistent with the previous observation by Lederman and colleagues (2004). The probe was made of the same material and had the same tip size as the probe used in the passive drum condition. The vibrations transmitted from the probe to the hand were measured using a triaxial accelerometer mounted to the top of the probe (model 8692B5, ±5 g range; Kistler).
Stimuli
Seven textured surfaces were used as stimuli. Textures were surfaces that are encountered in daily life: corduroy, vinyl, water color paper, denim, latex, rubber, and organza; and have been used in previous studies of roughness perception (Yoshioka et al., 2007). These stimuli were placed either on the moving drum or mounted on the flat Plexiglas surfaces. During all of the trials, subjects wore a pair of circumaural sealed headphones (HD280Pro; Sennheiser), which provided pink noise that masked any auditory cues.
Drum surface texture stimuli.
A rotating drum apparatus was used during the passive scans. Each texture had a width of 23 mm wrapped around a plastic drum with a 150 mm diameter. The drum surfaces moved up to contact either the distal pad of the index finger or the probe held by the hand. The subject's forearm rested on an arm rest, and their hand was extended through a curtain either to grip the probe or to position their finger pad in contact with the surface. The finger or a probe was placed through a small opening in an aluminum plate with soft sponge backing where the hand rested for positional stability. The drum velocity was controlled by a servo motor, and contact force was controlled by a torque motor and remained constant at 1.5 N. The probe was suspended over the drum surface with nylon strings that allowed the probe to freely move vertically but resisted lateral movements. The strings also kept the probe positioned perpendicular to the drum surface.
Flat surface texture stimuli.
In the active and pseudo-passive scanning conditions, the textures were mounted on flat 70 × 220 × 6 mm Plexiglas plates, except for the rubber texture, which did not require plastic plate backing. Corduroy was mounted with the texture ridges aligned perpendicular to the length of the plate.
Subjects
There were 10 subjects in each of the six experimental conditions (AF, AP, PF, PP, PPF, and PPP scans). In addition to these 60 subjects, we obtained perceived roughness estimates from an additional 10 subjects who touched stationary drum surfaces with their right index finger without lateral finger movement (static finger touch condition). All of the subjects were either graduate or undergraduate students recruited from The Johns Hopkins University. Their ages ranged from 18 to 30 years and there were equal numbers of female and male subjects. They were paid for their participation. All of the procedures were approved of by the Human Institutional Review Board of the Johns Hopkins University.
Data analyses
Psychophysical ratings.
The ratings from each trial were normalized by dividing each subject's response by the mean response of all trials within the block in each scanning condition. The means across all subjects were then computed for each texture surface. Statistical analyses were made by two-way ANOVA or t statistics, or for Pearson's linear correlation coefficient (Matlab; Mathworks).
Vibratory power definition.
The vibratory power of textured vibrations, Po, is proportional to the square of the velocity component, v, of the vibration, since the kinetic energy, Ek, of a moving object with a mass m is Ek = mv2. Since the velocity is computed as an integral of acceleration over time in the time domain or the acceleration divided by the frequency at each frequency in the FFT frequency domain, the vibratory power is proportional to the sum of the square of acceleration (af) and inversely proportional to the square of frequency at each frequency component (f) of the spectra.
 |
The logarithmic form of vibratory power, log (Po), is correlated with perceived roughness (Yoshioka et al., 2007), and is used in this study.
Generalized linear model.
To find a model that best explains the perceived roughness ratings in six different experimental scanning conditions, the generalized linear model was used (Netlab; http://www.ncrg.aston.ac.uk/netlab/index.php). The program uses an iterative reweighted least-squares algorithm to optimize the size of weights in the generalized linear model. The model estimates the subject's perceived roughness rating by computing the effects of velocity (V), spatial image of the surface (S) as captured by a sheet of mechanoreceptors in the finger pad, kinesthetic information (K) from hand movement, and interactive terms between V, S, and K. Kinesthetic information includes the information from hand movement, including motor efference copy (M) and proprioceptive (P) inputs. Within the proprioceptive inputs, the information about the instantaneous hand location is gathered from tendon, joint, skin, and muscle afferents. In the pseudo-passive condition in which there is little voluntary muscle movement, there is no contribution of motor efference copy of the movement since the subject was not in control of their arm; therefore, we set M = 0. In the probe condition, there was no spatial image of the surfaces detected by the finger pad, resulting in S = 0. In the passive scan in which there was no hand movement, we set K = 0. These are initial conditions used for the regression.
We initially conducted experiments using only four different scan conditions (AF, AP, PF, and PP), and then added PPF and PPP. We first wished to examine how V, S, K, and their interactive terms contribute to perceived roughness between active and passive scans and between finger and probe scans. We also wanted to reduce the complexity of the analyses in a limited set of scan conditions so that the contribution of each term within V, S, K, and their interactive terms would be clearer.
We therefore used the data from first four scan conditions (AF, AP, PF, and PP) to characterize the role of V, S, and K by adding each term one-by-one. In the four-condition model, predicted roughness, Rp, was expressed in the following equation.
 |
where V, S, and K represent the contributions from different scanning velocities, spatial texture image represented by static perceived roughness, and kinesthetic inputs, while S · V, K · V, and S · K represent their interactive terms. The term S · K · V was not significant, and was omitted. Coefficient vectors for the generalized linear model are denoted by a0, a1, … a6. The contribution of the velocity term is expressed as the first approximation based on the logarithmic scan velocities, log (20, 40, 80, 160, 220 mm/s).
We then expanded to a model using six conditions, including PPF and PPP. In the initial four-condition model (AF, AP, PF, and PP), active hand movement that represented both motor efference copy (M) and proprioceptive (P) inputs was treated as a single entity to convey kinesthetic information. In the six scan conditions in which PPF and PPP were added, we segregated the kinesthetic information into contributions from proprioception and motor efference copy. Predicted roughness, Rp is then represented by contributions from different inputs available to the hand.
 |
In this model, a fine tuning of the contributions of velocity term was made. In place of the velocity term a1 · V, we used a1 · Vp, which represents vibratory power Vp of textured vibrations that is a function of scanning velocity and energy, known to be correlated with perceived roughness (Yoshioka et al., 2007). In addition, we included the effect of velocity in other terms, S, M, and P. These represent the contributions from spatial texture image, motor efference copy, and proprioceptive inputs, while S · M and S · P represent their interactive terms. Free coefficient vectors for generalized linear model are denoted by a0, a1, … a6, and were obtained by regression with a least-square error. In this six-condition model, we also fine-tuned the variables S, M, and P by denoting with static terms (S0, M0, P0) that are independent of the velocity, and dynamic terms (SV, MV, PV) that are interactive with the velocity vector. The static mean-shifting indicators are static values, such as perceived roughness without movement of either the finger or surface (i.e., touching the stationary drum texture surfaces with the finger) in the case of spatial image vector S0. In other words, S0 is a vector of static perceived roughness for seven surfaces that were rated by 10 subjects. These normalized static roughness ratings were 1.93, 1.17, 0.47, 0.91, 1.04, 0.40, and 1.20, for corduroy, vinyl, paper, denim, latex, rubber, and organza, respectively. As for the motor efference copy and proprioception terms, M0 and P0 were simply conditional binary terms ([1] or [0]) depending on whether the hand was moved by the subject ([1 1]) or by the experimenter ([0 1]). In terms of scanning conditions, in PPF and PPP, P0 is 1, but M0 will be 0 since there is no voluntary hand movement, hence little motor efference copy. If there is no hand movement, M0 and P0 will be 0 ([0 0]). These static terms operate in tandem with their velocity-interacting counterparts SV, MV, and PV. For example, a2 · S is the sum a21S0 + a22SV. They serve as the functions related to the spatial image of textured surfaces and motor-related activities of nonzero gradient with a mean close to zero. SV is a column vector of perceived roughness obtained for seven textures presented at five velocities in the finger-scan conditions. The overall effect is a cancellation of the velocity, V, contribution under the active conditions, as observed in Figure 6. The criteria for model selection were both explanatory power and parsimony of expression, so a stepwise fitting approach was used. This rendered the contribution of the terms M · P and S · M · P negligible under the F statistic, where a p value of ≤0.05 was required. The mean of the predicted-roughness/observed-roughness correlations for each texture was taken as a suitable measure of fit along with the maximum corresponding p value.
Figure 6.
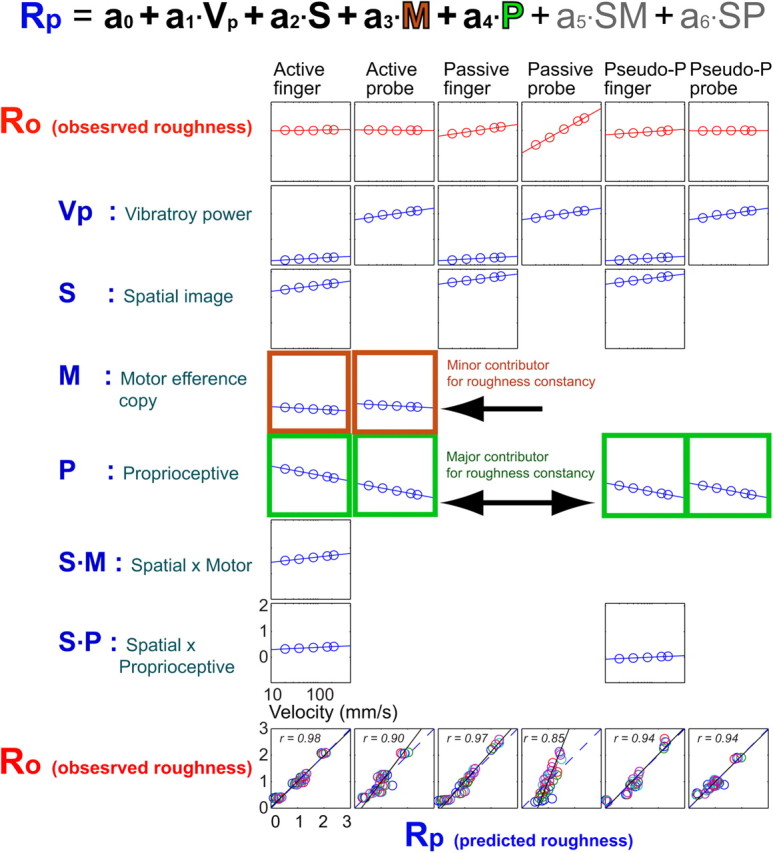
Relationship between the predicted perceived roughness and observed perceived roughness based on the generalized linear models with the contributions from velocity-linked vibratory power (Vp), spatial image (S), motor (M), proprioception (P), and their interactive terms (S · M and S · P). Proprioceptive inputs contribute more to roughness constancy than the motor efference copy does by reducing the velocity effect (i.e., increasing vibratory power by increasing velocities). Where the contribution of a particular component (Vp, S, M, P, or any interactive term) is not significant, no plot is shown. Perceived roughness is shown on the ordinate, and the log of scanning velocity (20, 40, 80, 160, 220 mm/s) is represented on the abscissa for the top seven rows. The data for six scanning conditions are shown: active finger, active probe, passive finger, passive probe, pseudo-passive finger, and pseudo-passive probe. The observed roughness ratings (Ro) are the average over seven texture stimuli for five velocities in each scanning condition. The predicted roughness ratings (Rp) are the sum of the contributions from Vp, S, M, P, and interactive terms S · M and S · P. Bottom, Correlations between observed (Ro) and predicted (Rp) roughness ratings for seven textures and five velocities in each scanning condition.
Results
We first compared perceived roughness in four scanning conditions (AF, AP, PF, and PP). We later added PPF and PPP to address the effect of proprioception alone. In all six scanning conditions, perceived roughness either increased linearly or was unaffected by velocity (Fig. 2). In the active scan conditions for both finger and probe scanning conditions, the perceived roughness was unaffected by scanning velocity (p = 0.213, two-way ANOVA, F(4,6) = 1.57 for the finger scan; p = 0.788, two-way ANOVA, F(4,6) = 0.43 for the probe scan; Table 1). The results indicate that the spatial input from the finger is not necessary for maintaining roughness constancy.
Figure 2.

Perceived roughness of seven texture surfaces was studied with five scanning velocities in six different scanning conditions. Perceived roughness ratings were relatively constant over different scanning velocities in pseudo-passive scans, indicating that the motor efference copy is not required for roughness constancy so long as the proprioceptive input is available. A, Texture surfaces were scanned in active, passive, and pseudo-passive conditions with the finger (direct touch) or a probe (indirect touch). In the pseudo-passive condition, the subject's hand was moved by the experimenter. B, The effect of scanning velocity on subjective magnitude estimates of surface roughness was small in the active scan and pseudo-passive scan. In the passive scan, increases in velocity increased the perceived roughness for most of the surfaces. Error bars are SEM across 10 subjects and five repeats in each condition (some bars are smaller than the data points).
Table 1.
Velocity dependence of perceived roughness for all seven texture surfaces in six scanning conditions
| Active finger |
Active probe |
Passive finger |
Passive probe |
Pseudo-passive finger |
Pseudo-passive probe |
||||||
|---|---|---|---|---|---|---|---|---|---|---|---|
| F(4,6) | p | F(4,6) | p | F(4,6) | p | F(4,6) | p | F(4,6) | p | F(4,6) | p |
| 1.575 | 0.213 | 0.427 | 0.788 | 10.045 | 6.3 × 10⁻⁵* | 115.749 | 2.6 × 10⁻¹⁵* | 2.627 | 0.060 | 0.412 | 0.798 |
Only passive scanning conditions show velocity dependence. Two-way ANOVA was used for all seven textures and five velocities. *High velocity dependence of perceived roughness.
Velocity had a large effect on perceived roughness when the surfaces were passively scanned with the probe (two-way ANOVA, F(4,6) = 115.7, p = 2.6 × 10⁻¹⁵), but much smaller, though significant, effects when passively scanned with the finger (two-way ANOVA, F(4,6) = 10.1, p = 6.3 × 10⁻⁵). The median slope of the velocity versus roughness curves for the passive finger condition was a third of that for the passive probe condition, indicating that the mechanisms of roughness perception with direct and indirect touch are different (Fig. 2B). Collectively, these observations indicate that the motor/proprioceptive information from the hand movement is necessary to achieve perceptual tactile roughness constancy.
To examine the roles of the motor efference copy and proprioceptive input, the pseudo-passive scanning experiment was performed. In the pseudo-passive condition, the experimenter moved subject's hand across the surface of the texture (see Materials and Methods, above). In this condition, the perceived roughness ratings were constant across different scanning velocities, indicating that the motor efference copy is not required and that proprioceptive input alone is needed for maintaining perceptual roughness constancy (two-way ANOVA, F(4,6) = 2.63, p = 0.060 for finger scan; F(4,6) = 0.41, p = 0.798 for probe scan; Fig. 2). The effects of velocity on perceived roughness are shown in Table 1 for all seven textures in each scanning condition.
The slopes of regression lines for the velocity versus roughness curves are positive for coarse surfaces, and either zero or slightly negative for smoother surfaces (Fig. 2B). The slopes are centered near zero with minimal spread in the active conditions and the full-width-half-maximum spreads of the slopes are significantly larger in the passive conditions (Fig. 3). The slopes in the pseudo-passive conditions are similar to those in the active conditions. The results of Kolmogorov–Smirnov test show that active and pseudo-passive conditions have similar slope distributions and differ significantly from the passive conditions, regardless of whether the surfaces were scanned with the finger or probe (Fig. 3B).
Figure 3.

Effects of velocity on perceived roughness. A, The distributions of slope magnitudes (computed from the velocity-perceived roughness plots in Fig. 2) represent the velocity effects on perceived roughness in six scan conditions. The peak centered near zero demonstrates roughness constancy with changes in scan velocity. Red numbers and arrows are median values. The spread of the slopes is expressed as full-width-half-maximum of Gaussian function by numbers in green. B, The Kolmogorov–Smirnov test shows that passive scans were different from active or pseudo-passive scans. Within the passive scans, the distribution of slopes differed significantly between the probe and finger conditions.
The effect of velocity varied among the surfaces within each condition (Table 2). In the pseudo-passive condition, there was a small effect of velocity for a few surfaces, though the overall effect across the seven surfaces was not significant.
Table 2.
Correlation coefficient (r) and p value between log(velocities) and perceived roughness in six scanning conditions
| Texture | Active finger |
Active probe |
Passive finger |
Passive probe |
Pseudo-passive finger |
Pseudo-passive probe |
||||||
|---|---|---|---|---|---|---|---|---|---|---|---|---|
| r | p | r | p | r | p | r | p | r | p | r | p | |
| Corduroy | 0.453 | 0.444 | −0.310 | 0.612 | 0.976 | 0.005* | 0.995 | 0.000* | 0.785 | 0.116 | 0.836 | 0.078 |
| Denim | 0.522 | 0.367 | 0.842 | 0.074 | 0.976 | 0.004* | 0.996 | 0.000* | 0.941 | 0.017* | 0.548 | 0.339 |
| Latex | 0.349 | 0.565 | −0.770 | 0.128 | 0.795 | 0.108 | 0.998 | 0.000* | −0.888 | 0.044* | −0.987 | 0.002* |
| Organza | −0.784 | 0.117 | −0.999 | 0.000* | 0.829 | 0.083 | 0.996 | 0.000* | 0.114 | 0.855 | −0.999 | 0.000* |
| Paper | 0.329 | 0.589 | 0.709 | 0.180 | 0.986 | 0.002* | 0.998 | 0.000* | 0.968 | 0.007* | 0.115 | 0.855 |
| Rubber | −0.947 | 0.014* | −0.600 | 0.284 | 0.851 | 0.068 | 0.990 | 0.001* | −0.964 | 0.008* | −0.699 | 0.189 |
| Vinyl | 0.953 | 0.012* | 0.478 | 0.416 | 0.979 | 0.004* | 0.998 | 0.000* | 0.927 | 0.024* | 0.932 | 0.021* |
*High velocity dependence of perceived roughness (p < 0.05).
Although the percepts of textures in finger and probe scans are qualitatively different, the subjects could reliably rate the subjective magnitudes of perceived roughness in both direct and indirect touch. To quantify the relationship between direct and indirect touch, we next examined the correlation between perceived roughness in the finger and probe scanning condition in active, passive, and pseudo-passive conditions. The perceived roughness ratings between finger and probe conditions were well correlated during active scans (r = 0.96, p = 1.95 × 10⁻¹⁹) and pseudo-passive scans (r = 0.98, p = 4.07 × 10⁻²⁵), but were weakly correlated during passive scans (r = 0.49, p = 0.003), indicating that roughness perception differs between the finger and probe conditions in the absence of proprioception (Fig. 4).
Figure 4.

Perceived roughness ratings between finger and probe conditions in active (left), passive (middle), and pseudo-passive (right) scans. Both active and pseudo-passive scans show high correlations between finger and probe scans, whereas the correlation is low in passive scans, indicating that the distribution of slopes (i.e., the degree of velocity effects on perceived roughness) differed between probe and finger conditions in passive scans. Each panel comprises 35 data points with seven textures and five scan velocities.
We next examined how various sensory and motor components contributed to perceived roughness. To do so, we analyzed the data in a two-stage process using a generalized linear model (see Materials and Methods, above). In the first stage, the analysis consists of a model that best explained the roughness ratings (R) with the contributions from scan velocity (V), spatial texture image (S), and kinesthetic (K) information from the hand movement based on four scanning conditions (AF, AP, PF, and PP; Fig. 5). We first examined which of V, S, K, or their combinations contributed most to the perceived roughness ratings, R. To do so, we characterized the data from the four scanning conditions to compare active versus passive scans as well as finger versus probe scans using a limited set of scanning conditions and information parameters. The use of only four scan conditions reduced the complexity of the initial analysis so that we could interpret the contributions of V, S, K, and their interactive terms more clearly as each term was added in the equation.
Figure 5.

Generalized linear models that predict the observed roughness ratings with the contributions from scan velocity (V), spatial texture image (S), and kinesthetic (K) information from the hand movement, which includes both motor and proprioceptive information, and their interactive terms. The models are based on the data from four scanning conditions (active finger, active probe, passive finger, and passive probe) with step-by-step inclusions of different terms (bold letters). Notice that when all the primary terms are included (V, S, K), the correlation between predicted perceived roughness and observed perceived roughness becomes significant (p < 0.05; top right). The solid diagonal lines are unitary lines, where the predicted and observed perceived roughness ratings are equal.
The analysis from the four scanning conditions (AF, AP, PF, and PP) provides a step-by-step analysis of the contribution of each sensory and kinesthetic parameter (Fig. 5). For example, the spatial texture image (S) predicts the observed perceived roughness only in the finger scan conditions (Fig. 5, top, second plot from the left), whereas the kinesthetic (K) information contributes to perceived roughness only in the active scan (Fig. 5, top, third plot from the left). Although velocity (V) contributes to perceived roughness in all four scan conditions (Fig. 5, top, left-most plot), none of these primary parameters (S, K, or V) alone were sufficient to predict the observed perceived roughness. The correlation between predicted and observed perceived roughness ratings became significant (p < 0.05) when all the primary terms were included (V, S, K). The addition of interactive terms (SV, KV, or SK) improved the correlation, but the improvements were minimal (Fig. 5).
The second stage model used all six scan conditions (AF, AP, PF, PP, PPF, and PPP). In this model, both observed and predicted roughness ratings were averaged over seven textures for each velocity (Fig. 6). The normalized roughness ratings had positive slopes with increasing velocity with both the vibratory power term (Vp) and the spatial image term (S), reflecting the velocity dependence of roughness ratings in both passive finger and passive probe conditions. These positive slopes in Vp and S terms were counterbalanced by the negative slopes in the motor efference copy (M) and proprioceptive terms (P). The negative slope of the proprioceptive terms was −0.341 in comparison with the slope of motor efference copy term (−0.099) in both the active finger and active probe scan conditions. In other words, the proprioceptive inputs counterbalanced the positive Vp and S slopes ∼3.4 times more than the M term did. In the pseudo-passive conditions (PPF and PPP), the proprioceptive terms were sole contributors to counterbalance the positive velocity effect of Vp or S. These results indicate that the proprioceptive inputs contribute to the maintenance of perceived roughness constancy by counteracting the velocity effect, which is characterized by increased vibratory power at high scanning velocities (Fig. 6). This sensorimotor integration appears to compensate for the changes in the sensory information when the scanning velocity is varied. It is well known that voluntary movement can suppress sensory activity; for examples, a suppression of sensory input during rodent whisking and a cancellation of self-produced tickle sensation (Blakemore et al., 1998; Lee et al., 2008). Although motor efference copy is widely believed to be the main source for this suppression of sensory information (Seki et al., 2003), proprioceptive input is another potential source of sensory modulation (Martin et al., 1990; Voisin et al., 2002), interacting with the cutaneous mechanoreceptive system (Berryman et al., 2006).
Discussion
We found that roughness constancy is achieved when the surface is scanned with either voluntary hand movements (active scan) or involuntary hand movements (pseudo-passive scan), but not in the passive scan when there is no hand movement. The existence of roughness constancy in the pseudo-passive scan condition indicates that proprioceptive information, and not motor efference copy, normalizes the cutaneous texture information to achieve constancy in the face of increases in the firing rate of the afferent fibers with increases in velocity (Goodwin et al., 1989). Roughness perception with direct touch is less affected by velocity than indirect touch because the SA1 afferents used in direct touch are less velocity- and acceleration-sensitive than the PC afferents that play a key role in sensing roughness with tools (Johnson and Hsiao, 1992; Looft, 1996; Yoshioka et al., 2007).
In considering the mechanisms underlying perception of surface roughness, it is important to distinguish perceived roughness from roughness constancy. Roughness constancy is a special case of roughness perception in which the perceived roughness rating is constant for a particular surface regardless of scanning conditions such as varying speed or contact force. Although the subjects were instructed to move their hands on the texture surface in the active scan by following a moving dot that appears on the computer screen, it is likely that the initial speed of the hand movement differs from the constant speed of the moving dot. To minimize this problem, the moving dot was presented before the edge of the texture surface so that the subject had time to prepare for the hand movement when the moving dot reached the left edge of the surface. In the study by Lederman and Taylor (1972), subjects moved their hands from side to side, and the mean velocity was computed for sinusoidal hand movements. Despite this fluctuating velocity profile, they observed minimal effects of velocity on perceived roughness. Similarly, the effect of force was small as well, within a small range of contact forces (Lederman and Taylor, 1972). The fluctuations of normal force used by our subjects were <6% in finger scans and <4% in probe scans across different textures and velocities. Although fluctuations in lateral force could also provide roughness information (Smith et al., 2002), the correlation between the psychophysical roughness measures and the coefficient of friction (coefficient of friction = lateral force/normal force) is not as high as the correlation between perceived roughness and the spatial variation in firing between SA1 afferents during direct touch or vibratory power of textured vibrations during indirect touch, indicating that the scanning force does not play a meaningful role inr roughness perception (Yoshioka et al., 2001, 2007).
Perceived roughness has been studied psychophysically (Lederman and Taylor, 1972; Taylor and Lederman, 1975; Kudoh, 1988; Sathian et al., 1989; Cascio and Sathian, 2001; Gamzu and Ahissar, 2001) and neurophysiologically (Connor et al., 1990; Connor and Johnson, 1992; Goodwin, 1993; Burton and Sinclair, 1994; Blake et al., 1997; Meftah et al., 2000; Pruett et al., 2001; Yoshioka et al., 2001) to examine spatial and temporal roles of texture perception. Those studies, using raised dot patterns, grating patterns, or sandpapers, have shown in large part that the magnitude of perceived roughness is not proportional to the size of dot-to-dot spacing or gap width in a grating pattern in a simple way. Neurophysiological coding studies using a wide range of textured surfaces show that roughness perception is mediated by SA1 mechanoreceptors during direct touch (Connor et al., 1990; Connor and Johnson, 1992; Blake et al., 1997; Yoshioka et al., 2001). However, SA1s do not respond to textured vibrations that are transmitted to the hand through a large-diameter (10 mm) probe tip (Yoshioka et al., 2008). Therefore, the neural mechanisms underlying roughness perception are different between direct and indirect touch. To achieve roughness constancy, our study shows that the surface information processed by different mechanoreceptive neurons must be normalized by proprioceptive inputs generated by hand movement. Such a scenario can be achieved in cortical areas such as primary or secondary somatosensory cortex where cutaneous and proprioceptive inputs converge in the macaque brain (Kim et al., 2005), or in cortical areas such as the posterior insula and parietal operculum (human area SII) (Eickhoff et al., 2006) that have been reported in imaging studies in humans to respond to textured stimuli (Stilla and Sathian, 2008; Sathian et al., 2011). This invariance of perceived tactile roughness under different scanning conditions is similar to texture constancy in vision, in which textured surfaces are viewed in a contrast-independent manner (Stetter and Lang, 2004). Although the mechanisms to maintain perceptual constancy must be different between vision and touch, our nervous system appears to possess appropriate architecture to attain perceptual constancy, resulting in our ability to perceive the world with less susceptibility to changes in environment and the ways in which we sense an object (Stetter and Lang, 2004; Taylor-Clarke et al., 2004; Kaufman et al., 2006).
The involvement of proprioception or motor information in modulating sensory information has been reported in the somatosensory system (Chapman and Beauchamp, 2006), and our study provides data that help explain the mechanisms of perceptual roughness constancy in touch. Within the proprioceptive inputs, the source of the inputs could be muscle afferents or joint receptors (Bosco and Poppele, 2001). Previous studies also indicated that the cutaneous receptors in the skin provide important kinesthetic and position information of hand movements (Hulliger et al., 1979; Gandevia, 1985; Burke et al., 1988; Edin, 2004; Johnson, 2004). It is feasible that the cortical areas could integrate exteroceptive and proprioceptive information that both originated from cutaneous afferents. When an amputee uses advanced prosthetic arms equipped with sensory feedback, tactile sensation could be restored by microstimulation of the remaining afferent fibers (Vallbo and Johansson, 1984), neurons in the thalamus (Patel et al., 2006), or the somatosensory cortex (O'Doherty et al., 2009). To achieve perceptual constancy of texture surface roughness with such a prosthetic hand system, the stimulation of proprioceptive system should be taken into consideration, as well as the activation of the cutaneous mechanoreceptive system.
Footnotes
This work was supported by National Institutes of Health R01 Grants NS054180 (to T.Y.) and NS18787 and NS34086 (to S.S.H.). We thank Frank Dammann, Justin Killebrew, Zhicheng Lai, Christian Moses, and Hao Lei for technical support; Bill Nash and Bill Quinlan for assistance with the design and construction of the experimental apparatus; Smita Mohan, Julia Zhou, Austin Chen, Jonathan Torres, and Yuho Doh for assistance with the data collection; and Natalie Trzcinski, Jeff Pompe, and Julie Yoshioka for valuable comments on the manuscript.
References
- Berryman LJ, Yau JM, Fitzgerald PJ, Hsiao SS. Representation of object size, compliance, and curvature in the first and second somatosensory cortex. Soc Neurosci Abstr. 2006;32:804–11. [Google Scholar]
- Blake DT, Hsiao SS, Johnson KO. Neural coding mechanisms in tactile pattern recognition: the relative contributions of slowly and rapidly adapting mechanoreceptors to perceived roughness. J Neurosci. 1997;17:7480–7489. doi: 10.1523/JNEUROSCI.17-19-07480.1997. [DOI] [PMC free article] [PubMed] [Google Scholar]
- Blakemore SJ, Wolpert DM, Frith CD. Central cancellation of self-produced tickle sensation. Nat Neurosci. 1998;1:635–640. doi: 10.1038/2870. [DOI] [PubMed] [Google Scholar]
- Bosco G, Poppele RE. Proprioception from a spinocerebellar perspective. Physiol Rev. 2001;81:539–568. doi: 10.1152/physrev.2001.81.2.539. [DOI] [PubMed] [Google Scholar]
- Burke D, Gandevia SC, Macefield G. Responses to passive movement of receptors in joint, skin and muscle of the human hand. J Physiol. 1988;402:347–361. doi: 10.1113/jphysiol.1988.sp017208. [DOI] [PMC free article] [PubMed] [Google Scholar]
- Burton H, Sinclair RJ. Representation of tactile roughness in thalamus and somatosensory cortex. Can J Physiol Pharmacol. 1994;72:546–557. doi: 10.1139/y94-079. [DOI] [PubMed] [Google Scholar]
- Cascio CJ, Sathian K. Temporal cues contribute to tactile perception of roughness. J Neurosci. 2001;21:5289–5296. doi: 10.1523/JNEUROSCI.21-14-05289.2001. [DOI] [PMC free article] [PubMed] [Google Scholar]
- Chapman CE, Beauchamp E. Differential controls over tactile detection in humans by motor commands and peripheral reafference. J Neurophysiol. 2006;96:1664–1675. doi: 10.1152/jn.00214.2006. [DOI] [PubMed] [Google Scholar]
- Connor CE, Johnson KO. Neural coding of tactile texture: comparison of spatial and temporal mechanisms for roughness perception. J Neurosci. 1992;12:3414–3426. doi: 10.1523/JNEUROSCI.12-09-03414.1992. [DOI] [PMC free article] [PubMed] [Google Scholar]
- Connor CE, Hsiao SS, Phillips JR, Johnson KO. Tactile roughness: neural codes that account for psychophysical magnitude estimates. J Neurosci. 1990;10:3823–3836. doi: 10.1523/JNEUROSCI.10-12-03823.1990. [DOI] [PMC free article] [PubMed] [Google Scholar]
- Edin BB. Quantitative analyses of dynamic strain sensitivity in human skin mechanoreceptors. J Neurophysiol. 2004;92:3233–3243. doi: 10.1152/jn.00628.2004. [DOI] [PubMed] [Google Scholar]
- Eickhoff SB, Amunts K, Mohlberg H, Zilles K. The human parietal operculum. II. Stereotaxic maps and correlation with functional imaging results. Cereb Cortex. 2006;16:268–279. doi: 10.1093/cercor/bhi106. [DOI] [PubMed] [Google Scholar]
- Eliades SJ, Wang X. Neural substrates of vocalization feedback monitoring in primate auditory cortex. Nature. 2008;453:1102–1106. doi: 10.1038/nature06910. [DOI] [PubMed] [Google Scholar]
- Gamzu E, Ahissar E. Importance of temporal cues for tactile spatial-frequency discrimination. J Neurosci. 2001;21:7416–7427. doi: 10.1523/JNEUROSCI.21-18-07416.2001. [DOI] [PMC free article] [PubMed] [Google Scholar]
- Gandevia SC. Illusory movements produced by electrical stimulation of low-threshold muscle afferents from the hand. Brain. 1985;108:965–981. doi: 10.1093/brain/108.4.965. [DOI] [PubMed] [Google Scholar]
- Goodwin AW. The code for roughness: comparing psychophysical measurement in humans with neural recordings in monkeys points to a neural code for tactile roughness. Curr Biol. 1993;3:378–379. doi: 10.1016/0960-9822(93)90207-5. [DOI] [PubMed] [Google Scholar]
- Goodwin AW, John KT, Sathian K, Darian-Smith I. Spatial and temporal factors determining afferent fiber responses to a grating moving sinusoidally over the monkey's fingerpad. J Neurosci. 1989;9:1280–1293. doi: 10.1523/JNEUROSCI.09-04-01280.1989. [DOI] [PMC free article] [PubMed] [Google Scholar]
- Hulliger M, Nordh E, Thelin AE, Vallbo ÅB. The responses of afferent fibres from the glabrous skin of the hand during voluntary finger movements in man. J Physiol. 1979;291:233–249. doi: 10.1113/jphysiol.1979.sp012809. [DOI] [PMC free article] [PubMed] [Google Scholar]
- Johnson K. Closing in on the neural mechanisms of finger joint angle sense. J Neurophysiol. 2004;92:3167–3168. doi: 10.1152/jn.00724.2004. [DOI] [PubMed] [Google Scholar]
- Johnson KO, Hsiao SS. Neural mechanisms of tactual form and texture perception. Annu Rev Neurosci. 1992;15:227–250. doi: 10.1146/annurev.ne.15.030192.001303. [DOI] [PubMed] [Google Scholar]
- Johnson KO, Hsiao SS, Yoshioka T. Neural coding and the basic law of psychophysics. Neuroscientist. 2002;8:111–121. doi: 10.1177/107385840200800207. [DOI] [PMC free article] [PubMed] [Google Scholar]
- Kaufman L, Kaufman JH, Noble R, Edlund S, Bai S, King T. Perceptual distance and the constancy of size and stereoscopic depth. Spat Vis. 2006;19:439–457. doi: 10.1163/156856806778457377. [DOI] [PubMed] [Google Scholar]
- Kim S.S, Fitzgerald PJ, Thakur PH, Berryman LJ, Yau J, Hsiao SS. Integration of spatial form across fingers in the second somatosensory cortex (SII) of the awake monkey. Soc Neurosci Abstr. 2005;31:985–3. [Google Scholar]
- Kudoh N. Tactile perception of textured surfaces: effects of temporal frequency on perceived roughness by passive touch. Tohoku Psychologica Folia. 1988;47:21–28. [Google Scholar]
- Lederman SJ. Tactile roughness of grooved surfaces: the touching process and the effects of macro- and microsurface structure. Percept Psychophys. 1974;16:385–395. [Google Scholar]
- Lederman SJ. Tactual roughness perception: spatial and temporal determinants. Can J Psychol. 1983;37:498–511. [Google Scholar]
- Lederman SJ, Taylor MM. Fingertip force, surface geometry, and the perception of roughness by active touch. Percept Psychophys. 1972;12:401–408. [Google Scholar]
- Lederman SJ, Klatzky RL, Hamilton CL, Ramsay GI. Perceiving surface roughness via a rigid probe: psychophysical effects of exploration speed and mode of touch. Electr J Hapt Res. 1999;1:1–20. [Google Scholar]
- Lederman SJ, Howe RD, Klatzky RL, Hamilton CL. Force variability during surface contact with bare finger or rigid probe. Paper presented at HAPTICS 2004: 12th International Symposium on Haptic Interfaces for Virtual Environment and Teleoperator Systems; March; Chicago, IL. 2004. [Google Scholar]
- Lee S, Carvell GE, Simons DJ. Motor modulation of afferent somatosensory circuits. Nat Neurosci. 2008;11:1430–1438. doi: 10.1038/nn.2227. [DOI] [PMC free article] [PubMed] [Google Scholar]
- Looft FJ. Response of monkey glabrous skin mechanoreceptors to random noise sequences: III. Spectral analysis. Somatosens Mot Res. 1996;13:235–244. doi: 10.3109/08990229609052579. [DOI] [PubMed] [Google Scholar]
- Martin BJ, Roll JP, Hugon M. Modulation of cutaneous flexor responses induced in man by vibration-elicited proprioceptive or exteroceptive inputs. Aviat Space Environ Med. 1990;61:921–928. [PubMed] [Google Scholar]
- Meftah el-M, Belingard L, Chapman CE. Relative effects of the spatial and temporal characteristics of scanned surfaces on human perception of tactile roughness using passive touch. Exp Brain Res. 2000;132:351–361. doi: 10.1007/s002210000348. [DOI] [PubMed] [Google Scholar]
- O'Doherty JE, Lebedev MA, Hanson TL, Fitzsimmons NA, Nicolelis MA. A brain-machine interface instructed by direct intracortical microstimulation. Front Integr Neurosci. 2009;3:20. doi: 10.3389/neuro.07.020.2009. [DOI] [PMC free article] [PubMed] [Google Scholar]
- Patel S, Ohara S, Dougherty PM, Gracely RH, Lenz FA. Psychophysical elements of place- and modality-specificity in the thalamic somatic sensory nucleus (ventral caudal, vc) of awake humans. J Neurophysiol. 2006;95:646–659. doi: 10.1152/jn.00756.2005. [DOI] [PubMed] [Google Scholar]
- Pruett JR, Jr, Sinclair RJ, Burton H. Neural correlates for roughness choice in monkey second somatosensory cortex (SII) J Neurophysiol. 2001;86:2069–2080. doi: 10.1152/jn.2001.86.4.2069. [DOI] [PubMed] [Google Scholar]
- Sadagopan S, Wang X. Level invariant representation of sounds by populations of neurons in primary auditory cortex. J Neurosci. 2008;28:3415–3426. doi: 10.1523/JNEUROSCI.2743-07.2008. [DOI] [PMC free article] [PubMed] [Google Scholar]
- Sathian K, Goodwin AW, John KT, Darian-Smith I. Perceived roughness of a grating: correlation with responses of mechanoreceptive afferents innervating the monkey's fingerpad. J Neurosci. 1989;9:1273–1279. doi: 10.1523/JNEUROSCI.09-04-01273.1989. [DOI] [PMC free article] [PubMed] [Google Scholar]
- Sathian K, Lacey S, Stilla R, Gibson GO, Deshpande G, Hu X, Laconte S, Glielmi C. Dual pathways for haptic and visual perception of spatial and texture information. Neuroimage. 2011;57:462–475. doi: 10.1016/j.neuroimage.2011.05.001. [DOI] [PMC free article] [PubMed] [Google Scholar]
- Seki K, Perlmutter SI, Fetz EE. Sensory input to primate spinal cord is presynaptically inhibited during voluntary movement. Nat Neurosci. 2003;6:1309–1316. doi: 10.1038/nn1154. [DOI] [PubMed] [Google Scholar]
- Smith AM, Chapman CE, Deslandes M, Langlais JS, Thibodeau MP. Role of friction and tangential force variation in the subjective scaling of tactile roughness. Exp Brain Res. 2002;144:211–223. doi: 10.1007/s00221-002-1015-y. [DOI] [PubMed] [Google Scholar]
- Stetter M, Lang E. Modeling texture-constancy of cortical grating cells. Neurocomputing. 2004;58- 60:835–841. [Google Scholar]
- Stilla R, Sathian K. Selective visuo-haptic processing of shape and texture. Hum Brain Mapp. 2008;29:1123–1138. doi: 10.1002/hbm.20456. [DOI] [PMC free article] [PubMed] [Google Scholar]
- Taylor MM, Lederman SJ. Tactile roughness of grooved surfaces: a model and the effect of friction. Percept Psychophys. 1975;17:23–36. [Google Scholar]
- Taylor-Clarke M, Jacobsen P, Haggard P. Keeping the world a constant size: object constancy in human touch. Nat Neurosci. 2004;7:219–220. doi: 10.1038/nn1199. [DOI] [PubMed] [Google Scholar]
- Vallbo ÅB, Johansson RS. Properties of cutaneous mechanoreceptors in the human hand related to touch sensation. Hum Neurobiol. 1984;3:3–14. [PubMed] [Google Scholar]
- Voisin J, LaMarre Y, Chapman CE. Haptic discrimination of object shape in humans: contribution of cutaneous and proprioceptive inputs. Exp Brain Res. 2002;145:251–260. doi: 10.1007/s00221-002-1118-5. [DOI] [PubMed] [Google Scholar]
- von der Heydt R, Peterhans E, Baumgartner G. Illusory contours and cortical neuron responses. Science. 1984;224:1260–1262. doi: 10.1126/science.6539501. [DOI] [PubMed] [Google Scholar]
- Yoshioka T, Gibb B, Dorsch AK, Hsiao SS, Johnson KO. Neural coding mechanisms underlying perceived roughness of finely textured surfaces. J Neurosci. 2001;21:6905–6916. doi: 10.1523/JNEUROSCI.21-17-06905.2001. [DOI] [PMC free article] [PubMed] [Google Scholar]
- Yoshioka T, Bensmaïa SJ, Craig JC, Hsiao SS. Texture perception through direct and indirect touch: an analysis of perceptual space for tactile textures in two modes of exploration. Somatosens Mot Res. 2007;24:53–70. doi: 10.1080/08990220701318163. [DOI] [PMC free article] [PubMed] [Google Scholar]
- Yoshioka T, Gwilliam J, Craig JC, Hsiao SS. Neural coding of tactile texture roughness through hand-held probes. Soc Neurosci Abstr. 2008;34:775–1. [Google Scholar]
- Yoshioka T, Craig JC, Beck GC, Hsiao SS. Perceptual constancy of tactile texture roughness. Soc Neurosci Abstr. 2009;35:175–1. doi: 10.1523/JNEUROSCI.3907-11.2011. [DOI] [PMC free article] [PubMed] [Google Scholar]