

Abstract
In early postnatal development, perisomatic innervation of cerebellar Purkinje cells (PCs) switches from glutamatergic climbing fibers (CFs) to GABAergic basket cell fibers (BFs). Here we examined the switching process in C57BL/6 mice. At postnatal day 7 (P7), most perisomatic synapses were formed by CFs on to somatic spines. The density of CF–spine synapses peaked at P9, when pericellular nest around PCs by CFs was most developed, and CF–spine synapses constituted 88% of the total perisomatic synapses. Thereafter, CF–spine synapses dropped to 63% at P12, 6% at P15, and <1% at P20, whereas BF synapses increased reciprocally. During the switching period, a substantial number of BF synapses existed as BF–spine synapses (37% of the total perisomatic synapses at P15), and free spines surrounded by BFs or Bergmann glia also emerged. By P20, BF–spine synapses and free spines virtually disappeared, and BF–soma synapses became predominant (88%), thus attaining the adult pattern of perisomatic innervation. Parallel with the presynaptic switching, postsynaptic receptor phenotype also switched from glutamatergic to GABAergic. In the active switching period, particularly at P12, fragmental clusters of AMPA-type glutamate receptor were juxtaposed with those of GABAA receptor. When examined with serial ultrathin sections, immunogold labeling for glutamate and GABAA receptors was often clustered beneath single BF terminals. These results suggest that a considerable fraction of somatic spines is succeeded from CFs to BFs and Bergmann glia in the early postnatal period, and that the switching of postsynaptic receptor phenotypes mainly proceeds under the coverage of BF terminals.
Introduction
Principal neurons construct the main neuronal circuits to convey their outputs to remote regions, while diverse classes of interneurons provide functional balance, complexity, and computational architecture to principal neurons (Buzsáki et al., 2004; Huang et al., 2007). In particular, inhibitory interneurons innervating perisomatic regions of principal neurons exert powerful influence upon the firing of individual principal neurons and the oscillation of network activities (Freund 2003; Markram et al., 2004; Howard et al., 2005). In immature brains, GABAergic synapses are often formed before glutamatergic innervation and promote neural development through transient excitatory action (Ben-Ari, 2002; Owens and Kriegstein, 2002).
In the cerebellar cortex, basket cells exert strong inhibition to Purkinje cells (PCs) through GABAergic perisomatic synapses (Palay and Chan-Palay, 1974; Gianola et al., 2003). PCs are unique in that perisomatic innervation by basket cell fibers (BFs) in adulthood is preceded by transient innervation by glutamatergic climbing fibers (CFs) (Larramendi, 1969; Altman, 1972). From around at birth, CFs form synapses on to perisomatic protrusions or thorns of PCs and constitute a dense plexus called the pericellular nest or nid (Ramon y Cajal, 1911; Larramendi, 1969; Altman, 1972; Chedotal and Sotelo, 1992, 1993; Morara et al., 2001). The nest represents innervation by multiple CFs to individual PCs (Hashimoto et al., 2009). By the end of the second postnatal week, monoinnervation by single CFs is established in most PCs by dendritic translocation of single “winner” CFs and subsequent massive elimination of perisomatic CF synapses (Hashimoto et al., 2009). Almost simultaneously, BFs descend to establish perisomatic innervation (Larramendi and Victor, 1967; Yan and Ribak, 1998; Rosina et al., 1999; Ango et al., 2004; Takayama and Inoue, 2005) and further construct the pinceau formation around the axon initial segment in the third postnatal week (Ango et al., 2004; Sotelo, 2008).
In adulthood, glutamatergic CF synapses are virtually confined to dendritic spines expressing AMPA-type glutamate receptor GluA1–3 subunits (Masugi-Tokita et al., 2007; Yamasaki et al., 2011), while GABAergic BF synapses are on the flat somatic and dendritic surface, at which GABAA receptor α1 subunit (GABAARα1) is condensed (Laurie et al., 1992; Viltono et al., 2008). In GABAARα1 knock-out mice and tetrodotoxin-infused rats, heterologous GABAergic synapses are formed on to dendritic spines that express glutamate receptors GluA2/3 and GluD2 (Morando et al., 2001; Fritschy et al., 2006: Cesa et al., 2008).
All these findings suggest that perisomatic synapses in immature PCs undergo dynamic reorganization both structurally and neurochemically, and their transmitter-to-receptor matching is achieved through neuronal activity and trans-synaptic communication (Fritschy and Brunig, 2003). However, developmental process of the synaptic reorganization remains elusive. In the present study, we used serial electron microscopy and immunohistochemistry to address how structural and receptor phenotypes of perisomatic PC synapses switch during the CF-to-BF switchover. Here we report that somatic spines initially innervated by CFs are taken over by BFs and Bergmann glia (BGs) for a while, and that the switching of postsynaptic receptor phenotypes proceeds with that of presynaptic elements under the coverage of BF terminals.
Materials and Methods
Three C57BL/6J mice at postnatal day 7 (P7), P9, P12, P15, and P20 were used for each of qualitative and quantitative analyses. All animal experiments were performed according to the guidelines for the care and use of laboratory animals of the Sapporo Medical University School of Medicine and Hokkaido University School of Medicine.
Tracer labeling and fixation.
Under chloral hydrate anesthesia (350 mg/kg body weight, i.p.), biotinylated dextran amine (BDA; molecular weight, 10,000; Invitrogen) was injected by the dorsal approach (Ichikawa et al., 2002). Briefly, a 1 MΩ resistance glass pipette, which was filled with 0.5 μl of 10% BDA dissolved in PBS, pH 7.4, was inserted into the right medial accessory olivary nucleus, and BDA was iontophoretically applied by a 7 μA positive current for 15 min with a protocol of 700 ms on and 1300 ms off. After 48 h of survival, transcardial perfusion was conducted under chloral hydrate anesthesia using 4% paraformaldehyde in 0.1 m phosphate buffer (PB), pH 7.4, for light microscopy or with 0.1% glutaraldehyde/4% paraformaldehyde in PB for electron microscopy. For immunofluorescence and postembedding immunogold microscopy, mice were fixed by transcardial perfusion with 4% paraformaldehyde in 0.1 m PB. Cerebella were removed quickly and immersed overnight in the same fixative, followed by a rinse in PB for at least a day. All analyses were done in the lobules 4/5 and 6 of the left vermal cerebellum.
Antibodies.
We used the following antibodies: rabbit anti-calbindin antiserum (Nakagawa et al., 1998), guinea pig anti-vesicular inhibitory amino acid transporter (VIAAT) (Miyazaki et al., 2003), guinea pig anti-type-2 vesicular glutamate transporter (VGluT2) (Miyazaki et al., 2003), rabbit anti-glutamate receptor subunit GluA2 (GluR2 or GluRα2) (Fukaya et al., 2006), rabbit anti-postsynaptic density (PSD) protein PSD-95 (Fukaya and Watanabe, 2000), rabbit and guinea pig anti-GABAARα1, rabbit anti-gephyrin, and guinea pig pan-AMPA receptor antibodies. Affinity-purified GABAARα1 and gephryin antibodies were produced in the present study against synthetic peptide of 369–386 aa residues of mouse GABAARα1 subunit (PTATSYTPNLARGDPGLAC), which is low sequence similarity to other GABAAα subunits, and against glutathione S-transferase fusion protein encoding 1–45 or 54–94 aa residues of mouse gephyrin (GenBank accession number NM_172952). The specificity was checked by immunoblot using the PSD fraction of adult mouse brains and HEK293 cell lysates transfected with the pTracer-CMV2 mammalian expression plasmid vector (Invitrogen) encoding mouse GABAARα1, GABAARα2, or gephyrin cDNA.
Light microscopy.
BDA-injected microslicer sections (50 μm thickness; MAN52; Campden) were prepared from the cerebellar vermis in the parasagittal plane. They were immunoreacted overnight with calbindin antiserum (1:10,000 dilution) and VIAAT antibody (1 μg/ml), followed by 4 h incubation with a mixture of Alexa Fluor 594-conjugated streptavidin, Alexa Fluor 488-conjugated goat anti-rabbit IgG (1:200; Invitrogen), and Cy5-labeled anti-guinea pig IgG (1:200; Jackson ImmunoResearch) to visualize CFs, PCs, and inhibitory fibers (mostly GABAergic fibers in the cerebellar molecular layer), respectively. Fluorescent images were taken with a confocal laser scanning microscope (R2100Ag2; Bio-Rad).
Immunofluorescence for GluA2, GABAARα1, PSD-95, and gephyrin was applied to paraffin sections (see Figs. 8, 9). For antigen exposure, sections were predigested with 1 mg/ml pepsin in 0.2N HCl for 6–10 min (Fukaya and Watanabe, 2000). Sections were incubated with 10% normal donkey serum for 20 min, a mixture of primary antibodies overnight (1 μg/ml for each), and a mixture of secondary antibodies for 2 h as above. Images were taken with a laser scanning microscope (FV1000; Olympus) equipped with an HeNe/Ar laser system. To avoid bleed through into adjacent detection channels, Alexa 488, Cy3, and Cy5 were excited sequentially using the 488, 543, and 633 nm excitation laser lines, respectively, and emissions were collected using the spectral detection system configured with a galvanometer diffraction grating in combination with a variable slit for high-resolution wavelength separation. Images were acquired using a PlanApoN (60×/1.42 oil immersion) objective lens (Olympus) with a 3× digital zoom and an appropriated pinhole to obtain 1 Airy unit for 496–508 nm emission wavelengths (optical section thickness, 1.0 μm). For maximum-intensity z-projection images, 7–11 optical sections were taken at an interval of 0.5 μm. Images were captured with confocal software (FV10-ASW, version 1.7; Olympus), digitized at 12 bit resolution into an array of 640 × 640 pixels (pixel size, 0.1 μm).
Figure 8.

Double immunofluorescence showing developmental switching of postsynaptic receptor phenotypes in PC somata. A1–A3, P7. B1–B3, P9. C1–C3, F, G1, G2, P12. D1–D3, P15. E1–E3, P20. Double immunofluorescence was applied to paraffin sections for GluA2 (red) and GABAARα1 (green) in A1–E3, GluA2 (red) and PSD-95 (green) in F, and gephyrin (red) and GABAARα1 (green) in G1 and G2. Arrows in A1–E3 indicate some GABAARα1 clusters lacking GluA2 labeling. Arrowheads in C1 indicate fragmental GluA2 clusters, which are apposed closely to or piled up on GABAARα1 clusters. Arrows and arrowheads in G1 and G2 indicate somatic or dendritic clusters, respectively, that coexpress GABAARα1 and gephyrin. Asterisks indicate PC somata. Scale bars: 10 μm.
Figure 9.
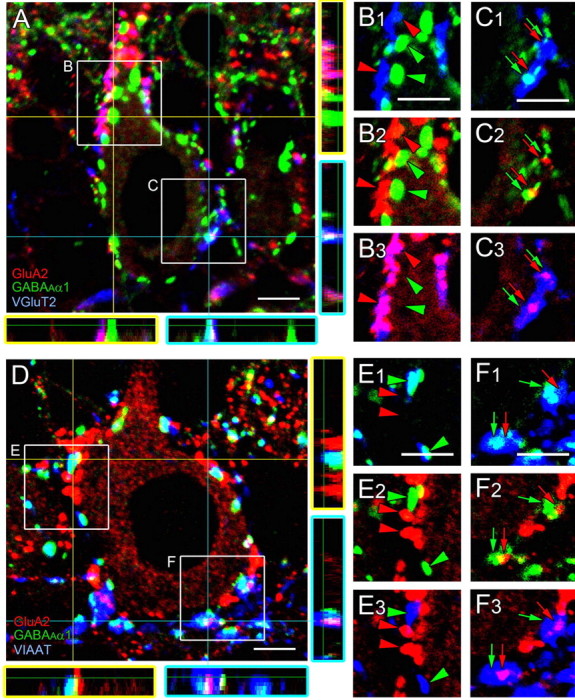
Triple immunofluorescence examining the anatomical relationship of GluA2 and GABAARα1 clusters with CF or BF terminals at P12. A–C, Triple immunofluorescence for GluA2 (red), GABAARα1 (green), and VGluT1 (blue). D–F, Triple immunofluorescence for GluA2 (red), GABAARα1 (green), and VIAAT (blue). Orthogonal views of A and D are shown to the right and bottom. Boxed regions in A and D are enlarged in B1–C3 and E1–F3. Large receptor clusters in the apical portion of PC somata (red or green arrowheads) are shown in B and E, whereas fragmental receptor clusters in the basal portion (red or green arrows) are in C and F. Scale bars: 5 μm.
Electron microscopy.
For electron microscopic analysis, BDA-labeled CFs were identified by diffuse dark precipitates by overnight incubation with streptavidin-peroxidase conjugate (Nichirei) diluted with PB containing 0.5% Tween 20, followed by visualization using 3,3′-diaminobenzidine (DAB). To further identify inhibitory fibers, preembedding silver-enhanced immunogold was applied to sections immunoreacted with VIAAT antibody (1 μg/ml) overnight and 1.4 nm gold particle-conjugated anti-guinea pig IgG (Nanogold; Nanoprobes) for 6 h. The sections were treated with the HQ silver kit (Nanoprobes), postfixed for 30 min with 1% osmium tetroxide in PB, block stained overnight with 1% aqueous uranyl acetate solution, dehydrated using graded alcohols, and embedded in Epon 812. To reconstruct CFs innervating a given PC, serial sections (100 nm in thickness) were prepared in the plane parallel to the pial surface using an MTX ultramicrotome (RMC/Boeckeler). A ribbon of >20 serial sections was mounted on each single-slot copper grid (1 × 2 mm) supported with Formvar membrane. Electron micrographs were taken from every second section with an H7500 electron microscope (Hitachi) at the original magnification of 5000×.
The density of somatic spines and synapses was calculated as the number per 100 μm2 of the somata surface area, which was estimated from the total length of somatic outline in all measured serial ultrathin sections and the section thickness (100 nm). As an immature BF terminal initially makes a single large contact and then splits into small multiple contacts according to maturation (Larramendi, 1969), we counted multiple contacts formed by a single BF terminal as one BF synapse.
Postembedding immunogold.
Double-labeling postembedding immunogold electron microscopy was performed by the two-step method as described previously (Yamasaki et al., 2011). In double labeling for receptors (or scaffolds) and terminal markers (see Figs. 10, 11), ultrathin sections on nickel grids were etched with saturated sodium-ethanolate solution for 1–5 s, incubated in TBS containing 0.03% Triton X-100 (TBST), 0.1% sodium borohydride, and 50 mm glycine for 10 min, and treated with successive solutions: the goat blocking solution containing 2% normal goat serum (Nichirei) in TBST for 20 min; rabbit GABAARα1, rabbit gephyrin or rabbit PSD-95, or guinea pig pan-AMPA receptor antibody (20 μg/ml for each) diluted with the goat blocking solution overnight; and colloidal gold-conjugated (10 nm in diameter) anti-rabbit IgG (1:100; British BioCell International) in the goat blocking solution for 2 h. After extensive washing in TBST, grids were incubated with the rabbit blocking solution containing 2% normal rabbit serum in TBST for 30 min, then overnight with primary antibodies to guinea pig VGluT2 or VIAAT antibody (20 μg/ml for each) diluted with the rabbit blocking solution, and the with colloidal gold-conjugated (15 nm in diameter) anti-guinea pig IgG (1:50; British BioCell International) in the rabbit blocking solution for 4 h. For the double-labeling experiment for AMPA receptor and VIAAT, sections were first subjected to labeling with guinea pig pan-AMPA receptor antibody (20 μg/ml) followed by labeling with rabbit VIAAT antibody (20 μg/ml) diluted with the guinea pig blocking solution. Finally, grids were washed in TBST for 30 min, fixed with 2% glutaraldehyde in PBS for 15 min and 1% OsO4 for 20 min, and stained with 2% uranyl acetate for 5 min and Reynold's lead citrate solution for 1 min. In double-labeling immunogold for AMPA receptor and GABAARα1 (see Fig. 12), we prepared 8–10 serial sections and collected them on Formvar-coated single slot grids. Sections were treated the same as single sections and first subjected to labeling with guinea pig pan-AMPA receptor antibody (20 μg/ml), followed by labeling with rabbit GABAARα1 antibody (20 μg/ml) diluted with the guinea pig blocking solution. Photographs of single and serial sections were taken with H-7100 (Hitachi) and JEM1400 (JEOL) electron microscopes, respectively. For quantitative analysis, postsynaptic membrane-associated immunogold particles, defined as those <35 nm from the cell membrane, were counted on scanned electron micrographs and analyzed using MetaMorph software (Molecular Devices). Statistical significance of the immunogold density was evaluated by Mann–Whitney U test.
Figure 10.
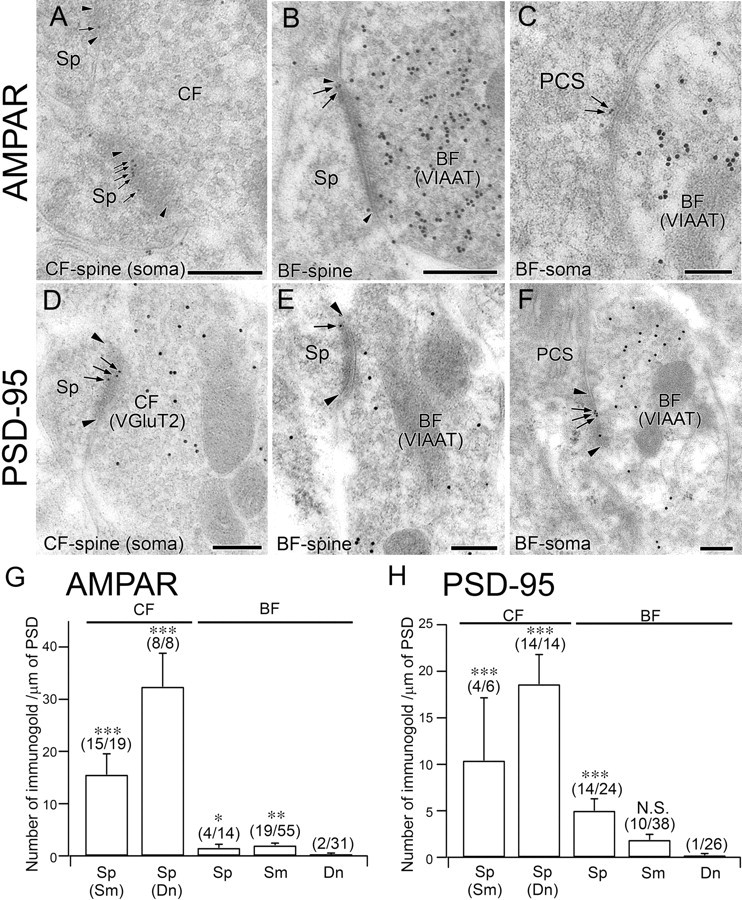
Postembedding immunogold for AMPA receptor and PSD-95 in PC synapses at P12. A–C, Single-labeling immunogold for AMPA receptor (ϕ = 10 nm; A) or double-labeling immunogold for AMPA receptor (ϕ = 10 nm) and VIAAT (ϕ = 15 nm; B, C) at a CF–spine synapse on the soma (A), BF–spine synapse (B), and BF–soma synapse (C). D–F, Double-labeling immunogold for PSD-95 (ϕ = 10 nm) and VGluT2 (ϕ = 15 nm) or VIAAT (ϕ = 15 nm) at a CF–spine synapse on the soma (D), BF–spine synapse (E), and BF–soma synapse (F). Note the occasional labeling of PSD-95 at the asymmetrical contact of the BF–spine synapse (E). Edges of the PSD and immunogold particles for AMPA receptor and PSD-95 are indicated by arrowheads and arrows, respectively. G, H, Summary bar graphs comparing the labeling density for AMPA receptor (G) and PSD-95 (H) at CF–spine, BF–spine, BF–soma, and BF–dendrite synapses. Error bars indicate SEM. Numbers of immunogold-labeled synapses and total analyzed synapses are indicated in parentheses. The number of immunogold particles (mean ± SEM) for pan-AMPAR per synapse is 4.4 ± 1.0, 10.4 ± 1.9, 0.5 ± 0.3, 0.7 ± 0.2, and 0.1 ± 0.1 in CF–somatic spine, CF–dendritic spine, BF–spine, BF–soma, and BF–dendrite synapses, respectively. The number of immunogold particles for PSD-95 per synapse is 3.5 ± 1.3, 5.8 ± 1.3, 1.5 ± 0.4, 0.3 ± 0.2, and 0.1 ± 0.1 in CF–somatic spine, CF–dendritic spine, BF–spine, BF–soma, and BF–dendrite synapses, respectively. N.S., p > 0.05; *p < 0.05; **p < 0.01; ***p < 0.001 (Mann–Whitney U test). Scale bars: 200 nm.
Figure 11.
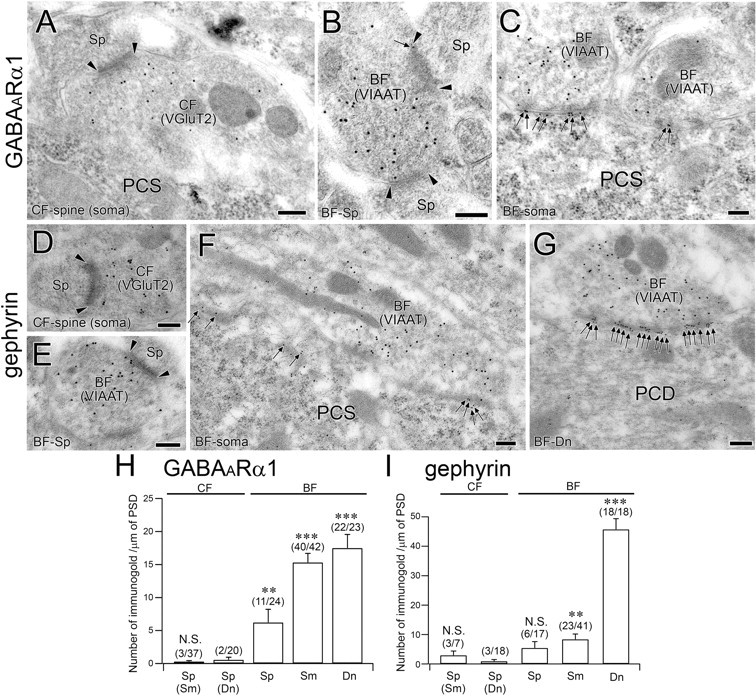
Postembedding immunogold for GABAARα1 and gephyrin in PC synapses at P12. A–C, Double-labeling immunogold for GABAARα1 (ϕ = 10 nm) and VGluT2 (ϕ = 15 nm) or VIAAT (ϕ = 15 nm) at CF–spine (A), BF–spine (B), and BF–soma (C) synapses. Note the GABAARα1 labeling at the asymmetrical contact of the BF–spine synapse (C). D–G, Double-labeling immunogold for gephyrin (ϕ = 10 nm) and VIAAT (ϕ = 15 nm) or VGluT2 (ϕ = 15 nm) at CF–spine (D), BF–spine (E), BF–soma (F), and BF–dendrite (G) synapses. Note the GABAARα1 labeling at the asymmetrical contact of the BF–spine synapse (C). Edges of the PSD and immunogold particles for GABAARα1 and gephyrin are indicated by arrowheads and arrows, respectively. H, I, Summary bar graphs comparing the labeling density for GABAARα1 (H) at CF–spine, BF–spine, BF–soma, and BF–dendrite synapses. The number of immunogold particles (mean ± SEM) for GABAARα1 per synapse is 0.1 ± 0.0, 0.2 ± 0.1, 1.7 ± 0.5, 3.7 ± 0.4, and 6.0 ± 0.8 in CF–somatic spine, CF–dendritic spine, BF–spine, BF–soma, and BF–dendrite synapses, respectively. The number of immunogold particles for gephyrin per synapse is 0.6 ± 0.3, 0.3 ± 0.2, 1.4 ± 0.6, 2.4 ± 0.6, and 21.4 ± 3.6 in CF–somatic spine, CF–dendritic spine, BF–spine, BF–soma, and BF–dendrite synapses, respectively. N.S., p > 0.05; **p < 0.01; ***p < 0.001 (Mann–Whitney U test). Scale bars: 200 nm. PCS, Purkinje cell soma.
Figure 12.
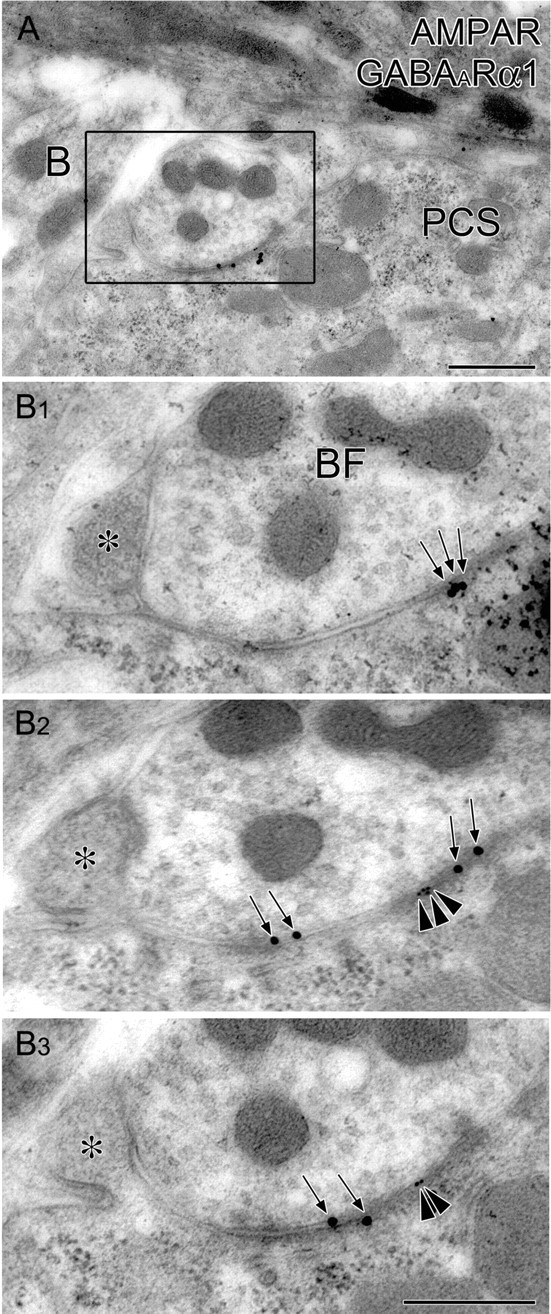
Double-labeling postembedding immunogold for AMPA receptor and GABAARα1 in BF synapses at P12. A, B, Low- (A) and high-power (B) views of a BF terminal forming symmetrical contact with flat somatic surface and asymmetrical contact with somatic spine (asterisks). Consecutive images in B1–B3 demonstrate that clusters of immunogold particles for AMPA receptor (ϕ = 10 nm; arrowheads) are juxtaposed with GABAARα1 clusters (ϕ = 20 nm; arrows) on the PC soma under the same BF terminal. Scale bars: A, B3 (for B1–B3), 500 nm. PCS, Purkinje cell soma.
Results
Overview of CF-to-BF switching
To follow developmental profiles of perisomatic PC innervation by CFs and BFs, we visualized CFs by anterograde tracer BDA injected into the inferior olive (red), inhibitory terminals by VIAAT immunofluorescence (green), and PCs by calbindin immunofluorescence (blue) (Fig. 1). At P7 and P9, CFs extensively ramified and formed pericellular nests around PC somata (Fig. 1A1–B3, asterisks). Consistent with our previous report (Hashimoto et al., 2009), dendritic projection of CFs was not apparent at P7 and was restricted to the basal portion of shaft dendrites at P9 (Fig. 1, double arrowheads). At these stages, VIAAT-positive inhibitory terminals were sparse around PC somata, compared to later stages. At P12, CFs considerably displaced to shaft dendrites, leaving some branches around PC somata (Fig. 1C1–C3, small arrowheads), whereas inhibitory terminals reciprocally increased around PC somata. From P15 to P20, CFs came to pass through the PC layer without forming terminal swellings and further climbed up along PC dendrites (Fig. 1D1–E3). In contrast, inhibitory terminals exhibited remarkable increase on PC somata at P15 (Fig. 1D1–D3) and constructed the pinceau formation at P20 as shown by a VIAAT-positive conical structure attached to the base of PC somata (Fig. 1E1–E3, large arrowhead). Therefore, perisomatic innervation by CFs is overwhelming until P9 and replaced with that by BFs thereafter in a temporally and spatially correlated manner. This developmental framework is consistent with previous reports (Larramendi, 1969; Sotelo, 2008).
Figure 1.
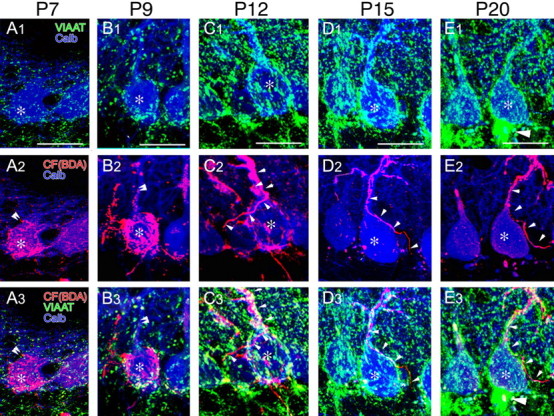
A1–E3, Developmental profile of CF and BF projection to PC somata at P7 (A1–A3), P9 (B1–B3), P12 (C1–C3), P15 (D1–D3), and P20 (E1–E3). Triple fluorescent labeling for CFs with BDA (red, A2–E2, A3–E3), for inhibitory terminals with VIAAT antibody (green, A1–E1, A3–E3), and for PCs with calbindin antibody (blue, A1–E3) is shown. Asterisks indicate PC somata. Double and single arrowheads indicate the tip and trajectory of CF projection, respectively. Large arrowheads in E indicate the pinceau formation surrounding the axon initial segment of PCs. Scale bars: 20 μm.
Classification of perisomatic synapses and spines
BDA-labeled CFs, which were identified by dark DAB filling, formed asymmetrical synapses with somatic protrusions and thorns at each stage examined (Fig. 2A). For descriptive convenience, we refer to the somatic protrusions and thorns collectively as somatic spines. Even if BDA was not filled in afferent fibers, CFs were identified as those forming asymmetrical synapses on somatic spines. On the other hand, inhibitory afferents were identified primarily by the formation of symmetrical synapses on the flat surface of PC somata, and this authenticity was confirmed by immunogold labeling for VIAAT in presynaptic terminals forming symmetrical synapses (Fig. 2E). Since BF synapses are characterized by a pale axoplasmic matrix, abundant neurofilaments, relatively loose aggregates of synaptic vesicles, and separated PSD fractions (Palay and Chan-Palay, 1974; Altman and Bayer, 1997), we identified BFs as inhibitory fibers forming such BF synapses (Fig. 2D). During the early postnatal period, we also found that BFs formed synaptic contact on to somatic spines, and their contact ranged from the symmetrical (Fig. 2B) to asymmetrical type (Fig. 2C). The rest of the inhibitory fibers were collectively classified as other fibers, which included recurrent PC axons characterized by relatively dark axoplasm filled with dense synaptic vesicles (Fig. 2F) (Watt et al., 2009) and unidentified afferent fibers. Free spines lacking any synaptic contact were often encountered during development; they were encapsulated by either BFs (Fig. 2G,H) or Bergmann glia (Fig. 2I,J).
Figure 2.

Six types of perisomatic synapses and free spines in PCs at P7. A–J, CF–spine synapse (A), BF–spine synapse (B, C), BF–soma synapse (D, E), other somatic synapse (F), FS–BF (G, H), and free spines surrounded by BGs (FS–BG; I, J). In A, the CF is labeled with dark filling of BDA-mediated DAB precipitates. In C and E, BFs are labeled by immunogold for VIAAT. Note that synaptic contact in B is a symmetrical type, whereas that in C is an asymmetrical type. From the dense filling of synaptic vesicles and symmetrical contact, the synapse in F is judged as a recurrent PC synapse. Arrowheads indicate the edges of synaptic contact. Adjacent images of boxed regions in G and I are shown in H1–H4 and J1–J4, respectively. PCS, Purkinje cell soma; r-PC, recurrent Purkinje cell axon. Scale bars: 0.5 μm.
Based on these observations, we classified synapses and free spines on PC somata into six types: (1) the synapse between the CF terminal and PC spine (CF–spine synapse; Fig. 2A), (2) the synapse between the BF terminal and PC spine (BF–spine synapse; Fig. 2B,C), (3) the synapse between the BF terminal and flat surface of PC soma (BF–soma synapse; Fig. 2D,E), (4) the synapse between the other fiber and PC soma (other–soma synapse; Fig. 2F), (5) the free spine encapsulated by the BF terminal (FS–BF; Fig. 2G,H), and (6) the free spine encapsulated by Bergmann glia (FS–BG; Fig. 2I,J).
Developmental changes of perisomatic synapses and somatic spines
Perisomatic innervation in PCs was analyzed by serial electron microscopy. At each stage, measurement was done for three PC somata, which were selected on the basis of massive innervation by BDA-labeled CFs. Figure 3, A and B, shows overall changes in the total density of perisomatic synapses and somatic spines, respectively. The density was expressed as the number per 100 μm2 of the somatic surface area (mean ± SD; n = 3 at each stage). The total density of perisomatic synapses increased from P7 to P9 and decreased thereafter. The total density of somatic spines, which included free spines, exhibited a temporal change similar to that of perisomatic PC synapses, except that somatic spines were virtually lost by P20. These changes indicate that the synaptogenesis and spinogenesis in PC somata both peak at P9.
Figure 3.

Histograms showing developmental changes in the density and composition of perisomatic synapses and free spines. A, The density of the total perisomatic synapses. B, The density of the total somatic spines. C–H, The density of the CF–spine synapse (C), BF–spine synapse (D), BF–soma synapse (E), other somatic synapse (F), free spines surrounded by BFs (G), and free spines surrounded by BGs (H). I, The composition of perisomatic synapses. The density is expressed as the number per 100 μm2 of the somatic surface area. Numerals to right of error bars in A–H indicate the mean ± SD, while those in I indicate the percentage of each perisomatic synapse (n = 3 mice for each).
Then, the composition of six types of perisomatic synapses and free spines was analyzed from P7 to P20. We summarize temporal changes in the density of each type of perisomatic synapses and spines in Figure 3C–H, and the composition of perisomatic synapses in Figure 3I. Representative images are collectively shown in Figures 4–6: low-power horizontal views through PC somata (Fig. 4), high-power views of boxed regions in Figure 4 and reconstructed illustrations (Fig. 5), and distribution of perisomatic synapses and free spines in flattened somatic surface of three reconstructed PCs (Fig. 6).
Figure 4.
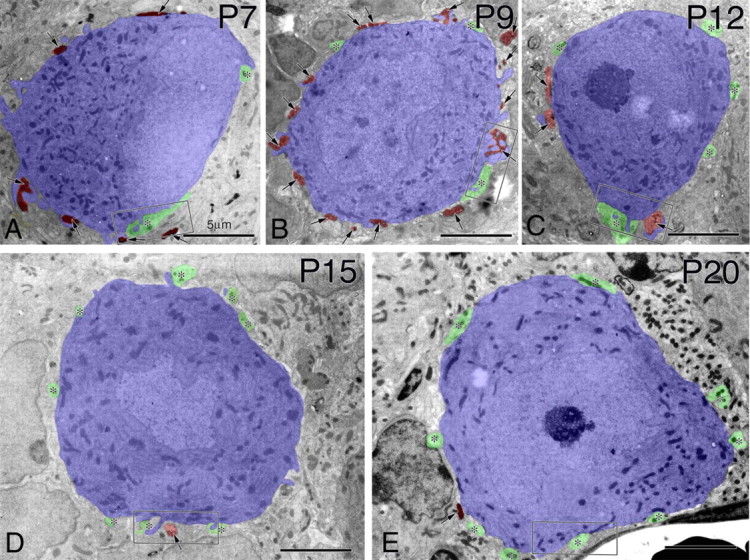
Horizontal electron micrographs through PC somata. A, P7. B, P9. C, P12. D, P15. E, P20. PCs are pseudocolored in blue, BDA-labeled CFs are in brown (also indicated by arrows), and BF terminals are in green (asterisks). Boxed regions in A–E are enlarged in Figure 5A–E, respectively. Scale bars: 5 μm.
Figure 5.

A–J, Electron micrographs (A–E) and reconstructed illustrations (F–J) of perisomatic synapses and free spines in PCs. A, F, P7. B, G, P9. C, H, P12. D, I, P15. E, J, P20. A–E are enlarged views of boxed regions in Fig. 4. F–J, Illustrations reconstructed from serial sections including A–E. BDA-labeled CFs, BFs, and PCs are pseudocolored in red, green, and blue, respectively. Arrowheads indicate the edge of synaptic contact. BF–Sp, BF–spine synapse; BF–Sm, BF–soma synapse; CF-Sp, CF–spine synapse; BF–BG, free spine surrounded by Bergmann glia; PCS, Purkinje cell soma; PSD-I, thick PSD forming an asymmetrical type of contact. Scale bars: 1 μm.
Figure 6.

Schematic illustrations showing the distribution of perisomatic synapses and free spines. A, P7; B, P9. C, P12. D, P15. E, P20. Four types of perisomatic synapses and two types of free spines are plotted on flattened somatic surface of three reconstructed PCs.
At P7, profiles of BDA-labeled CFs were numerous around PC somata (Fig. 4A, 6A), and CF–spine synapses constituted 85.5% of the total perisomatic synapses (Fig. 3I). These CF synapses were made on to crab's claw-like or bifurcating spines (Fig. 5A,F). At this stage, BF-related structures were few in number: BF–spine synapses were 1.8% of the total perisomatic synapses, BF–soma synapses were 7.3% of the total perisomatic synapses (Fig. 5A,F), and FS–BFs were 2.7% of the total somatic spines (Fig. 5A,F). BF–soma and BF–spine synapses were often made by the same BF terminals. When comparing the size and shape of somatic spines, spines of CF–spine synapses were large and mushroom-like, while those of BF–spine synapses and FS–BFs were small and stubby. Thus, CF–spine synapses predominate in PC somata at P7.
At P9, CFs around PC somata further increased in number (Fig. 4B, 6B). Although the density of the total perisomatic synapses and somatic spines peaked (Fig. 3A,B), the composition at P9 was largely similar to that at P7: CF–spine synapses were 88.1% of the total perisomatic synapses (Fig. 5B,G), BF–spine synapses were 2.3% of the total perisomatic synapses, BF–soma synapses were 7.9% of the total perisomatic synapses (Fig. 5B,G), FS–BFs were 3.6% of the total somatic spines (Fig. 5B,G), and FS–BGs were 0.6% of the total somatic spines) (Fig. 5B,G). At P12, CFs were encountered less frequently around PC somata (Fig. 4C, 6C). At this stage, CF–spine synapses decreased to a half density at P9 (Fig. 3C), but still occupied 63.1% of the total perisomatic synapses. Moreover, spines of CF–spine synapses became slender and hook-like (Fig. 5C,H). Conversely, BF-related structures displayed remarkable increases (Fig. 3D,E,G). BF–spine synapses and BF–soma synapses (Fig. 6C,H) doubled in density compared to those at P9, and occupied 8.7 and 24.3%, respectively, of the total perisomatic synapses. In addition, FS–BFs increased to 22.0% of the total somatic spines (Fig. 5C,H). Again here, single BF terminals formed symmetrical contacts to both somata and spines, and further engulfed free spines (Fig. 5C,H). FS–BGs increased to 10.1% of the total somatic spines. Thus, the majority of perisomatic synapses are still made by CFs, but BF synapses increase and constitute one-third of perisomatic synapses at P12.
This trend was further pronounced at P15. Only a single CF passed by PC somata and formed a limited number of perisomatic synapses (Fig. 4D, 6D). Consequently, CF–spine synapses were reduced to 5.6% of the total perisomatic synapses (Fig. 3C). In contrast, BF synapses increased strikingly and constituted 88.7% of the total perisomatic synapses (Fig. 3I), of which 36.6% were BF–spine synapses (Fig. 5D,I1,I2), and 52.1% were BF–soma synapses. At this stage, FS–BFs remained as 21.3% of the total somatic spines (Fig. 5D,I1,I2), while FS–BGs attained the highest density and occupied 29.5% of the total somatic spines (Fig. 5D,I1,I2).
At P20, 88.0% of the total perisomatic synapses became BF–soma synapses (Figs. 3E, 4E, 5E,J, 6E), whereas CF–spine synapses and BF–spine synapses were reduced to 0.5 and 2.3% of synapses, respectively (Fig. 3I), thus attaining the adult pattern of somatic innervation. These changes thus substantiate dynamic reorganization of perisomatic PC innervation from CFs to BFs.
Overview of postsynaptic receptor switching
The CF-to-BF switching of perisomatic innervation should accompany the switching of postsynaptic receptors from glutamatergic to GABAergic. To examine this issue, we performed immunohistochemistry for AMPA receptor subunit GluA2 and GABAA receptor subunit GABAARα1 and also for PSD-95 and gephyrin, i.e., scaffolding proteins selective to excitatory or inhibitory synapses, respectively. The specificity of the GluA2 antibody has been verified by blank immunolabeling in GluA2 knock-out mouse brain (Yamazaki et al., 2010; Yamasaki et al., 2011), whereas that of PSD-95 antibody has been shown by detection of a 87∼97 kDa protein band in the brain and selective postsynaptic labeling at asymmetrical synapses (Fukaya and Watanabe, 2000). Antibodies specific to GABAARα1 and gephyrin were produced in the present study, and their specificity was tested by immunoblot and immunohistochemistry (Fig. 7). GABAARα1 antibody detected multiple protein bands at 40–45 kDa in HEK cell lysates transfected with mouse GABAARα1, but not GABAARα2, and also detected a 43 kDa protein band in the mouse brain (Fig. 7A). The overall labeling pattern in the brain (data not shown) and punctate labeling in the neuropil of the cerebellar cortex (Fig. 7D) are consistent with reported distributions of GABAARα1 mRNA and immunoreactivity, respectively (Wisden et al., 1992; Fritschy and Mohler, 1995). The specificity of gephyrin antibodies raised against two nonoverlapping sequences was also shown by their identical patterns of immunoblot and immunohistochemical labelings (Fig. 7B,C,E,F).
Figure 7.

Specificity of GABAARα1 and gephyrin antibodies. A, Immunoblot with GABAARα1 antibody using HEK cell lysates transfected with plasmid vector encoding GABAARα1 (left) or GABAARα2 cDNA (middle) and using the PSD fraction of adult mouse brains (right). B, C, Immunoblot with two gephyrin antibodies using HEK cell lysates transfected with plasmid vector encoding gephyrin cDNA (left) or plasmid vector only (middle) and using the PSD fraction of adult mouse brains (right). D–F, Immunofluorescence with GABAARα1 (D), gephyrin (1–45 aa residues; E), and gephyrin (54–94 aa residues; F) antibodies in the adult mouse cerebellar cortex. GL, Granular layer; ML, molecular layer; PC, Purkinje cell layer. Scale bars: 20 μm.
At P7 and P9, when somatic spines were the major postsynaptic substrate for CF synapses, perisomatic GluA2 clusters densely surrounded PC somata, while GABAARα1 clusters were apparently few in number (Fig. 8A1–B3). From P12 to P15, when the major perisomatic synapses switched from CF to BF synapses, perisomatic GABAARα1 clusters became overwhelming (Fig. 8C1–D3). At P20, PC somata were surrounded exclusively by GABAARα1 clusters (Fig. 8E1–E3). When examined for relevant scaffolding proteins at P12, GluA2 clusters were merged exclusively with PSD-95 (Fig. 8F). It is known that perisomatic gephyrin clusters are transient and reduced with a developmental decrease in the size of GABAARα1 clusters (Viltono et al., 2008). Presumably reflecting this developmental trend, gephyrin was expressed in a subpopulation of perisomatic GABAARα1 clusters, particularly in large ones (Fig. 8G1,G2, arrows). Thus, phenotypes of perisomatic receptors also switch from glutamatergic to GABAergic during the early postnatal period.
Postsynaptic receptor switching proceeds at BF synapse
Particularly at P12, fragmental GluA2 clusters were preferentially distributed in the basal portion of PC somata; they were often positioned side by side with fragmental GABAARα1 clusters or lay on large GABAARα1 clusters (Fig. 8C1–C3, arrowheads). From the close proximity of two receptor clusters as well as active CF-to-BF switching around this stage, we postulated that the switching of postsynaptic receptors may proceed while they are covered with these shifting presynaptic elements. To pursue this possibility, we examined the localization of AMPA and GABAA receptors in relation with CF or BF terminals at P12.
First, we used triple immunofluorescence for GluA2 (red), GABAARα1 (green), and terminal markers (blue) for CFs (VGluT2; Fig. 9A–C) or BFs (VIAAT; Fig. 9D–F). From images of serial optical sections taken along the z-axis, orthogonal views were reconstructed and shown to the right (the y–z plane) and bottom (the x–z plane) of Figure 9, A and D. In addition, boxed regions in Figure 9, A and D, were separated into three combinations of two fluorescent images (Fig. 9B1–C3,E1–F3). Large GluA2 clusters (red arrowheads), but not large GABAARα1 clusters (green arrowheads), were well overlapped with VGluT2 (Fig. 9B1–B3). Likewise, large GABAARα1 clusters (green arrowheads), but large GluA2 clusters (red arrowheads), were overlapped with VIAAT (Fig. 9E1–E3). When focusing on fragmental clusters of GluA2 (red arrows) and GABAARα1 (green arrows) in the basal portion of PC somata (Fig. 9C1–C3,F1–F3), they often appeared in all the x–y, x–z, and y–z planes to be surrounded or contacted by single CF terminals (Fig. 9A,C) or single BF terminals (Fig. 9D,F). This finding suggests that receptor switching occurs around CF terminals, BF terminals, or both.
Next, we used postembedding immunogold microscopy at P12 to measure the labeling density of AMPA receptors, GABAA receptors, and their scaffolding proteins at CF synapses and BF synapses (Figs. 10, 11). From our preliminary experiment, the signal-to-noise ratio of immunogold labeling that was sufficient for comparison among perisomatic PC synapses at P12 was obtained with rabbit antibodies to PSD-95, GABAARα1, gephyrin, and VIAAT, and with guinea pig antibodies to pan-AMPA receptors, VGluT2, or VIAAT. We thus applied possible combinations of double labeling for AMPA receptor/VIAAT, PSD-95/VGluT2 or VIAAT, GABAARα1/VGluT2 or VIAAT, and gephyrin/VGluT2 or VIAAT. However, the labeling for AMPA receptors at CF synapses was determined at ulstrastructurally identified CF synapses, i.e., asymmetrical synapses on somatic spines with densely packed spherical synaptic vesicles (Fig. 10A). As a reference of the basal or background level of immunogold labeling, we measured the density of AMPA receptors and PSD-95 at BF synapses on dendritic shafts, and the density of GABAARα1 and gephyrin at CF synapses on dendritic spines. The density of AMPA receptor and PSD-95 labeling (the number of immunogold particles per 1 μm of PSD; mean ± SEM; Fig. 10G,H) was very high at CF–spine synapses (Fig. 10A,D). Interestingly, labeling for AMPA receptors and PSD-95 was also occasionally detected at at perisomatic BF synapses, though at much lower levels than at CF synapses (Fig. 10B,C,E,F); significant synaptic labeling was noted for AMPA receptors at both BF–soma and BF–spine synapses (Fig. 10G), whereas significant labeling for PSD-95 was noted only at BF–spine synapses (Fig. 10H). Significant synaptic labeling for GABAARα1 and gephyrin was confined to BF synapses (Fig. 11B,C,F,G), and was nearly at the background level at CF synapses (Fig. 11A,D,H,I). Differential abundance among populations of CF synapses or BF synapses was also apparent. At CF–spine synapses, the density of AMPA receptor and PSD-95 labeling showed a twofold increase from soma to dendrite (Fig. 10G,H). At BF synapses, the density of GABAARα1 labeling at BF–soma synapses was two- to threefold higher than that at BF–spine synapses (Fig. 11, compare B, C), and comparable to that at BF–dendrite synapses (Fig. 11H). On the other hand, significant synaptic labeling for gephyrin was detected at BF–soma and BF–dendrite synapses (Fig. 11, compare F, G), the level of which was much higher at BF–dendrite synapses than at BF–soma synapses (Fig. 11I). Thus, in perisomatic PC synapses at P12, AMPA receptors and PSD-95 are highly expressed at CF synapses, and GABAARα1 and gephyrin are highly expressed at BF synapses, as expected. Furthermore, significant levels of AMPA receptors and PSD-95 are observed at perisomatic BF synapses, favoring the notion that postsynaptic receptor switching occurs mainly at BF synapses.
Finally, we challenged simultaneous detection of AMPA and GABAA receptors at single BF synapses at P12 by double-labeling postembedding immunogold with use of guinea pig pan-AMPA receptor and rabbit GABAARα1 antibodies. First, we randomly selected GABAARα1-labeled BF synapses that had membrane thickening in the postsynaptic side and electron-dense materials in the cleft-like extracellular space. Then, the presence or absence of immunogold labeling for AMPA receptors was examined in the same BF synapses on the same or adjacent ultrathin sections. We found clusters of immunogold labeling for AMPA receptors in 10 of 24 GABAARα1-labeled BF synapses on PC somata (Fig. 12). In contrast, simultaneous labeling for AMPA receptors (Fig. 12, arrowheads) was rarely observed at GABAARα1-labeled BF synapses on PC dendrites (1 of 11 synapses). From the frequent colabeling of AMPA and GABAA receptors at single BF synapses on PC somata, the switching of postsynaptic receptor phenotypes likely proceeds under the coverage of BF terminals.
Discussion
During the early postnatal period, the major input source to PC somata switches from glutamatergic CFs to GABAergic BFs (Larramendi and Victor, 1967). To pursue this developmental process, we examined the composition of perisomatic synapses and spines and the switching of postsynaptic receptor phenotypes. The main points of our observations are schematically illustrated in Figure 13.
Figure 13.

Summary illustrations on developmental switching of perisomatic PC synapses and receptor phenotypes. At P7 and P9, the predominance of CF–spine (CF–Sp) synapses corresponds to the pericellular nest stage of CF innervation. At P12, perisomatic CF–spine synapses are displaced to the apical somatic portion and shaft dendrites (the capuchon stage), whereas BF–spine synapses (BF–Sp) and BF–soma synapses (BF–Sm) increase reciprocally. At this stage, fragmental GluA2 and GABAARα1 clusters are juxtaposed preferentially at basal somatic portion. Juxtaposed receptor clusters are often covered with the same BF terminals. At P15, the major perisomatic synapses are BF synapses composed of BF–spine and BF–soma synapses, and most CF–spine synapses are eliminated from PC somata (the dendritic stage). At P20, most perisomatic synapses become BF–soma synapses, and the pinceau is established, thus attaining the adult type of innervation. Free spines surrounded by BFs or BGs also appear transiently during the period of CF-to-BF switchover, and may play some role in the restructuring of perisomatic innervation.
Temporal profile of the perisomatic CF synapse
After reaching the cerebellum at late embryonic stages (Chedotal and Sotelo, 1992; Morara et al., 2001), CFs exhibit distinct modes of PC innervation (Ramon y Cajal, 1911; Chedotal and Sotelo, 1993). In the creeper stage, CFs creep between immature PCs and form a few synapses on apical dendrites. These initial contacts are transient and disappear with the regression of apical dendrites (Armengol and Sotelo, 1991). In the pericellular nest stage, the plexus of CFs densely surrounds PC somata and establishes synaptic contacts with perisomatic protrusions and thorns (Sugihara, 2005), which we collectively term somatic spines in the present study. The capuchon stage is characterized by the displacement of CF plexus to the apical portion of PC somata and basal dendrites. In the dendritic stage, CFs finally undergo translocation to growing dendrites and expand their territory of innervation. From the pattern of CF wiring (Fig. 1) (Altman, 1972; Chedotal and Sotelo, 1992; Sugihara, 2005; Hashimoto et al., 2009), postnatal ages of ∼P9, P9–P12, and P12 and older in rodents likely correspond to the pericellular nest stage, the capuchon stage, and the dendritic stage, respectively (Fig. 13). In the present study, we clarified that the density of perisomatic CF synapses peaked at P9, when pericellular nests were most developed, and CF–spine synapses constituted 88.1% of the total perisomatic synapses. Thereafter, they were substantially diminished at P15 (5.8%) and almost disappeared at P20 (0.5%) (Fig. 3C,I). Therefore, changes in the density and composition of perisomatic CF synapses correspond to developmental shift of the CF innervation mode; namely, CF–spine synapses are in the increasing phase during the pericellular nest stage, in the decreasing phase during the capuchon stage, and virtually lost in the dendritic stage.
Functional strengths of multiple CFs innervating a given PC are relatively uniform in neonates, and one CF with higher probability of multivesicular release is selectively strengthened from P3 to P7 (Hashimoto and Kano, 2003). From P9 onward, dendritic translocation is permitted only for the strongest CF, meanwhile leaving its and other CFs' synapses at perisomatic sites (Hashimoto et al., 2009). Subsequent massive elimination of perisomatic CF synapses establishes CF monoinnervation. Thus, the steep decrease of CF–spine synapses from P9 to P15 (Fig. 3C) coincides with, and further substantiates, developmental elimination of perisomatic CF synapses toward monopolized dendritic innervation by a single winner CF (Hashimoto et al., 2009). Higher immunogold labeling for GluA2 and PSD-95 at dendritic CF synapses than at perisomatic CF synapses (Fig. 10G) may also reflect the functional strengthening of winner CFs in the dendritic stage of CF innervation. Therefore, the temporal shift of perisomatic CF synapses appears well consistent with developmental competition and refinement in CF innervation.
Somatic spine is succeeded from CF to BF and Bergmann glia
One of the important findings in the present study is that somatic spines, which are initially the major postsynaptic substrate for CF innervation, were not simply lost with the loss of perisomatic CF synapses. Rather, not a few existed transiently as BF–spine synapses or free spines surrounded by BFs and Bergmann glia (Fig. 3D,G,H). In the early postnatal period, basket cells extend BFs transversely over the apical pole of PC somata, which then descend along PC somata to form perisomatic synapses and further along the axon initial segment to construct the pinceau formation (Palay et al., 1968; Larramendi and Victor, 1967; Somogyi and Hamori, 1976). Consistent with previous studies (Larramendi, 1969; Ango et al., 2004; Sotelo, 2008), BF synapses were few in number at P7 and progressively increased thereafter (Fig. 13, green fibers). Until P15, BF synapses existed as either BF–spine or BF–soma synapses. Of the total BF synapses, BF–spine synapses constituted 20% at P7, 22% at P9, 26% at P12, 41% at P15, and 3% at P20 (Fig. 3). This indicates that BF–spine synapses emerge transiently when perisomatic CF synapses are produced and eliminated massively and, further, that the subsequent loss of BF–spine synapses leads to the establishment of adult-type perisomatic innervation by P20. Remaining PSD-95 at the spine head of BF–spine synapses (Fig. 10H) might maintain this unique type of inhibitory synapses transiently.
Considering that the same BF terminals formed BF–spine and BF–soma synapses (Fig. 5) and that BF–spine synapses often had an asymmetrical contact as well as a symmetrical one (Fig. 2B,C), it can be assumed that BF–soma synapses are formed not only directly by contacting of BFs to the flat surface of PC somata, but also indirectly via a transient form of BF–spine synapses. Detection of AMPA receptors at BF–soma synapses (Fig. 10, 12) further supports the transition from BF–spine to BF–soma synapses. During the second postnatal week, perisomatic BF synapses are known to undergo molecular/structural reorganization, i.e., a numerical increase of presynaptic and postsynaptic contacts, size reduction of individual contacts and GABAA receptor clusters, and loss of gephyrin (Larramendi, 1969; Viltono et al., 2008). Taking higher density of GABAARα1 labeling at BF–soma synapses than at BF–spine synapses into consideration (Fig. 11), developmental transition from BF–spine to BF–soma synapses may reflect the maturation of GABAergic synapses and be counted as one such developmental reorganization of BF synapses. We cannot exclude the possibility that BF–spine synapses are transient synapses, which are eventually eliminated according to cerebellar maturation. Whatever their fate, the present study has disclosed that BF–spine synapses are a common type of BF synapse that emerges during the stages of active CF-to-BF switching and massive elimination of perisomatic CF synapses.
Receptor phenotype switching
During the early postnatal period, transmitter receptor phenotypes expressed in PC somata also switched from glutamatergic to GABAergic. Predominant GluA2 clusters at P7 and P9, increase of GABAARα1 clusters with reciprocal reduction of GluA2 clusters at P12, and predominant GABAARα1 clusters at P15 and P20 (Fig. 8) are all consistent with developmental changes in the composition of perisomatic synapses (Fig. 3I). Moreover, most of AMPA and GABAA receptor clusters were apposed almost selectively to VGluT2-labeled CF terminals or VIAAT-labeled BF terminals, respectively (Fig. 9–11). Therefore, the switching of postsynaptic receptors proceeds with the CF-to-BF switching in a temporally and spatially matched manner (Fig. 13).
By confocal laser scanning microscopy, fragmental GluA2 and GABAARα1 clusters were juxtaposed with each other and appeared to be closely associated or surrounded by the same CF or BF terminals (Fig. 9). Such images were readily captured at P12, when CF-to-BF switching is most active. Moreover, they were preferentially observed at the basal somatic portion, from which CF innervation is displaced to the apical somatic portion and basal dendrites in the capuchon stage. From the observation, we assumed that both declustering of AMPA receptors and de novo clustering of GABAA receptors might take place at close perisomatic sites, while they are innervated by CFs, BFs, or both. Postembedding immunogold electron microscopy revealed that AMPA receptors were detectable at BF–soma synapses, although the level was much lower than the level at CF synapses but significantly higher than the background level (Figs. 10, 11). Double-labeling immunogold demonstrated the coexistence of AMPA and GABAA receptors at single BF synapses (Fig. 12). These findings suggest that the switching of postsynaptic receptor phenotypes proceeds with that of presynaptic elements, mainly under the coverage of BF terminals.
Transient emergence of free spines surrounded by Bergmann glia suggests that declustering of AMPA receptors at waning CF synapses also proceeds while they are covered with the glial processes. It has been reported that waning CF synapses on PC somata and shaft dendrites are surrounded by ring-like structures with elevated lysosomal activity, which are assumed to be Bergmann glia (Song et al., 2008). Considering marked reduction in the density of total perisomatic synapses and somatic spines from P9 to P20 (Fig. 3A,B), this surrounding by such glial elements might facilitate the sequestration of perisomatic synapses and receptors. Furthermore, considering that Bergmann glia and BFs express high levels of glutamate-aspartate transporter (GLAST) or GABA transporter GAT-1, respectively (Morara et al., 1996; Yamada et al., 2000), the enwrapping of somatic spines with these succeeding neuroglial elements may suppress excessive or unnecessary receptor activation by keeping extracellular transmitter concentrations around reorganizing perisomatic synapses low.
Through the present study, we conclude that during the CF-to-BF switching of perisomatic PC innervation, somatic spines initially innervated by CFs are quickly succeeded by BFs and BGs, and that postsynaptic receptors are also reorganized while they are covered with the succeeding neuroglial elements.
Footnotes
This work was supported by Grants-in-Aid for Scientific Research 19100005 (M.W.), 15016088 (R.I.), and 17500233 (R.I.); Precursory Research for Embryonic Science and Technology (K.H.); and the Strategic Research Program for Brain Sciences (Development of Biomarker Candidates for Social Behavior; M.K.) from the Ministry of Education, Culture, Sports, Science and Technology, Japan. We thank Ms. E. Suzuki in the electron microscope laboratory of the Department of Biomedical Engineering, School of Medicine, Sapporo Medical University (Sapporo, Japan) for her technical assistant.
References
- Altman J. Postnatal development of the cerebellar cortex in the rat. II. Phases in the maturation of Purkinje cells and of the molecular layer. J Comp Neurol. 1972;145:399–463. doi: 10.1002/cne.901450402. [DOI] [PubMed] [Google Scholar]
- Altman J, Bayer SA. Development of the cerebellar system. Boca Raton, FL: CRC; 1997. [Google Scholar]
- Ango F, di Cristo G, Higashiyama H, Bennett V, Wu P, Huang ZJ. Ankyrin-based subcellular gradient of neurofascin, an immunoglobulin family protein, directs GABAergic innervation at purkinje axon initial segment. Cell. 2004;119:257–272. doi: 10.1016/j.cell.2004.10.004. [DOI] [PubMed] [Google Scholar]
- Armengol JA, Sotelo C. Early dendritic development of Purkinje cells in the rat cerebellum. A light and electron microscopic study using axonal tracing in “in vitro” slices. Dev Brain Res. 1991;64:95–114. doi: 10.1016/0165-3806(91)90213-3. [DOI] [PubMed] [Google Scholar]
- Ben-Ari Y. Excitatory actions of GABA during development: the nature of the nurture. Nat Rev Neurosci. 2002;3:728–739. doi: 10.1038/nrn920. [DOI] [PubMed] [Google Scholar]
- Buzsáki G, Geisler C, Henze DA, Wang XJ. Interneuron Diversity series: circuit complexity and axon wiring economy of cortical interneurons. Trends Neurosci. 2004;27:186–193. doi: 10.1016/j.tins.2004.02.007. [DOI] [PubMed] [Google Scholar]
- Cesa R, Morando L, Strata P. Transmitter-receptor mismatch in GABAergic synapses in the absence of activity. Proc Natl Acad Sci U S A. 2008;105:18988–18993. doi: 10.1073/pnas.0806979105. [DOI] [PMC free article] [PubMed] [Google Scholar]
- Chedotal A, Sotelo C. Early development of olivocerebellar projections in the fetal rat using CGRP immunocytochemistry. Eur J Neurosci. 1992;4:1159–1179. doi: 10.1111/j.1460-9568.1992.tb00142.x. [DOI] [PubMed] [Google Scholar]
- Chedotal A, Sotelo C. The “creeper stage” in cerebellar climbing fiber synaptogenesis precedes the “pericellular nest”—ultrastructural evidence with parvalbumin immunocytochemistry. Dev Brain Res. 1993;76:207–220. doi: 10.1016/0165-3806(93)90209-s. [DOI] [PubMed] [Google Scholar]
- Freund TF. Interneuron diversity series: rhythm and mood in perisomatic inhibition. Trends Neurosci. 2003;26:489–495. doi: 10.1016/S0166-2236(03)00227-3. [DOI] [PubMed] [Google Scholar]
- Fritschy JM, Brunig I. Formation and plasticity of GABAergic synapses: physiological mechanisms and pathophysiological implications. Pharmacol Ther. 2003;98:299–323. doi: 10.1016/s0163-7258(03)00037-8. [DOI] [PubMed] [Google Scholar]
- Fritschy JM, Mohler H. GABAA-receptor heterogeneity in the adult rat brain: differential regional and cellular distribution of seven major subunits. J Comp Neurol. 1995;359:154–194. doi: 10.1002/cne.903590111. [DOI] [PubMed] [Google Scholar]
- Fritschy JM, Panzanelli P, Kralic JE, Vogt KE, Sassoe-Pognetto M. Differential dependence of axo-dendritic and axo-somatic GABAergic synapses on GABAA receptors containing the α1 subunit in Purkinje cells. J Neurosci. 2006;26:3245–3255. doi: 10.1523/JNEUROSCI.5118-05.2006. [DOI] [PMC free article] [PubMed] [Google Scholar]
- Fukaya M, Watanabe M. Improved immunohistochemical detection of postsynaptically located PSD-95/SAP90 protein family by protease section pretreatment: a study in the adult mouse brain. J Comp Neurol. 2000;426:572–586. [PubMed] [Google Scholar]
- Fukaya M, Tsujita M, Yamazaki M, Kushiya E, Abe M, Akashi K, Natsume R, Kano M, Kamiya H, Watanabe M, Sakimura K. Abundant distribution of TARP γ-8 in synaptic and extrasynaptic surface of hippocampal neurons and its major role in AMPA receptor expression on spines and dendrites. Eur J Neurosci. 2006;24:2177–2190. doi: 10.1111/j.1460-9568.2006.05081.x. [DOI] [PubMed] [Google Scholar]
- Gianola S, Savio T, Schwab ME, Rossi F. Cell-autonomous mechanisms and myelin-associated factors contribute to the development of Purkinje axon intracortical plexus in the rat cerebellum. J Neurosci. 2003;23:4613–4624. doi: 10.1523/JNEUROSCI.23-11-04613.2003. [DOI] [PMC free article] [PubMed] [Google Scholar]
- Hashimoto K, Kano M. Functional differentiation of multiple climbing fiber inputs during synapse elimination in the developing cerebellum. Neuron. 2003;38:785–796. doi: 10.1016/s0896-6273(03)00298-8. [DOI] [PubMed] [Google Scholar]
- Hashimoto K, Ichikawa R, Kitamura K, Watanabe M, Kano M. Translocation of a “winner” climbing fiber to the Purkinje cell dendrite and subsequent elimination of “losers” from the soma in developing cerebellum. Neuron. 2009;63:106–118. doi: 10.1016/j.neuron.2009.06.008. [DOI] [PubMed] [Google Scholar]
- Howard A, Tamas G, Soltesz I. Lighting the chandelier: new vistas for axo-axonic cells. Trends Neurosci. 2005;28:310–316. doi: 10.1016/j.tins.2005.04.004. [DOI] [PubMed] [Google Scholar]
- Huang ZJ, Di Cristo G, Ango F. Development of GABA innervation in the cerebral and cerebellar cortices. Nat Rev Neurosci. 2007;8:673–686. doi: 10.1038/nrn2188. [DOI] [PubMed] [Google Scholar]
- Ichikawa R, Miyazaki T, Kano M, Hashikawa T, Tatsumi H, Sakimura K, Mishina M, Inoue Y, Watanabe M. Distal extension of climbing fiber territory and multiple innervation caused by aberrant wiring to adjacent spiny branchlets in cerebellar Purkinje cells lacking glutamate receptor δ2. J Neurosci. 2002;22:8487–8503. doi: 10.1523/JNEUROSCI.22-19-08487.2002. [DOI] [PMC free article] [PubMed] [Google Scholar]
- Larramendi E, Victor T. Synapses on the Purkinje cell spines in the mouse. An electronmicroscopic study. Brain Res. 1967;5:15–30. doi: 10.1016/0006-8993(67)90216-8. [DOI] [PubMed] [Google Scholar]
- Larramendi LM. Analysis of synaptogenesis in the cerebellum of the mouse. In: Llinas R, editor. Neurobiology of cerebellar evolution and development. Chicago: American Medical Association; 1969. pp. 803–843. [Google Scholar]
- Laurie DJ, Wisden W, Seeburg PH. The distribution of 13 GABA, receptor subunit mRNAs in the rat brain. II. Olfactory bulb and cerebellum. J Neurosci. 1992;12:1063–1076. doi: 10.1523/JNEUROSCI.12-03-01063.1992. [DOI] [PMC free article] [PubMed] [Google Scholar]
- Markram H, Toledo-Rodriguez M, Wang Y, Gupta A, Silberberg G, Wu C. Interneurons of the neocortical inhibitory system. Nat Rev Neurosci. 2004;5:793–807. doi: 10.1038/nrn1519. [DOI] [PubMed] [Google Scholar]
- Masugi-Tokita M, Tarusawa E, Watanabe M, Molnar E, Fujimoto K, Shigemoto R. Number and density of AMPA receptors in individual synapses in the rat cerebellum as revealed by SDS-digested freeze-fracture replica labeling. J Neurosci. 2007;27:2135–2144. doi: 10.1523/JNEUROSCI.2861-06.2007. [DOI] [PMC free article] [PubMed] [Google Scholar]
- Miyazaki T, Fukaya M, Shimizu H, Watanabe M. Subtype switching of vesicular glutamate transporters at parallel fibre-Purkinje cell synapses in developing mouse cerebellum. Eur J Neurosci. 2003;17:2563–2572. doi: 10.1046/j.1460-9568.2003.02698.x. [DOI] [PubMed] [Google Scholar]
- Morando L, Cesa R, Rasetti R, Harvey R, Strata P. Role of glutamate δ-2 receptors in activity-dependent competition between heterologous afferent fibers. Proc Natl Acad Sci U S A. 2001;98:9954–9959. doi: 10.1073/pnas.171098398. [DOI] [PMC free article] [PubMed] [Google Scholar]
- Morara S, Brecha NC, Marcotti W, Provini L, Rosina A. Neuronal and glial localization of the GABA transporter GAT-1 in the cerebellar cortex. Neuroreport. 1996;7:2993–2996. doi: 10.1097/00001756-199611250-00039. [DOI] [PubMed] [Google Scholar]
- Morara S, van der Want JJ, de Weerd H, Provini L, Rosina A. Ultrastructural analysis of climbing fiber-Purkinje cell synaptogenesis in the rat cerebellum. Neuroscience. 2001;108:655–671. doi: 10.1016/s0306-4522(01)00433-x. [DOI] [PubMed] [Google Scholar]
- Nakagawa S, Watanabe M, Isobe T, Kondo H, Inoue Y. Cytological compartmentalization in the staggerer cerebellum, as revealed by calbindin immunohistochemistry for Purkinje cells. J Comp Neurol. 1998;395:112–120. doi: 10.1002/(sici)1096-9861(19980525)395:1<112::aid-cne8>3.0.co;2-3. [DOI] [PubMed] [Google Scholar]
- Owens DF, Kriegstein AR. Is there more to GABA than synaptic inhibition? Nat Rev Neurosci. 2002;3:715–727. doi: 10.1038/nrn919. [DOI] [PubMed] [Google Scholar]
- Palay SL, Chan-Palay V. Cerebellar cortex, cytology and organization. New York: Springer; 1974. [Google Scholar]
- Palay SL, Sotelo C, Peters A, Orkand PM. The axon hillock and the initial segment. J Cell Biol. 1968;38:193–201. doi: 10.1083/jcb.38.1.193. [DOI] [PMC free article] [PubMed] [Google Scholar]
- Ramon y Cajal S. Histologie du systeme nerveux de I'ginne et des vertebres, Vol II. Paris: Maloine; 1911. [Google Scholar]
- Rosina A, Morara S, Provini L. GAT-1 developmental expression in the rat cerebellar cortex: basket and pinceau formation. Neuroreport. 1999;10:27–32. doi: 10.1097/00001756-199901180-00005. [DOI] [PubMed] [Google Scholar]
- Somogyi P, Hamori J. A quantitative electron microscopic study of the Purkinje cell axon initial segment. Neuroscience. 1976;1:361–365. doi: 10.1016/0306-4522(76)90127-5. [DOI] [PubMed] [Google Scholar]
- Song J, Misgeld T, Kang H, Knecht S, Lu J, Cao Y, Cotman S, Bishop D, Lichtman J. Lysosomal activity associated with developmental axon pruning. J Neurosci. 2008;28:8993–9001. doi: 10.1523/JNEUROSCI.0720-08.2008. [DOI] [PMC free article] [PubMed] [Google Scholar]
- Sotelo C. Development of “pinceaux” formations and dendritic translocation of climbing fibers during the acquisition of the balance between glutamatergic and γ-aminobutyric acidergic inputs in developing Purkinje cells. J Comp Neurol. 2008;506:240–262. doi: 10.1002/cne.21501. [DOI] [PubMed] [Google Scholar]
- Sugihara I. Microzonal projection and climbing fiber remodeling in single olivocerebellar axons of newborn rats at postnatal days 4–7. J Comp Neurol. 2005;487:93–106. doi: 10.1002/cne.20531. [DOI] [PubMed] [Google Scholar]
- Takayama C, Inoue Y. Developmental expression of GABA transporter-1 and 3 during formation of the GABAergic synapses in the mouse cerebellar cortex. Dev Brain Res. 2005;158:41–49. doi: 10.1016/j.devbrainres.2005.05.007. [DOI] [PubMed] [Google Scholar]
- Viltono L, Patrizi A, Fritschy JM, Sassoe-Pognetto M. Synaptogenesis in the cerebellar cortex: differential regulation of gephyrin and GABAA receptors at somatic and dendritic synapses of Purkinje cells. J Comp Neurol. 2008;508:579–591. doi: 10.1002/cne.21713. [DOI] [PubMed] [Google Scholar]
- Watt AJ, Cuntz H, Mori M, Nusser Z, Sjostrom PJ, Hausser M. Traveling waves in developing cerebellar cortex mediated by asymmetrical Purkinje cell connectivity. Nat Neurosci. 2009;12:463–473. doi: 10.1038/nn.2285. [DOI] [PMC free article] [PubMed] [Google Scholar]
- Wisden W, Laurie DJ, Monyer H, Seeburg PH. The distribution of 13 GABAA receptor subunit mRNAs in the rat brain. I. Telencephalon, diencephalon, mesencephalon. J Neurosci. 1992;12:1040–1062. doi: 10.1523/JNEUROSCI.12-03-01040.1992. [DOI] [PMC free article] [PubMed] [Google Scholar]
- Yamada K, Fukaya M, Shibata T, Kurihara H, Tanaka K, Inoue Y, Watanabe M. Dynamic transformation of Bergmann glial fibers proceeds in correlation with dendritic outgrowth and synapse formation of cerebellar Purkinje cells. J Comp Neurol. 2000;418:106–120. [PubMed] [Google Scholar]
- Yamasaki M, Miyazaki T, Azechi H, Abe M, Natsume R, Hagiwara T, Aiba A, Mishina M, Sakimura K, Watanabe M. Glutamate receptor δ2 is essential for input pathway-dependent regulation of synaptic AMPAR contents in cerebellar Purkinje cells. J Neurosci. 2011;31:3362–3374. doi: 10.1523/JNEUROSCI.5601-10.2011. [DOI] [PMC free article] [PubMed] [Google Scholar]
- Yamazaki M, Fukaya M, Hashimoto K, Yamasaki M, Tsujita M, Itakura M, Abe M, Natsume R, Takahashi M, Kano M, Sakimura K, Watanabe M. TARPs γ-2 and γ-7 are essential for AMPA receptor expression in the cerebellum. Eur J Neurosci. 2010;31:2204–2220. doi: 10.1111/j.1460-9568.2010.07254.x. [DOI] [PubMed] [Google Scholar]
- Yan XX, Ribak CE. Developmental expression of γ-aminobutyric acid transporters (GAT-1 and GAT-3) in the rat cerebellum: evidence for a transient presence of GAT-1 in Purkinje cells. Dev Brain Res. 1998;111:253–269. doi: 10.1016/s0165-3806(98)00144-8. [DOI] [PubMed] [Google Scholar]