

Abstract
Connectivity and dendritic properties are determinants of plasticity that are layer and cell-type specific in the neocortex. However, the impact of experience-dependent plasticity at the level of synaptic inputs and spike outputs remains unclear along vertical cortical microcircuits. Here I compared subthreshold and suprathreshold sensitivity to prolonged monocular deprivation (MD) in rat binocular visual cortex in layer 4 and layer 2/3 pyramids (4Ps and 2/3Ps) and in thick-tufted and nontufted layer 5 pyramids (5TPs and 5NPs), which innervate different extracortical targets. In normal rats, 5TPs and 2/3Ps are the most binocular in terms of synaptic inputs, and 5NPs are the least. Spike responses of all 5TPs were highly binocular, whereas those of 2/3Ps were dominated by either the contralateral or ipsilateral eye. MD dramatically shifted the ocular preference of 2/3Ps and 4Ps, mostly by depressing deprived-eye inputs. Plasticity was profoundly different in layer 5. The subthreshold ocular preference shift was sevenfold smaller in 5TPs because of smaller depression of deprived inputs combined with a generalized loss of responsiveness, and was undetectable in 5NPs. Despite their modest ocular dominance change, spike responses of 5TPs consistently lost their typically high binocularity during MD. The comparison of MD effects on 2/3Ps and 5TPs, the main affected output cells of vertical microcircuits, indicated that subthreshold plasticity is not uniquely determined by the initial degree of input binocularity. The data raise the question of whether 5TPs are driven solely by 2/3Ps during MD. The different suprathreshold plasticity of the two cell populations could underlie distinct functional deficits in amblyopia.
Introduction
Connectivity of pyramidal neurons is layer specific in primary visual cortex (V1) (Burkhalter, 1989; Thomson and Bannister, 2003), and this is reflected in laminar differences of their response properties (Martinez et al., 2005; Niell and Stryker, 2008; Medini, 2011). Whether this also results in a differential sensitivity to manipulations of the sensory environment, as exemplified by monocular deprivation (MD) effects, remains unclear. Extracellular studies indicated that ocular dominance plasticity occurs through the entire cortical depth, with limited—but also controversial—laminar differences. In rodents, plasticity is slightly larger in infragranular layers in mice (Gordon and Stryker, 1996) but not layer specific in rats (Caleo et al., 1999). However, MD produces layer-specific changes in layer 5 tufted pyramidal neurons (5TPs) and layer 2/3 pyramidal neurons (2/3Ps) in terms of excitability (Maffei and Turrigiano, 2008; Nataraj et al., 2010) and spine density (Mataga et al., 2004; Hofer et al., 2009). Functionally, in animals with ocular dominance columns, ocular dominance plasticity is less pronounced in layer 4 [ferrets (Issa et al., 1999), cats (Shatz and Stryker, 1978; Daw et al., 1992), and monkey (Hubel et al., 1977)], possibly because this lamina is driven mostly monocularly (Shatz and Stryker, 1978). However, even when the recording positions were reconstructed (Shatz and Stryker, 1978; Gordon and Stryker, 1996; Issa et al., 1999), the identity of recorded neurons remained uncertain. This is important because plasticity is cell-type specific even within a layer (Gandhi et al., 2008; Mainardi et al., 2009; Yazaki-Sugiyama et al., 2009). In addition, extracellular recordings are biased toward highly spiking cells, and firing rates depend on the laminar and cellular identity in rodent V1 (Niell and Stryker, 2008; Medini, 2011). Finally, they do not provide direct information about subthreshold plasticity. Thus, it remains difficult to infer whether and up to which degree MD synaptic effects are layer and cell-type specific along vertical V1 microcircuits. This possibility is plausible because plasticity depends on features that are lamina and cell-type specific. First, cortical connectivity determines binocularity of each cell type and hence the degree of activity-dependent competition. In addition, the integration properties of dendrites are also layer specific in the neocortex (for review, see Spruston, 2008). Finally, the availability to modify the molecules responsible for experience-dependent plasticity depends on laminar position (Liu et al., 2008; Wright et al., 2008; Yoon et al., 2009).
The identification of layer- and cell-type-specific ocular dominance plasticity is important to understand the role of specific subpopulations of neurons in the distinct deficits accompanying amblyopia (Prusky et al., 2000; Prusky and Douglas, 2003). This study compares subthreshold effects of MD on the morphologically different pyramidal neurons present along a V1 retinotopic position and relates them to suprathreshold plasticity. To this aim, I did intrinsic signal imaging (ISI)-targeted whole-cell recordings, followed by neuronal reconstructions, from thalamorecipient layer 4 pyramidal neurons (4Ps), overlying 2/3Ps, and from the two main, morphologically distinct deep layer 5 pyramids: 5TPs and layer 5 non-tufted pyramidal neurons (5NPs), which project to different extracortical targets in all mammals studied so far [mouse (Christophe et al., 2005), rat (Hallman et al., 1988; Kasper et al., 1994), hamster (Klein et al., 1986), and cat (Hübener et al., 1990)].
Materials and Methods
Monocular deprivation and eye protection
Long–Evans rats of either sex were anesthetized with avertin (tribromoethanol solution; 1 ml/100g animal weight) and placed on a thermostatic blanket. Eyelids were suture closed with 6-0 surgical wire (Ethicon) under a surgical microscope with three mattress stitches. Control littermates were anesthetized as well. Ophthalmologic ointment containing hydrocortisone and cloramphenicol was applied during surgery. Animals showing any reopening during the deprivation period or with corneal opacities (revealed at ophthalmoscopic examination on the day of recording) were discarded. During experiments, artificial tears were used to prevent corneal dehydration. In addition, ophthalmological examination of the cornea and the visible part of the lens through the pupils were repeatedly performed to exclude optical opacities of the eye optics.
Intrinsic signal imaging
Rats were anesthetized with urethane (0.8 ml/100 g of animal weight, of 20% solution in H2Od, i.p.). Dexamethazone (0.01 mg/kg) was injected intraperitoneally to prevent cortical and mucosal edema. Humidified oxygen was administered to the animal though a nose cannula, and body temperature was held at 37°C through a thermostatic blanket. Corneal and pinch reflexes, electrocardiogram, and breathing rate were continuously monitored during the experiment. Rats were mounted on a stereotaxic apparatus, and a region of skull lying above V1 of ∼4 × 4 mm was thinned until the underlying vasculature was clearly visible. An imaging chamber made with acrylic cement was built on the skull and filled with saline warmed at 37°C. A vasculature (“green”) image was acquired under 540 nm illumination before starting the imaging session. During ISI, the cortex was illuminated with monochromatic light of 630 nm wavelength. Images were acquired using a cooled 50 Hz CCD camera connected with a frame grabber (Imager 3001; Optical Imaging), defocused ∼500–600 μm below the pial surface. Data frame duration was 200 ms, and a spatial binning of 3 × 3 was applied over the images, which were 4.35 × 4.35 mm, with a pixel resolution of ∼25 μm.
Visual stimulation during ISI.
Eye bulbs were kept fixed with metal rings adjusted so that the eye pupils projected at ∼55–57° with respect to the vertical meridian. Corneas were protected with artificial tears. The 20 × 20° squared spots were randomly projected in nine different positions. A craniotomy was opened in correspondence to the spot position neighboring the vertical meridian and at 20° of elevation. The spots displayed squared drifting gratings (duration, 8 s; spatial frequency, 0.05 cycles/°; speed, 2 cycles/s; contrast, 90%; mean grating luminance, 19 cd/m2). Stimulus orientation was randomly alternated during the 8 s of stimulation (every 45°, every second), and stimuli were randomly interleaved with a full-field blank screen whose luminance was equal to the mean luminance of the grating. This same background surrounded the stimulus spot. Stimuli were displayed at 25 cm from the animal's eyes on a Sony G520 cathode ray tube 22-inch monitor. Ten blank “first frames” were collected before stimulus onset. Computer-controlled mechanical eye shutters allowed independent stimulation of the two eyes during the imaging session. The correspondence of the contralateral and ipsilateral eye spots was always controlled. I did this to check that craniotomies were opened in the binocular part of rat V1.
Image analysis.
All image frames obtained during stimulus presentation were divided by the average image of the first 10 frames acquired just before stimulus presentation (Schuett et al., 2002). The relative decrease of reflectance, averaged over the stimulus presentation period, was then outlined. The spot area was taken as the image area in which the visually evoked decrease in reflectance was >50% of the peak decrease. This region was then overlaid with the vasculature green image.
Extracellular mapping
A 500 μm craniotomy was opened over the ISI spot, and the dura was carefully cut and lifted apart. Receptive field (RF) position and binocularity was then checked with 1–2 MΩ glass pipettes filled with normal rat Ringer's solution (in mm: 135 NaCl, 5.4 KCl, 1.8 CaCl2, and 1 MgCl2). The signal was bandpass filtered (500 Hz to 5 kHz) and amplified (10,000×), and the action potential (AP) activity was visualized and heard using an AP discriminator and timed counter (FHC). The projections of the pupils and the vertical and horizontal meridians were projected onto a tangent screen put at 20 cm from the animal's eyes. RF positions were plotted using light bars moved manually through a back projector. Pupils were left undilated, and corneal lenses were not necessary because of the emmetropy of the rat eye (Hughes, 1977). RF extracellular mapping always confirmed the validity of ISI as a targeting tool.
In vivo whole-cell recordings
Borosilicate patch pipettes (5–9 MΩ) filled with intracellular solution (135 mm K-gluconate, 10 mm HEPES, 10 mm Na phosphocreatine, 4 mm KCl, 4 mm ATP-Mg, 0.3 mm GTP, pH 7.2, and 3 mg/ml byocitin, 291 mOsm osmolarity) were lowered perpendicularly to the pia applying ∼300 mmHg of positive pressure until the layer of interest was reached (Margrie et al., 2002). At that point, positive pressure was lowered to 30 mmHg, and cells were searched for in voltage-clamp mode. On approaching a cell, pressure was relieved and light suction was applied to allow gigaseal formation. After capacitance compensation, a ramp of negative pressure usually led to whole-cell configuration. Recordings were performed with an Axoclamp 2B (Molecular Devices) operated in bridge mode. The membrane potential (Vm) signal was low-pass filtered at 10 kHz, digitized at 20 kHz using an ITC16 analog-to-digital converter (InstruTECH Corporation), and acquired using the program Pulse (HEKA). Access resistance was repeatedly monitored, compensated for, and ranged from 10 to 100 MΩ, without differences among recordings obtained from different layers (data not shown; one-way ANOVA, p = 0.59). Seal resistance was >1 GΩ, and spike height and overall Vm were stable throughout recordings. No holding current was used. Recording durations ranged from 20 min to 2 h. AP threshold was measured at the peak of the second derivative of the Vm trace (Wilent and Contreras, 2005), in agreement with the definition of AP threshold as the point of maximal Vm acceleration. No more than two whole-cell recordings were obtained per craniotomy to allow unambiguous identification and reconstruction of the recorded neurons.
Visual stimulation.
The screen was positioned at 20 cm from the rat's eyes. Moving light bars, 3° wide (luminance, 20 cd/m2; background luminance, 2 cd/m2; angular speed, 45–55°/s) of different orientations (every 45°) were separately presented to the two eyes. Sweeps were averaged over 30 presentations. A period of 4 s between the end of one stimulus presentation and the beginning of the next one was set to prevent adaptation of responsiveness.
Analysis of visual responses.
Data were analyzed using custom-made software written in IgorPro (Wavemetrics). For the analysis of subthreshold responses, APs were truncated using linear interpolation, and sweeps were averaged. For moving bar stimulation, postsynaptic potential (PSP) amplitude was computed with respect to the mean Vm during the interstimulus period. To compute the amplitude of visually evoked AP responses, mean spontaneous AP rates were subtracted to take into account layer- or cell-type-specific differences of this parameter. To compute peristimulus time histograms of AP counts, 100 ms binning was applied (Niell and Stryker, 2008). Cells were first screened for their preferred orientation using light bars moving at different angles (every 45°), and the ocular dominance was quantified by comparing the responses in the cell-preferred orientation during independent stimulation of the two eyes (via computer-controlled mechanical shutters). The order of stimulation of the two eyes was randomly chosen for each neuron. Ocular dominance was quantified by computing an ocular dominance index (ODI) for each recorded neuron defined as (C − I)/(C + I), where C and I are the peak responses to stimulation through the contralateral and ipsilateral eyes, respectively. This index varies from −1 to +1 for cells that are driven solely by the ipsilateral and contralateral eye, respectively, and is 0 when cells are perfectly binocularly driven.
Histochemical staining, neuronal reconstructions, and dendritic analyses
At the end of the recording session, animals were deeply anesthetized with urethane (intraperitoneally) and fixed through the heart with 60 ml of 0.1 m cold phosphate buffer, followed by 120 ml of 4% paraformaldehyde in 0.1 m phosphate buffer. Brains were postfixed in paraformaldehyde 4% in 0.1 m phosphate buffer overnight at 4°C. Coronal sections, 100 μm thick, were cut using a vibratome, stained for biocytin to reveal recorded neurons, and counterstained for cytochrome oxidase to reveal layer 4 (Brecht and Sakmann, 2002; Brecht et al., 2003; Tsiola et al., 2003). Sections were then mounted and coverslipped with Mowiol. Dendritic arbors of recorded neurons were reconstructed using a 100× oil objective (numerical aperture 1.4) using Neurolucida software (MicroBrightField) under bright-field microscopy.
Morphometric analysis
All morphometric analyses have been performed using Neuroexplorer (MicroBrightField), taking into account a shrinkage factor of 10% in the x and y planes and of 40% in the z plane. Dendritic lengths and number of nodes were separately calculated for basal and apical dendrites.
Results
Scarce effects of MD on the different dendritic geometries of pyramidal neurons
I did ISI-targeted in vivo whole-cell recordings in urethane-anesthetized Long–Evans rats to measure subthreshold and suprathreshold sensitivity to a saturating period of MD during the critical period (P21–P30), followed by anatomical identifications of neurons and dendritic reconstructions. All craniotomies were targeted by ISI into the upper central binocular visual field (see Materials and Methods). Targeting in vivo whole-cell recordings within the same retinotopic position minimizes the variations of those RF properties that depend on eccentricity, such as angular size and binocularity (Gordon and Stryker, 1996; Caleo et al., 1999; Rossi et al., 2001). Byocitin-filled, recorded cells were anatomically recovered, and cytochrome c counterstaining was used to reveal cortical layering (Tsiola et al., 2003). One hundred eighty-four cells were classified based on somata position with respect to cortical layering. For a subset of recovered cells, I reconstructed the entire dendritic arbor under bright-field microscopy (77 of 184 cells; Fig. 1). For both reconstructed and unreconstructed cells, two independent observers categorized layer 5 pyramids as 5TPs or 5NPs based on the presence or absence of a tufted, apical dendrite branching extensively within layer 1, respectively. Figure 2A shows microphotographs taken from unreconstructed, recorded pyramidal neurons of the different layers. For unreconstructed neurons, the separate estimates of the maximal coronal span of the apical and basilar dendrites, as visible from the section in which the apical dendrite maximally extended within layer 1, indicated a comparable span of the basilar dendrites (medians, 257 vs 245 μm for 5TPs and 5NPs, respectively; Mann–Whitney U statistic, p = 0.8) but a larger span of the apical dendrite for cells classified as 5TPs (medians, 325 vs 90 μm for 5TPs and 5NPs, respectively; Mann–Whitney U statistic, p < 0.001). Soma depth distributions of 5TPs and 5NPs were overlapping in rat V1 (Fig. 2B; t test, p = 0.6; for mouse V1, see Groh et al., 2010).
Figure 1.
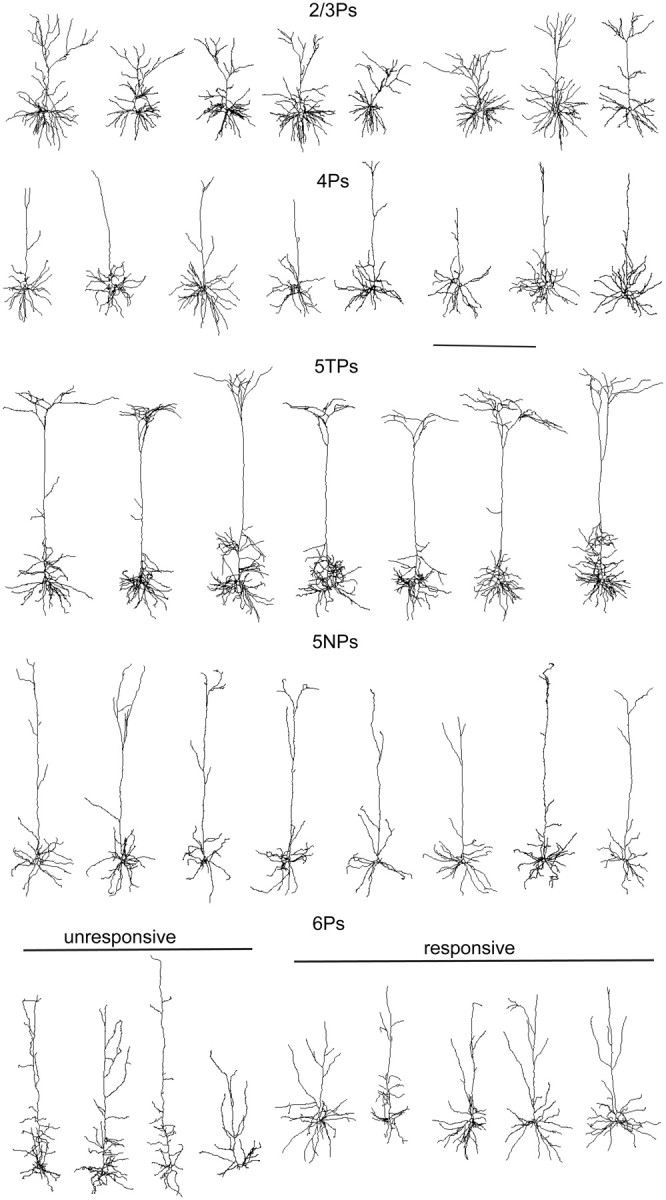
Dendritic reconstructions of intracellularly recorded pyramidal neurons along a retinotopic position in rat V1. Examples of coronal projections of the basal and apical dendrites of 2/3Ps, 4Ps, 5TPs, 5NPs, and 6Ps (from top to bottom). Note the absence of a clearly tufted apical dendrite in 4Ps and 5NPs. The bottom row shows examples of dendritic reconstructions of visually unresponsive (left) and responsive (right) 6Ps. Scale bar, 500 μm.
Figure 2.

5TPs and 2/3Ps had the longest and most branched apical dendrites. A, Microphotographs of unreconstructed 2/3P, 4P, 5TP, 5NP, and 6P. In the case of the 5TP, 5NP, and 6P cells, the microphotographs are obtained as a montage of pictures taken from different, adjacent coronal section due to the length of the apical dendrite. Scale bar, 100 μm. B, Histological depths of recovered 2/3Ps, 4Ps, 5TPs, 5NPs, and 6Ps. 5TPs and 5NPs were not clustered in different layer 5 sublaminae (p = 0.6). Conversely, visually responsive and unresponsive 6Ps were clustered in the upper and lower subdivisions of layer 6, respectively (*p < 0.05). C, Number of branching points (Nodes, left) and dendritic length (right) of the apical dendrites of reconstructed cells. The apical dendrites of 5TPs and 2/3Ps are significantly longer and more branched compared to 4Ps and 5NPs (post hoc tests, p < 0.05).
The morphometric analysis of the reconstructed pyramidal neurons located in the different laminae (n = 19 for 2/3Ps, n = 17 for 4Ps, n = 13 for 5TPs, n = 12 for 5NPs, and n = 16 for 6Ps) indicated that the investigated cell classes had different dendritic morphologies, particularly at the level of the apical dendrites. More specifically, 4Ps and 5NPs lacked a clearly tufted apical dendrite. Indeed, the morphometric analysis of the dendritic reconstructions showed that 5TPs and 2/3Ps had longer and more branched apical dendritic trees compared with both 4Ps and 5NPs (Fig. 2C; Kruskall–Wallis ANOVA, p < 0.001, and post hoc Dunn's tests, p < 0.05). Importantly, no consistent differences between these morphometric parameters were observed in the apical dendrites of normal and MD rats (Table 1; t tests, p > 0.2); thus, data were lumped in the morphometric analysis described above. Conversely, the morphometric analysis of the basilar dendrites revealed that MD caused a reduction of the branching density only in 2/3Ps, because the number of nodes was significantly lower in MD rats compared with controls (Table 1; t test, *p < 0.05), whereas the total dendritic length was normal compared with controls (t test, p = 0.36). This effect was not only cell-type specific but was also restricted to the basal dendrites, because it was not observed in the apical portions of the dendrites of 2/3Ps (t test, p = 0.41). Possibly, it goes in parallel with the decrease of spine density observed in the basilar (Mataga et al., 2004; Pizzorusso et al., 2006) but not in the apical (Hofer et al., 2009) dendrites of 2/3Ps during MD in rodents. Overall, the morphometric data indicate a scarce but cell-type-specific effect of MD on the dendritic geometry of cortical pyramids.
Table 1.
Morphometric analysis of dendrites in control and MD rats
| Nodes |
Length (μm) |
|||
|---|---|---|---|---|
| Controls | MD | Controls | MD | |
| Basilar | ||||
| 2/3Ps | 30.3 ± 1.7* | 23.6 ± 1.9* | 4619 ± 310 | 4111 ± 440 |
| 4Ps | 20.4 ± 2.0 | 18.9 ± 1.2 | 4251 ± 445 | 4110 ± 211 |
| 5TPs | 24.6 ± 2.8 | 22.4 ± 2.2 | 4738 ± 643 | 4834 ± 576 |
| 5NPs | 9.8 ± 1.5 | 14.5 ± 1.8 | 3034 ± 324 | 3524 ± 276 |
| 6Ps | 14.2 ± 1.9 | 15.0 ± 0.6 | 3114 ± 324 | 3921 ± 273 |
| Apical | ||||
| 2/3Ps | 20.9 ± 1.3 | 18.9 ± 2.3 | 3365 ± 288 | 3327 ± 434 |
| 4Ps | 6.3 ± 0.9 | 7.5 ± 1.0 | 1654 ± 188 | 1767 ± 203 |
| 5TPs | 32.4 ± 3.9 | 30.0 ± 3.7 | 6016 ± 894 | 5872 ± 818 |
| 5NPs | 12.7 ± 1.2 | 13.7 ± 2.4 | 2912 ± 287 | 2847 ± 253 |
| 6Ps | 15.7 ± 2.0 | 15.3 ± 0.9 | 2638 ± 153 | 3231 ± 365 |
Means ± SEM are reported.
*p < 0.05.
In all layers, neurons were clearly visually responsive at the subthreshold level. Suprathreshold visual responses accompanied subthreshold responses in all layers, apart in 2/3Ps. In 11 of 69 recorded 2/3Ps, it was not possible to evoke accompanying detectable visually driven AP responses, despite robust PSP responses, in agreement with the observations of sparse firing in supragranular layers of rodent V1 (Niell and Stryker, 2008; Medini, 2011). Only in layer 6, I found a significant amount of pyramidal neurons visually unresponsive at the subthreshold level, during stimulation with either moving or stationary stimuli (data not shown; 8 of 20 neurons). Visually unresponsive 6Ps were clustered within the deeper subdivision of layer 6 (Fig. 2B; t test, p < 0.05): they were either “tall” layer 6 pyramidal neurons (6Ps) of lower layer 6A or deep layer 6B neurons (Briggs, 2010) (Fig. 1). They were excluded from additional analysis.
Binocularity of synaptic inputs is not uniform: PSP responses of 5TPs and 2/3Ps were more binocular compared with 5NPs
Because ocular dominance plasticity is thought to be the outcome of a process of activity-dependent competition between the two eyes (Wiesel and Hubel, 1965; Gordon and Stryker, 1996), the shift of ocular preference caused by MD is expected to be larger in cells that receive more binocular inputs in normal conditions. However, it remains unclear whether and how binocularity of subthreshold inputs is lamina and cell-type specific. As a consequence, it remains uncertain up to which degree the degree of binocularity of a given cell population determines its ocular preference shift. Thus, I first investigated whether in normal rats the subthreshold ocular preference is similar or different among 4Ps (n = 16), 2/3Ps (n = 32), 5TPs (n = 12), 5NP (n = 12), and visually responsive 6Ps (n = 6) within a functionally identified retinotopic position. To quantify the ocular preference of visual cortical neurons, I compared the peak amplitudes of subthreshold and suprathreshold responses to stimulation with optimally oriented moving light bars, which were separately presented to the contralateral and ipsilateral eyes (see Materials and Methods). Figure 3A shows examples of PSP and AP responses of pyramidal neurons of the various laminae, averaged over 30 stimulus presentations. For each neuron, I computed an ocular dominance index (ODI), defined as (C − I)/(C + I), where C and I are the amplitudes of visual responses to independent contralateral and ipsilateral eye stimulation, respectively (Rittenhouse et al., 1999; Pizzorusso et al., 2002; Mrsic-Flogel et al., 2007; Gandhi et al., 2008). This index varies from −1 to +1 depending on whether cells are dominated by the ipsilateral or contralateral eye, respectively, whereas the ODI is 0 for perfectly binocular neurons. The contralateral eye often dominated synaptic responses. The examples of subthreshold responses of Figure 3 show that 5TPs and 2/3Ps are similarly binocular in terms of synaptic inputs compared with the remaining cell types. A comparison between the subthreshold ODIs (PSP-ODIs) of the cell populations under study revealed indeed that the ocular preference of V1 pyramids is not uniform across layers and cell types (Fig. 4A; Kruskall–Wallis ANOVA on ranks, p < 0.001). PSP responses of 2/3Ps and 5TPs were significantly more binocular (median PSP-ODIs, 0.11 and 0.05, respectively) compared with 5NP (median PSP-ODI, 0.41), which tended to be monocularly driven through the contralateral eye (post hoc Dunn's tests, p < 0.05). In a few 5NPs (3 of 13), contralateral eye stimulation gave rise to depolarizing responses, whereas ipsilateral eye stimulation produced hyperpolarizing responses. In these cases, the ODI became >1 as the response to ipsilateral eye stimulation had a negative value. PSP-ODI of 4Ps and 6Ps were between those of 5TPs and 2/3Ps on one side and those of 5NPs on the other and did not pop out as outliers in the statistical analysis.
Figure 3.

Examples of subthreshold and suprathreshold visual responses to contralateral (Contra) and ipsilateral (Ipsi) eye stimulation in normal and MD rats. A, Examples of subthreshold (top traces; gray, overlaid sweeps; black, averaged response without spike removal here) and suprathreshold (bottom peristimulus time histograms) recorded from 2/3Ps, 4Ps, 5NPs, 5TPs, and 6Ps during independent contralateral and ipsilateral eye stimulation (left and right columns, respectively) with optimally oriented moving light bars in control rats. The bar starts moving at 0 s and ends sweeping the stimulation screen 1 s before the end of the sweep. Note the more pronounced binocularity of synaptic and spike responses of the 2/3P and of the 5TP compared with remaining cell types. B, Similar representative examples recorded from MD rats. Note the dramatic loss of responsiveness through contralateral (closed) eye stimulation in the 2/3Ps and in the 4Ps. The effect of MD on the ocular preference was much smaller in the 5TP compared with overlying pyramids and not detectable in the 5NP. Note the high contralateral bias of these 6Ps.
Figure 4.
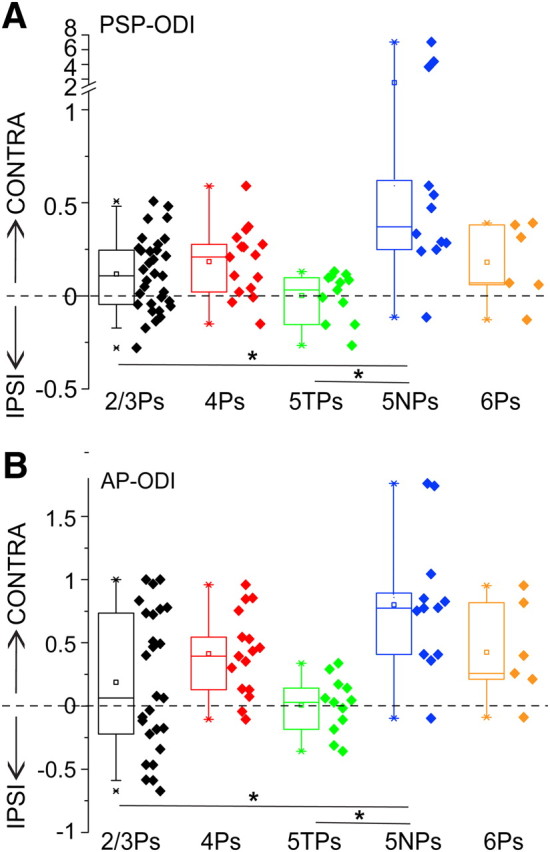
Subthreshold and suprathreshold responses of 5TPs and 2/3Ps are more binocular compared with 5NPs. ODIs for subthreshold (A) and suprathreshold (B) responses of 2/3Ps, 4Ps, 5TPs, 5NPs, and 6Ps in normal rats. Dashed line is the perfect binocularity line (ODI = 0). Median ODIs of 2/3Ps and 5TPs were significantly more binocular compared with those of 5NPs for both PSP and AP responses (Dunn's post hoc tests, *p < 0.05). IPSI, Ipsilateral eye; CONTRA, contralateral eye.
The data indicate that layer 5 contains the two cell types that are the most and least binocular in terms of synaptic inputs along V1. PSP responses of 2/3Ps and 5TPs were both highly binocular.
Visually driven AP responses of 5TPs and 5NPs were the most and least binocular along V1
The comparison of the suprathreshold ocular preference of V1 pyramids indicated that the contralateral bias of visual responses was significantly more pronounced for the population of 5NPs [median suprathreshold ODI (AP-ODI), 0.78] compared with both 5TPs and 2/3Ps (Fig. 4B; median AP-ODIs, 0.04 and 0.07, respectively; Kruskall–Wallis ANOVA on ranks, p < 0.001 and post hoc Dunn's tests, p < 0.05). AP responses of the vast majority of 5TPs were highly binocular, because their AP-ODIs were centered on zero for the majority of cells (median AP-ODI, 0.04; 25th to 75th percentile, −0.18/0.14). Interestingly, also 2/3Ps were on average similarly highly binocular (median AP-ODI, 0.07, statistically undistinguishable from that of 5TPs; post hoc test, p = 0.4). However, single-cell values of the AP-ODIs were spread over a threefold larger range in the case of 2/3Ps compared with 5TPs (25th to 75th percentile, −0.22/0.73).
Thus, layer 5 contains two morphologically distinct subpopulations of output pyramidal neurons that differ in terms of their suprathreshold binocularity. In one group of cells, visually driven firing is almost monocularly driven through the contralateral eye (5NPs), whereas in the other group the vast majority of cells were highly binocular (5TPs).
Relation between the subthreshold and suprathreshold ocular preferences in the different cell types
The comparison between the subthreshold and suprathreshold ocular preferences of V1 pyramids indicated that their ocular preference was sharper at the AP level, as described in cat V1 (Priebe, 2008). As indicated by the examples of Figure 3, the AP threshold amplified a slight subthreshold ocular preference for the ipsilateral or contralateral eye. The scatter plot of Figure 5A, left, shows the relationship between the subthreshold and suprathreshold ocular preferences of the different cell types. Overall, it is evident that the vast majority of cortical pyramids receive dominant inputs from the contralateral eye (PSP-ODI > 0) and produce AP outputs that are even more contralateral, as shown by the fact that most of the dots reside above the dashed line (that is, AP-ODI > PSP-ODI). The same data are presented as an x–y error plot (Fig. 5A, right), which summarizes the main findings described above: (1) layer 5 contains the two populations of output pyramidal neurons whose AP responses are the most and the least binocular along a V1: 5TPs (green) and 5NPs (blue), respectively; (2) 2/3Ps (black) and 5TPs (green) are similarly binocular at the PSP level but produce AP responses that are highly and scarcely binocular, respectively (note the similar PSP-ODI error but the threefold larger AP-ODI error of 2/3Ps).
Figure 5.

Relation between subthreshold and suprathreshold ocular dominance in the different types of V1 pyramids. A, Left, Scatter plot of the PSP-ODIs and AP-ODIs for the various types of recorded V1 pyramids. The majority of neurons are dominated by contralateral inputs (PSP-ODIs > 0) and produces AP outputs that are even more contralateral (points residing above the dashed line). Right, Same data shown as x–y error plot. Note that (1) 5TPs and 5NPs are the most and least binocular cells along V1, in terms of both inputs and outputs and (2) 5TPs and 2/3Ps are similarly binocular at the subthreshold level but produce AP responses that are highly binocular (5TPs; green) or dominated by one or the other eye (2/3Ps; black). This is indicated by the threefold larger Y (AP-ODI) error of the 2/3Ps compared with 5TPs. Data are medians ± interquartile ranges. B, Paired plots showing the relation between subthreshold and suprathreshold ocular dominance for the various cell types. When absolute values of the ODIs were paired tested, in all cell types, the ocular preference was sharper at the AP level compared with PSP responses [signed-rank paired tests, *p < 0.01, (*)p = 0.07], with the noticeable exception of 5TPs (p = 0.35). Ipsi, Ipsilateral eye.
This latter difference is attributable to the fact that 2/3Ps and 5TPs differentially convert the subthreshold into the suprathreshold ocular preference. The paired plots of Figure 5B show the relation between the PSP-ODIs and the AP-ODIs in each recorded neuron for the various cell types. For the paired comparisons between PSP-ODIs and AP-ODIs, the absolute values of the ODIs were considered to eliminate the confounding effects of the different eye preferences of the various cells. In addition the few 5NPs with ODIs > 1 (that is, showing hyperpolarizing responses to ipsilateral eye stimulation) were excluded: indeed, their PSP-ODI was larger than the AP-ODI because the amplitude AP responses cannot be negative. In the case of both 4Ps and 2/3Ps, the suprathreshold ocular preference was significantly sharper compared with the corresponding subthreshold ocular preference (signed-rank paired test, p < 0.001 and < 0.01, respectively). That is, a slight ocular preference at the subthreshold level is amplified at the suprathreshold level by the nonlinear nature of the AP threshold. A sharper contralateral bias was also present in 5NPs (p < 0.01), and a clear trend was present also in 6Ps (p = 0.07). Conversely, the ocular preference of 5TPs did not become significantly sharper for AP responses compared with PSPs (p = 0.35). Thus, the sharpening of the ocular preference by the AP threshold is much less pronounced in 5TPs compared with the remaining cell classes. This could be attributable to the smaller difference between the resting Vm and the AP threshold in 5TPs versus 2/3Ps combined with the different AP-generating mechanisms of the two cell types (single and sparse APs in the case of 2/3Ps vs AP bursts in the case of 5TPs; see paragraph “MD effects on subthreshold and suprathreshold spontaneous activity,” below).
Thus, the eye that is dominant at the subthreshold level becomes even stronger at the suprathreshold level for all cell classes, with the noticeable exception of 5TPs.
MD shifted the subthreshold ocular preference of 2/3Ps and 4Ps, mostly by depressing deprived-eye inputs
The observation that in normal animals binocularity varies with cell types indicates that it is important to perform the analysis of MD effects on this parameter within a given cell type (in MD rats: n = 26 for 2/3Ps, n = 15 for 4Ps, n = 18 for 5TPs, n = 11 for 5NPs, and n = 6 for 6Ps). As shown in the examples of Figure 3B, a saturating period of MD during the critical period (P21–P30) caused a robust shift in the subthreshold ocular preference of both 4Ps and 2/3Ps in favor of the open eye. PSP-ODIs dropped from 0.18 ± 0.05 to −0.14 ± 0.11 for 4Ps and from 0.12 ± 0.03 to −0.20 ± 0.06 for 2/3Ps (Fig. 6A; t tests, p < 0.01 and p < 0.001, respectively). This is reflected in the fact that the percentage of cells dominated by the synaptic inputs coming from the contralateral eye (closed in MD animals) dropped from 66% (21 of 32) to 27% (7 of 26) during MD in 4Ps and from 81% (13 of 16) to 20% (3 of 15) in 2/3Ps. The ocular preference shift of AP responses was even larger compared with PSPs for both 4Ps (Fig. 6B; median AP-ODIs, 0.41 vs −0.53 for normal and MD rats, respectively; Mann-Whitney U statistic, p < 0.01) and 2/3Ps (Fig. 6B; median AP-ODIs, 0.07 vs −0.66 for normal and MD rats, respectively; Mann-Whitney U statistic; p < 0.001).
Figure 6.
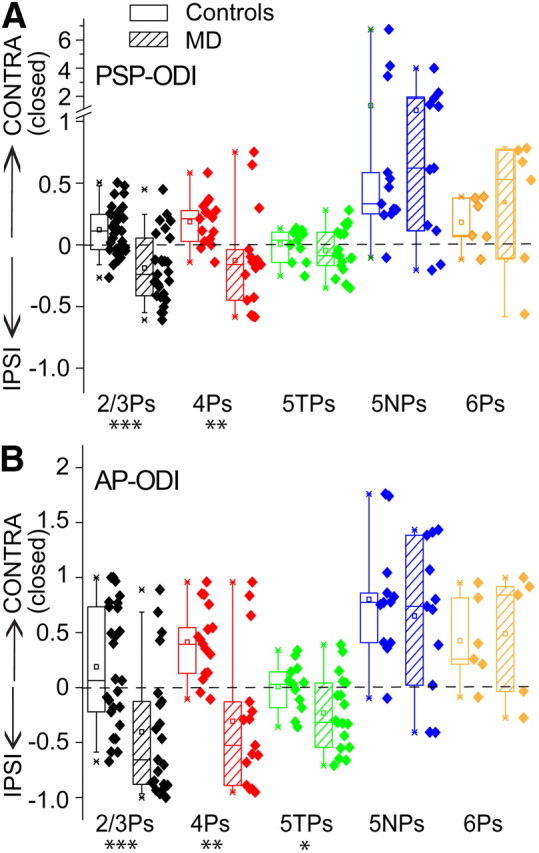
Layer- and cell-type-specific effects of MD on the ocular preference of V1 pyramidal neurons. Changes of subthreshold (A) and suprathreshold (B) ODIs of 2/3Ps, 4Ps, 5TPs, 5NPs, and 6Ps after MD (dashed boxes) compared with controls (open boxes). Note the highly significant reduction of ODIs observed in 4Ps and 2/3Ps (***p < 0.001 and **p < 0.01 for PSP and AP responses, respectively). For PSPs, the ocular preference shift caused by MD was sevenfold smaller in 5TPs compared to overlying pyramids and not significant (p = 0.4 vs controls). It became larger and barely significant for AP responses (*p = 0.04). No detectable ocular preference shift was observed in 5NPs at both the PSP and AP levels (p > 0.6). IPSI, Ipsilateral eye; CONTRA, contralateral eye.
To dissect to which degree the subthreshold ocular preference shift was attributable to potentiation of open-eye inputs or to depression of deprived-eye inputs, I separately analyzed the amplitude of visual responses driven by the closed, contralateral eye and by the open, ipsilateral eye. In 4Ps, depression of deprived-eye synaptic responses (Fig. 7) was highly significant for both PSPs (17.3 ± 1.3 vs 10.3 ± 1.6 mV; t test, p < 0.01) and AP responses (medians, 1.60 vs 0.32 APs/stimulus/bin; Mann–Whitney U statistic, p < 0.01). The same occurred for PSP responses of 2/3Ps (15.6 ± 1.0 vs 10.3 ± 0.9 mV; t test, p < 0.001). AP responses of 2/3Ps were much smaller compared with those of 4Ps but still significantly depressed compared with those of controls during MD (medians, 0.37 vs 0.06 APs/stimulus/bin; Mann–Whitney U statistic, p < 0.01).
Figure 7.
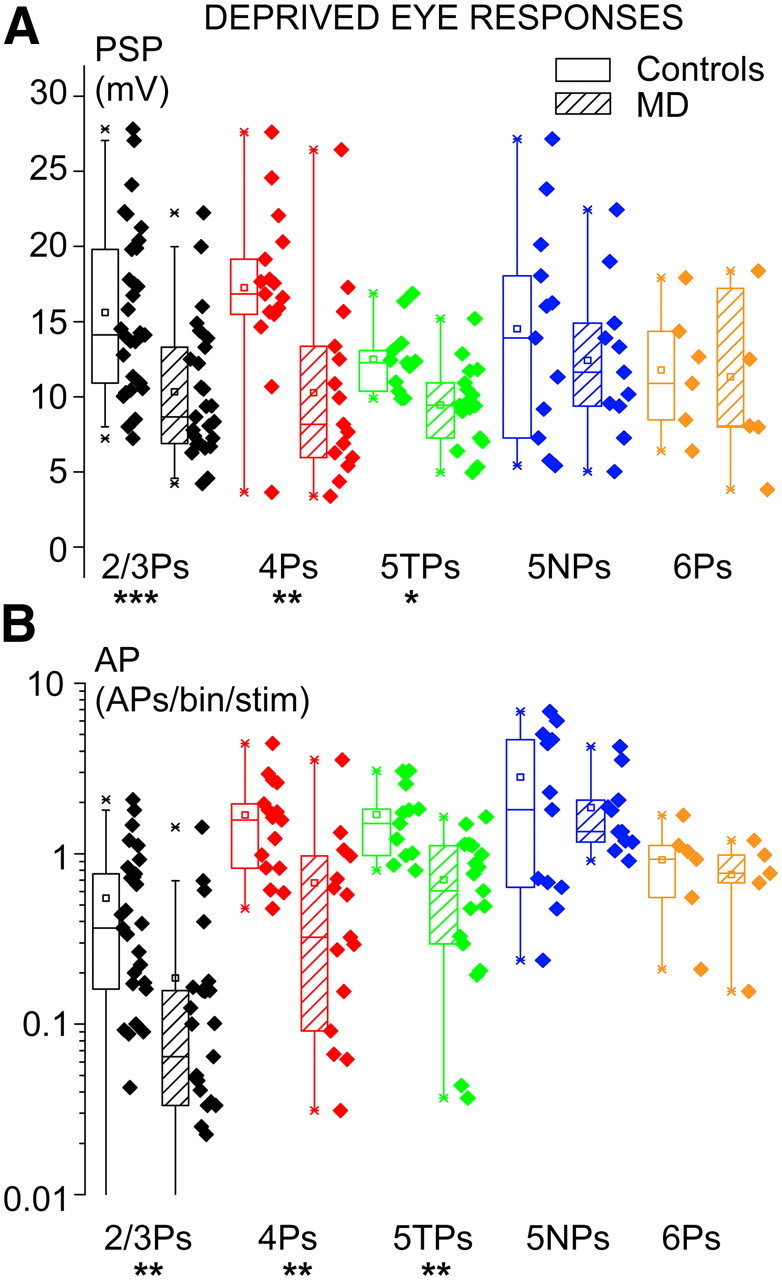
Loss of responsiveness through the deprived eye was larger in 4Ps and 2/3Ps compared with 5TPs, and not detectable in 5NPs. PSP (A) and AP (B) responses through contralateral (closed) eye stimulation in normal (open boxes) and MD (dashed boxes) rats. Note the highly significant reduction of responses recorded from 4Ps (**p < 0.01) and 2/3Ps (***p < 0.001). The loss of responsiveness was much smaller but significant in 5TPs (*p < 0.05). In 5NPs, the loss of responsiveness was not detectable (p > 0.4).
A trend for potentiation of open-eye synaptic inputs was clearly present (Fig. 8A), albeit this component of the plastic response was weaker compared with depression of closed-eye responses and at the border of significance in both 4Ps (12.4 ± 1.3 vs 14.3 ± 1.7 mV; t test, p = 0.05) and 2/3Ps (12.9 ± 1.1 vs 15.7 vs 1.1 mV; t test, p = 0.08). Potentiation of open-eye responses became significant when AP responses were analyzed in 4Ps (Fig. 8B; medians, 0.49 vs 1.23; Mann–Whitney U statistic, p < 0.05) but not in 2/3Ps (medians, 0.26 vs 0.43 APs/stimulus/bin; Mann–Whitney U statistic, p = 0.1).
Figure 8.

MD induced limited potentiation of open-eye synaptic responses. Effects of MD on ipsilateral, open-eye responses for PSPs (A) and APs (B) in normal (open boxes) and MD (dashed boxes) rats. Although a clear trend for potentiation was present in both 4Ps and 2/3Ps, it was significant only in L4Ps for AP responses (*p < 0.05). Note the loss of subthreshold and suprathreshold responsiveness to the left open eye in 5TPs (p = 0.06).
These data indicate that in rats MD causes a larger depression of deprived-eye subthreshold responses compared with potentiation of open-eye responses, possibly explaining the larger ocular preference shift observed in this species (Fagiolini et al., 1994) compared with mice (Gordon and Stryker, 1996).
A brief MD episode caused a partial but similar ocular preference shift in both 4Ps and 2/3Ps
Extracellular recordings in cat V1, which is endowed with ocular dominance columns, indicated that the first suprathreshold modifications caused by MD occur in layer 2/3 (Trachtenberg et al., 2000). However, recent visually evoked potential measurements in rodents, which instead lack ocular dominance columns in the main thalamorecipient lamina, indicated that a brief episode of MD during the critical period causes an ocular preference shift that is expressed in layer 4 since the very beginning (Liu et al., 2008; Khibnik et al., 2010). In addition, this is accompanied by detectable modifications of thalamocortical synapses in layer 4 (Coleman et al., 2010). I directly measured the changes of visually driven synaptic inputs and spike outputs of granular (n = 11) and supragranular (n = 11) pyramidal neurons during brief MD. Two days of MD (P21–P23) caused an intermediate ocular preference shift compared with the one observed in long-term MD animals at both PSP level (Fig. 9A, left; median PSP-ODIs for normal, 2 d of MD and 10 d of MD rats: 0.21 vs −0.11 vs −0.17 in 4Ps; 0.11 vs −0.02 vs −0.2 in 2/3Ps) and AP level (Fig. 9A, right; median AP-ODIs for normal, 2 d of MD and 10 d of MD rats: 0.41 vs −0.25 vs −0.53 in 4Ps; 0.07 vs −0.14 vs −0.66 in 2/3Ps). The separate analysis of the PSP and AP responses to stimulation of the closed (contralateral) and open (ipsilateral) eye indicated that depression of responsiveness to the closed eye was significant already after 2 d of MD in both 4Ps (Fig. 9B, left; 17.3 ± 1.3 vs 12.8 ± 1.5 mV, t test, p < 0.05) and 2/3Ps (15.6 ± 1.0 vs 12.4 ± 0.8 mV, t test, p < 0.05). The same held for AP responses driven by the contralateral, closed eye (Fig. 9B, right; medians for 4Ps, 1.6 vs 0.5 APs/stimulus/bin, Mann–Whitney U statistic, p < 0.01), albeit the decrease of responsiveness was less pronounced in 2/3Ps (medians, 0.37 vs 0.21 APs/stimulus/bin, Mann–Whitney U statistic, p = 0.09). Loss of PSP and AP responsiveness was similarly partial in both cell types compared with the levels attained during long-term MD (Fig. 9B). No significant changes of the amplitude of ipsilateral, open-eye PSP responses were observed during brief MD (Fig. 9C; PSPs, 12.4 ± 1.3 vs 11.0 ± 1.7 mV for 4Ps, 12.9 ± 1.1 vs 14.2 ± 2.0 mV for 2/3Ps; t tests, p > 0.5; median AP responses, 0.49 vs 0.37 APs/stimulus/bin for 4Ps, 0.26 vs 0.33 for 2/3Ps, Mann–Whitney U statistics, p > 0.25).
Figure 9.
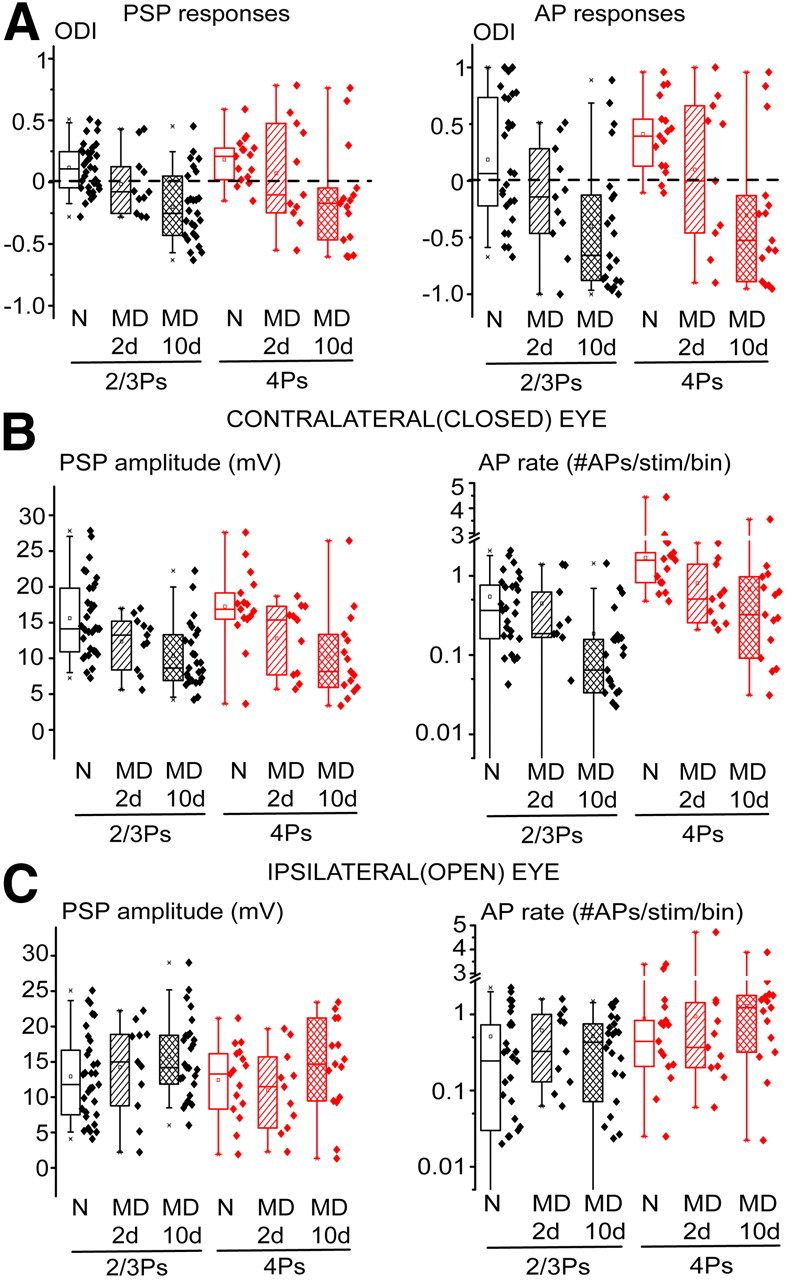
Brief MD caused a nonsaturating shift of ocular preference and loss of responsiveness to the closed eye in 4Ps and 2/3Ps. A, A brief MD episode (MD 2d; P21–P23) caused a partial, nonsaturating shift of subthreshold (left) and suprathreshold (right) ocular preference in 2/3Ps (black) and 4Ps (red) compared with those observed during 10 d of MD (MD 10d). B, Similarly, loss of responsiveness to closed-eye stimulation was also partial and nonsaturating during brief MD compared with prolonged MD for both PSP (left) and AP (right) responses. C, Ipsilateral, open eye responses were not modified after brief MD (Mann–Whitney U statistics, p > 0.25). N, Normal.
Thus, the results indicate that open-eye input potentiation occurs later compared with depression of deprived-eye responses (Mioche and Singer, 1989; Frenkel and Bear, 2004; Mrsic-Flogel et al., 2007). Also, the data indicate that in rats, as in mice (Liu et al., 2008; Khibnik et al., 2010), ocular dominance plasticity is primarily expressed in 4Ps at the level of synaptic inputs already during brief MD.
Synaptic effects of MD are smaller in 5TPs compared with overlying pyramids and not detectable in 5NPs
Subthreshold effects of MD were quantitatively and qualitatively different in the main output pyramids of layer 5 compared with overlying 4Ps and 2/3Ps. This is shown in the representative examples of MD effects of Figure 3. The ocular preference shift observed at the level of subthreshold inputs in 5TPs, as expressed by a decrease of the mean PSP-ODI, was only 0.05. It was approximately sevenfold smaller compared with that observed in both 4Ps (0.32) and 2/3Ps (0.32). Overall, the synaptic responses of 5TPs shifted only slightly in favor of the open eye, and the effect was not significant (Fig. 6A; 0.00 ± 0.04 vs −0.05 ± 0.04; t test, p = 0.4). However, the separate analysis of the subthreshold responses of the two eyes indicated that MD caused a slight but significant depression of synaptic responsiveness in 5TPs (Fig. 7A; 12.6 ± 0.7 vs 9.5 ± 0.6 mV; t test, p < 0.05). Unexpectedly, ipsilateral (open) eye responses of 5TPs were also smaller in MD rats compared with controls, the difference barely reaching statistical significance (Fig. 8A; 12.8 ± 1.0 vs 10.5 ± 0.7 mV; t test, p = 0.05). This generalized loss of responsiveness of 5TPs explained why I found a slight but significant loss of synaptic responsiveness to the closed eye in the absence of a significant subthreshold ocular preference shift.
The suprathreshold ocular preference shift of 5TPs barely reached significance (Fig. 6B; 0.01 ± 0.08 vs −0.23 ± 0.08; t test, p = 0.04). It was twofold smaller compared with 2/3Ps and threefold smaller compared with 4Ps. However, loss of responsiveness to deprived-eye stimulation was once again significant at AP level (Fig. 7B; 51% loss of responsiveness; medians, 1.60 vs 0.73 APs/stimulus/bin; Mann–Whitney U statistic, p = 0.001). Response depression was approximately twofold smaller compared with that observed in 4Ps and 2/3Ps (84 and 81% decreases of responsiveness, respectively). As for PSPs, AP responses driven by the ipsilateral, open eye were smaller (approximately twofold) compared with controls, and the effect was at the border of statistical significance (Fig. 8B; medians, 1.61 vs 0.87 APs/stimulus/bin; Mann–Whitney U statistic, p = 0.06). These data indicate a generalized decrease of visual responsiveness of 5TPs that was, however, larger for deprived-eye responses. This was a cell-type-specific effect, because it contrasts with the effects of MD on ipsilateral eye responses in the overlying 4Ps and 2/3Ps. Interestingly, this is in line with recent data from slice work indicating that MD reduces intrinsic excitability (input resistance) selectively in 5TPs (Nataraj et al., 2010), as opposed to 2/3Ps (Maffei and Turrigiano, 2008) and 4Ps (Maffei et al., 2006).
In the sample of recovered 5NPs, MD effects were not detectable. As shown in the plots of Figure 6, most cells remained strongly dominated by the closed (contralateral) eye inputs in MD rats (9 of 11 in MD rats vs 11 of 12 in controls). Noticeably, I observed the presence of 5NPs that were robustly depolarized by the closed eye but were hyperpolarized by open-eye stimulation also in MD rats (5 of 11; see example in Fig. 3B). Overall, MD did not cause an appreciable ocular preference shift at PSP level in 5NPs (Fig. 6A; medians, 0.40 vs 0.63 for controls and MD rats, respectively; Mann–Whitney U statistic, p = 0.97). No consistent suprathreshold shift of the ocular preference of 5NPs was observed (Fig. 6B; medians, 0.78 vs 0.74; Mann–Whitney U statistic, p = 0.64). The analysis of the responses to closed- and open-eye stimulation failed to reveal a consistent depression of closed-eye responses for both PSPs (Fig. 7A; 14.4 ± 2.0 vs 12.5 ± 1.5 mV; t test, p = 0.42) and APs (Fig. 7B; medians: 2.0 vs 1.4 APs/stimulus/bin; Mann–Whitney U statistic, p = 0.78). No potentiation of open-eye responses occurred (Fig. 8; PSPs, 5.6 ± 2.1 vs 2.2 ± 2.1 mV, respectively for controls and MD rats; t test, p = 0.3; APs, 0.38 vs 0.23 APs/stimulus/bin; Mann–Whitney U statistic, p = 0.88).
Differences in suprathreshold plasticity of 2/3Ps and 5TPs
Mounting evidences indicate that several deficits in visually driven behavior observed in amblyopia originate in extrastriate cortical areas (Kiorpes et al., 1998; Kiorpes, 2006; El-Shamayleh et al., 2010). Thus, as 5TPs and 2/3Ps are the main pyramidal neurons projecting outside V1 that were affected by MD, I compared the suprathreshold effects of MD in these two cell types. In normal rats, the medians of the AP-ODIs of 2/3Ps and 5TPs are comparable, that is, at the population level (Figs. 4B, 5A). However, whereas almost all 5TPs were highly binocular at the suprathreshold level, the AP responses of single 2/3Ps were typically dominated by either the contralateral or the ipsilateral eye, accounting for the “salt and pepper” ocular dominance output pattern described in supragranular layers with two-photon microscopy (see also Mrsic-Flogel et al., 2007). This is shown by Figure 10A, which plots the relative frequency distributions of the ODIs for AP responses of 2/3Ps and 5TPs in normal animals (white bars). It is evident that the ODIs of the AP responses of 5TPs were in the vast majority of cases centered on 0 (high binocularity), whereas the AP responses of 2/3Ps tend to cluster into two groups that were preferentially driven by the ipsilateral or contralateral eye. Thus, the 5TPs and 2/3Ps are highly binocular in terms of synaptic inputs but produce AP outputs that, at the single-cell level, are poorly and highly binocular, respectively. This is indicated by the similar spread of PSP-ODIs, which becomes, however, threefold larger for AP-ODIs (Figs. 4B, 5A). To quantify this difference in suprathreshold binocularity between 5TPs and 2/3Ps, I computed a binocular index (BI) for every neuron, defined as the absolute value of the inverse of the ODI (C + I/C − I, where C and I are the amplitudes of visual responses driven by the contralateral and ipsilateral eyes, respectively). Thus, the BI of AP responses is 1 for monocular cells and becomes higher the more binocular neurons are. In normal rats, the BIs of AP responses of 5TPs were significantly higher compared with 2/3Ps (Fig. 10B, open boxes; median BIs, 6.4 vs 2.0; Mann–Whitney U statistic, p < 0.01).
Figure 10.
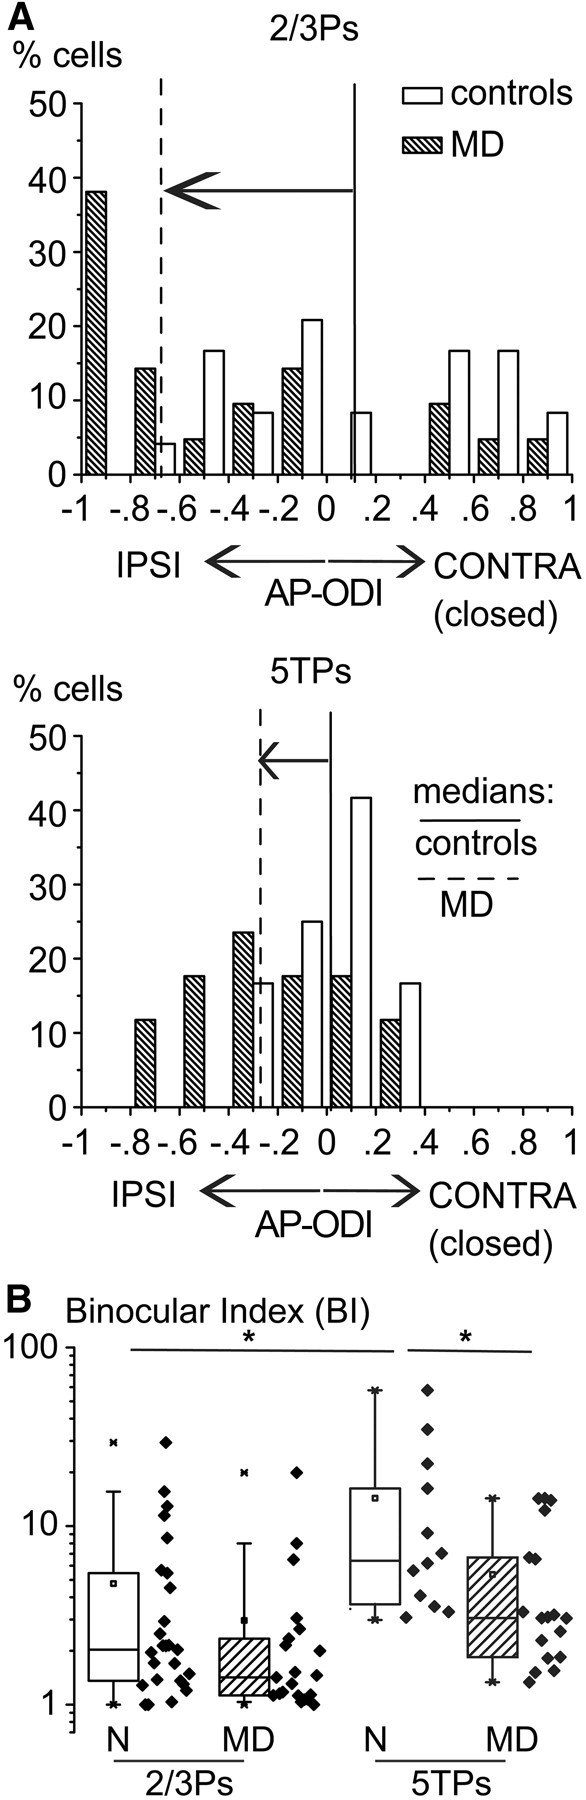
Differences in suprathreshold plasticity between 2/3Ps and 5TPs. A, MD caused an approximately twofold larger ocular preference shift of AP responses in 2/3Ps compared with 5TPs. Relative frequency distributions of AP-ODIs of 2/3Ps (top) and 5TPs (bottom) obtained from normal (N; black bars) and MD rats (dashed bars). The vertical lines are medians of ODIs for normal rats (continuous lines) and MD rats (dashed lines). Note that 5TPs had an ocular dominance distribution that is more centered around 0 (higher binocularity) but underwent a smaller ocular preference shift compared with 2/3Ps. B, Larger loss of binocularity of 5TPs compared with 2/3Ps after MD. Binocularity of single cells was computed as the absolute value of (C + I)/(C − I), where C and I are the amplitudes of AP responses to contralateral and ipsilateral eye stimulation, respectively. In normal rats, binocularity was larger for 5TPs compared with 2/3Ps (*p < 0.05). Loss of binocularity during MD was larger and significant only in 5TPs (p < 0.05) compared with 2/3Ps (p = 0.15). IPSI, Ipsilateral eye; CONTRA, contralateral eye.
After MD, 5TPs underwent smaller ocular preference shift at the AP level compared with 2/3Ps (Fig. 10A, dashed bars; vertical lines are AP-ODI medians). However, all 5TPs consistently lost their typically high binocularity during MD. The loss of binocularity of AP responses, as expressed by the decrease of their BI, was larger for 5TPs (Fig. 11B; medians, 6.4 vs 3.0; Mann–Whitney U statistic, p < 0.05) compared with 2/3Ps (not significant; medians, 2.0 vs 1.4; Mann–Whitney U statistic, p = 0.15).
Figure 11.

Effects of MD on spontaneous activity of V1 pyramidal neurons. Effects of MD on resting Vm values (left; measured during down states), spontaneous AP rates (middle), and AP threshold values in the various pyramidal neurons. MD caused a slight but significant hyperpolarization of L2/3Ps (*p < 0.05). Note the marked decrease of spontaneous AP rates in 5TPs (*p < 0.05).
Thus, single 5TPs underwent a twofold smaller ocular preference shift compared with 2/3Ps but consistently lost their typically high suprathreshold binocularity. It would be tempting to speculate that loss of behavioral acuity to the amblyopic eye stimulation is mostly attributable to the loss of responsiveness of 2/3Ps, whereas the loss of binocularity of 5TPs could be responsible for the depth discrimination deficits observed in amblyopic animals (Timney, 1983, 1990; Mitchell et al., 1994). Interestingly, amblyopic animals can recover visual acuity despite the persistence of depth discrimination capabilities (Timney, 1983; Mitchell et al., 1994), indicating that different neuronal dysfunctions are behind these distinct deficits. Future, cell-type-specific inactivation experiments during different kinds of visual tasks will be needed to properly address this issue.
MD effects on subthreshold and suprathreshold spontaneous activity
MD during the critical period differentially modifies the strength of excitatory (Heynen et al., 2003; Yoon et al., 2009) and inhibitory (Maffei et al., 2010) synapses in binocular V1. In addition, slice works indicate that visual deprivation differentially affects the intrinsic excitability of pyramidal neurons present in different layers in rat V1 (Maffei et al., 2006; Maffei and Turrigiano, 2008; Nataraj et al., 2010). Thus, I compared spontaneous ongoing activity at subthreshold and suprathreshold levels in the different cell types along V1 vertical circuits. Resting Vm values (measured during down states) and spontaneous AP rates varied with laminar positions of pyramidal neurons (see also Niell and Stryker, 2008; Medini, 2011). Overall, MD did not cause significant changes of these parameters. At the subthreshold level, MD caused only a slight hyperpolarization of 2/3Ps (Fig. 11, left; −73.6 ± 0.5 vs −70.1 ± 0.5 mV for normal and MD rats, respectively; t test, p < 0.05). MD did not affect spontaneous AP rates in all layers, with the noticeable exception of 5TPs. In the latter cell type, MD caused a statistically significant, twofold reduction of spontaneous AP rates (Fig. 11, middle; 0.49 ± 0.09 vs 0.22 ± 0.05 APs/100 ms bin for normal and MD rats, respectively; t test, p < 0.05). Finally, MD did not modify cell excitability as assessed by measuring the AP threshold values in the absence of visual stimulation (Fig. 11, right).
Conclusions
Overall, the data indicate that MD effects are much weaker in the two populations of pyramids of the main output lamina of cortical columns (layer 5) compared with granular and supragranular pyramids. The comparison of MD effects on limited but similarly numerous samples of 5TPs and 5NPs—and also 4Ps—indicates the existence of cell-type-specific effects within layer 5 as well. Indeed, synaptic plasticity was small but consistent on 5TPs, only when absolute deprived-eye responses were considered, whereas it was not detectable on 5NPs. Figure 12 plots the drop of median ODIs for both PSP and AP responses observed in the different cell classes during MD. In the cell populations in which MD is effective in shifting the ocular preference (2/3Ps, 4Ps, and 5TPs), it is evident that the ODI drop caused by MD is not related to a higher binocularity of origin. Indeed, the ODI shift is smaller for the cell type that is more binocular at the level of synaptic inputs (5TPs). However, within the output layer 5, MD slightly but significantly affects 5TPs, which are highly binocular, whereas 5NPs, which tend to be monocularly driven, appear refractory to MD. Together, the data indicate that the original degree of binocularity is not the sole factor that predicts the outcome of MD. Rather, cell-type-specific properties, (e.g., dendritic integration properties, intrinsic excitability, or the spike-generating mechanisms) appear to play a dominant role as determinants of the outcome of experience-dependent plasticity in vivo.
Figure 12.

Drop of the median ODIs for synaptic and spike responses in the different cell classes. Note that (1) MD effects are more pronounced for APs compared with PSPs; (2) the smaller ocular preference shift of 5TPs, compared with overlying pyramids,-despite their higher binocularity of origin; and (3) the refractoriness of 5NPs in the face of MD. ipsi, Ipsilateral eye; contra, contralateral eye.
Discussion
Origin of the different binocularity of V1 pyramidal neurons along a column
Extracellular recordings in cats showed that layer 5 neurons are highly binocular (Leventhal and Hirsch, 1978; Shatz and Stryker, 1978; Berman et al., 1982; Gordon and Stryker, 1996; Trachtenberg et al., 2000). The failure of extracellular studies to isolate a population of scarcely binocular cells in layer 5 could be attributable to the bias of extracellular recordings for highly spiking cells, such as the highly binocular 5TPs. What causes the higher input binocularity of 2/3Ps and 5TPs compared with 5NPs? The synaptic source of the high synaptic binocularity of 2/3Ps and 5TPs could be the callosum. Indeed, callosal fibers branch mostly in layers 2/3 and 5 in rodent V1 (Jacobson and Trojanowski, 1974; Mizuno et al., 2007), and their inactivation reduces binocularity in both cats (Payne et al., 1980; Blakemore et al., 1983; Diao et al., 1983; Yinon et al., 1992) and rats (Diao et al., 1983; Restani et al., 2009), mostly in layers 2/3 and 5 (Payne et al., 1984). In line with this view, 5NPs, which project to contralateral V1 (Hallman et al., 1988; Kasper et al., 1994), were almost solely driven by the contralateral eye. Thus, 5NPs can provide additional ipsilateral eye inputs to the otherwise contralaterally driven, target hemisphere. Interestingly, callosally projecting neurons preferentially contact corticotectal 5TPs in rat V1 (Brown and Hestrin, 2009). The data support the view that, although binocularity in layer 4 is determined by the relative strength of thalamic inputs driven the two eyes (Khibnik et al., 2010), callosal inputs shape binocularity in supragranular and infragranular layers.
The observations that AP responses of single 2/3Ps were dominated by one or the other eye whereas single 5TPs were all highly binocular already at the level of synaptic inputs could be related. In rat V1, 2/3Ps contact 5TPs (Thomson and Bannister, 1998), and this connection is highly convergent (Kampa et al., 2006). Thus, 5TPs could integrate inputs from different 2/3Ps with different but sharp ocular preferences (Mrsic-Flogel et al., 2007). This is reminiscent of the change of orientation selectivity, which is sharp in L2/3Ps (Ohki et al., 2005), but becomes scarce in corticotectal 5TPs (Mangini and Pearlman, 1980; Klein et al., 1986). The large dendritic arbors of 5TPs render them particularly apt to integrate synaptic inputs with different but sharp tunings into a relatively untuned AP output. In addition, the difference between resting Vm and the AP threshold is smaller in 5TPs compared with 2/3Ps (Fig. 11). This, combined with their different firing patterns (bursts and single, sparse APs for 5TPs and 2/3Ps, respectively) can account for the fact that a small difference between the PSP responses to the two eyes creates a poorly and highly binocular AP response in single 2/3Ps and 5TPs, respectively. These biophysical characteristics of 5TPs could also account for the fact that the eye that is dominant at the PSP level becomes significantly stronger at the AP level in all cell types but not in 5TPs.
Relation between MD susceptibility and binocularity of origin
Ocular dominance plasticity is thought to be the outcome of activity-dependent competition between the inputs of the eyes (Wiesel and Hubel, 1965; Gordon and Stryker, 1996). However, loss of responsiveness occurs also during complete visual deprivations (Wiesel and Hubel, 1965; Freeman et al., 1981; Kaneko et al., 2008; Faguet et al., 2009; Iurilli et al., 2011). In addition, depression of closed-eye responses and potentiation of open-eye responses are two temporally (Mioche and Singer, 1989; Frenkel and Bear, 2004) and mechanistically (Heynen et al., 2003; Kaneko et al., 2008) distinct processes that can occur independently (Yoon et al., 2009). Thus, it remains unclear up to which degree competition-independent processes drive depression of visual responsiveness, the major component of ocular dominance plasticity in rat V1. Neurons that are comparably binocular at the level of synaptic inputs, such as 2/3Ps and 5TPs, undergo profoundly different subthreshold plasticity. Conversely, within layer 5, the cell type that is more binocular in terms of synaptic inputs (5TPs), is more plastic compared with a cell type that is almost monocularly driven (5NPs). Thus, the data indicate that the outcome of ocular dominance plasticity on a given cell class is determined only in part by its binocular connectivity. Rather, cell-type-specific properties (such as intrinsic excitability and dendritic integration properties) appear to play a major role.
Extracellular recordings in animals with ocular dominance columns showed that plasticity is less pronounced in layer 4, which is poorly binocular compared with controls (Shatz and Stryker, 1978). However, the functional anatomy of V1 is different in rodents, as different as the technical approach used here. Visual cortical plasticity appears to be not layer specific in rats, based on micromanipulator readings (Caleo et al., 1999), whereas in mice layer 5/6 neurons were found to be slightly more plastic compared to remaining layers (Gordon and Stryker, 1996). These discrepancies could be explained by a differential plasticity of infragranular interneurons in rat V1 (Mainardi et al., 2009), by species-specific differences in the laminar profile of plasticity, or by uncertainties to establish the cellular and laminar identities of recorded cells in extracellular studies. Overall, the data indicate the importance of a cell-type-specific approach in studying experience-dependent plasticity.
Possible origins of the different, cell-type-specific plastic responses of layer 5 pyramids
A generalized loss of responsiveness, coupled with a slight but significant decrease of deprived-eye PSP responses, account for the nonsignificant subthreshold ocular preference shift observed in 5TPs. This, together with the observed reduction of spontaneous firing, suggests that MD produces a cell-type-specific decrease of excitability of 5TPs, a result recently confirmed in vitro (Nataraj et al., 2010). Despite the loss of synaptic strength of the deprived eye, this effect was twofold and threefold smaller (for PSPs and APs, respectively) compared with overlying pyramids. What could be the reasons for this limited experience-dependent plasticity of 5TPs? First, the higher branching of 5TPs compared with 2/3Ps and 4Ps could reduce AP backpropagation (Vetter et al., 2001; Larkum et al., 2007), which is important for dendritic plasticity (Spruston, 2008). Second, the lower expression of HCN channels in the dendrites of 2/3Ps compared with 5TPs (Magee, 1998, 1999; Williams and Stuart, 2000) could enable 2/3Ps to integrate more effectively incoming, high-frequency, synchronous inputs, because these ionic currents reduce the window for input integration (Lörincz et al., 2002; Larkum et al., 2007). Third, the various layers differentially express the molecular changes required for depression of glutamatergic sensory inputs in both somatosensory (Wright et al., 2008) and visual (Liu et al., 2008; Yoon et al., 2009) cortices. Fourth, the higher inhibition in 2/3Ps compared with layer 5 (Adesnik and Scanziani, 2010) could render 2/3Ps better coincidence detectors compared with 5TPs (Pouille and Scanziani, 2001), allowing 2/3Ps to better discriminate the differences in synchronicity of incoming APs caused by MD (Linden et al., 2009). Future experiments will dissect the relative importance of these factors.
In the case of 5NPs, the lack of detectable plasticity could be related to their poor input binocularity. 5NPs did not increase responsiveness to the closed eye, as 2/3Ps do in monocular V1 (Mrsic-Flogel et al., 2007). Finally, the limited capability of 5NPs to sustain AP backpropagation (Grewe et al., 2010) could also contribute to their scarce sensitivity to MD.
Can L5 be driven by L2/3 (after MD)?
PSP responses of 5TPs to stimulation of the deprived eye were only slightly depressed, whereas AP responses of 2/3Ps were dramatically reduced. This raises the question of up to which degree 5TPs are driven by 2/3Ps, in particular after MD. 2/3Ps selectively target 5TPs in both rat and cat V1, avoiding 5NPs (Thomson and Bannister, 1998). This connection is functional in vivo because inactivation of 2/3Ps selectively affect responsiveness of a subgroup of layer 5 cells (Schwark et al., 1986). However, there are evidences showing that the major sources of activation of layer 5 pyramids are not 2/3Ps in vivo. In both V1 (Schwark et al., 1986) and somatosensory cortex (Huang et al., 1998), AP responses of the majority of layer 5 neurons are preserved during selective layer 2/3 inactivation. Also, sensory-driven subthreshold activation occurs quasi-simultaneously in supragranular and infragranular layers of barrel cortex (Wilent and Contreras, 2004). Importantly, experience-dependent plasticity in S1 is poorly affected in layer 5 after removal of supragranular layers (Huang et al., 1998). These data, together with the observation of the discrepancy of MD-driven ocular preference shift between AP responses of 2/3Ps and PSP responses of 5TPs, should prompt future studies to study whether 5TPs receive in vivo prominent visual inputs from thalamus (Ferster and Lindström, 1983; Martin and Whitteridge, 1984; Weyand et al., 1986; see also Meyer et al., 2010) in S1. One could speculate that these synapses could be relatively refractory to undergo experience-dependent depression.
Also, the fact that PSP responses of 5NPs remain strongly contralaterally driven during MD suggests that their main sources of synaptic connection in vivo are not 2/3Ps. In line with this, slice work indicates that 5NPs are only rarely contacted by 2/3Ps (Thomson and Bannister, 1998). Moreover, their latency of subthreshold activation is shorter compared with 2/3Ps (my unpublished data); finally, in S1, they receive monosynaptic excitation inputs from layer 4 spiny neurons (Feldmeyer et al., 2005).
Footnotes
I thank Prof. Bert Sakmann for support, Drs. Matteo Caleo and Tommaso Fellin for critically reading this manuscript, Rolf Roedel, Karl Schmidt, Carlo Orsini, Marlies Kaiser, and Ellen Stier for excellent technical assistance, Steffen Brinkmann and Thomas Maedler for help in programming, and Sebastian Endres, Ludmilla Wagner, and Michael Beez for help in neuronal reconstructions.
The author declares no competing financial interests.
References
- Adesnik H, Scanziani M. Lateral competition for cortical space by layer-specific horizontal circuits. Nature. 2010;464:1155–1160. doi: 10.1038/nature08935. [DOI] [PMC free article] [PubMed] [Google Scholar]
- Berman N, Payne BR, Labar DR, Murphy EH. Functional organization of neurons in cat striate cortex: variations in ocular dominance and receptive-field type with cortical laminae and location in visual field. J Neurophysiol. 1982;48:1362–1377. doi: 10.1152/jn.1982.48.6.1362. [DOI] [PubMed] [Google Scholar]
- Blakemore C, Diao YC, Pu ML, Wang YK, Xiao YM. Possible functions of the interhemispheric connexions between visual cortical areas in the cat. J Physiol. 1983;337:331–349. doi: 10.1113/jphysiol.1983.sp014627. [DOI] [PMC free article] [PubMed] [Google Scholar]
- Brecht M, Sakmann B. Dynamic representation of whisker deflection by synaptic potentials in spiny stellate and pyramidal cells in the barrels and septa of layer 4 rat somatosensory cortex. J Physiol. 2002;543:49–70. doi: 10.1113/jphysiol.2002.018465. [DOI] [PMC free article] [PubMed] [Google Scholar]
- Brecht M, Roth A, Sakmann B. Dynamic receptive fields of reconstructed pyramidal cells in layers 3 and 2 of rat somatosensory barrel cortex. J Physiol. 2003;553:243–265. doi: 10.1113/jphysiol.2003.044222. [DOI] [PMC free article] [PubMed] [Google Scholar]
- Briggs F. Organizing principles of cortical layer 6. Front Neural Circuits. 2010;4:3. doi: 10.3389/neuro.04.003.2010. [DOI] [PMC free article] [PubMed] [Google Scholar]
- Brown SP, Hestrin S. Intracortical circuits of pyramidal neurons reflect their long-range axonal targets. Nature. 2009;457:1133–1136. doi: 10.1038/nature07658. [DOI] [PMC free article] [PubMed] [Google Scholar]
- Burkhalter A. Intrinsic connections of rat primary visual cortex: laminar organization of axonal projections. J Comp Neurol. 1989;279:171–186. doi: 10.1002/cne.902790202. [DOI] [PubMed] [Google Scholar]
- Caleo M, Lodovichi C, Pizzorusso T, Maffei L. Expression of the transcription factor Zif268 in the visual cortex of monocularly deprived rats: effects of nerve growth factor. Neuroscience. 1999;91:1017–1026. doi: 10.1016/s0306-4522(98)00682-4. [DOI] [PubMed] [Google Scholar]
- Christophe E, Doerflinger N, Lavery DJ, Molnár Z, Charpak S, Audinat E. Two populations of layer v pyramidal cells of the mouse neocortex: development and sensitivity to anesthetics. J Neurophysiol. 2005;94:3357–3367. doi: 10.1152/jn.00076.2005. [DOI] [PubMed] [Google Scholar]
- Coleman JE, Nahmani M, Gavornik JP, Haslinger R, Heynen AJ, Erisir A, Bear MF. Rapid structural remodeling of thalamocortical synapses parallels experience-dependent functional plasticity in mouse primary visual cortex. J Neurosci. 2010;30:9670–9682. doi: 10.1523/JNEUROSCI.1248-10.2010. [DOI] [PMC free article] [PubMed] [Google Scholar]
- Daw NW, Fox K, Sato H, Czepita D. Critical period for monocular deprivation in the cat visual cortex. J Neurophysiol. 1992;67:197–202. doi: 10.1152/jn.1992.67.1.197. [DOI] [PubMed] [Google Scholar]
- Diao YC, Wang YK, Pu ML. Binocular responses of cortical cells and the callosal projection in the albino rat. Exp Brain Res. 1983;49:410–418. doi: 10.1007/BF00238782. [DOI] [PubMed] [Google Scholar]
- El-Shamayleh Y, Kiorpes L, Kohn A, Movshon JA. Visual motion processing by neurons in area MT of macaque monkeys with experimental amblyopia. J Neurosci. 2010;30:12198–12209. doi: 10.1523/JNEUROSCI.3055-10.2010. [DOI] [PMC free article] [PubMed] [Google Scholar]
- Fagiolini M, Pizzorusso T, Berardi N, Domenici L, Maffei L. Functional postnatal development of the rat primary visual cortex and the role of visual experience: dark rearing and monocular deprivation. Vision Res. 1994;34:709–720. doi: 10.1016/0042-6989(94)90210-0. [DOI] [PubMed] [Google Scholar]
- Faguet J, Maranhao B, Smith SL, Trachtenberg JT. Ipsilateral eye cortical maps are uniquely sensitive to binocular plasticity. J Neurophysiol. 2009;101:855–861. doi: 10.1152/jn.90893.2008. [DOI] [PMC free article] [PubMed] [Google Scholar]
- Feldmeyer D, Roth A, Sakmann B. Monosynaptic connections between pairs of spiny stellate cells in layer 4 and pyramidal cells in layer 5A indicate that lemniscal and paralemniscal afferent pathways converge in the infragranular somatosensory cortex. J Neurosci. 2005;25:3423–3431. doi: 10.1523/JNEUROSCI.5227-04.2005. [DOI] [PMC free article] [PubMed] [Google Scholar]
- Ferster D, Lindström S. An intracellular analysis of geniculo-cortical connectivity in area 17 of the cat. J Physiol. 1983;342:181–215. doi: 10.1113/jphysiol.1983.sp014846. [DOI] [PMC free article] [PubMed] [Google Scholar]
- Freeman RD, Mallach R, Hartley S. Responsivity of normal kitten striate cortex deteriorates after brief binocular deprivation. J Neurophysiol. 1981;45:1074–1084. doi: 10.1152/jn.1981.45.6.1074. [DOI] [PubMed] [Google Scholar]
- Frenkel MY, Bear MF. How monocular deprivation shifts ocular dominance in visual cortex of young mice. Neuron. 2004;44:917–923. doi: 10.1016/j.neuron.2004.12.003. [DOI] [PubMed] [Google Scholar]
- Gandhi SP, Yanagawa Y, Stryker MP. Delayed plasticity of inhibitory neurons in developing visual cortex. Proc Natl Acad Sci U S A. 2008;105:16797–16802. doi: 10.1073/pnas.0806159105. [DOI] [PMC free article] [PubMed] [Google Scholar]
- Gordon JA, Stryker MP. Experience-dependent plasticity of binocular responses in the primary visual cortex of the mouse. J Neurosci. 1996;16:3274–3286. doi: 10.1523/JNEUROSCI.16-10-03274.1996. [DOI] [PMC free article] [PubMed] [Google Scholar]
- Grewe BF, Bonnan A, Frick A. Back-propagation of physiological action potential output in dendrites of slender-tufted L5A pyramidal neurons. Front Cell Neurosci. 2010;4:13. doi: 10.3389/fncel.2010.00013. [DOI] [PMC free article] [PubMed] [Google Scholar]
- Groh A, Meyer HS, Schmidt EF, Heintz N, Sakmann B, Krieger P. Cell-type specific properties of pyramidal neurons in neocortex underlying a layout that is modifiable depending on the cortical area. Cereb Cortex. 2010;20:826–836. doi: 10.1093/cercor/bhp152. [DOI] [PubMed] [Google Scholar]
- Hallman LE, Schofield BR, Lin CS. Dendritic morphology and axon collaterals of corticotectal, corticopontine, and callosal neurons in layer V of primary visual cortex of the hooded rat. J Comp Neurol. 1988;272:149–160. doi: 10.1002/cne.902720111. [DOI] [PubMed] [Google Scholar]
- Heynen AJ, Yoon BJ, Liu CH, Chung HJ, Huganir RL, Bear MF. Molecular mechanism for loss of visual cortical responsiveness following brief monocular deprivation. Nat Neurosci. 2003;6:854–862. doi: 10.1038/nn1100. [DOI] [PubMed] [Google Scholar]
- Hofer SB, Mrsic-Flogel TD, Bonhoeffer T, Hübener M. Experience leaves a lasting structural trace in cortical circuits. Nature. 2009;457:313–317. doi: 10.1038/nature07487. [DOI] [PMC free article] [PubMed] [Google Scholar]
- Huang W, Armstrong-James M, Rema V, Diamond ME, Ebner FF. Contribution of supragranular layers to sensory processing and plasticity in adult rat barrel cortex. J Neurophysiol. 1998;80:3261–3271. doi: 10.1152/jn.1998.80.6.3261. [DOI] [PubMed] [Google Scholar]
- Hubel DH, Wiesel TN, LeVay S. Plasticity of ocular dominance columns in monkey striate cortex. Philos Trans R Soc Lond B Biol Sci. 1977;278:377–409. doi: 10.1098/rstb.1977.0050. [DOI] [PubMed] [Google Scholar]
- Hübener M, Schwarz C, Bolz J. Morphological types of projection neurons in layer 5 of cat visual cortex. J Comp Neurol. 1990;301:655–674. doi: 10.1002/cne.903010412. [DOI] [PubMed] [Google Scholar]
- Hughes A. The refractive state of the rat eye. Vision Res. 1977;17:927–939. doi: 10.1016/0042-6989(77)90068-2. [DOI] [PubMed] [Google Scholar]
- Issa NP, Trachtenberg JT, Chapman B, Zahs KR, Stryker MP. The critical period for ocular dominance plasticity in the ferret's visual cortex. J Neurosci. 1999;19:6965–6978. doi: 10.1523/JNEUROSCI.19-16-06965.1999. [DOI] [PMC free article] [PubMed] [Google Scholar]
- Iurilli G, Benfenati F, Medini P. Loss of visually driven synaptic responses in layer 4 regular-spiking neurons of rat visual cortex in absence of competing inputs. Cerebral Cortex. 2011 doi: 10.1093/cercor/bhr304. [DOI] [PubMed] [Google Scholar]
- Jacobson S, Trojanowski JQ. The cells of origin of the corpus callosum in rat, cat and rhesus monkey. Brain Res. 1974;74:149–155. doi: 10.1016/0006-8993(74)90118-8. [DOI] [PubMed] [Google Scholar]
- Kampa BM, Letzkus JJ, Stuart GJ. Cortical feed-forward networks for binding different streams of sensory information. Nat Neurosci. 2006;9:1472–1473. doi: 10.1038/nn1798. [DOI] [PubMed] [Google Scholar]
- Kaneko M, Stellwagen D, Malenka RC, Stryker MP. Tumor necrosis factor-alpha mediates one component of competitive, experience-dependent plasticity in developing visual cortex. Neuron. 2008;58:673–680. doi: 10.1016/j.neuron.2008.04.023. [DOI] [PMC free article] [PubMed] [Google Scholar]
- Kasper EM, Larkman AU, Lübke J, Blakemore C. Pyramidal neurons in layer 5 of the rat visual cortex. I. Correlation among cell morphology, intrinsic electrophysiological properties, and axon targets. J Comp Neurol. 1994;339:459–474. doi: 10.1002/cne.903390402. [DOI] [PubMed] [Google Scholar]
- Khibnik LA, Cho KK, Bear MF. Relative contribution of feedforward excitatory connections to expression of ocular dominance plasticity in layer 4 of visual cortex. Neuron. 2010;66:493–500. doi: 10.1016/j.neuron.2010.04.012. [DOI] [PMC free article] [PubMed] [Google Scholar]
- Kiorpes L. Visual processing in amblyopia: animal studies. Strabismus. 2006;14:3–10. doi: 10.1080/09273970500536193. [DOI] [PubMed] [Google Scholar]
- Kiorpes L, Kiper DC, O'Keefe LP, Cavanaugh JR, Movshon JA. Neuronal correlates of amblyopia in the visual cortex of macaque monkeys with experimental strabismus and anisometropia. J Neurosci. 1998;18:6411–6424. doi: 10.1523/JNEUROSCI.18-16-06411.1998. [DOI] [PMC free article] [PubMed] [Google Scholar]
- Klein BG, Mooney RD, Fish SE, Rhoades RW. The structural and functional characteristics of striate cortical neurons that innervate the superior colliculus and lateral posterior nucleus in hamster. Neuroscience. 1986;17:57–78. doi: 10.1016/0306-4522(86)90225-3. [DOI] [PubMed] [Google Scholar]
- Larkum ME, Waters J, Sakmann B, Helmchen F. Dendritic spikes in apical dendrites of neocortical layer 2/3 pyramidal neurons. J Neurosci. 2007;27:8999–9008. doi: 10.1523/JNEUROSCI.1717-07.2007. [DOI] [PMC free article] [PubMed] [Google Scholar]
- Leventhal AG, Hirsch HV. Receptive-field properties of neurons in different laminae of visual cortex of the cat. J Neurophysiol. 1978;41:948–962. doi: 10.1152/jn.1978.41.4.948. [DOI] [PubMed] [Google Scholar]
- Linden ML, Heynen AJ, Haslinger RH, Bear MF. Thalamic activity that drives visual cortical plasticity. Nat Neurosci. 2009;12:390–392. doi: 10.1038/nn.2284. [DOI] [PMC free article] [PubMed] [Google Scholar]
- Liu CH, Heynen AJ, Shuler MG, Bear MF. Cannabinoid receptor blockade reveals parallel plasticity mechanisms in different layers of mouse visual cortex. Neuron. 2008;58:340–345. doi: 10.1016/j.neuron.2008.02.020. [DOI] [PubMed] [Google Scholar]
- Lörincz A, Notomi T, Tamás G, Shigemoto R, Nusser Z. Polarized and compartment-dependent distribution of HCN1 in pyramidal cell dendrites. Nat Neurosci. 2002;5:1185–1193. doi: 10.1038/nn962. [DOI] [PubMed] [Google Scholar]
- Maffei A, Turrigiano GG. Multiple modes of network homeostasis in visual cortical layer 2/3. J Neurosci. 2008;28:4377–4384. doi: 10.1523/JNEUROSCI.5298-07.2008. [DOI] [PMC free article] [PubMed] [Google Scholar]
- Maffei A, Nataraj K, Nelson SB, Turrigiano GG. Potentiation of cortical inhibition by visual deprivation. Nature. 2006;443:81–84. doi: 10.1038/nature05079. [DOI] [PubMed] [Google Scholar]
- Maffei A, Lambo ME, Turrigiano GG. Critical period for inhibitory plasticity in rodent binocular V1. J Neurosci. 2010;30:3304–3309. doi: 10.1523/JNEUROSCI.5340-09.2010. [DOI] [PMC free article] [PubMed] [Google Scholar]
- Magee JC. Dendritic hyperpolarization-activated currents modify the integrative properties of hippocampal CA1 pyramidal neurons. J Neurosci. 1998;18:7613–7624. doi: 10.1523/JNEUROSCI.18-19-07613.1998. [DOI] [PMC free article] [PubMed] [Google Scholar]
- Magee JC. Dendritic Ih normalizes temporal summation in hippocampal CA1 neurons. Nat Neurosci. 1999;2:848. doi: 10.1038/12229. [DOI] [PubMed] [Google Scholar]
- Mainardi M, Landi S, Berardi N, Maffei L, Pizzorusso T. Reduced responsiveness to long-term monocular deprivation of parvalbumin neurons assessed by c-Fos staining in rat visual cortex. PLoS One. 2009;4:e4342. doi: 10.1371/journal.pone.0004342. [DOI] [PMC free article] [PubMed] [Google Scholar]
- Mangini NJ, Pearlman AL. Laminar distribution of receptive field properties in the primary visual cortex of the mouse. J Comp Neurol. 1980;193:203–222. doi: 10.1002/cne.901930114. [DOI] [PubMed] [Google Scholar]
- Margrie TW, Brecht M, Sakmann B. In vivo, low-resistance, whole-cell recordings from neurons in the anaesthetized and awake mammalian brain. Pflugers Arch. 2002;444:491–498. doi: 10.1007/s00424-002-0831-z. [DOI] [PubMed] [Google Scholar]
- Martin KA, Whitteridge D. Form, function and intracortical projections of spiny neurones in the striate visual cortex of the cat. J Physiol. 1984;353:463–504. doi: 10.1113/jphysiol.1984.sp015347. [DOI] [PMC free article] [PubMed] [Google Scholar]
- Martinez LM, Wang Q, Reid RC, Pillai C, Alonso JM, Sommer FT, Hirsch JA. Receptive field structure varies with layer in the primary visual cortex. Nat Neurosci. 2005;8:372–379. doi: 10.1038/nn1404. [DOI] [PMC free article] [PubMed] [Google Scholar]
- Mataga N, Mizuguchi Y, Hensch TK. Experience-dependent pruning of dendritic spines in visual cortex by tissue plasminogen activator. Neuron. 2004;44:1031–1041. doi: 10.1016/j.neuron.2004.11.028. [DOI] [PubMed] [Google Scholar]
- Medini P. Cell-type-specific sub- and suprathreshold receptive fields of layer 4 and layer 2/3 pyramids in rat primary visual cortex. Neuroscience. 2011;190:112–126. doi: 10.1016/j.neuroscience.2011.05.026. [DOI] [PubMed] [Google Scholar]
- Meyer HS, Wimmer VC, Hemberger M, Bruno RM, de Kock CP, Frick A, Sakmann B, Helmstaedter M. Cell type-specific thalamic innervation in a column of rat vibrissal cortex. Cereb Cortex. 2010;20:2287–2303. doi: 10.1093/cercor/bhq069. [DOI] [PMC free article] [PubMed] [Google Scholar]
- Mioche L, Singer W. Chronic recordings from single sites of kitten striate cortex during experience-dependent modifications of receptive-field properties. J Neurophysiol. 1989;62:185–197. doi: 10.1152/jn.1989.62.1.185. [DOI] [PubMed] [Google Scholar]
- Mitchell DE, Ptito M, Lepore F. Depth perception in monocularly deprived cats following part-time reverse occlusion. Eur J Neurosci. 1994;6:967–972. doi: 10.1111/j.1460-9568.1994.tb00591.x. [DOI] [PubMed] [Google Scholar]
- Mizuno H, Hirano T, Tagawa Y. Evidence for activity-dependent cortical wiring: formation of interhemispheric connections in neonatal mouse visual cortex requires projection neuron activity. J Neurosci. 2007;27:6760–6770. doi: 10.1523/JNEUROSCI.1215-07.2007. [DOI] [PMC free article] [PubMed] [Google Scholar]
- Mrsic-Flogel TD, Hofer SB, Ohki K, Reid RC, Bonhoeffer T, Hübener M. Homeostatic regulation of eye-specific responses in visual cortex during ocular dominance plasticity. Neuron. 2007;54:961–972. doi: 10.1016/j.neuron.2007.05.028. [DOI] [PubMed] [Google Scholar]
- Nataraj K, Le Roux N, Nahmani M, Lefort S, Turrigiano G. Visual deprivation suppresses L5 pyramidal neuron excitability by preventing the induction of intrinsic plasticity. Neuron. 2010;68:750–762. doi: 10.1016/j.neuron.2010.09.033. [DOI] [PMC free article] [PubMed] [Google Scholar]
- Niell CM, Stryker MP. Highly selective receptive fields in mouse visual cortex. J Neurosci. 2008;28:7520–7536. doi: 10.1523/JNEUROSCI.0623-08.2008. [DOI] [PMC free article] [PubMed] [Google Scholar]
- Ohki K, Chung S, Ch'ng YH, Kara P, Reid RC. Functional imaging with cellular resolution reveals precise micro-architecture in visual cortex. Nature. 2005;433:597–603. doi: 10.1038/nature03274. [DOI] [PubMed] [Google Scholar]
- Payne BR, Elberger AJ, Berman N, Murphy EH. Binocularity in the cat visual cortex is reduced by sectioning the corpus callosum. Science. 1980;207:1097–1099. doi: 10.1126/science.7355278. [DOI] [PubMed] [Google Scholar]
- Payne BR, Pearson HE, Berman N. Role of corpus callosum in functional organization of cat striate cortex. J Neurophysiol. 1984;52:570–594. doi: 10.1152/jn.1984.52.3.570. [DOI] [PubMed] [Google Scholar]
- Pizzorusso T, Medini P, Berardi N, Chierzi S, Fawcett JW, Maffei L. Reactivation of ocular dominance plasticity in the adult visual cortex. Science. 2002;298:1248–1251. doi: 10.1126/science.1072699. [DOI] [PubMed] [Google Scholar]
- Pizzorusso T, Medini P, Landi S, Baldini S, Berardi N, Maffei L. Structural and functional recovery from early monocular deprivation in adult rats. Proc Natl Acad Sci U S A. 2006;103:8517–8522. doi: 10.1073/pnas.0602657103. [DOI] [PMC free article] [PubMed] [Google Scholar]
- Pouille F, Scanziani M. Enforcement of temporal fidelity in pyramidal cells by somatic feed-forward inhibition. Science. 2001;293:1159–1163. doi: 10.1126/science.1060342. [DOI] [PubMed] [Google Scholar]
- Priebe NJ. The relationship between subthreshold and suprathreshold ocular dominance in cat primary visual cortex. J Neurosci. 2008;28:8553–8559. doi: 10.1523/JNEUROSCI.2182-08.2008. [DOI] [PMC free article] [PubMed] [Google Scholar]
- Prusky GT, Douglas RM. Developmental plasticity of mouse visual acuity. Eur J Neurosci. 2003;17:167–173. doi: 10.1046/j.1460-9568.2003.02420.x. [DOI] [PubMed] [Google Scholar]
- Prusky GT, West PW, Douglas RM. Experience-dependent plasticity of visual acuity in rats. Eur J Neurosci. 2000;12:3781–3786. doi: 10.1046/j.1460-9568.2000.00236.x. [DOI] [PubMed] [Google Scholar]
- Restani L, Cerri C, Pietrasanta M, Gianfranceschi L, Maffei L, Caleo M. Functional masking of deprived eye responses by callosal input during ocular dominance plasticity. Neuron. 2009;64:707–718. doi: 10.1016/j.neuron.2009.10.019. [DOI] [PubMed] [Google Scholar]
- Rittenhouse CD, Shouval HZ, Paradiso MA, Bear MF. Monocular deprivation induces homosynaptic long-term depression in visual cortex. Nature. 1999;397:347–350. doi: 10.1038/16922. [DOI] [PubMed] [Google Scholar]
- Rossi FM, Pizzorusso T, Porciatti V, Marubio LM, Maffei L, Changeux JP. Requirement of the nicotinic acetylcholine receptor beta 2 subunit for the anatomical and functional development of the visual system. Proc Natl Acad Sci U S A. 2001;98:6453–6458. doi: 10.1073/pnas.101120998. [DOI] [PMC free article] [PubMed] [Google Scholar]
- Schuett S, Bonhoeffer T, Hübener M. Mapping retinotopic structure in mouse visual cortex with optical imaging. J Neurosci. 2002;22:6549–6559. doi: 10.1523/JNEUROSCI.22-15-06549.2002. [DOI] [PMC free article] [PubMed] [Google Scholar]
- Schwark HD, Malpeli JG, Weyand TG, Lee C. Cat area 17. II. Response properties of infragranular layer neurons in the absence of supragranular layer activity. J Neurophysiol. 1986;56:1074–1087. doi: 10.1152/jn.1986.56.4.1074. [DOI] [PubMed] [Google Scholar]
- Shatz CJ, Stryker MP. Ocular dominance in layer IV of the cat's visual cortex and the effects of monocular deprivation. J Physiol. 1978;281:267–283. doi: 10.1113/jphysiol.1978.sp012421. [DOI] [PMC free article] [PubMed] [Google Scholar]
- Spruston N. Pyramidal neurons: dendritic structure and synaptic integration. Nat Rev Neurosci. 2008;9:206–221. doi: 10.1038/nrn2286. [DOI] [PubMed] [Google Scholar]
- Thomson AM, Bannister AP. Postsynaptic pyramidal target selection by descending layer III pyramidal axons: dual intracellular recordings and biocytin filling in slices of rat neocortex. Neuroscience. 1998;84:669–683. doi: 10.1016/s0306-4522(97)00557-5. [DOI] [PubMed] [Google Scholar]
- Thomson AM, Bannister AP. Interlaminar connections in the neocortex. Cereb Cortex. 2003;13:5–14. doi: 10.1093/cercor/13.1.5. [DOI] [PubMed] [Google Scholar]
- Timney B. The effects of early and late monocular deprivation on binocular depth perception in cats. Brain Res. 1983;283:235–243. doi: 10.1016/0165-3806(83)90180-3. [DOI] [PubMed] [Google Scholar]
- Timney B. Effects of brief monocular deprivation on binocular depth perception in the cat: a sensitive period for the loss of stereocular preference shiftis. Vis Neurosci. 1990;5:273–280. doi: 10.1017/s0952523800000341. [DOI] [PubMed] [Google Scholar]
- Trachtenberg JT, Trepel C, Stryker MP. Rapid extragranular plasticity in the absence of thalamocortical plasticity in the developing primary visual cortex. Science. 2000;287:2029–2032. doi: 10.1126/science.287.5460.2029. [DOI] [PMC free article] [PubMed] [Google Scholar]
- Tsiola A, Hamzei-Sichani F, Peterlin Z, Yuste R. Quantitative morphologic classification of layer 5 neurons from mouse primary visual cortex. J Comp Neurol. 2003;461:415–428. doi: 10.1002/cne.10628. [DOI] [PubMed] [Google Scholar]
- Vetter P, Roth A, Häusser M. Propagation of action potentials in dendrites depends on dendritic morphology. J Neurophysiol. 2001;85:926–937. doi: 10.1152/jn.2001.85.2.926. [DOI] [PubMed] [Google Scholar]
- Weyand TG, Malpeli JG, Lee C, Schwark HD. Cat area 17. IV. Two types of corticotectal cells defined by controlling geniculate inputs. J Neurophysiol. 1986;56:1102–1108. doi: 10.1152/jn.1986.56.4.1102. [DOI] [PubMed] [Google Scholar]
- Wiesel TN, Hubel DH. Comparison of the effects of unilateral and bilateral eye closure on cortical unit responses in kittens. J Neurophysiol. 1965;28:1029–1040. doi: 10.1152/jn.1965.28.6.1029. [DOI] [PubMed] [Google Scholar]
- Wilent WB, Contreras D. Synaptic responses to whisker deflections in rat barrel cortex as a function of cortical layer and stimulus intensity. J Neurosci. 2004;24:3985–3998. doi: 10.1523/JNEUROSCI.5782-03.2004. [DOI] [PMC free article] [PubMed] [Google Scholar]
- Wilent WB, Contreras D. Stimulus-dependent changes in spike threshold enhance feature selectivity in rat barrel cortex neurons. J Neurosci. 2005;25:2983–2991. doi: 10.1523/JNEUROSCI.4906-04.2005. [DOI] [PMC free article] [PubMed] [Google Scholar]
- Williams SR, Stuart GJ. Site independence of EPSP time course is mediated by dendritic I(h) in neocortical pyramidal neurons. J Neurophysiol. 2000;83:3177–3182. doi: 10.1152/jn.2000.83.5.3177. [DOI] [PubMed] [Google Scholar]
- Wright N, Glazewski S, Hardingham N, Phillips K, Pervolaraki E, Fox K. Laminar analysis of the role of GluR1 in experience-dependent and synaptic depression in barrel cortex. Nat Neurosci. 2008;11:1140–1142. doi: 10.1038/nn.2188. [DOI] [PMC free article] [PubMed] [Google Scholar]
- Yazaki-Sugiyama Y, Kang S, Câteau H, Fukai T, Hensch TK. Bidirectional plasticity in fast-spiking GABA circuits by visual experience. Nature. 2009;462:218–221. doi: 10.1038/nature08485. [DOI] [PubMed] [Google Scholar]
- Yinon U, Chen M, Gelerstein S. Binocularity and excitability loss in visual cortex cells of corpus callosum transected kittens and cats. Brain Res Bull. 1992;29:541–552. doi: 10.1016/0361-9230(92)90121-d. [DOI] [PubMed] [Google Scholar]
- Yoon BJ, Smith GB, Heynen AJ, Neve RL, Bear MF. Essential role for a long-term depression mechanism in ocular dominance plasticity. Proc Natl Acad Sci U S A. 2009;106:9860–9865. doi: 10.1073/pnas.0901305106. [DOI] [PMC free article] [PubMed] [Google Scholar]