

Abstract
Corticothalamic projection neurons in the cerebral cortex constitute an important component of the thalamocortical reciprocal circuit, an essential input/output organization for cortical information processing. However, the spatial organization of local excitatory connections to corticothalamic neurons is only partially understood. In the present study, we first developed an adenovirus vector expressing somatodendritic membrane-targeted green fluorescent protein. After injection of the adenovirus vector into the ventrobasal thalamic complex, a band of layer (L) 6 corticothalamic neurons in the rat barrel cortex were retrogradely labeled. In addition to their cell bodies, fine dendritic spines of corticothalamic neurons were well visualized without the labeling of their axon collaterals or thalamocortical axons. In cortical slices containing retrogradely labeled L6 corticothalamic neurons, we intracellularly stained single pyramidal/spiny neurons of L2–6. We examined the spatial distribution of contact sites between the local axon collaterals of each pyramidal neuron and the dendrites of corticothalamic neurons. We found that corticothalamic neurons received strong and focused connections from L4 neurons just above them, and that the most numerous nearby and distant sources of local excitatory connections to corticothalamic neurons were corticothalamic neurons themselves and L6 putative corticocortical neurons, respectively. These results suggest that L4 neurons may serve as an important source of local excitatory inputs in shaping the cortical modulation of thalamic activity.
Introduction
The primary sensory cortex, consisting of six layers, receives thalamocortical projections principally in layer (L) 4 and sends corticothalamic projections mainly from L6, constituting the thalamocortical reciprocal circuit with the corresponding thalamic nucleus (Jones, 1984; Deschênes et al., 1998; Douglas et al., 2004; Sherman and Guillery, 2006; Shipp, 2007; Fox, 2008; Thomson, 2010). In this reciprocal circuit, L6 corticothalamic projection neurons (CTNs) are considered to enhance and tune thalamic responses to peripheral stimuli (Yuan et al., 1986; Yan and Suga, 1996; Przybyszewski et al., 2000; Alitto and Usrey, 2003; Temereanca and Simons, 2004; Thomson, 2010). Local connections between cortical layers are well developed (Briggs and Callaway, 2001; Mercer et al., 2005; Zarrinpar and Callaway, 2006; West et al., 2006; Lefort et al., 2009; Llano and Sherman, 2009; Lam and Sherman, 2010; Hooks et al., 2011), and in addition to external inputs, local translaminar inputs are involved in shaping CTN activity. Therefore, the laminar organization of local excitatory inputs to CTNs may be important for cortical modulation of thalamic activity.
It is widely accepted that columnar modules serve as elementary units of information processing in the cerebral cortex, especially in the primary sensory cortices (Mountcastle, 1997). The rodent primary somatosensory (S1) barrel cortex, where L4 neurons assemble barrel-like structures, processes sensory information from facial whiskers (Fox, 2008). Neurons in the L4 barrel (300–400 μm in diameter) and those in the other layers respond primarily to a single whisker, thus congregating in a vertical column extending across the cortical layers. Furthermore, recent studies have revealed that a single barrel includes several neuronal clusters (∼100 μm in diameter) that contain neurons showing similar preferences for the direction of whisker deflection, suggesting that a barrel column is further divided into functional substructures (Bruno et al., 2003; Andermann and Moore, 2006). Because cortical local connections often spread tangentially or horizontally beyond these structures, it is important to examine the horizontal organization of local excitatory inputs to CTNs, in addition to laminar organization.
Here, we retrogradely labeled CTNs with a newly developed adenoviral vector expressing a somatodendritic membrane-targeted green fluorescent protein (GFP), which was useful in visualizing CTNs from their cell bodies to fine dendritic spines. Combining the retrograde labeling method with an intracellular recording/staining technique in brain slices, we examined the distribution of contact sites between the axons of single pyramidal/spiny neurons and the dendrites of a multitude of CTNs in the rat barrel cortex. Finally, we made a morphological estimation of the interlaminar and horizontal organization of local excitatory connections to CTNs.
Materials and Methods
All procedures in the experiments were conducted in accordance with the Committee for Animal Care and Use and that for Recombinant DNA Study in Kyoto University. One hundred and two male Wister rats (weight, 250–350 g; age, 8–12 postnatal weeks; Japan SLC) were used in the present study. All efforts were made to minimize the number of animals used and their suffering.
Adenoviral vector
The adenoviral vector plasmid (Fig. 1A) was constructed and produced according to Virapower adenoviral promoterless gateway expression kit (Invitrogen). Enhanced human synapsin I promoter (E/SYN) (Hioki et al., 2007), GFP with an N-terminal myristoylation site of Fyn protein and with a C-terminal portion of low-density lipoprotein receptor (myrGFP-LDLRct) (Kameda et al., 2008), woodchuck hepatitis virus posttranscriptional regulatory element (WPRE; nucleotides 1093–1684 of gb: U57609; a gift from Dr. Hope, Department of Cell and Molecular Biology, Northwestern University Medical School, Chicago, IL) (Zufferey et al., 1999), and polyadenylation signal from bovine growth hormone (BGHpA) were subcloned into pENTR1 vector (Invitrogen). The insert (E/SYN-myrGFP-LDLRct-WPRE-BGHpA) was transferred to the adenoviral backbone (pAd/PL-DEST) by homologous recombination by LR clonase (Invitrogen), resulting pAd-E/SYN-myrGFP-LDLRct-BGHpA. Adenoviral vector was produced according to the manufacture's protocol and purified as described previously (Tomioka and Rockland, 2006). Obtained viral stocks in 0.6 m NaCl were stored in −80°C until use. The final viral stocks typically have the titer of 1010–1011 gene transfer unit (GTU)/ml. For titration of the viral stocks, we disseminated serially diluted viral solutions to 90% confluent HEK cells in 6 well plates. Two days after dissemination, cells were fixed and immunostained with anti-GFP antibody. The titer was determined by counting GFP-immunopositive cells.
Figure 1.
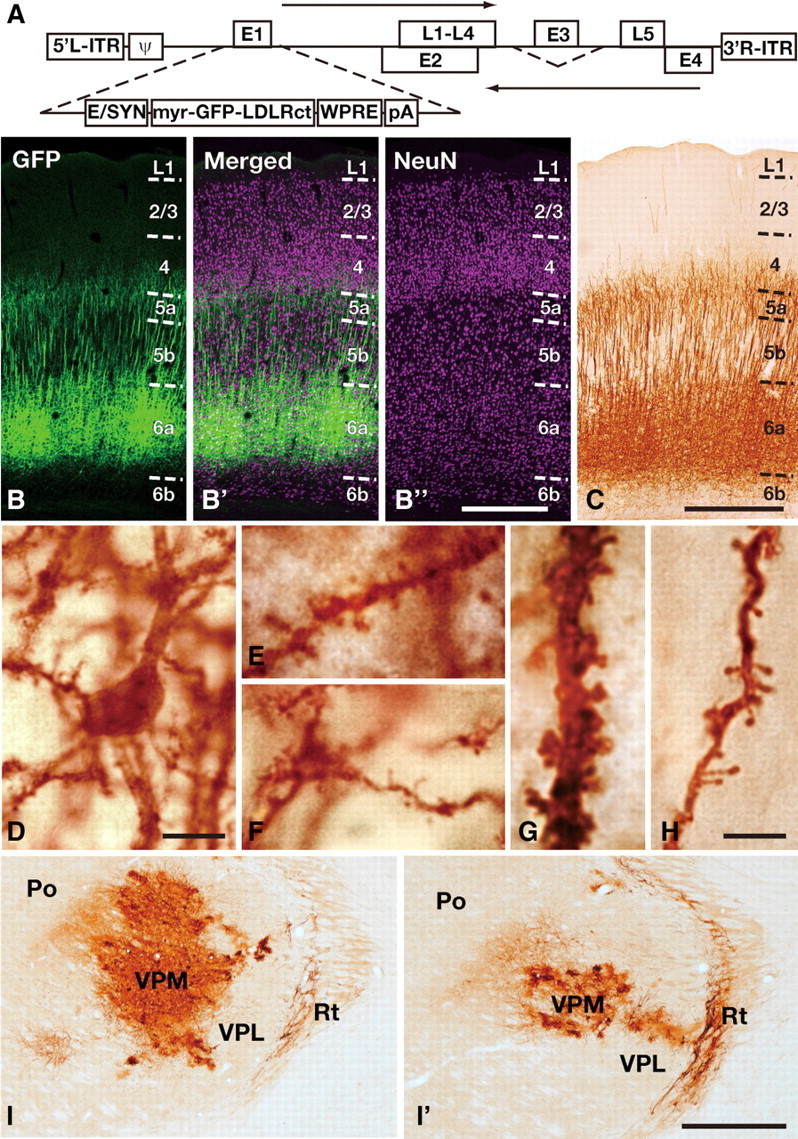
Retrograde labeling of corticothalamic neurons with adenoviral vector. A, Construction of the adenoviral vector expressing somatodendritic membrane-targeted GFP. ITR, Inverted terminal repeat; ψ, packaging signal; E1–5, early regions 1–5; L1–5, late regions 1–5; pA, poly-adenylation signal. B, C, L6a neurons of the barrel cortex were retrogradely immunolabeled 1 week after injection of adenoviral vector expressing somatodendritic membrane-targeted GFP into the ventrobasal thalamic nucleus. GFP immunoreactivity was visualized either with Alexa Fluor 488 (B) or with DAB (C). NeuN immunoreactivity was also visualized with Alexa Fluor 647 (B′,B″) to clarify the cortical cytoarchitecture. D–H, At higher magnification, immunolabeling of GFP successfully visualized cell bodies (D), basal dendritic branches (E, F), apical dendritic shafts (G), and apical dendritic tufts (H) of CTNs. Note that no obvious axonal fibers were found. (I,I′) Dense neuronal and glial processes were found in and around the injection site (I) and cells in reticular thalamic nucleus (Rt) were also labeled (I,I′). The photograph in I′ was taken 300 μm anterior to that in I. Po, Posterior thalamic nuclei; VPM, ventral posteromedial thalamic nucleus; VPL, ventral posterolateral thalamic nucleus; Rt, thalamic reticular nucleus. Scale bars: (in B″) B–B″, 500 μm; C, 500 μm; D, 10 μm; (in H), E–H, 5 μm; (in I′) I, I′, 500 μm.
Surgery
Rats were anesthetized through an intraperitoneal injection of 7% (w/v) chloral hydrate. For the analysis of the connection of single pyramidal neurons to corticothalamic neurons, 2 μl of 0.6 m NaCl containing adenoviral vector (Tomioka and Rockland, 2006) was injected very slowly for 30 min into the right ventrobasal thalamic complex by pressure through a glass micropipette equipped with a picospritzer III (Parker Hannifin Corporation, General Valve Division). Air pressure, duration, and frequency were set at 40 psi, 5–10 ms, and 0.1–1.0 Hz, respectively. For the assessment of the labeling efficiency by retrograde tracers, 1 μl of 0.6 m NaCl containing adenoviral vector (Tomioka and Rockland, 2006), 0.2 μl of 1% (w/v) Cholera toxin B subunit (List Biological Laboratories) in 10 mm PBS, pH 7.4, or 0.2 μl of 4% (w/v) Fluorogold (Fluochrome) in distilled water was injected.
Assessment of the efficiency of retrograde labeling
Methods for fixation and immunofluorescence were described previously (Kuramoto et al., 2007) and antibodies/reagents/filter sets used in the detection of retrograde tracers and NeuN, a neuron-specific marker, are summarized in Table 1. Under a confocal laser-scanning microscope (LSM 5 Pascal; Carl Zeiss), images were serially taken through the thickness of sections (30 μm) with the optical thickness of 1.8 μm (corresponding to pinhole of 1 Airy unit), using an oil-immersion ×63 objective lens (Plan-NEOFLUAR, numerical aperture 1.40). We divided the number of NeuN/GFP (or other tracers) double-positive cells by the number of NeuN-positive cells, to obtain the rate of the retrograde labeling. Cells were counted stereologically in all cases (Howard and Reed, 1998).
Table 1.
Summary of antibodies/reagents/filters used for the detection of retrograde tracers
| GFP | Cholera toxin B subunit | Fluorogold | NeuN | ||
|---|---|---|---|---|---|
| Primary antibody | |||||
| Host | Rabbit | Goat | Rabbit | Mouse | |
| Concentration | 1 μg/ml | 1:500 | 1:500 | 2 μg/ml | |
| Source | (Nakamura et al., 2008; Tamamaki et al., 2000) | List Biology | Millipore | Millipore | |
| Secondary antibody | |||||
| Target | Rabbit IgG | Goat IgG | Rabbit IgG | Mouse IgG | Mouse IgG |
| Host | Goat | Donkey | Goat | Goat | Donkey |
| Label | Biotin | Cy3 | Alexa Fluor 546 | Alexa Fluor 647 | Cy5 |
| Concentration | 10 μg/ml | 10 μg/ml | 5 μg/ml | 10 μg/ml | 10 μg/ml |
| Source | Vector | Jackson ImmunoResearch Laboratories | Invitrogen | Invitrogen | Jackson ImmunoResearch Laboratories |
| Other reagents | Streptavidin | ||||
| Label | Alexa Fluor 488 | ||||
| Concentration | 5 μg/ml | ||||
| Source | Invitrogen | ||||
| Excitation beam | 488 nm | 543 | 543 | 633 | |
| Emission filter set | 505–530 nm | 560–615 nm | 560–615 nm | >650 nm | |
In vitro intracellular recording
Rats were allowed to survive for 6–14 d after operation, again anesthetized deeply by ether inhalation, and decapitated. Slices were prepared as described previously (Cho et al., 2004a) with slight modifications. To retain neuronal viability in slices, we used N-methyl-d-glucamine-based cutting solution (Tanaka et al., 2008), which contained (in mm) 147 N-methyl-d-glucamine, 20 HEPES, 1 KCl, 1.3 KH2PO4, 2.5 MgSO4, 1 CaCl2, 10 glucose (pH was adjusted to 7.4 by HCl). The brains were removed quickly and cut frontally into 500-μm-thick slices in the cutting solution saturated with 95% O2 and 5% CO2. The cutting direction was optimized in the preliminary experiments to be parallel to the apical dendrites of pyramidal neurons.
Cortical slices were placed at 34–35°C in an interface chamber and perfused with ACSF, which was composed of (in mm) 124 NaCl, 3.3 KCl, 1.3 KH2PO4, 26 NaHCO3, 1 MgSO4, 2.5 CaCl2, and 10 glucose (pH was 7.4 when saturated with 95% O2 and 5% CO2 gas). Glass microelectrodes were made with a puller (P-97; Sutter) and filled with 3% (w/v) biocytin (Sigma) dissolved in 2 m KCH3SO4 and 50 mm Tris-HCl, pH 7.4. The resistance of the electrodes was typically 80–100 MΩ. To maximize the morphological recovery of neuronal processes, we recorded neurons in the middle two fifth of the slice thickness (150–350 μm from the slice cut surface) in the cortical slices where successful retrograde labeling of L6 was checked by an epifluorescence microscopy.
With the help of the fluorescence microscope and stereomicroscope, we moved the recording electrode into the region containing many retrogradely labeled neurons. After impalement, the response of the pyramidal neuron to current injection was recorded with a current-clamp amplifier (IR-183; Cygnus Technology) and stored in a computer through an analog-digital converter (PowerLab; ADInstruments). Before releasing the impaled neuron, biocytin was injected by passing 200-ms-long, 0.1–0.5 nA positive pulses at 2.0 Hz. In most cases, only one neuron was impaled in a slice to avoid an overlap of dendritic or axonal arbors of two or more neurons. After recording, the slices were further incubated for 1–4 h and fixed for 20 h at 24–25°C in 0.1 m sodium phosphate, pH 7.4, containing 3% (w/v) formaldehyde, 0.01% (w/v) glutaraldehyde, and 75%-saturated picric acid.
Double peroxidase staining
After cryoprotection with 30% (w/v) sucrose in PBS, the slices were further cut into 25-μm-thick sections on a freezing microtome. In the following procedures, each section was separately incubated in a well at room temperature. All the reagents of the following incubations were resolved in PBS containing 0.3% (v/v) Triton X-100 and 0.02% (w/v) sodium merthiolate unless otherwise stated, and an incubation was followed by several rinses with PBS containing 0.3% (v/v) Triton X-100. The sections were: (1) soaked for 30 min in 1% (v/v) H2O2 in PBS to suppress endogenous peroxidase activity in the tissue, (2) incubated for 30 min with 10% (v/v) normal donkey serum (Millipore), (3) incubated for at least 12 h with a mixture of avidin-biotinylated peroxidase complex (ABC; 1:50; PK-6100, Vector Laboratories), 0.5 μg/ml Alexa Fluor 594-conjugated StreptAvidin (Invitrogen) and 0.5 μg/ml affinity-purified anti-GFP rabbit antibody (Tamamaki et al., 2000; Nakamura et al., 2008), (4) observed under an epifluorescence microscope (Axiophot; Carl Zeiss) to determine which section contained the cell body of the biocytin-injected neuron, (5) incubated for 30–60 min with 0.02% (w/v) diaminobenzidine-4HCl (DAB; Dojindo Laboratories), 10 mm nickel ammonium sulfate, and 0.0001% (v/v) H2O2 in 50 mm Tris-HCl, pH 7.6, for visualization of the intracellularly labeled neuron followed by rinses with 50 mm Tris-HCl, (6) incubated for 30 min with 2% (w/v) NaN3 in 50 mm Tris-HCl to inactivate peroxidase attached to biocytin, (7) incubated for 1 h with 10 μg/ml biotinylated anti-rabbit IgG goat antibody (Vector Laboratories), (8) incubated for 1 h with ABC (1:150), (9) incubated for 30 min with 0.6 μm biotinylated tyramine in 50 mm sodium phosphate buffer, pH 7.4, containing 3 μg/ml glucose oxidase (259 U/mg; Nacalai Tesque) and 2 mg/ml β-d-glucose (Nacalai Tesque) for further signal enhancement of GFP immunoreactivity (Furuta et al., 2009; Kuramoto et al., 2009), (10) incubated for 1 h with ABC (1:10,000) again, (11) incubated for 30–60 min with 0.02% DAB and 0.001% (v/v) H2O2 in 50 mm Tris-HCl, pH 7.6 for visualization of retrogradely labeled neurons, and (12) mounted on gelatin-coated glass slides, dehydrated with an ethanol series, cleared in xylene, and coverslipped with organic mounting medium MX (Matsunami).
After the step (4), the section containing the cell body of the impaled neuron was incubated with 5 μg/ml Alexa Fluor 488-conjugated anti-rabbit IgG goat antibody (Invitrogen) and 1 μg/ml 4′,6-diamidino-2-phenylindole (DAPI; Invitrogen) for 1 h. This section was observed again under the epifluorescence microscope with filter sets for DAPI (359–371 nm excitation and 397–490 nm emission), Alexa Fluor 488 (450–490 nm excitation and 515–565 nm emission), and Alexa Fluor 594 (530–585 nm excitation and ≥615 nm emission) to determine which layer the impaled neuron was located at, whether it expressed GFP or not, and how dense the retrograde labeling was in this slice. The section was then incubated for 1 h with 0.5 μg/ml anti-GFP rabbit antibody again, to recover GFP immunoreactivity that had been reduced by the incubation with the fluorescent-conjugated secondary antibody. After these additional steps, the section returned to the step (5).
Data analysis
Analyses of neuronal processes and bouton distribution.
Slices collected for analyses met all the following criteria: (1) CTNs in the posteromedial barrel subfield were sufficiently labeled (>50% of L6a neurons), (2) stained axons of the intracellularly labeled cell did not fade, and (3) slices did not show clear damage, except at the slice cut surface. Because ∼60% of L6a neurons were labeled after massive injections of retrograde tracers into the thalamus (see Results), the condition (1) ensures that >80% of L6 CTNs were labeled in the analyzed region (50/60 = 0.83). Five neurons from each of L2/3, L4, L5b, L6 GFP-positive (L6+), and L6 GFP-negative (L6−) groups and three neurons from L5a group were analyzed (see also Results). First, neuronal processes of an intracellularly stained neuron projected onto the frontal plane were reconstructed using the camera lucida method with a light microscope and an attached drawing tube. After 2D-reconstruction of neuronal processes, we plotted the cell body and boutons of intracellularly labeled neurons by using Neurolucida (MBF Bioscience) installed on a microscope (VANOX; Olympus) with an oil-immersion ×100 objective lens (PLAN Apo, numerical aperture 1.35) and 30 inch monitor (resultant magnification was ×5000). When axon varicosities were ≥1.5-fold thicker than intervaricose fibers, they were presumed to be presynaptic axon boutons in the present study. During plotting, we carefully examined whether or not each bouton was apposed to a CTN dendrite, while moving the plane of focus up and down.
The data of three-dimensional distribution of axon boutons were analyzed using IgorPro 5.05 (WaveMetrics). Because z-axis, which is perpendicular to the section surface, was shrunken through the poststaining procedure (i.e. mounting, dehydration, and clearing), we corrected the z-axis depths by dividing them with the shrinkage factors (= [the actual thickness of mounted sections in μm]/[25 μm]). We measured horizontal distance (x) between each axon bouton and the cell body of its origin. Horizontal distance was measured after projection onto the L4/5 boundary plane, compensating for the curvature of the rat cerebral cortex. Relative frequency histograms for x of apposed boutons were fitted with a mixture of gamma distributions, x·exp(−x/β). Fitting was performed by maximum likelihood estimation and the model (i.e., how many gamma distributions were mixed) was selected by the Bayesian information criterion (Schwarz, 1978). All histograms were best fitted with a single gamma distribution, except in the case of three L4 neurons and three L5b neurons. The vertical location of boutons was transformed in a linear normalized scale in which the pia mater was set to 0.0 and the white matter border was to 1.0.
For analysis of the distance between descending axons and dendritic bundles, we plotted descending axons of L2/3 and L4 neurons as well as dendritic bundles around those descending axons with Neurolucida. The three-dimensional Euclidian distance between the center of the nearest dendritic bundle and the axon was measured and the minimal value was used as the distance to the nearest dendritic bundle center.
Morphological estimation of local excitatory inputs to L6 CTNs.
We counted apposed boutons located in the hollow cylindrical interval between horizontal distances x and x + 1 (μm) from the cell body of a single pyramidal/spiny neuron and divided this number by the area of this cylindrical interval, π{(x + 1)2 − x2}. The obtained density was defined as a(x, y), where y is the normalized vertical location at which the pyramidal/spiny neuron's cell body was located. The density a(x, y) can also be seen as a density of apposed boutons originating from a pyramidal/spiny neuron at (x, y), where horizontal distance x is measured from CTN dendrites receiving these apposed boutons (see also Results for underlying suppositions). Multiplying a(x, y) by n(y), the density of pyramidal/spiny neurons at y, we obtained i(x, y), which indicates how many numbers of apposed boutons on CTN dendrites in a slender square prism (1 × 1 μm2 base; located at x = 0) are originating from neurons within a small cube at (x, y) as shown in Figure 8B. To compensate the effect of slice cutting, when x is >250 (μm), we corrected a(x, y) by dividing it with the correction factor, . n(y) was determined by stereological counting (Howard and Reed, 1998) of vesicular glutamate transporter 1-positive cells in each layer that were labeled by in situ hybridization (Nakamura et al., 2007) with the counterstain of neuronal cell bodies. n(y) was 52,340 ± 4831/mm3 for 0.06 < y < 0.23 (L2/3), 78,364 ± 2680 for 0.23 < y < 0.38 (L4), 26,706 ± 6198 for 0.38 < y < 0.45 (L5a), 37,350 ± 2145 for 0.45 < y < 0.62 (L5b), and 51,755 ± 5840 for 0.62 < y < 0.91 (L6a) (mean ± SD, N = 3). We discretized y into 15 segments and allocated a(x, y) obtained from 25 neurons. For segments with two or more neurons, a(x, y) was obtained by averaging the sets of a(x, y) of contained neurons.
Figure 8.

Estimation of input from pyramidal/spiny neurons in a cube to CTN dendrites. A, Reexamination of the data under the three suppositions described in the text. An average neuron in each pyramidal/spiny neuron group distributed its apposed boutons isotropically to CTN dendrites located at a horizontal distance x (green cylinder, top). The red cylinder (middle) represents another hollow cylinder filled with pyramidal/spiny neurons around a green prism. CTN dendrites in the central prism would then receive the same amount of projections from each average neuron located at the same distance from these dendrites in all directions (bottom). B, As shown on top, i(x, y) represents the number of apposed boutons projected to CTN dendrites in the prism by neurons in a cube located at (x, y). The scheme of two-dimensional input map is shown on bottom. C, i(x, y) is displayed in the x–y plane (smoothed with Gaussian kernel; σ = 10 μm for x). Color code shows the magnitude of i(x, y) in normalized value (maximum = 1), and regions encircled by black borders show significantly high i(x, y) (> mean + 2SD; calculated within the range of x = 0–200 μm). D, Simulated i(x, y) without basal dendrite-targeting L6 boutons originating from L4 neurons. Magnitude of i(x, y) in D is normalized with the maximum value in C. Note that the signal in L4 is remarkably reduced.
IL[x1, x2] represents how many apposed boutons on CTN dendrites in a slender prism (1 × 1 μm2 base) are originating from a group of pyramidal/spiny neurons (L = L2/3, L4, L5a, L5b, L6+, or L6−) located in the hollow cylinder whose internal and external radii are x1 and x2, respectively (see Fig. 9A). IL[x1, x2] could be obtained as IL[x1, x2] = ∫Vi(x, y)dv, where V was the volume of the hollow cylinder between distances x1 and x2 in each layer or sublayer. However, to assess the variability of the data, we first integrated a(x, y)·n(y) obtained from single pyramidal/spiny neurons and then averaged within each group. To obtain n(y) for L6+ and L6− neurons, we estimated that 69% of excitatory neurons in L6a were corticothalamic neurons because 59% of L6a neurons were retrogradely labeled following a massive injection of retrograde tracer, and because 85% of neurons were positive for vesicular glutamate transporter 1 in L6a. On the other hand, 31% of L6a excitatory neurons were considered as corticocortical neurons (see also Results).
Figure 9.

Horizontal organization of local excitatory inputs to CTNs. A, An example of IL[x1, x2]. As the scheme shows, IL[x1, x2] represents the number of apposed boutons on CTN dendrites in the central slender prism (1 × 1 μm2 base) by the neurons that are classified into each pyramidal/spiny neuron group (L = L2/3, L4, L5a, L5b, L6+, or L6−) and located in the hollow cylinder whose internal and external radii are x1 and x2, respectively. B–D, Inputs from neurons located at x = 0–200 μm (B), x = 200–1500 μm (C), and x = 0–28 μm (D). E, F, Descending thick axons of a representative L2/3 neuron (E) and L4 neuron (F) are indicated by arrows and dendritic bundles of CTNs are indicated by arrowheads. Note that the axon of the L4 neuron changes course and approaches a CTN dendritic bundle in the middle of L5 and descends along the bundle. G, The minimal distance between the descending axon and the center of the nearest apical dendritic bundle showed that the descending axons of L4 neurons ran at closer range to the dendritic bundle than those of L2/3 neurons. Scale bar, (in F) E, F, 50 μm. Each bar and error bar represents the mean and SD, respectively. *p < 0.05; **p < 0.01; ***p < 0.001 by Peritz's F test. †p < 0.05 by two-tailed t test.
Statistics.
When we compared all pairs between the six pyramidal/spiny neuron groups (15 comparisons) we used Peritz's F test (Harper, 1984), a multiple-comparison test (Tables 2, 3; see Figs. 6, 9). For pairwise comparison in each neuron group, we used two-sided t test with Bonferroni correction (see Fig. 7). Differences were accepted as significant if the family-wise type I error probability was <0.05. Each statistic and p value was calculated with Prism 5.0 or programs written in Igor 5.05.
Table 2.
Morphological properties of sampled cortical pyramidal neurons
| Pyramidal neuron group |
||||||
|---|---|---|---|---|---|---|
| L2/3 (n = 5) | L4 (n = 5) | L5a (n = 3) | L5b (n = 5) | L6 + (n = 5) | L6− (n = 5) | |
| Soma area (μm2) | 98.7 ± 8.0 | 84.0 ± 9.6 | 190.0 ± 84.1*,†† | 243.8 ± 70.8**,††† | 95.5 ± 23.4‡‡,§§§ | 100.5 ± 7.7‡,§§§ |
| Horizontal span of apical dendrite (μm)a | 416.6 ± 64.2 | 138.5 ± 49.1*** | 111.4 ± 30.0*** | 432.4 ± 98.5†††,‡‡‡ | 172.8 ± 37.2***,§§§ | 206.2 ± 83.7***,§§§ |
| Height of apical shaft (μm)a | 305.0 ± 70.8 | 362.1 ± 121.3 | 748.0 ± 74.4***,††† | 944.8 ± 91.4***,†††, ‡ | 708.8 ± 81.9***,†††,§§§ | 408.7 ± 84.8‡‡‡,§§§,¶¶¶ |
| Horizontal span of basal dendrite (μm)a | 274.8 ± 42.6 | 227.7 ± 19.7 | 361.2 ± 27.7†† | 420.6 ± 85.0***,††† | 214.0 ± 34.5‡‡‡,§§§ | 314.7 ± 44.8†,§§,¶¶ |
| Total length of axon collaterals (mm)b | 26.92 ± 7.39 | 25.07 ± 11.45 | 29.5 ± 6.3 | 12.5 ± 2.92*,‡ | 9.19 ± 3.38**,†,‡‡ | 26.11 ± 11.24§,¶¶ |
| Total number of boutons (A)c | 5918 ± 2282 | 5993 ± 3243 | 5408 ± 1636 | 1695 ± 503**,††,‡ | 1872 ± 1012**,††,‡ | 4675 ± 2704§ |
| Bouton density (/mm) | 215.5 ± 34.5 | 231.3 ± 35.9 | 181.9 ± 36.8 | 135.0 ± 22.5**,††† | 195.4 ± 36.0§ | 168.7 ± 37.6† |
| Number of boutons apposed to CTN dendrites(B) | 167 ± 115 | 327 ± 164 | 529 ± 148 | 374 ± 142 | 612 ± 223* | 953 ± 500***,††,§§ |
| B/A (%) | 2.97 ± 1.88 | 5.89 ± 2.50 | 10.17 ± 2.74 | 21.54 ± 2.59***,†† | 35.41 ± 11.76***,†††,‡‡‡,§ | 24.75 ± 11.22***,†††,‡,¶ |
*,†,‡,§,¶Significant differences (*,†,‡,§,¶p < 0.05; **,††,‡‡,§§,¶¶p < 0.01; ***,†††,‡‡‡,§§§,¶¶¶p < 0.001 by Peritz's F test) from the value of L2/3, L4, L5a, L5b, or L6+ neurons, respectively.
a The horizontal span and height of dendrites were measured in the frontal plane to which all the dendrites were projected.
bTotal length of axon collaterals was estimated by multiplying the total length of axon collaterals projected onto the frontal plane by π/2.
cTotal number of boutons in L4–6 were counted and those in L1–3 were estimated from length of axon collaterals and bouton density in L1–3 (L2/3 neurons, 224.2 ± 39.0 /mm; L4 neurons, 269.6 ± 38.3 /mm; L5a neurons, 229.8 ± 52.7 /mm; L5b neurons, 200.5 ± 37.6 /mm).
Table 3.
Electrophysiological properties of sampled cortical pyramidal neurons
| Pyramidal neuron group |
||||||
|---|---|---|---|---|---|---|
| L2/3 (n = 5) | L4 (n = 5) | L5a (n = 3) | L5b (n = 5) | L6+ (n = 5) | L6− (n = 5) | |
| Resting membrane potential (mV) | −73.0 ± 2.6 | −68.0 ± 7.4 | −61.5 ± 7.6 | −64.8 ± 8.7 | −68.4 ± 3.7 | −66.2 ± 7.0 |
| Membrane time constant (ms) | 11.5 ± 2.6 | 7.5 ± 4.5 | 11.5 ± 4.6 | 11.7 ± 5.1 | 9.8 ± 3.0 | 7.9 ± 2.6 |
| Input resistance (MΩ) | 51.1 ± 27.5 | 68.3 ± 28.8 | 65.3 ± 34.4 | 48.7 ± 29.5 | 62.2 ± 18.1 | 48.1 ± 11.8 |
| Action potential (AP) threshold (mV) | −47.6 ± 7.9 | −41.3 ± 15.6 | −40.2 ± 7.2 | −50.6 ± 10.5 | −41.4 ± 5.1 | −43.1 ± 7.1 |
| AP height (mV)a | 96.2 ± 8.0 | 103.8 ± 10.2 | 85.9 ± 10.0 | 97.9 ± 5.7 | 89.4 ± 6.4 | 94.0 ± 16.8 |
| AP half width (ms) | 0.85 ± 0.24 | 0.86 ± 0.39 | 0.88 ± 0.18 | 0.72 ± 0.29 | 0.77 ± 0.16 | 0.71 ± 0.13 |
| Fast afterpotential (mV)b | 2.7 ± 2.8*,‡‡‡ | −1.5 ± 2.0††,‡ | −3.9 ± 3.0††† | 4.9 ± 2.6‡‡‡ | −6.1 ± 3.3††† | −1.1 ± 3.0†,‡ |
| Slow afterpotential (mV)b | −1.2 ± 1.3 | −1.6 ± 1.0 | −4.9 ± 0.7 | −2.5 ± 4.4 | −2.4 ± 3.3 | −3.3 ± 1.9 |
*,†,‡Significant differences (*,†,‡p < 0.05;††p < 0.01;†††,‡‡‡p < 0.001 by Peritz's F test) from the value of L5a, L5b, or L6+ neurons, respectively.
aAP height was measured from resting membrane potential.
bFast and slow afterpotential was measured from baseline prior to action potential evoked by a short (< 5 ms) depolarizing pulse, at 3.3 ms or 29 ms from action potential onset, respectively. Pulse response without action potential to the same depolarizing pulse was recorded in another trace and subtracted. Our previous study showed that one type of L6 pyramidal neurons has a peak of fast afterhyperpolarization (AHP) at 3.3 ms on average, and that another type of L6 pyramidal neurons lacks fast AHP and has a peak of medium-range AHP at 29 ms on average (Kaneko et al., 1995).
Figure 6.
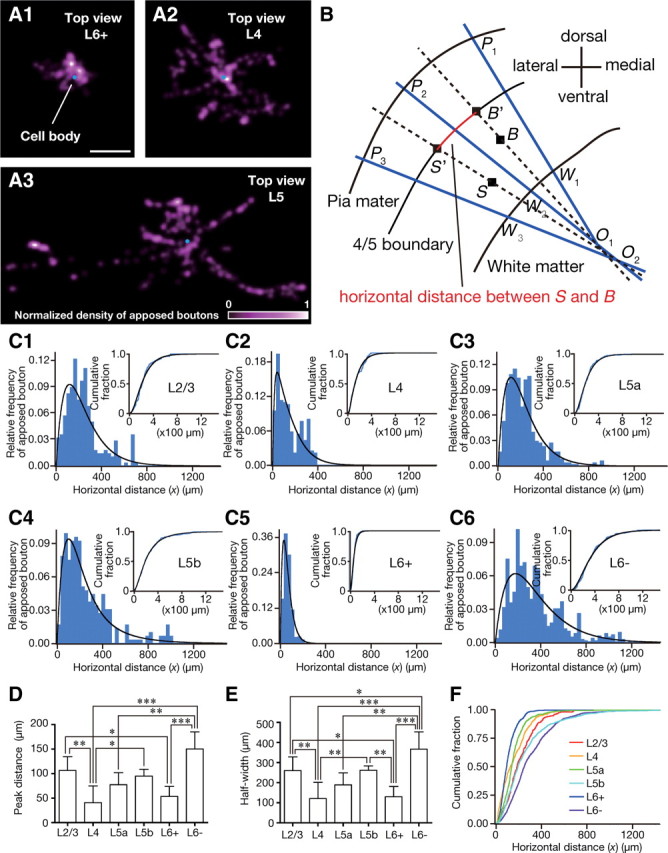
Horizontal distribution of apposed boutons. A1–3, The density map of apposed boutons in a horizontal plane (Fig. 5, the plane corresponding to “Top view”) is shown after being smoothed by 2D convolution with a Gaussian kernel (σ = 4 μm; a comparable value with the interbouton interval) and normalized (bottom of A3). B, We plotted the boundary of L4 and L5 (L4/5 boundary) and the directions of apical dendrites of corticothalamic neurons every 50 μm (lines PmWm) and determined Om as the intersection of lines PmWm and Pm+1Wm+1. These intersections were always located in the white matter because of the convexity of the rat cerebral cortex. The locations of the cell body and boutons were then projected onto L4/5 boundary; for examples, S was projected along line SO2 to S' and B along line BO1 to B'. Horizontal distance x between S and B is to be measured as the distance between S' and B' along the L4/5 boundary (red curve). Because the rat barrel cortex along the rostrocaudal axis is much flatter, no correction for rostrocaudal direction was performed. C1–6, Relative frequency histograms (blue histogram, bin size = 30 μm) and cumulative fractions (insets, blue lines, bin size = 1 μm) for the horizontal distance of apposed boutons originating from a representative cell in each layer. Each distribution was fitted with a mixture of gamma distributions (black lines). Most distributions were best fitted with a single gamma distribution in terms of the Bayesian information criterion. D, E), The peak position and the half width of the curves are compared between the neuron groups. F, The cumulative fraction averaged within each neuron group (bin size = 1 μm). Scale bar: (in A1) A1–3, 100 μm. Each bar and error bar in D, E represents the mean and SD, respectively. *p < 0.05; **p < 0.01; ***p < 0.001 by Peritz's F test.
Figure 7.

Horizontal distribution of apposed boutons onto the apical and basal dendrites of CTNs. A, Frequency (A1) and relative frequency (A2) histograms of apposed boutons against the vertical axis of the cerebral cortex. The vertical locations of boutons are expressed in a linear normalized scale in which the pia mater is set to 0.0 (Pia) and the white matter border is to 1.0 (WM). Dashed lines show the boundaries between L2/3 and L4 or between L5 and L6. B, Frequency (B1) and relative frequency (B2) histograms of apposed boutons originating from a representative L4 neuron (bin size = 30 μm). We divided apposed boutons into boutons in L4/5 (orange) and those in L6 (green). The main targets of L4/5 and L6 apposed boutons were the apical and basal dendrites of CTNs, respectively. C, The averaged cumulative fractions of five L4 neurons (bin size = 1 μm). D, The peak positions of the distributions of L4/5 (orange) and L6 apposed boutons (green) in each neuron group. The peaks were determined by fitting a mixture of gamma distributions as described in Figure 6, and all distributions were best fitted with a single gamma distribution by the Bayesian information criterion. Because all the L2/3 neurons and two of three L5a neurons have <5% of their apposed boutons in L6, we did not perform a similar analysis for L2/3 and L5a neuron groups. Only L4 neurons showed a significant difference between peak positions of L4/5 and L6 apposed boutons. Each bar and error bar represents the mean and SD (N = 5 neurons per group), respectively. n.s., Not significant. ***p < 0.001 by two-tailed t test with Bonferroni correction. E, Representative reconstructions of L4 spiny stellate cells (left) and star pyramids (right). Note that the axons in L6 go straight down and have only a few branches in L6.
Results
Retrograde labeling of CTNs with adenoviral vector
To visualize CTN dendrites, we developed an adenoviral vector expressing myrGFP-LDLRct (Kameda et al., 2008), a somatodendritic membrane-targeted GFP, under the control of an enhanced human synapsin I promoter (Hioki et al., 2007) (Fig. 1A). After the adenoviral vector was injected with the vehicle containing 0.6 m NaCl (Tomioka and Rockland, 2006) into the ventrobasal thalamic complex of rats, a band of L6 neurons in the S1 cortex was retrogradely labeled (Fig. 1B,C). As reported previously (Killackey and Sherman, 2003), labeled cells were mostly found in L6a, the upper part of L6 separated from L6b by cell-sparse fibrous zone (Fig. 1B) (Valverde et al., 1989). L5 corticothalamic neurons mainly projecting to posterior thalamic nuclei (Bourassa et al., 1995; Killackey and Sherman, 2003) were rarely labeled (<1% in all GFP-positive neurons) and were negligible in subsequent analyses when the injection was confined to the ventrobasal complex. With this retrograde labeling method, not only the cell bodies and dendritic shafts of CTNs but the fine dendritic structures such as spines were visualized (Fig. 1D–H). In contrast, almost no axon collaterals of retrogradely labeled neurons or anterogradely labeled thalamocortical axons were observed in the S1 cortex. Moreover, ∼60% of L6a neurons (i.e., 70% of L6a excitatory neurons) were labeled following vector injection >3 × 10⁶ GTU. Since this saturation level (59.0 ± 3.9%; mean ± SD, N = 8) was similar to the labeling efficiency of other potent retrograde tracers such as cholera toxin B subunit and Fluorogold (58.6 ± 11.0%, N = 4 and 57.6 ± 8.9%, N = 3; p = 0.96 by one-way ANOVA), almost all CTNs were considered to be visualized at least in the center of labeling. The labeling efficiency of adenovirus vector (1 × 10⁷ GTU) did not significantly differ between postinjection survival times of 4, 8, and 16 d (56.1 ± 2.6%, 58.1 ± 5.6%, and 59.8 ± 1.1%, N = 3 each; p = 0.50 by one-way ANOVA). Furthermore, thalamic neurons in and around the injection site in the ventrobasal thalamic complex were labeled, and some neurons in the thalamic reticular nucleus was labeled retrogradely (Fig. 1I).
Intracellular labeling of pyramidal/spiny neurons and their local connections to CTNs
In 500-μm-thick cortical slices containing retrogradely labeled CTNs, 11, 9, 29, and 41 pyramidal/spiny neurons were sampled in L2/3, L4, L5, and L6, respectively, for intracellular recording/staining in the posteromedial barrel subfield of the rat S1 cortex. All the stained neurons were pyramidal neurons, except for four spiny stellate cells and one star pyramid of Lorente de Nó (1938) sampled in L4. We collected five pyramidal/spiny neurons from L2/3 and L4 and eight from L5 (Fig. 2A–C) that met the criteria for sufficient retrograde labeling and intracellular staining (see also Materials and Methods). We also accumulated five each of GFP-positive and GFP-negative pyramidal neurons located in L6 (Fig. 2D,E). We further divided eight L5 neurons into three L5a neurons and five L5b neurons according to their cell body locations (Schubert et al., 2006). As a result, each of the L2/3, L5b, L6 GFP-positive (L6+), or L6 GFP-negative (L6−) pyramidal neuron groups examined in the present study was thus comprised of five pyramidal neurons and the L5a neuron group contained three pyramidal neurons. The L4 neuron group involved two pyramidal neurons, two spiny stellate cells, and one star pyramid. Finally, all the 28 neurons were located in barrel columns, but not in septal columns of the posteromedial barrel subfield.
Figure 2.

Combining intracellular staining with retrograde labeling of CTNs. A–E, Double immunoperoxidase staining of an intracellularly labeled neuron in L2/3 (A), L4 (B), L5 (C), or L6 (D, E) (black, nickel-enhanced DAB) and retrogradely labeled CTNs (brown, DAB). Intracellularly labeled L6 neurons were also visualized with fluorescence (red, biocytin; green, GFP; blue, DAPI) and classified as GFP-positive CTNs (L6+; D, D′), or GFP-negative neurons (L6−; E, E′). Scale bars: (in E) A–E, 100 μm; (in E′) E′, D′, 10 μm.
L6− pyramidal neurons were different from thalamus-projecting L6+ neurons in several morphological and electrophysiological properties, and may represent a type of pyramidal neuron different from the CTN. All L6+ neurons showed tonic firing responses to a strong current injection, whereas four of the five L6− neurons displayed phasic firing responses. The fast hyperpolarizing afterpotentials of L6+ neurons were relatively deep and significantly different from those of L6− neurons (Table 3). Morphologically, L6+ neurons had narrow basal dendritic arbors and tufted apical dendrites that extended to L4, whereas L6− neurons had wide basal dendritic arbors and short apical dendrites that ended without entering L4. The axon collaterals of L6+ neurons took a direction toward the pia mater and entered L4 without spreading widely, while those of L6− neurons mainly spread horizontally through L5/6 (Table 2; Fig. 3). Because these electrophysiological and morphological properties of L6− neurons were similar to those of L6 corticocortical neurons identified by single axon tracing (Zhang and Deschênes, 1997) or by the lack of retrograde labeling after massive injection of retrograde tracer into the thalamus (Brumberg et al., 2003; Mercer et al., 2005; Kumar and Ohana, 2008), at least a subset of L6− neurons were considered corticocortical neurons.
Figure 3.
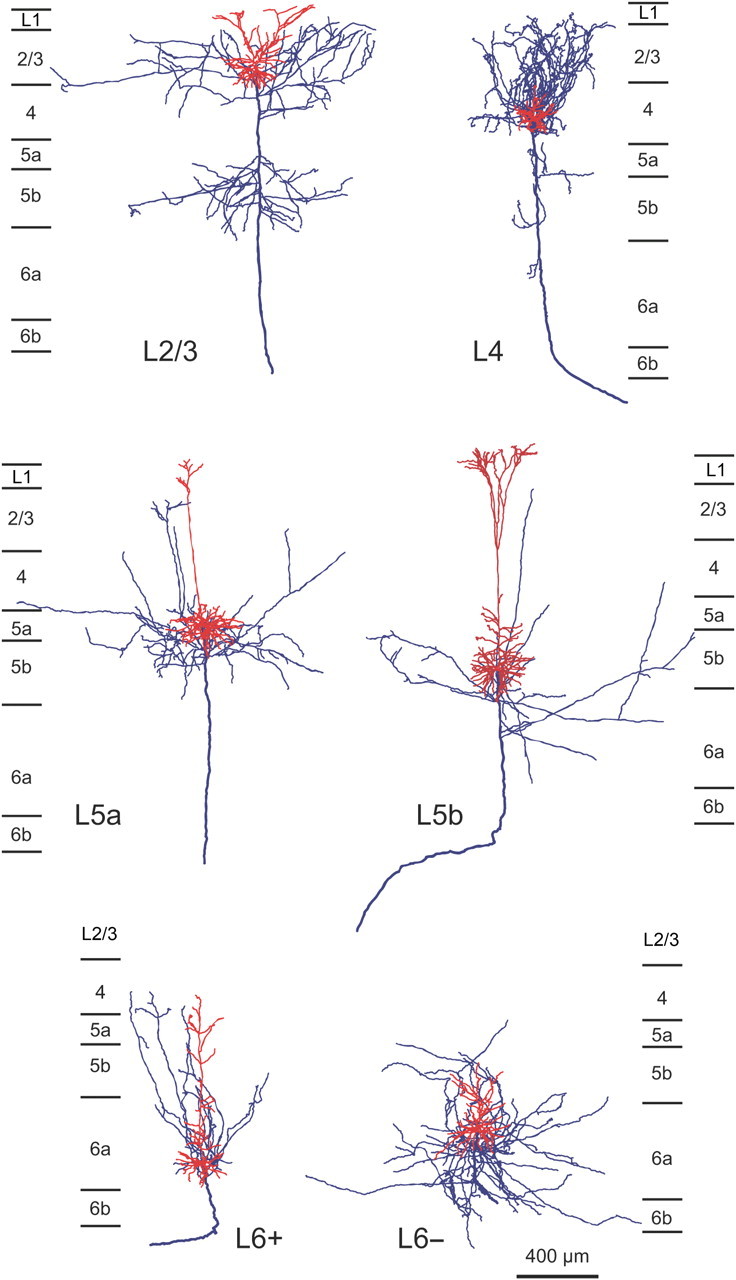
Two-dimensional reconstruction of intracellularly labeled neurons. Dendrites and axons originating from an L2/3, L4, L5a, L5b, L6+, or L6− neuron are shown with red and blue lines, respectively. Thick blue lines denote the thick straight axons.
The local axon collaterals of the reconstructed pyramidal/spiny neurons had many boutons, which were putative presynaptic structures. Some axon boutons of the pyramidal/spiny neurons were closely apposed to the dendrites of retrogradely labeled CTNs (hereafter called “apposed boutons”; Fig. 4A,B). The largest average number of apposed boutons per presynaptic neuron was observed for L6− neurons, followed by L6+, L5a, L5b, L4, and L2/3 neurons (Table 2), indicating that on average single L6− neurons exert a stronger influence on CTNs than single neurons of any other pyramidal/spiny neuron group.
Figure 4.
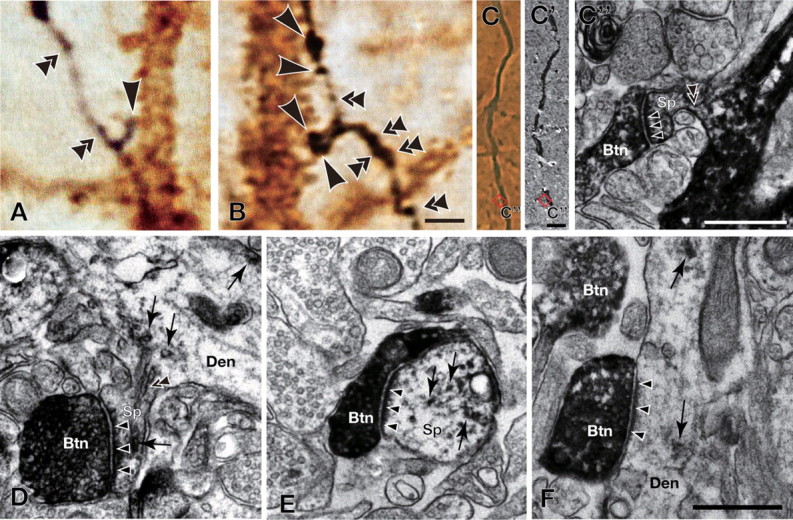
Analyses of axon boutons and synapses. A, B, Axonal processes of intracellularly labeled pyramidal neurons and dendritic processes are shown in black (nickel-enhanced DAB) and brown (DAB), respectively. Some axon boutons are closely apposed to CTN dendrites as indicated by single arrowheads. Other boutons that presumably have other targets than CTNs are indicated by double arrowheads. Boutons are indicated only when they are in the plane of focus. C–F, Electron microscopic observation of randomly selected apposed boutons revealed that 77% of the appositions formed synapses; arrowheads in C–F indicate asymmetric synapses made between nickel-enhanced DAB-labeled boutons (Btn) and DAB-labeled dendritic spines (Sp in C–E) or dendritic shafts (Den in F). Examples of DAB deposits are indicated by arrows. Double arrowheads in C″ and D indicate spine necks that connect a spine head (Sp) with a dendritic shaft (Den). Samples for electron microscopy were obtained by the same method as described by Cho et al. (2004b), except that we used the anti-GFP antibody (2–5 μg/ml) as the primary antibody. Scale bars: (in B) A, B, 2 μm; (in C) C, C′, 5 μm; C″, 500 nm; (in F), D–F, 500 nm.
In a different set of electron-microscopic studies, we randomly chose 35 apposed boutons to examine whether each of them actually made synaptic contact with an immunolabeled postsynaptic structure. All the apposed boutons examined were electron-microscopically confirmed as presynaptic structures. Of them, 27 were in synaptic contact against GFP-immunopositive postsynaptic profile (Figs. 4C–F), the rate (77%; 27/35) being consistent with previous reports (Markram et al., 1997; Kaneko et al., 2000; Cho et al., 2004b). The other eight apposed boutons were proved to be presynaptic structures with GFP-negative postsynaptic targets.
Horizontal distribution of local connections onto CTNs
To clarify the horizontal distribution of local connections in addition to the laminar distribution, we digitized the positions of apposed boutons in axons originating from intracellularly labeled pyramidal/spiny neurons in a three-dimensional space (Fig. 5). The distribution of apposed boutons in the horizontal plane perpendicular to the cortical columnar structures differed between the pyramidal/spiny neuron groups; for example, in Figure 6, A1 and A2, L6+ and L4 neurons displayed much narrower distributions than L5 neurons shown in Figure 6A3.
Figure 5.
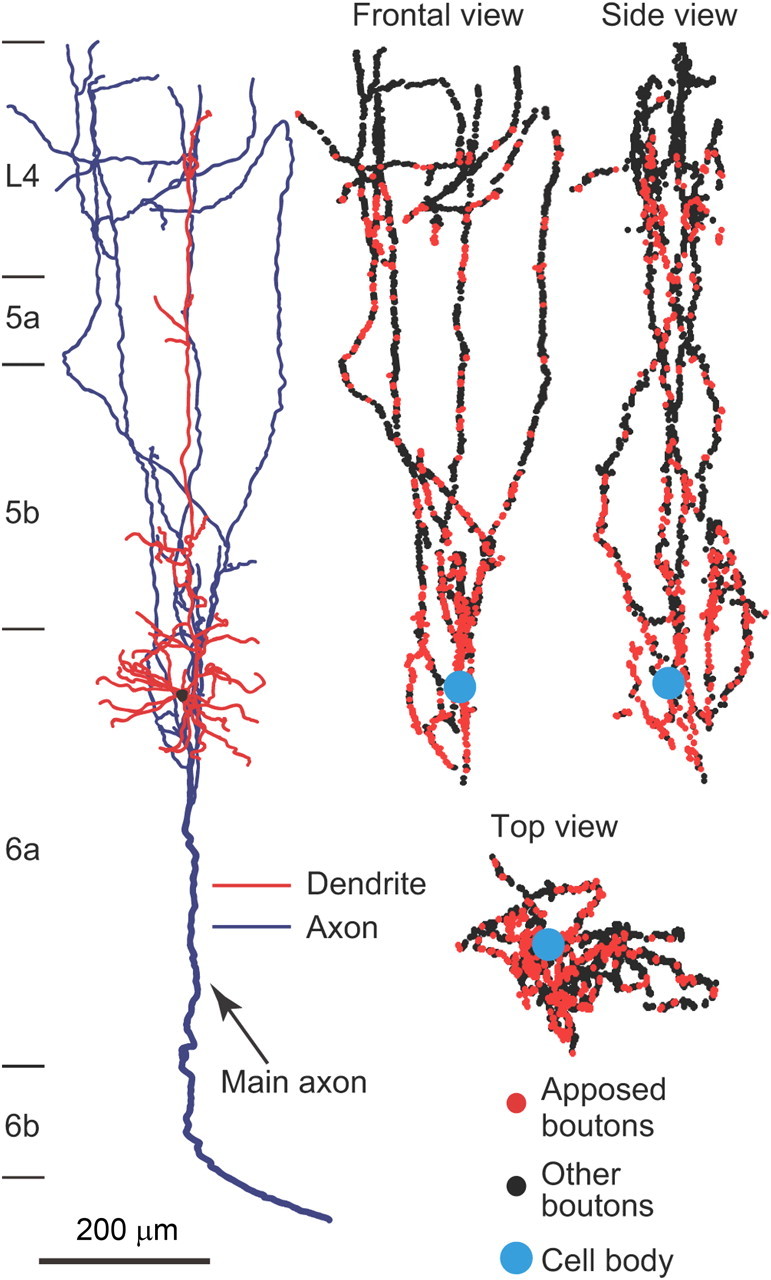
Three-dimensional distribution of axon boutons. The axon boutons of an L6+ pyramidal neuron were plotted three-dimensionally, and shown in three different views.
The “horizontal distance” between each apposed bouton and the cell body of its origin was normalized by measuring, after projection of the bouton and the cell body onto the L4/5 boundary plane to compensate for the effect of cortical curvature on the horizontal distance (Fig. 6B). In Figure 6C, the horizontal distribution of the apposed boutons arising from each neuron was summarized in a relative frequency histogram showing a single peak (blue lines and histograms are sample distributions, and black lines are fitting curves for determining peak positions; see Materials and Methods). The apposed boutons of L4 and L6+ neurons showed peak positions closer to their cell bodies and narrower half widths than those of the other neuron groups. Differences in the peak distance and half width between L4 neuron group and L2/3, L5b, or L6− group, or those between L6+ group and L2/3 or L6− group showed statistical significance (Fig. 6D,E). These results suggest that L4 and L6+ neurons are more likely to project to nearby CTNs than are neurons of the other groups. In contrast, L6− neurons exhibited the most distant peak position and the broadest half width (Fig. 6D,E). Consistent with these findings, the averaged cumulative distributions of the L4 and L6+ neuron groups increased rapidly, whereas that of the L6− neuron group rose slowly as x increased (Fig. 6F).
Connections to apical and basal dendrites of CTNs
Since apical and basal dendrites may separately integrate their inputs and distinctly affect the output of a cortical pyramidal neuron (Mel, 2008; Sjöström et al., 2008; Ledergerber and Larkum, 2010), we further tried to examine the difference between the horizontal distributions of boutons targeting the apical dendrites of CTNs and those targeting the basal dendrites. We first examined the histograms of frequency and relative frequency against the vertical location of apposed boutons (Fig. 7A). L2/3, L4, and L5a neurons allocated the most of their apposed boutons within L4/5, while L6+ and L6− neurons distributed the majority of their apposed boutons in L6. L5b neurons dispersed their apposed boutons rather evenly in L4/5 or in L6. For further analyses, we compared the horizontal distributions of apposed boutons in L4/5 and those in L6 for each pyramidal/spiny neuron group, as the majority of apical or basal dendrites of L6 CTNs spread in L4/5 or L6, respectively (Fig. 1B). In Figure 7B, the histograms show that L6 apposed boutons originating from a representative L4 spiny stellate cell were concentrated near the cell body (green), whereas its L4/5 boutons had the peak of the distribution at ∼200 μm from the cell body (orange). A similar distribution was observed in all subtypes of L4 pyramidal/spiny neurons and thus the average cumulative distribution of L6 apposed boutons arising from L4 pyramidal/spiny neurons was saturated at a clearly smaller x than that of L4/5 apposed boutons (Figs. 7C). Significant differences between the peak positions of L4/5 and L6 apposed boutons were only found in the L4 neuron group (p = 0.0008 by t tests with Bonferroni correction, Fig. 7D), but not in the other neuron groups. This characteristic distribution of apposed boutons originating from L4 neurons was mainly ascribed to their axonal arborization. As shown in Figure 7E, the axon collaterals of L4 neurons were widespread in L2–5 but highly restricted in L6.
Morphological estimation of local excitatory inputs to L6 CTNs
We next reexamined the present data so that we could estimate inputs from a mass of neurons to CTN dendrites and obtain a morphological input map that is comparable to the maps observed in previous photostimulation studies on L6 pyramidal neurons (Briggs and Callaway, 2001; Zarrinpar and Callaway, 2006; Llano and Sherman, 2009; Lam and Sherman, 2010; Hooks et al., 2011). For this reexamination, we made the following three suppositions: (1) The density of CTN dendrites is uniform at a given cortical depth, (2) the distribution and density of cell bodies of pyramidal/spiny neurons are horizontally constant at a given cortical depth, and (3) as a group, pyramidal/spiny neurons at a given cortical depth distribute their apposed boutons to CTNs isotropically but as a function of horizontal distance x. From the original experimental data (Fig. 6), we obtained the number of apposed boutons arising from a pyramidal/spiny neuron as a function of horizontal distance x (an average pyramidal/spiny neuron shown as the black neuron in Fig. 8A, top). Within a neuron group, when a neuron on average sends a certain amount of axon boutons onto CTN dendrites in a given volume, depicted as the green rectangular prism in Figure 8A (middle), these CTN dendrites are expected to receive the same amount of axon boutons from each neuron located at the same distance from them in all directions (Fig. 8A, bottom) according to the above three suppositions. Therefore, as shown in Figure 8B, we cut a slice to see a two-dimensional morphological input map; in other words, we obtained i(x, y), which indicates the number of apposed boutons on CTN dendrites in a slender green square prism (1 × 1 μm2 base) by neurons within a cube located at horizontal distance x and normalized vertical location y.
The two-dimensional plot of i(x, y) in Figure 8C revealed that the highest i(x, y) was observed at L4 and the second highest was found at L6a. The ranges of x with high i(x, y) showing statistical significance were x ≤ 40 μm in L4 and x ≤ 60 μm in L6a (Fig. 8C, black lines). This result suggests that L4 and L6a pyramidal/spiny neurons are important local sources of inputs to CTNs and that at least a portion of L4 neurons have a strong impact on the CTNs located in a narrow region underneath these L4 neurons.
Since apposed boutons of L4 neurons targeting the basal dendrites of CTNs were distributed in a very narrow region just below these L4 neurons as shown in Figure 7, the focused L4-to-CTN connections were most likely to be formed between descending axon fibers of L4 neurons and the basal dendrites of CTNs. To evaluate the contribution of these boutons, we recalculated, or simulated, i(x, y) without basal dendrite-targeting L6 boutons originating from L4 neurons. The plot of the simulated i(x, y) in Figure 8D showed that inputs from L4 were greatly decreased compared with those found in Figure 8C, and that the domain associated with statistically significant connections was only found in L6a (Fig. 8D, black line). This result suggests that the strong, focused L4-to-CTN connections are mainly due to the basal dendrite-targeting boutons.
We further calculated inputs from a cylindrical mass of neurons and obtained IL[x1, x2] that represents the number of apposed boutons on CTN dendrites in a slender prism (1 × 1 μm2 base) by the neurons that are classified into each pyramidal/spiny neuron group (L = L2/3, L4, L5a, L5b, L6+, or L6−) and located in the hollow cylinder whose internal and external radii are x1 and x2, respectively (Fig. 9A). Considering the size of the barrel in the posteromedial barrel subfield (<200 μm in radius) (Welker and Woolsey, 1974; Fox, 2008) and the maximum horizontal distance found in our samples (1492 μm), we compared I[0, 200] and I[200, 1500] between the five pyramidal/spiny neuron groups. IL6+[0, 200] was higher than the IL[0, 200] of any other neuron group, while IL6−[200, 1500] displayed larger value than any other IL[200, 1500]. This suggests that CTNs themselves are the most important nearby/columnar source of connections, whereas L6 corticocortical neurons are the most crucial distant/extracolumnar source.
Correlative location of L4 axons and CTN dendritic bundles
The horizontally focused L4-to-CTN connection (Fig. 8) may be organized with certain vertical structures in the cerebral cortex, such as apical dendritic bundles of CTNs. The bundles typically consisted of 2–5 apical dendrites and their interbundle distance was 56 ± 14 μm (mean ± SD, N = 7 slices). IL4[0, 28] and IL6+[0, 28] were significantly higher than those of the other neuron groups (Fig. 9D). This result confirms the importance of L4 neurons as a source of inputs to CTNs within a narrow horizontal range. We further examined the relationship of descending thick axons of L4 neurons with CTN dendritic bundles, compared with those of L2/3 neurons. The thick axons of L4 neurons approached CTN dendritic bundles in the middle of L5 and descended in close association with CTN bundles (Fig. 9F), whereas those of L2/3 neurons descended straight to the white matter and did not come into contact with CTN bundles (Fig. 9E). Consistently, the thick axons of L4 neurons descended at a closer distance (∼7 μm) to the center of the nearest dendritic bundle than axons originating from L2/3 neurons (p = 0.045 by two-tailed t test; Fig. 9G). As the diameter of CTN dendritic bundles was ∼10 μm, the thick axons of L4 neurons ran alongside the bundles (Fig. 9F).
Discussion
Here, we estimated local excitatory inputs to CTNs (Figs. 8, 9) on the basis of the distribution of apposed boutons of cortical pyramidal/spiny neurons to CTNs (Table 2; Fig. 6). L6 CTNs themselves and L4 neurons were the important nearby sources of connections to CTNs, whereas L6 corticocortical neurons were the main distant source within the local (<1500 μm) connections. We further found that CTNs received strong and focused inputs from L4 neurons just above them and that this focused L4-to-CTN connectivity was formed between descending axon fibers of L4 neurons and the basal dendrites of CTNs. (Figs. 7, 8D). These results illustrate which excitatory neurons of the S1 cortical column send information through L6 CTNs to the thalamic compartment corresponding to the column.
Strong local excitatory inputs to L6 CTNs from their own layer were found in previous studies using laser-scanning photostimulation by glutamate uncaging (Zarrinpar and Callaway, 2006; Llano and Sherman, 2009; Lam and Sherman, 2010; Hooks et al., 2011). Because photostimulation with a resolution of 50–75 μm probably would activate several CTNs simultaneously (Hooks et al., 2011), large EPSPs might be evoked in the recorded neuron through dense nearby connections between CTNs. Similar results were obtained by our morphological estimation of inputs to CTNs from neurons in a cube (Fig. 8C) or in a cylindrical volume (Fig. 9D).
The present results further suggest that a small population of L4 neurons located just above a CTN appear to be a main source of connections to this CTN (Fig. 8). Interestingly, a photostimulation study reported a case of strong L4 inputs to a putative L6 CTN [Zarrinpar and Callaway (2006), their Fig. 4A]. Furthermore, a recent multiple whole-cell recording study of the mouse barrel cortex has reported cases of L4-to-L6 connections (3/93 pairs) and has also shown that EPSP amplitudes of these connections are sometimes much larger (0.17, 0.96, and 5.67 mV) than the typical EPSP amplitude in postsynaptic L6 neurons (∼0.2 mV) (Lefort et al., 2009). These large EPSP amplitudes of L4-to-L6 connections might be well represented by the strong, focused L4-to-CTN connection revealed in the present study (Fig. 8C).
Although strong L4-to-L6 connections were found in a few cases in photostimulation and multiple whole-cell recording studies (Zarrinpar and Callaway, 2006; Lefort et al., 2009; Hooks et al., 2011), these previous studies generally showed infrequency of L4-to-L6 excitatory connections (Briggs and Callaway, 2001; Zarrinpar and Callaway, 2006; Lefort et al., 2009; Llano and Sherman, 2009; Lam and Sherman, 2010; Hooks et al., 2011). This seems contradictory to the present findings that strong morphological connections were constantly found from L4 neurons to CTNs. This contradiction might be explained by differences in animal age, species, or cortical area examined, but technical differences should be considered when comparing present and previous methods. We recorded neurons at a deep position from the slice cut surface and plotted the apposed boutons throughout the thickness (500 μm) of the cortical slices. This might be helpful in observing the focused L4-to-CTN connections. On the other hand, in laser-scanning photostimulation and in whole-cell recordings, because neurons near the slice cut surface are preferentially stimulated by laser beams and recorded by patch pipettes, a vertically aligned, focused connection could be found only when the focused connection was set appropriately near the surface of a slice. This may be one of the reasons why strong L4-to-CTN connections have been reported only infrequently by previous photostimulation or multiple whole-cell recording studies.
The presence of strong, focused L4-to-CTN connections raises the possibility that there are functional substructures in a barrel column. In the measurement of i(x, y), the L4 neurons forming strong connections to a portion of CTN dendrites were located within 40 μm in horizontal distance from these CTN dendrites (Figs. 8C, 9D). Recent physiological studies have pointed out that single barrels include several neuronal clusters (∼100 μm in diameter) that contain neurons showing similar preferences for the direction of whisker deflection, suggesting that barrel columns are divided into functional substructures (Bruno et al., 2003; Andermann and Moore, 2006) such as orientation columns in the ocular dominance column of the cat and monkey primary visual cortex (Mountcastle, 1997). One of the potential anatomical substrates of these functional substructures in the barrel column is dendritic bundles, which are commonly found in the mammalian neocortex (Rockland and Ichinohe, 2004). Visualizing CTN dendrites, we observed that CTNs formed apical dendritic bundles (Fig. 9E,F) and that the interbundle interval was 56 ± 14 μm (mean ± SD). Interestingly, this interval was very close to that of dendritic bundles formed by L5 pyramidal neurons in the rat S1 cortex [∼50 μm in the study by Feldman and Peters (1974) and 49 ± 16 μm in the study by Skoglund et al. (2004)]. More interestingly, the thick axons of L4 neurons descended in close proximity with CTN dendritic bundles (Fig. 9F,G), suggesting that L4 neurons around the CTN dendritic bundle focus their descending axons on CTNs forming the dendritic bundle. Because more than half of the dendritic length of CTNs (62.1 ± 8.2%; measured from the present intracellularly labeled samples) was included within a 56 μm radius cylinder around an apical dendritic shaft, both axons of L4 neurons and dendrites of L6 CTNs are arranged in a subcolumnar structure around CTN dendritic bundles.
Previous studies have shown that inactivation of the primary visual (Przybyszewski et al., 2000), auditory (Yan and Suga, 1996), or somatosensory (Yuan et al., 1986) cortices generally decreases thalamic responses to sensory stimuli (Alitto and Usrey, 2003). A recent study has further reported that activation of the barrel column enhances the sensory responses of relay neurons in the corresponding thalamic compartment, or barreloid (Temereanca and Simons, 2004). L6 CTN activation in a barrel column thus has an excitatory/facilitatory influence on the activity of thalamic relay neurons, which transfer peripheral information to the cerebral cortex. The facilitatory cortical control of thalamic activity by a single L6 CTN presumably spreads beyond a single barreloid, because a single L6 CTN in a barrel column spreads its axons throughout the corresponding barreloid (Bourassa et al., 1995) and because the dendrites of barreloid neurons extend into surrounding barreloids [33% on average (Varga et al., 2002)]. Together with these structural and functional properties of CTNs, the local excitatory connections revealed in the present study suggest how finely the barrel column controls the activity of relay neurons in the corresponding barreloid and its surrounding structures (Fig. 10). In recent in vivo juxtacellular recordings and whole-cell recordings, it has been revealed that a single whisker deflection activates only a small fraction of L4 neurons (Brecht and Sakmann, 2002; de Kock et al., 2007), which are most likely organized into subcolumnar structures (Bruno et al., 2003; Andermann and Moore, 2006). When L4 neurons in a subcolumnar structure are activated, a limited number of CTNs therein might be activated via focused L4-to-CTN connections. Because a CTN at least innervates the whole extent of the corresponding barreloid (Bourassa et al., 1995; Varga et al., 2002), the subcolumnar structures might provide thalamic relay neurons with an additive or summative enhancement mechanism. In other words, when CTNs in several subcolumnar structures are activated in a barrel column, the activity of relay neurons in the corresponding barreloid might be facilitated in a finely additive manner that depends on the number of subcolumnar structures containing activated CTNs. With this additive mechanism, even on a weak, limited sensory input, the barrel cortex could provide a commensurate strength of excitatory/facilitatory feedback to all relay neurons in the corresponding barreloid, and finely control the thalamic activity to efficiently transfer information from the corresponding whisker to the cortex.
Figure 10.
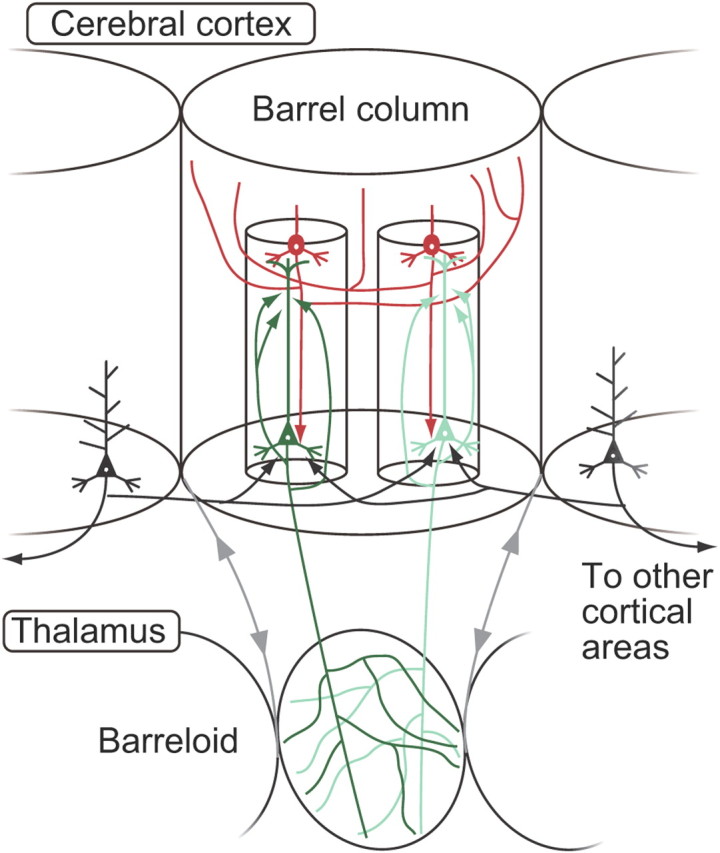
Anatomical organization of local excitatory connections to L6 CTNs and its relationship to thalamic barreloid. Within a barrel column, the L6 CTNs receive strong, focused connections from L4 neurons located just above them (red). L6 CTNs have dense recurrent connections of a subcolumnar size within themselves (green), whereas L6 corticocortical neurons provide CTNs with a considerable amount of horizontal connection beyond the barrel column (black). The projecting axons of L6 CTNs spread out in the corresponding thalamic compartment (barreloid) and thus show a multitude of overlaps within the barreloid.
In conclusion, we have shown a detailed map of local excitatory inputs to L6 CTNs based on the morphological data. The data indicate that L4 pyramidal/spiny neurons have an important role in shaping the cortical modulation of thalamic relay neurons through CTNs. To examine whether local connectivity actually functions as discussed above, it will be of primary importance to explore the dynamics of neurons in the thalamocortical reciprocal circuit in alert animals.
Footnotes
This work was supported by The Ministry of Education, Culture, Sports, Science and Technology of Japan (T.K., Grants 22300113, 23650175, 23115101; H.H, 18700341; Y.R.T., 08J03974). We are grateful to Mr. H. Kohda for technical assistance in electron microscopy; to Drs. Ryohei Tomioka and Nobuaki Tamamaki for advice on the production of adenovirus; and to Drs. Shuzo Sakata and Roberto Gavinio for comments on the manuscript.
References
- Alitto HJ, Usrey WM. Corticothalamic feedback and sensory processing. Curr Opin Neurobiol. 2003;13:440–445. doi: 10.1016/s0959-4388(03)00096-5. [DOI] [PubMed] [Google Scholar]
- Andermann ML, Moore CI. A somatotopic map of vibrissa motion direction within a barrel column. Nat Neurosci. 2006;9:543–551. doi: 10.1038/nn1671. [DOI] [PubMed] [Google Scholar]
- Bourassa J, Pinault D, Deschênes M. Corticothalamic projections from the cortical barrel field to the somatosensory thalamus in rats: a single-fibre study using biocytin as an anterograde tracer. Eur J Neurosci. 1995;7:19–30. doi: 10.1111/j.1460-9568.1995.tb01016.x. [DOI] [PubMed] [Google Scholar]
- Brecht M, Sakmann B. Dynamic representation of whisker deflection by synaptic potentials in spiny stellate and pyramidal cells in the barrels and septa of layer 4 rat somatosensory cortex. J Physiol. 2002;543:49–70. doi: 10.1113/jphysiol.2002.018465. [DOI] [PMC free article] [PubMed] [Google Scholar]
- Briggs F, Callaway EM. Layer-specific input to distinct cell types in layer 6 of monkey primary visual cortex. J Neurosci. 2001;21:3600–3608. doi: 10.1523/JNEUROSCI.21-10-03600.2001. [DOI] [PMC free article] [PubMed] [Google Scholar]
- Brumberg JC, Hamzei-Sichani F, Yuste R. Morphological and physiological characterization of layer VI corticofugal neurons of mouse primary visual cortex. J Neurophysiol. 2003;89:2854–2867. doi: 10.1152/jn.01051.2002. [DOI] [PubMed] [Google Scholar]
- Bruno RM, Khatri V, Land PW, Simons DJ. Thalamocortical angular tuning domains within individual barrels of rat somatosensory cortex. J Neurosci. 2003;23:9565–9574. doi: 10.1523/JNEUROSCI.23-29-09565.2003. [DOI] [PMC free article] [PubMed] [Google Scholar]
- Cho RH, Segawa S, Mizuno A, Kaneko T. Intracellularly labeled pyramidal neurons in the cortical areas projecting to the spinal cord. I. Electrophysiological properties of pyramidal neurons. Neurosci Res. 2004a;50:381–394. doi: 10.1016/j.neures.2004.08.006. [DOI] [PubMed] [Google Scholar]
- Cho RH, Segawa S, Okamoto K, Mizuno A, Kaneko T. Intracellularly labeled pyramidal neurons in the cortical areas projecting to the spinal cord. II. Intra- and juxta-columnar projection of pyramidal neurons to corticospinal neurons. Neurosci Res. 2004b;50:395–410. doi: 10.1016/j.neures.2004.08.007. [DOI] [PubMed] [Google Scholar]
- de Kock CP, Bruno RM, Spors H, Sakmann B. Layer- and cell-type-specific suprathreshold stimulus representation in rat primary somatosensory cortex. J Physiol. 2007;581:139–154. doi: 10.1113/jphysiol.2006.124321. [DOI] [PMC free article] [PubMed] [Google Scholar]
- Deschênes M, Veinante P, Zhang ZW. The organization of corticothalamic projections: reciprocity versus parity. Brain Res Brain Res Rev. 1998;28:286–308. doi: 10.1016/s0165-0173(98)00017-4. [DOI] [PubMed] [Google Scholar]
- Douglas R, Markram H, Martin K. Neocortex. In: Sherherd GM., editor. The synaptic organization of the brain. Ed 5. New York: Oxford UP; 2004. pp. 499–558. [Google Scholar]
- Feldman ML, Peters A. A study of barrels and pyramidal dendritic clusters in the cerebral cortex. Brain Res. 1974;77:55–76. doi: 10.1016/0006-8993(74)90804-x. [DOI] [PubMed] [Google Scholar]
- Fox K. Barrel cortex. New York: Cambridge UP; 2008. [Google Scholar]
- Furuta T, Kaneko T, Deschênes M. Septal neurons in barrel cortex derive their receptive field input from the lemniscal pathway. J Neurosci. 2009;29:4089–4095. doi: 10.1523/JNEUROSCI.5393-08.2009. [DOI] [PMC free article] [PubMed] [Google Scholar]
- Harper JF. Peritz' F test: basic program of a robust multiple comparison test for statistical analysis of all differences among group means. Comput Biol Med. 1984;14:437–445. doi: 10.1016/0010-4825(84)90044-1. [DOI] [PubMed] [Google Scholar]
- Hioki H, Kameda H, Nakamura H, Okunomiya T, Ohira K, Nakamura K, Kuroda M, Furuta T, Kaneko T. Efficient gene transduction of neurons by lentivirus with enhanced neuron-specific promoters. Gene Ther. 2007;14:872–882. doi: 10.1038/sj.gt.3302924. [DOI] [PubMed] [Google Scholar]
- Hooks BM, Hires SA, Zhang YX, Huber D, Petreanu L, Svoboda K, Shepherd GM. Laminar analysis of excitatory local circuits in vibrissal motor and sensory cortical areas. PLoS Biol. 2011;9:e1000572. doi: 10.1371/journal.pbio.1000572. [DOI] [PMC free article] [PubMed] [Google Scholar]
- Howard CV, Reed MG. Unbiased stereology: three-dimensional measurement in microscopy. Oxford: Bios Scientific Publishers; 1998. [Google Scholar]
- Jones EG. Laminar distribution of cortical efferent cells. In: Peters A, Jones EG, editors. Cellular components of cerebral cortex. New York: Plenum; 1984. pp. 521–553. [Google Scholar]
- Kameda H, Furuta T, Matsuda W, Ohira K, Nakamura K, Hioki H, Kaneko T. Targeting green fluorescent protein to dendritic membrane in central neurons. Neurosci Res. 2008;61:79–91. doi: 10.1016/j.neures.2008.01.014. [DOI] [PubMed] [Google Scholar]
- Kaneko T, Kang Y, Mizuno N. Glutaminase-positive and glutaminase-negative pyramidal cells in layer VI of the primary motor and somatosensory cortices: a combined analysis by intracellular staining and immunocytochemistry in the rat. J Neurosci. 1995;15:8362–8377. doi: 10.1523/JNEUROSCI.15-12-08362.1995. [DOI] [PMC free article] [PubMed] [Google Scholar]
- Kaneko T, Cho R, Li Y, Nomura S, Mizuno N. Predominant information transfer from layer III pyramidal neurons to corticospinal neurons. J Comp Neurol. 2000;423:52–65. doi: 10.1002/1096-9861(20000717)423:1<52::aid-cne5>3.0.co;2-f. [DOI] [PubMed] [Google Scholar]
- Killackey HP, Sherman SM. Corticothalamic projections from the rat primary somatosensory cortex. J Neurosci. 2003;23:7381–7384. doi: 10.1523/JNEUROSCI.23-19-07381.2003. [DOI] [PMC free article] [PubMed] [Google Scholar]
- Kumar P, Ohana O. Inter- and intralaminar subcircuits of excitatory and inhibitory neurons in layer 6a of the rat barrel cortex. J Neurophysiol. 2008;100:1909–1922. doi: 10.1152/jn.90684.2008. [DOI] [PubMed] [Google Scholar]
- Kuramoto E, Fujiyama F, Unzai T, Nakamura K, Hioki H, Furuta T, Shigemoto R, Ferraguti F, Kaneko T. Metabotropic glutamate receptor 4-immunopositive terminals of medium-sized spiny neurons selectively form synapses with cholinergic interneurons in the rat neostriatum. J Comp Neurol. 2007;500:908–922. doi: 10.1002/cne.21216. [DOI] [PubMed] [Google Scholar]
- Kuramoto E, Furuta T, Nakamura KC, Unzai T, Hioki H, Kaneko T. Two types of thalamocortical projections from the motor thalamic nuclei of the rat: a single neuron-tracing study using viral vectors. Cereb Cortex. 2009;19:2065–2077. doi: 10.1093/cercor/bhn231. [DOI] [PubMed] [Google Scholar]
- Lam YW, Sherman SM. Functional organization of the somatosensory cortical layer 6 feedback to the thalamus. Cereb Cortex. 2010;20:13–24. doi: 10.1093/cercor/bhp077. [DOI] [PMC free article] [PubMed] [Google Scholar]
- Ledergerber D, Larkum ME. Properties of layer 6 pyramidal neuron apical dendrites. J Neurosci. 2010;30:13031–13044. doi: 10.1523/JNEUROSCI.2254-10.2010. [DOI] [PMC free article] [PubMed] [Google Scholar]
- Lefort S, Tomm C, Floyd Sarria JC, Petersen CC. The excitatory neuronal network of the C2 barrel column in mouse primary somatosensory cortex. Neuron. 2009;61:301–316. doi: 10.1016/j.neuron.2008.12.020. [DOI] [PubMed] [Google Scholar]
- Llano DA, Sherman SM. Differences in intrinsic properties and local network connectivity of identified layer 5 and layer 6 adult mouse auditory corticothalamic neurons support a dual corticothalamic projection hypothesis. Cereb Cortex. 2009;19:2810–2826. doi: 10.1093/cercor/bhp050. [DOI] [PMC free article] [PubMed] [Google Scholar]
- Lorente de Nó R. Architectonics and the structure of the cerebral cortex. In: Fulton JF, editor. Physiology of the nervous system. New York: Oxford UP; 1938. pp. 291–330. [Google Scholar]
- Markram H, Lubke J, Frotscher M, Roth A, Sakmann B. Physiology and anatomy of synaptic connections between thick tufted pyramidal neurones in the developing rat neocortex. J Physiol. 1997;500:409–440. doi: 10.1113/jphysiol.1997.sp022031. [DOI] [PMC free article] [PubMed] [Google Scholar]
- Mel BW. Why have dendrites? A computational perspective. In: Stuart G, Spruston N, Häusser M, editors. Dendrites. Ed 2. New York: Oxford UP; 2008. pp. 421–440. [Google Scholar]
- Mercer A, West DC, Morris OT, Kirchhecker S, Kerkhoff JE, Thomson AM. Excitatory connections made by presynaptic cortico-cortical pyramidal cells in layer 6 of the neocortex. Cereb Cortex. 2005;15:1485–1496. doi: 10.1093/cercor/bhi027. [DOI] [PubMed] [Google Scholar]
- Mountcastle VB. The columnar organization of the neocortex. Brain. 1997;120:701–722. doi: 10.1093/brain/120.4.701. [DOI] [PubMed] [Google Scholar]
- Nakamura K, Watakabe A, Hioki H, Fujiyama F, Tanaka Y, Yamamori T, Kaneko T. Transiently increased colocalization of vesicular glutamate transporters 1 and 2 at single axon terminals during postnatal development of mouse neocortex: a quantitative analysis with correlation coefficient. Eur J Neurosci. 2007;26:3054–3067. doi: 10.1111/j.1460-9568.2007.05868.x. [DOI] [PubMed] [Google Scholar]
- Nakamura KC, Kameda H, Koshimizu Y, Yanagawa Y, Kaneko T. Production and histological application of affinity-purified antibodies to heat-denatured green fluorescent protein. J Histochem Cytochem. 2008;56:647–657. doi: 10.1369/jhc.2008.950915. [DOI] [PMC free article] [PubMed] [Google Scholar]
- Przybyszewski AW, Gaska JP, Foote W, Pollen DA. Striate cortex increases contrast gain of macaque LGN neurons. Vis Neurosci. 2000;17:485–494. doi: 10.1017/s0952523800174012. [DOI] [PubMed] [Google Scholar]
- Rockland KS, Ichinohe N. Some thoughts on cortical minicolumns. Exp Brain Res. 2004;158:265–277. doi: 10.1007/s00221-004-2024-9. [DOI] [PubMed] [Google Scholar]
- Schubert D, Kötter R, Luhmann HJ, Staiger JF. Morphology, electrophysiology and functional input connectivity of pyramidal neurons characterizes a genuine layer va in the primary somatosensory cortex. Cereb Cortex. 2006;16:223–236. doi: 10.1093/cercor/bhi100. [DOI] [PubMed] [Google Scholar]
- Schwarz G. Estimating the dimension of a model. Ann Statist. 1978;6:461–464. [Google Scholar]
- Sherman SM, Guillery RW. Exploring the thalamus and its role in cortical function. Ed 2. Cambridge, MA: MIT press; 2006. [Google Scholar]
- Shipp S. Structure and function of the cerebral cortex. Curr Biol. 2007;17:R443–R449. doi: 10.1016/j.cub.2007.03.044. [DOI] [PubMed] [Google Scholar]
- Sjöström PJ, Rancz EA, Roth A, Häusser M. Dendritic excitability and synaptic plasticity. Physiol Rev. 2008;88:769–840. doi: 10.1152/physrev.00016.2007. [DOI] [PubMed] [Google Scholar]
- Skoglund TS, Pascher R, Berthold CH. Aspects of the organization of neurons and dendritic bundles in primary somatosensory cortex of the rat. Neurosci Res. 2004;50:189–198. doi: 10.1016/j.neures.2004.06.017. [DOI] [PubMed] [Google Scholar]
- Tamamaki N, Nakamura K, Furuta T, Asamoto K, Kaneko T. Neurons in Golgi-stain-like images revealed by GFP-adenovirus infection in vivo. Neurosci Res. 2000;38:231–236. doi: 10.1016/s0168-0102(00)00176-0. [DOI] [PubMed] [Google Scholar]
- Tanaka Y, Tanaka Y, Furuta T, Yanagawa Y, Kaneko T. The effects of cutting solutions on the viability of GABAergic interneurons in cerebral cortical slices of adult mice. J Neurosci Methods. 2008;171:118–125. doi: 10.1016/j.jneumeth.2008.02.021. [DOI] [PubMed] [Google Scholar]
- Temereanca S, Simons DJ. Functional topography of corticothalamic feedback enhances thalamic spatial response tuning in the somatosensory whisker/barrel system. Neuron. 2004;41:639–651. doi: 10.1016/s0896-6273(04)00046-7. [DOI] [PubMed] [Google Scholar]
- Thomson AM. Neocortical layer 6, a review. Front Neuroanat. 2010;4:13. doi: 10.3389/fnana.2010.00013. [DOI] [PMC free article] [PubMed] [Google Scholar]
- Tomioka R, Rockland KS. Improved Golgi-like visualization in retrogradely projecting neurons after EGFP-adenovirus infection in adult rat and monkey. J Histochem Cytochem. 2006;54:539–548. doi: 10.1369/jhc.5A6838.2005. [DOI] [PubMed] [Google Scholar]
- Valverde F, Facal-Valverde MV, Santacana M, Heredia M. Development and differentiation of early generated cells of sublayer VIb in the somatosensory cortex of the rat: a correlated Golgi and autoradiographic study. J Comp Neurol. 1989;290:118–140. doi: 10.1002/cne.902900108. [DOI] [PubMed] [Google Scholar]
- Varga C, Sík A, Lavallée P, Deschênes M. Dendroarchitecture of relay cells in thalamic barreloids: a substrate for cross-whisker modulation. J Neurosci. 2002;22:6186–6194. doi: 10.1523/JNEUROSCI.22-14-06186.2002. [DOI] [PMC free article] [PubMed] [Google Scholar]
- Welker C, Woolsey TA. Structure of layer IV in the somatosensory neocortex of the rat: description and comparison with the mouse. J Comp Neurol. 1974;158:437–453. doi: 10.1002/cne.901580405. [DOI] [PubMed] [Google Scholar]
- West DC, Mercer A, Kirchhecker S, Morris OT, Thomson AM. Layer 6 cortico-thalamic pyramidal cells preferentially innervate interneurons and generate facilitating EPSPs. Cereb Cortex. 2006;16:200–211. doi: 10.1093/cercor/bhi098. [DOI] [PubMed] [Google Scholar]
- Yan J, Suga N. Corticofugal modulation of time-domain processing of biosonar information in bats. Science. 1996;273:1100–1103. doi: 10.1126/science.273.5278.1100. [DOI] [PubMed] [Google Scholar]
- Yuan B, Morrow TJ, Casey KL. Corticofugal influences of S1 cortex on ventrobasal thalamic neurons in the awake rat. J Neurosci. 1986;6:3611–3617. doi: 10.1523/JNEUROSCI.06-12-03611.1986. [DOI] [PMC free article] [PubMed] [Google Scholar]
- Zarrinpar A, Callaway EM. Local connections to specific types of layer 6 neurons in the rat visual cortex. J Neurophysiol. 2006;95:1751–1761. doi: 10.1152/jn.00974.2005. [DOI] [PubMed] [Google Scholar]
- Zhang ZW, Deschênes M. Intracortical axonal projections of lamina VI cells of the primary somatosensory cortex in the rat: a single-cell labeling study. J Neurosci. 1997;17:6365–6379. doi: 10.1523/JNEUROSCI.17-16-06365.1997. [DOI] [PMC free article] [PubMed] [Google Scholar]
- Zufferey R, Donello JE, Trono D, Hope TJ. Woodchuck hepatitis virus posttranscriptional regulatory element enhances expression of transgenes delivered by retroviral vectors. J Virol. 1999;73:2886–2892. doi: 10.1128/jvi.73.4.2886-2892.1999. [DOI] [PMC free article] [PubMed] [Google Scholar]