

Abstract
Melatonin activates two brain G-protein coupled receptors, MT1 and MT2, whose differential roles in the sleep–wake cycle remain to be defined. The novel MT2 receptor partial agonist, N-{2-[(3-methoxyphenyl) phenylamino] ethyl} acetamide (UCM765), is here shown to selectively promote non-rapid eye movement sleep (NREMS) in rats and mice. The enhancement of NREMS by UCM765 is nullified by the pharmacological blockade or genetic deletion of MT2 receptors. MT2, but not MT1, knock-out mice show a decrease in NREMS compared to the wild strain. Immunohistochemical labeling reveals that MT2 receptors are localized in sleep-related brain regions, and notably the reticular thalamic nucleus (Rt). Microinfusion of UCM765 in the Rt promotes NREMS, and its systemic administration induces an increase in firing and rhythmic burst activity of Rt neurons, which is blocked by the MT2 antagonist 4-phenyl-2-propionamidotetralin. Since developing hypnotics that increase NREMS without altering sleep architecture remains a medical challenge, MT2 receptors may represent a novel target for the treatment of sleep disorders.
Introduction
Insomnia is a common public health problem, with a prevalence ranging from 11 to 16% (Leland, 2006; Morin et al., 2006). In mammals, normal sleep is characterized by an orderly progression from wakefulness to non-rapid eye movement sleep (NREMS), also referred to as slow-wave sleep (SWS), and then to paradoxical sleep or rapid eye movement sleep (REMS). SWS is also known as “restorative sleep” since it is involved in memory consolidation (Stickgold, 2005; Marshall et al., 2006) and metabolic regulation (Tasali et al., 2008).
Currently used hypnotic drugs, such as benzodiazepines (BZ) and derivates (i.e., zopiclone), act on the GABAergic system, affecting both NREMS and REMS, thus altering sleep architecture (Lancel, 1999). Most of them induce next-day cognitive impairments and abuse liability. Antidepressants also alter REMS density, but with little or no effect on SWS (Mayers and Baldwin, 2005). Developing new effective hypnotic drugs selectively increasing NREMS without altering the whole sleep architecture therefore remains a scientific and medical challenge.
Melatonin (N-acetyl-5-methoxytryptamine; MLT), synthesized by the pineal gland, has been reported to have hypnotic effects in humans, although results are still controversial (Brzezinski et al., 2005; Buscemi et al., 2006). Animal studies have demonstrated that MLT reduces time to sleep onset and increases both NREMS and REMS (Holmes and Sugden, 1982; Mirmiran and Pevet, 1986), with both effects being blocked by the GABAA receptor antagonists flumazenil and picrotoxin (Wang et al., 2003a). Other studies showed little or no effect (Mailliet et al., 2001; Wang et al., 2003b).
The physiological actions of MLT in brain are mediated by two high-affinity G-protein-coupled receptors, MT1 and MT2, whose respective roles in sleep remain to be defined. Three novel nonselective MT1/MT2 agonists, TIK-301 (Zemlan et al., 2005), ramelteon (Mini et al., 2007), and tasimelteon (Rajaratnam et al., 2009), have been tested in humans for the treatment of insomnia; all three significantly reduced the latency to sleep, but were less potent in potentiating the long-term enhancement of total sleep time and without selectivity toward NREMS or REMS. The nonselective antidepressant MT1/MT2 agonist agomelatine improves sleep after 6 weeks of treatment (Quera Salva et al., 2007), but its mechanisms of action remain to be elucidated, as it also binds to serotonergic 5-HT2B and 5-HT2C receptors, already known to be involved in sleep (Den Boer et al., 2006). Considering their lack of selectivity, none of the above compounds allow for a selective pharmacological investigation of the role of brain MT1 and MT2 melatonin receptors.
In the present study, we examine the effects of the partial MT2 receptor agonist N-{2-[(3-methoxyphenyl) phenylamino] ethyl} acetamide (UCM765) (Rivara et al., 2007) on the sleep–wake cycle of rats and that of mice lacking MT1 or MT2 receptors, disclosing a selective NREMS promoting effect of UCM765. In addition, having found MT2 receptors to be abundant in the reticular thalamic nucleus (Rt), we combined extracellular recording in anesthetized rats, as well as bilateral intrathalamic microinfusion and EEG/EMG recording in freely moving rats, to demonstrate that UCM765 induces NREMS by modulating the electrical activity of Rt.
Materials and Methods
All experimental procedures were conducted in accordance with the guidelines of the Canadian Council on Animal Care, and the protocols were approved by the Animal Care Committee at McGill University.
Monitoring of the sleep–wake cycle.
These experiments were performed in adult male Sprague Dawley rats (225–340 g; Charles River Laboratories), adult male C3H/He wild-type (WT) mice (28–35 g; Charles River Laboratories), and mice of the same genetic background lacking MT1 (Liu et al., 1997) or MT2 receptors (Jin et al., 2003), kindly provided by Drs. Weaver and Reppert (University of Massachusetts, Worcester, MA). The knock-out (KO) mice were originally derived from a 129/sv KO mouse bred to a C3H female; heterozygous males from each generation were backcrossed exclusively to C3H females (10 generations and more of backcrossing), and male and female heterozygous were interbred to produce C3H WT and KO mice on the C3H background (Jin et al., 2003).
All animals were housed in small groups at 22°C, with ad libitum access to food and water, and maintained under a 12 h light/dark cycle (lights on at 7:30 AM; lights off at 7:30 P.M.). They were housed in separate cages after surgery.
Surgery.
Rats and mice were deeply anesthetized with equithesin (1 ml per 300 g, i.p.) and placed in a stereotaxic frame. For EEG monitoring, three stainless-steel epidural electrodes were positioned through 1.5 mm burr holes: one over the parietal cortex on each side, and the third (as a reference) in the right parietal cortex. In rats, their respective locations relative to bregma were −2 mm anteroposterior (AP) and −3 mm lateral (L), −7 mm AP and −3 mm L, and −4.5 mm AP and +3 mm L, according to Paxinos and Watson (2006). In mice, their respective locations relative to bregma were −0.95 mm AP and −2 mm L, −2.85 mm AP and −2 mm L, and −1.9 mm and +2 mm L, according to Franklin and Paxinos (1997). To monitor EMG signals, three flexible stainless-steel wire electrodes, isolated except for the last 3–4 mm, were implanted into the neck muscles (two bilaterally and one in the middle). Wires and connector were fixed to the skull with dental acrylic (Coltene/Whaledent).
After 24 h of recovery and during the next 5 d, the rats or mice were placed in a recording chamber and connected to a flexible cable for several hours daily, to habituate before the recording of sleep parameters.
EEG and EMG data analysis.
EEG/EMG signals were amplified at a total gain of 10.000 and filtered locally (EEG, low filter, 1 Hz; high, 1 kHz; EMG, low filter, 30 Hz; high, 3 kHz; Grass, P55), digitized using a CED power 1401 converter and Spike 2 software (CED) (Urbain et al., 2006), stored with a resolution of 128 Hz, and displayed on a PC monitor. Consecutive 2 s epochs were subjected to a fast Fourier transform (FFT), and EEG power spectra density was computed in the frequency range of 0–64 Hz.
The three classical vigilance states as described in the rat were discriminated on the basis of the cortical EEG and neck EMG (Jones, 2005). Wakefulness was identified by a low-amplitude and desynchronized EEG, with sustained EMG activity. NREMS was clearly distinguished by high-voltage delta waves (1–4 Hz) and spindles associated with a weak EMG activity. REMS was characterized by a low-amplitude EEG with a pronounced theta rhythm (6–11 Hz) and a complete loss of nuchal muscle tone. To avoid transitional periods such as drowsiness, only periods of typical stationary EEG and EMG lasting at least 10 s were considered for further analyses of wakefulness, NREMS, and REMS.
The latency to NREMS was defined as the time from the first injection (6:00 P.M.) of vehicle, UCM765, N-{2-[(3-methoxyphenyl)methylamino]ethyl} acetamide (UCM793), or diazepam (DZ) to the first NREMS episode longer than 2 min. The latency to REMS was the time from the first injection to the first episode of REMS lasting >10 s. Power spectra of the corresponding EEGs were then calculated by using the FFT of each 10 s epoch. Power in the 0–25 Hz range of artifact-free epoch was averaged, and the mean values were plotted in 0.5 Hz bins.
To determine the variations in power spectra induced by the pharmacological treatment or MLT receptor genetic deletion, the power densities were summed over the frequency band of 0–25 Hz (total power). The data were then standardized by expressing all power spectral densities at the different 0.5 Hz bin frequency ranges (delta, theta, sigma, and beta) as a percentage relative to the total power of the same epoch [modified from the study by Parmentier et al. (2002)]. Frequency ranges for sigma and beta bands were 11–15 and 15–18 Hz, respectively. Spindle-wave episodes (group of rhythmic waves characterized by a progressive increasing then decreasing amplitude, with activity between 10 and 14 Hz) were readily detected after bandpass filtering of the EEG at frequencies between 10 and 15 Hz (Espinosa et al., 2008). Spindles were counted manually in 1 s epochs within all NREMS episodes lasting >2 min, using Spike2 software.
Pharmacological treatments.
For experiments in which the EEG and EMG were recorded from 6:00 to 9:00 P.M., vehicle (DMSO 70% and 30% saline, 0.2 ml for rats, 0.1 ml for mice), DZ (2 mg/kg), UCM765 (40 mg/kg), UCM793 (40, 60, or 80 mg/kg), or the MT2 antagonist 4-phenyl-2-propionamidotetralin (4P-PDOT; 10 mg/kg) were injected subcutaneously at the beginning of the recording period. For 24 h experiments with UCM765 at different doses, 20, 40, or 60 mg/kg was injected subcutaneously every 4 h, starting at 6:00 P.M. For comparison with DZ, 40 mg/kg UCM765 was injected subcutaneously every 4 h starting at 6:00 P.M., whereas a sleep promoting dose of DZ [2 mg/kg (Gottesmann et al., 1998)], was injected subcutaneously at 6:00 P.M. and 6:00 A.M., given the long, 6–8 h half-life of DZ. Vehicle was then injected at 10:00 P.M., 2:00 A.M., 10:00 A.M., and 2:00 P.M. to mimic the sequence of UCM765 injection.
Immunolabeling of MT2 receptors.
Polyclonal anti-MT2 antibodies were produced as described previously (Angeloni et al., 2000) and affinity purified. In preliminary immunohistochemical experiments on brain tissue from wild-type and MT2 KO mice, only ubiquitous, nonspecific staining of neurons and glial cells was observed (results not shown), precluding the use of these antibodies in this species. Sequence alignment between human and rat MT2 proteins was suggestive of interspecies conservation of an immunogenic epitope (see Fig. 5, top left). In Western blots of rat brain regions (Angeloni et al., 2000), the antibodies reacted with a band of ∼40 kDa, corresponding to the predicted molecular weight of the native MT2 receptor protein (see Fig. 5, top right).
Figure 5.

Light microscopic visualization of MT2 receptor immunoreactivity. Top left, Alignment between human and rat MT2 protein sequences, and Western blots performed on homogenates from hippocampus (Hi), Harderian gland (HG; negative control), septum (S), and hypothalamus (Hy). Polyclonal anti-MT2 receptor antibodies decorate a doublet of ∼40 kDa corresponding to the MT2 receptor. A–I, Particular aspects of the anatomical distribution of the MT2 receptor immunoreactivity in adult rat brain. A–E, Low- (A) and higher-magnification pictures (B–E) of the somatodendritic MT2 receptor labeling in Rt. A corresponds to the middle rostrocaudal level across the nucleus (outlined) at which electrophysiological recordings and microinjections were made. Note the lack of immunoreactivity in adjacent thalamic nuclei, and notably in the ventral posterolateral thalamic nucleus (VPL). B, C, The neuronal MT2 labeling in the rostral (B) and the caudal (C) thirds of Rt (outlined). D is within the middle third of Rt and illustrates the somatodendritic nature of MT2 immunoreactivity. E is from a similar area as D in a section counterstained with cresyl violet. As exemplified at arrows, all Rt neurons are MT2 immunoreactive. F–I, Other brain regions displaying MT2 immunoreactivity: dorsal hippocampus (F), red nucleus (R) and substantia nigra reticulata (SNR) (G), supraoptic nucleus (H), and suprachiasmatic nucleus (I). Scale bars: A, C, F–I, 250 μm; D, E, 50 μm. 3V, Third ventricle; AVVL, anteroventral, ventrolateral thalamic nucleus; CA1, CA2, CA3, Ammon's horn sectors; DG, dentate gyrus; ic, internal capsule; ox, optic chiasma.
Adult male Sprague Dawley rats (250 ± 50 g; n = 5) were deeply anesthetized with sodium pentobarbital (80 mg/kg, i.p.) and perfused through the heart with 200 ml of fixative solution [4% paraformaldehyde (PFA) and 0.25% acrolein in 0.1 mm phosphate buffer (PB), pH 7.4] followed by 500 ml of 4% PFA in PB. The brain was removed, postfixed in 4% PFA (60 min, 4°C), and washed in PBS (0.9% NaCl in 50 mm PB, pH 7.4). Sections (50 μm thick) were cut with a vibratome and processed free floating for immunoperoxidase labeling as follows. Sections were immersed in 3% hydrogen peroxide (H2O2) for 30 min, rinsed in PBS, immersed in 0.1% sodium borohydride in PBS for 30 min, rinsed in PBS, and preincubated for 2 h in a blocking solution (BS) of PBS containing 10% normal goat serum (Vector Laboratories), 0.5% gelatin, 0.01% BSA, and 0.3% Triton X-100. Sections were then washed in PBS, incubated overnight with MT2 antibody (1:250 in BS), rinsed in PBS, incubated for 2 h with biotinylated goat anti-rabbit IgGs 1:1000 in BS (Jackson ImmunoResearch), and incubated for 1 h in a 1:1000 dilution of horseradish peroxidase-conjugated streptavidin (Jackson ImmunoResearch). After washes in 0.05 mm Tris-buffered saline (TBS), pH 7.4, MT2 labeling was revealed 2–5 min in TBS containing 0.05% 3,3-diaminobenzidine tetrahydrochloride and 0.01% H2O2. The reaction was stopped in TBS. Sections were then air dried on gelatin-coated slides, dehydrated in ethanol, cleared in toluene, and mounted with DPX (Fluka; Sigma-Aldrich). Immunohistochemical controls included omission of the primary antibody (n = 2) and preincubation of the anti-MT2 antibody with a 100-fold excess of its blocking peptide (n = 2), which both completely prevented any immunostaining (data not shown).
In four other rats, sections across the thalamus, collected at 50 μm intervals, were similarly processed for MT2 immunohistochemistry and counterstained with cresyl violet, and the Rt nucleus carefully examined by light microscopy at relatively high magnification (40× objective).
Extracellular recording of reticular thalamic neurons.
Each adult male Sprague Dawley rat, anesthetized with urethane (1 g/kg, i.p.), was placed in a stereotaxic frame (David Kopf Instruments) and a catheter was inserted into a tail vein for systemic drug administration. Single-barreled glass micropipettes (R&D Scientific Glass; tip diameter, 2–3 μm) filled with 2% pontamine sky blue dye in sodium acetate (2 m, pH 7.5; electrode impedance, 5–10 MΩ) were used for extracellular recording. A burr hole was drilled and the micropipette lowered into the Rt at the following stereotaxic coordinates: −2.56 mm AP, −3.5 mm L, and 5.0–6.5 mm ventral relative to bregma (Paxinos and Watson, 2006).
Filtered (AC, 0.2–2 kHz) electrode signal was amplified (Bak Electronics Model RP-I) and fed to an oscilloscope (BK Precision; 20 MHz, 1522) and an audio monitor. Spike shapes were digitalized by a CED 1401 interface system, processed on-line, and analyzed off-line by Spike 2 software, in parallel with analog-to-digital samplings of amplified (Grass, P55) polygraphic signals (EEG; sampling rate, 100 or 200 Hz). Single-unit activity was isolated with an amplitude spike discriminator. Rt neurons were recognized by their long burst (>50 ms) and accelerando-decelerando bursting firing pattern (Fuentealba et al., 2004), followed by tonic tail (Domich et al., 1986). Firing and burst neuronal activity was analyzed with Spike 2 software for 3 min periods for each treatment: basal, vehicle [propylene glycol (PG), saline 50%, 0.1 ml], and UCM765 (20 mg/kg). The burst of Rt cells consisted of a discharge of at least four spikes (Contreras et al., 1993), with an onset defined by a maximum interspike interval ≤20 ms and a preburst and postburst interval >100 ms (Domich et al., 1986). The longest interval allowed within a burst was 70 ms to include the tonic tail, which is merely the end of a spike barrage (Domich et al., 1986).
Combined extracellular recording and intrathalamic microinfusion.
In six rats anesthetized with urethane (1 g/kg, i.p.), a Hamilton syringe (24 gauge) was lowered at an angle of 29° from the vertical axis into the Rt, and 5.5 mm ventral from the brain surface. Vehicle (PG–saline 50%; 10 μl) was slowly infused, and immediately after, an electrode was positioned into the Rt for in vivo electrophysiological recording of Rt neurons. Once a stable firing Rt neuron was found, baseline activity was recorded for 1–5 min, and then vehicle (0.1 ml, i.v.) was injected and the neuronal activity recorded for an additional 3–5 min. Afterward, UCM765 (20 mg/kg, i.v) was injected, and the firing activity recorded for 3–5 min. The entire procedure did not last longer than 30 min.
In six other rats, 4P-PDOT (10 μg in 10 μl) was directly injected into Rt with the Hamilton syringe, and the baseline activity of a single Rt neuron as well as its activity after vehicle and UCM765 injection were recorded as above.
Bilateral intrathalamic microinfusion and EEG/EMG recording in freely moving rats.
Rats were deeply anesthetized with equithesin (1 ml per 300 g, i.p.) and placed in a stereotaxic frame. Two stainless-steel guide cannulas (23 gauge, 12 mm) were implanted bilaterally into the Rt at stereotaxic coordinates −2.56 mm AP, +3.5/−3.5 mm L, and 5 mm ventral relative to bregma (Paxinos and Watson, 2006). Then, EEG/EMG electrodes were positioned as above for the monitoring of the sleep–wake cycle. EEG electrodes and cannulas were secured with dental acrylic. Animals were habituated for 5 d as described above.
EEG and EMG were then recorded from 6:00 to 7:00 P.M., immediately after microinfusion of 2.5 μl of vehicle (PG–saline 50%; n = 5) or UCM765 (10 μg in 2.5 μl; n = 5) in each cannula.
Bilateral substantia nigra microinfusion and EEG/EMG recording in freely moving rats.
A similar experimental protocol was also used in eight rats to test for eventual effects of UCM765 on sleep, if microinfused in another brain region also displaying MT2 immunoreactive neurons, i.e., the substantia nigra, pars reticulata. Vehicle or UCM765 was infused at the following stereotaxic coordinates: −5.4 mm AP, +2.75/−2.75 mm L, and 7.2 mm ventral relative to bregma (Paxinos and Watson, 2006).
Histological verification.
At the end of extracellular recording and/or microinfusion experiments, the brain was fixed by immersion in a 20% formaldehyde solution and embedded in paraffin, and 10-μm-thick sections collected at 50 μm intervals across the whole thalamus or substantia nigra were stained with cresyl violet and examined by light microscopy to identify the site of recording or microinfusion.
Statistical analyses.
SigmaStat (version 3.5) and SPSS software (version 13) were used to analyze data. Results are expressed as the mean ± SEM. Since assumptions of normality and variance homogeneity were satisfied from all data, one-way, one-way repeated-measures, or two-way mixed-design ANOVA (with factors as indicated in Results), followed by the Student–Newman–Keuls (SNK) or Fisher test for post hoc comparison, was used to determine differences. Student's t test was used to compare the effect of UCM765 with DZ in MT2 KO mice, and with vehicle in the bilateral microinfusion experiments. Calculation of ED50 values was performed using Microcal Software Origin (version 7). Relative changes in the power of frequency bands (delta, theta, beta) as a percentage of control (vehicle or WT mice, respectively) were analyzed by one-way ANOVA followed by Bonferroni's test for post hoc comparison. Statistical values reaching p ≤ 0.05 were considered significant.
Results
Pharmacological properties of UCM765
UCM765 is a novel partial agonist exhibiting greater affinity for MT2 (pKi = 10.18) than for MT1 receptors (pKi = 8.38), and even greater MT2 affinity than MLT itself (pKi = 9.62) (Rivara et al., 2007). UCM765 does not display significant affinity for other receptors, ion channels, and transporters, including those known for their involvement in sleep–wake regulation, such as GABAA, 5-HT2A, and histamine receptors (data are from Cerep, Celle L'Evescault, France; data not shown).
Based on the stimulation of basal [35S]GTPγS binding, the relative intrinsic activity values of UCM765 toward MT1 and MT2 receptors have been estimated at 0.8 and 0.6, respectively (Rivara et al., 2007). Since physiological concentrations of MLT induce a desensitization and internalization of MT2 receptors (Gerdin et al., 2003), we hypothesized that such a partial agonism might represent a therapeutic advantage for obtaining submaximal receptor activation without desensitization. Moreover, UCM765 (5 mg/kg, i.v.) has acceptable pharmacokinetic properties (area under the curve = 68,954 min * ng/ml; Cmax = 2562 ng/ml) and half-life (T1/2 = 44 min) for hypnotic drug development, as well as optimal hydrophilic–lipophilic balance (LogP of 2.64). This unique pharmacological profile prompted us to examine its effects in vivo.
Pharmacological modulation of the sleep–wake cycle
With EEG/EMG measurements in freely moving rats, we first queried whether a selective MT2 ligand might promote sleep. Since MLT and its receptors have shown circadian variations across the 24 h light/dark cycle, we recorded EEG/EMG activity during 24 h in four groups of rats, one injected with vehicle (n = 5) and the others with 20 mg/kg (n = 6), 40 mg/kg (n = 5) or 60 mg/kg (n = 6) UCM765 every 4 h (first injection at 6:00 P.M. for all groups). This protocol was chosen on the basis of the pharmacokinetic properties of UCM765. As shown in Figure 1A–D, the latency of the first long (>2 min) episode of NREMS was significantly affected by the dose of UCM765 (F(3,18) = 4.2; p = 0.01): 40 and 60 mg/kg respectively decreased latency by 59% and 49% (p < 0.05).
Figure 1.

Promoting effect of UCM765 on sleep parameters (24 h recordings; light on at 7:30 A.M. and light off at 7:30 P.M.). Four different groups of rats were used: vehicle (n = 5) and UCM765 at doses of 20 mg/kg (n = 6), 40 mg/kg (n = 5), and 60 mg/kg (n = 6), injected subcutaneously every 4 h (first injection at 6:00 P.M.). The means ± SEM are shown. A, UCM765 (40 and 60 mg/kg) decreased the latency of the first NREMS episode. B, UCM765 increased NREMS total time. C, UCM765 had no effect on total time in REMS. D, UCM765 decreased wakefulness total time. ###p < 0.001, light versus dark phase, by SNK post hoc test. E, Effects of UCM765 on NREMS and REMS total time: 1 h interval analysis during 24 h in 5 rats. Top, UCM765 (40 mg/kg) increased the amount of NREMS during the inactive/light phase (white background), but not during the active/dark phase (gray background), with a concomitant reduction in wakefulness total time. Bottom, REMS was not modified by UCM765 (40 mg/kg). ###p < 0.001, vehicle versus UCM765 treatment, by SNK post hoc test. F, Cumulative differences between UCM765 and vehicle over 24 h EEG/EMG recording. Top, NREMS. Bottom, REMS. *p < 0.05, **p < 0.01, ***p < 0.001 versus vehicle by SNK post hoc test.
Two-way ANOVA on total time in NREMS indicated a significant main effect of doses (F(3,18) = 4.80; p = 0.013) and phase of day (F(1,18) = 89.27; p < 0.001), with no interaction. In particular, UCM765 prolonged the total amount of NREMS during the inactive/light phase by 48% (p < 0.01) and 33% (p < 0.05) at doses of 40 and 60 mg/kg, respectively. No differences were observed between 40 and 60 mg/kg, suggesting that a plateau was reached at these doses. The ED50 was 30.3 mg/kg for the NREMS total time in the inactive phase. No significant effects of UCM765 were reported on the total time of REMS (Fig. 1C).
UCM765 decreased the time of wakefulness in the inactive/light phase (effect of doses, F(3,18) = 6.24, p = 0.004; phase of day, F(1,18) = 75.11, p < 0.001, with no interaction). In particular, 40 and 60 mg/kg UCM765 decreased the total time of wakefulness during the inactive/light phase by 37% (p < 0.001) and 26% (p < 0.005), respectively (Fig. 1D). When the effect of UCM765 (40 mg/kg) on NREMS total time was compared to vehicle by 1 h intervals over 24 h, a main effect of treatment and time was observed (effect of treatment, F(1,8) = 8.32, p = 0.02; effect of time, F(23,184) = 6.35, p < 0.001, with no interaction). The effect of UCM765 became statistically significant mostly at the end of the day (4:00–7:00 P.M.) (Fig. 1E), when the expression of MT2 receptors is maximal (Witt-Enderby et al., 2003). These results indicated that UCM765 activated MT2 receptors mostly during the inactive/light phase, without altering the 24 h sleep–wake cycle. No significant modifications of REMS were detected (Fig. 1E). The cumulative sleep effect was significant only in the inactive light phase (Fig. 1F).
The effects of UCM765 on sleep were also compared to those of the clinically used hypnotic benzodiazepine (DZ; Valium). As shown in Figure 2, the group of rats treated with UCM765 (40 mg/kg every 4 h; n = 5) and the group treated with DZ (2 mg/kg every 12 h; n = 6) both exhibited shorter onset latencies of the first NREMS episode compared to the group of rats (n = 5) receiving vehicle every 4 h (Fig. 2A, left) (F(2,8) = 9.0, p < 0.01; vehicle vs UCM765 or DZ, p < 0.01). UCM765 and DZ increased total time of NREMS during the inactive/light phase only (Fig. 2A) (effect of treatment, F(2,13) = 8.54, p = 0.004; effect of phase of day, F(1,13) = 102.24, p < 0.001; with an interaction, F(2,13) = 4.17, p = 0.04). DZ, but not UCM765, markedly reduced the number of NREMS episodes (Fig. 2A, center) (effect of treatment, F(2,13) = 7.04, p=0.008, phase of day, F(1,13) = 46.61, p < 0.001; with an interaction, F(2,13) = 9.73, p = 0.003; DZ vs vehicle or UCM765, p < 0.001). Only during the light phase did both UCM765 and DZ increase mean NREMS episode length (Fig. 2A, right) (effect of treatment, F(2,13) = 11.14, p=0.002; phase of day, F(1,13) = 14.08, p=0.002; with an interaction, F(2,13) = 7.52, p = 0.007). Both UCM765 and DZ increased REMS latency (F(2,8) = 14.1, p < 0.001), without apparent effects on REMS total time. The number of REMS episodes appeared to be affected by phase of day (Fig. 2B) (F(1,13) = 5.57, p = 0.03), but not by treatment.
Figure 2.

UCM765 (UCM) promotes NREMS like DZ [24 h recordings; light on at 7:30 AM, light off at 7:30 P.M.; UCM, 40 mg/kg, s.c., every 4 h (n = 5); DZ, 2 mg/kg, s.c., every 12 h (n = 6); first injection at 6:00 P.M.]. The means ± SEM are shown. A, Like DZ, UCM765 decreased the latency for NREMS. UCM765 and DZ increased NREMS during the inactive/light phase only (left). DZ, but not UCM765, markedly reduced the number of NREMS episodes (center). UCM765 and DZ increased mean NREMS episode length during the light phase only (right). B, Both UCM765 and DZ increased REMS latency, without apparent effect on REMS total time. The number of REMS episodes appeared to be affected by phase of day, but not treatment. The mean REM episode length was not affected by the treatment and phase of day. C, Both UCM765 and DZ decreased the total time of wakefulness during the inactive/light phase (left). DZ, but not UCM765, considerably decreased the number of episodes of wakefulness during the light phase (center). DZ, but not UCM765, significantly increased the mean wakefulness episode length (right). D, Number of spindles. UCM765 and DZ increased the number of spindles per minute during the light phase. *p < 0.05, **p < 0.01, ***p < 0.001 versus vehicle; #p < 0.05, ##p < 0.01, ###p < 0.001, DZ versus UCM765 or light versus dark phase, by SNK post hoc test.
Total time of wakefulness was significantly reduced after treatment with either UCM765 or DZ during the inactive/light phase only (Fig. 2C, left; effect of treatment, F(2,13) = 9.28, p=0.003; phase of day, F(1,13) = 75.15, p < 0.001, without interaction). DZ, but not UCM765, considerably decreased the number of episodes of wakefulness during the light phase (effect of treatment, F(2,13) = 7.95, p = 0.006; phase of day, F(1,13) = 41.97, p < 0.001; with an interaction, F(2,13) = 9.17, p = 0.003). DZ, but not UCM765, significantly increased the mean wakefulness episode length (Fig. 2C) (effect of treatment, F(2,13) = 5.92, p = 0.015; phase of day, F(1,13) = 52.46, p < 0.001, without interaction). Moreover, similarly to DZ, UCM765 increased the number of spindles/min during the inactive/light phase only (Fig. 2D) (effect of treatment, F(2,13) = 24.51, p < 0.001; phase of the day, F(1,13) = 110.20, p < 0.001; with an interaction, F(2,13) = 13.33, p < 0.001).
The quality of sleep after UCM765 and DZ was thus compared using power spectra analysis during both light and dark phases (Fig. 3). Upon calculation of the relative EEG power (vehicle set at 100%) (Fig. 3, insets), a significant effect of treatment was observed on the delta bands of NREMS (F(2,15) = 9.60, p = 0.002) and REMS (F(2,15) = 209.43, p < 0.001) and on beta bands of NREMS (F(2,9) = 13.71, p = 0.002) and REMS (F(2,9) = 16.08, p < 0.001), but not on theta. In particular, DZ produced a significant decrease in the power of the delta band in both NREM and REM sleep, and an increase of the peak of beta (10–12 Hz) (Fig. 3, insets), as reported previously (Kopp et al., 2004; van Lier et al., 2004). On the contrary, UCM765 produced a slight increase by 12% in delta of NREMS during the light phase. Similar findings were also observed during the dark phase (Fig. 3, insets, bottom).
Figure 3.

Power spectra of NREMS (left traces) and REMS (right traces) after treatment with vehicle (bold lines), UCM765 (dotted lines), and DZ (thin lines) during the light (top) and dark (bottom) phases. Insets, EEG power spectra after UCM765 (UCM) and DZ treatments relative to those of vehicle (100%, horizontal line) expressed as the mean percentage change (±SEM). The mean percentage power density was calculated as the mean power (in square microvolts) in each 0.5 Hz frequency bin divided by the total power (0–25 Hz) in the same epoch. *p < 0.05; **p < 0.01; ***p < 0.001, by Bonferroni's post hoc test versus control (vehicle).
Sleep in MT2 and MT1 knock-out mice
To further characterize the role of MT2 and MT1 receptors in sleep, the sleep parameters were also measured over the 24 h light/dark cycle in mice lacking MT2 receptors (MT2 KO, n = 5) to compare them with wild-type mice (WT, n = 5) and with mice lacking MT1 receptors (MT1 KO, n = 5).
Compared to WT and MT1 KO mice, MT2 KO mice showed a decrease in NREMS (−16%; p = 0.017) during the inactive/light phase only (Fig. 4A). On the contrary, MT1 KO mice showed an increase in NREMS (+40%; p = 0.001) during the active/dark phase (Fig. 4A) (effect of strain, F(2,12) = 10.82, p = 0.002; phase of day, F(1,12) = 79.40, p < 0.001; with an interaction, F(2,12) = 6.14, p = 0.015). MT2 KO mice displayed an increase of wakefulness (+19%; p = 0.017) compared to WT and MT1 KO mice during the light/inactive phase only, whereas MT1 KO mice showed a decrease in wakefulness (−24%; p = 0.001) during the dark/active phase (Fig. 4C) (effect of strain, F(2,12) = 7.93, p = 0.006; phase of day, F(1,12) = 94.40, p < 0.001; with an interaction, F(2,12) = 7.47, p = 0.008).
Figure 4.

Twenty-four hour sleep recordings in WT (n = 5), MT2 KO (n = 5) and MT1 KO (n = 5) mice (light on at 7:30 AM and off at 7:30 P.M.). The recordings started at 6:00 P.M. The means ± SEM are shown. A, NREMS during the light and dark phases. Compared to WT and MT1 KO mice, MT2 KO mice showed a decrease in NREMS during the inactive/light phase only. MT1 KO mice showed an increase in NREMS during the active/dark phase. B, REMS during the light and dark phases. Both WT and MT2 KO mice displayed longer REMS during the light/inactive phase compared to the active/dark phase. This difference was blunted in MT1 KO mice. C, Wakefulness during the light and dark phases. MT2 KO mice showed an increase of wakefulness compared to WT and MT1 KO mice, during the light/inactive phase only. MT1 KO mice showed a decreased in wakefulness during the dark/active phase. Note that wakefulness in the dark phase differed between MT1 KO and MT2 KO mice (p < 0.001; data not shown). *p < 0.05, ***p < 0.001 versus vehicle; ##p < 0.01, ###p < 0.001 light versus dark phase by SNK post hoc test. D, E, Power spectra of NREMS (left traces) and REMS (right traces) in WT (bold lines), MT2 KO (dotted lines) and MT1 KO (thin lines) mice during the light (D) and dark (E) phases. Insets, EEG power spectra in MT1 and MT2 KO mice, expressed as a mean percentage (±SEM) change relative to those of control (WT; 100%; horizontal line). The mean percentage power density was calculated as the mean power (in square microvolts) in each 0.5 Hz frequency bin divided by the total power (0–25 Hz) in the same epoch. *p < 0.05; **p < 0.01; ***p < 0.001, by Bonferroni's post hoc test versus control (WT mice).
In WT and MT2 KO mice, REMS lasted longer in the inactive/light phase (+46%; p = 0.005 and +50%; p < 0.001, respectively) than in the active/dark phase; in contrast, MT1 KO mice spent equal time in REMS during both the light and dark phases (p = 0.69), indicating a disruption of the light/dark REMS cycle (Fig. 4B) (effect of phase of day, F(1,12) = 16.84, p = 0.001; no strain effect and interaction).
Altogether, these results suggested that MT2 receptors are mostly involved in the maintenance of NREMS during the inactive phase and not at all in REMS. Interestingly, the power spectra analyses (Fig. 4D,E) during the light and the dark phases also indicated a modified spectral power mostly in MT1 KO mice. Upon calculating the relative EEG power (WT set at 100%) during the light phase (Fig. 4D, insets), a significant effect of strain was observed on the delta band of NREMS (F(2,15) = 8.85, p = 0.003), on the theta bands of NREMS (F(2,27) = 4.60, p = 0.019) and REMS (F(2,27) = 5.98, p=0.007), on sigma band of NREMS (F(2,21) = 131.22, p < 0.001), and on beta bands of NREMS (F(2,9) = 828.75, p < 0.001) and REMS (F(2,9) = 4.98, p = 0.035). For all the bands, there were significant differences mainly between MT1 KO and WT mice (p < 0.05). Similar findings were obtained after the analysis of NREMS and REMS power spectra during the dark phase (Fig. 4E).
Selectivity of UCM765 for MT2 receptors
We then questioned whether the effects of UCM765 were linked to its class properties [N-(substituted-anilinoethyl)amides], or to its selective partial agonistic activity toward MT2 receptors. For this purpose, we compared the effects of UCM765 to those of its class congener UCM793 (Rivara et al., 2007), which exhibits a nonselective MT1/MT2 profile of agonistic activity (MT1, pKi = 9.09; MT2, pKi = 9.19). In these experiments, sleep parameters were measured between 6:00 and 9:00 P.M., a period during which several NREMS and REMS episodes occur (Ruigt et al., 1989).
As shown in Table 1 for Treatment Group A, UCM793 did not modify the total time in NREMS and REMS. In much the same way that the MT1/MT2 agonist ramelteon acts in rats (Fisher et al., 2008) and humans (Erman et al., 2006), UCM793 at the dose of 40 mg/kg (n = 7) slightly reduced (−15%) the latency of the first long episode (>2 min) of NREMS (vehicle, 26.4 ± 2.8 min; UCM793, 22.5 ± 3.7 min). Thus, the effect of UCM765 on NREMS appeared to be imputable to its selectivity toward MT2 receptors.
Table 1.
Selective effects of MT2 agonist UCM765 on standard sleep parameters
| Treatment group | NREM sleep latency (min) | NREM sleep total time (min) | REM sleep latency (min) | REM sleep total time (min) | Wakefulness total time (min) |
|---|---|---|---|---|---|
| A (rat) | |||||
| Vehicle (n = 7) | 24.9 ± 2.8 | 60.9 ± 3.2 | 44.4 ± 3.0 | 11.2 ± 2.0 | 107.9 ± 4.7 |
| UCM793 40 mg (n = 7) | 22.5 ± 3.6 | 55.3 ± 5.6 | 61.6 ± 15.0 | 10.9 ± 2.2 | 113.2 ± 6.4 |
| UCM793 60 mg (n = 6) | 27.6 ± 3.7 | 58.8 ± 5.7 | 57.5 ± 10.2 | 9.3 ± 1.1 | 111.9 ± 5.7 |
| UCM793 80 mg (n = 6) | 22.8 ± 30.9 | 48.3 ± 5.2 | 56.4 ± 9.2 | 8.3 ± 0.4 | 123.4 ± 5.9 |
| B (rat) | |||||
| Vehicle + vehicle (n = 6) | 31.3 ± 4.2 | 53.7 ± 4.1 | 51.8 ± 6.0 | 7.3 ± 0.5 | 119.0 ± 4.6 |
| Vehicle + UCM765 40 mg (n = 6) | 19.5 ± 2.7* | 72.6 ± 5.0*,# | 75.3 ± 11.2 | 7.8 ± 1.2 | 99.6 ± 5.8*,# |
| 4P-PDOT 10 mg + vehicle (n = 6) | 25.8 ± 3.4 | 60.5 ± 5.2 | 75.6 ± 9.0 | 8.2 ± 1.5 | 111.3 ± 6.3 |
| 4P-PDOT 10 mg + UCM765 40 mg (n = 6) | 20.7 ± 3.2 | 57.4 ± 5.7 | 65.8 ± 11.4 | 6.9 ± 0.8 | 115.7 ± 6.2 |
| C (mouse) | |||||
| WT + vehicle (n = 8) | 26.3 ± 1.9 | 64.4 ± 4.4 | 52.5 ± 6.2 | 6.4 ± 1.3 | 109.2 ± 5.7 |
| WT + UCM765 40 mg (n = 8) | 12.4 ± 1.6** | 89.3 ± 5.6*** | 71.6 ± 10.0 | 6.1 ± 1.0 | 84.6 ± 5.7*** |
| MT1 KO + vehicle (n = 6) | 38.5 ± 4.5 | 50.5 ± 3.9 | 63.3 ± 5.0 | 4.0 ± 0.5 | 125.6 ± 4.0 |
| MT1 KO + UCM765 40 mg (n = 6) | 18.0 ± 2.6*** | 66.8 ± 3.8* | 69.1 ± 11.7 | 3.5 ± 0.5 | 109.7 ± 3.0* |
| MT2 KO + vehicle (n = 6) | 27.9 ± 2.6 | 51.0 ± 4.0 | 63.8 ± 9.5 | 6.3 ± 0.8 | 122.7 ± 4.2 |
| MT2 KO + UCM765 40 mg (n = 6) | 20.0 ± 1.4 | 48.8 ± 4.1 | 65.5 ± 11.1 | 5.8 ± 1.4 | 125.4 ± 5.8 |
| D (mouse) | |||||
| MT2 KO + vehicle (n = 6) | 27.9 ± 2.6 | 51.0 ± 4.0 | 63.8 ± 9.5 | 6.3 ± 0.8 | 122.7 ± 4.2 |
| MT2 KO + DZ 2 mg (n = 4) | 10.1 ± 0.7* | 76.0 ± 2.8** | 62.1 ± 12.3 | 5.1 ± 1.0 | 98.9 ± 2.3** |
EEG/EMG recordings are from 6:00 to 9:00 P.M. (lights off at 7:30 P.M.). Data are expressed as mean ± SEM; the number of animals per group is indicated in brackets. Group A, Lack of effect of increasing doses of the nonselective MT1/MT2 agonist class congener UCM793 (40, 60, and 80 mg/kg, s.c.) in rats. Group B, Blockade of UCM765 effects by the MT2 antagonist 4P-PDOT in rats. Treatment with vehicle or UCM765 (40 mg/kg, s.c.) was administered 10 min after the pretreatment with vehicle or 4P-PDOT (10 mg/kg, s.c.). *p < 0.05, vehicle + UCM765 versus vehicle + vehicle; #p < 0.05, 4P-PDOT + UCM765 versus vehicle + UCM765, by SNK post hoc test. No differences were observed in latency and total time in REMS. Group C, Effects of UCM765 (40 mg/kg, s.c.) on sleep parameters in MT2 and MT1 receptor KO and WT mice. UCM765 decreased the latency to sleep in WT and MT1 KO, but not in MT2 KO mice. UCM765 increased NREMS total time in MT1 KO, but not in MT2 KO mice. REMS latency was not modified in MT1 KO and MT2 KO mice, and UCM765 had no effect on latency and total time in REMS. UCM765 decreased the total time of wakefulness in WT and MT1 KO, but not in MT2 KO mice. *p < 0.05; **p < 0.01; ***p < 0.001 by Fisher's PLSD test comparing vehicle versus UCM765 treatment. Group D, Diazepam (2 mg/kg, s.c.) was still active in MT2 KO mice. *p < 0.05; **p < 0.01 by Student's t test.
The MT2 antagonist 4P-PDOT is a reference compound exhibiting good binding affinity for the cloned human MT2 receptor (pKi = 8.8) and a selectivity of at least 100-fold for MT2 over the MT1 subtype (Boutin et al., 2005). To verify that the promotion of NREMS by UCM765 is MT2 mediated, UCM765 (40 mg/kg) was administered 10 min after the pretreatment with vehicle or 4P-PDOT (10 mg/kg, n = 7). As shown in Table 1B, 4P-PDOT blocked the effects of UCM765 on NREMS and wakefulness total time, strongly suggesting that the maintenance of NREMS was mediated by MT2 receptors. Indeed, two-way ANOVA showed a significant interaction between treatment and pretreatment on NREMS total time (F(1,20) = 4.6, p = 0.04) and total time of wakefulness (F(1,20) = 4.4, p = 0.04). SNK post hoc test indicated a significance (p < 0.05) of comparing 4P-PDOT plus UCM765 and vehicle plus UCM765.
Even though UCM765 is selective for MT2 receptors, it does display a low affinity for MT1 receptors. To further confirm the involvement of MT2 and determine which of the receptor subtypes is involved in the NREMS promoting effect, we tested UCM765 in MT2 KO (n = 6), MT1 KO (n = 6), and WT (n = 8) mice (Table 1, Group C). UCM765 decreased the latency to sleep in WT (−53%; p < 0.001) and MT1 KO (−53%; p < 0.001), but not in MT2 KO mice (effect of treatment, F(1,34) = 27.8, p < 0.001; strain, F(2,34) = 3.9; p < 0.02, with no interaction). However, MT1 KO mice showed a long latency to the first onset of sleep compared to WT (+46%; p < 0.01) after the injection of vehicle. UCM765 increased NREMS total time in MT1 KO (+32%; p < 0.05), but not in MT2 KO mice (effect of treatment, F(1,34) = 12.0, p < 0.001; strain, F(2,34) = 19.2, p < 0.001; with a significant interaction, F(2,34) = 4.5, p < 0.01), indicating that the presence of MT2, but not of MT1, receptors is essential and necessary for the restoration of NREMS (Table 1, Group C). REMS latency was not modified in MT1 KO and MT2 KO mice, and UCM765 had no effect on latency and total time in REMS. UCM765 decreased the total time of wakefulness in WT (−23%; p < 0.001) and MT1 KOs (−12%; p < 0.05), but not in MT2 KO mice (Table 1, Group C) (effect of treatment, F(1,34) = 10.4, p = 0.003; strain, F(2,34) = 13.9, p < 0.001; with a significant interaction, F(2,34) = 3.6, p = 0.03).
Overall, the lack of effect in MT2 KO mice concurred with the prior evidence that the NREMS promoting effect of UCM765 was selectively mediated by MT2 receptors. To determine whether the reduction in NREMS observed in MT2 KO mice was due to the lack of MT2 receptors rather than to impairment in other sleep-related neurotransmission systems, MT2 KO mice were treated with the GABAA agonist DZ (Table 1, Group D). As in rats, DZ in MT2 KO mice (n = 4) decreased the latency of the first episode of sleep (−64%; p < 0.05, Student's t test), enhanced NREMS total time (+49%; p < 0.002), and tended to decrease REMS total time (−21%) and time in wakefulness (−20%; p < 0.003), thus suggesting that the GABAergic regulation of sleep was intact in these mice.
Immunohistochemical localization of MT2 receptors
MT2 receptor immunoreactivity was detected in numerous anatomical regions across rat brain (Fig. 5). Strong labeling of neuronal cell bodies and proximal dendrites was consistently observed in Rt (Fig. 5A–E), septum, CA3 of dorsal hippocampus (Fig. 5F), substantia nigra reticulata and red nucleus (Fig. 5G), supraoptic nucleus (Fig. 5H), oculomotor nuclei, and ventral tegmental nucleus. In high-resolution micrographs obtained after counterstaining with cresyl violet (Fig. 5E), it was apparent that all neurons in Rt were immunoreactive (arrows). Neuronal labeling was moderate in the ventral pallidum, globus pallidus, other sectors of hippocampus (e.g., the dentate gyrus), paraventricular nucleus of the hypothalamus, and inferior colliculus. In hippocampus, the sparse distribution of labeled neurons was suggestive of interneurons. There was no somatodendritic labeling in suprachiasmatic nucleus (Fig. 5I), but this nucleus appeared slightly darker than surrounding areas, perhaps due to punctate (axon terminal) labeling. No MT2 labeling was observed in the white matter and numerous other gray matter structures, notably in cerebral cortex, striatum, lateral hypothalamic area, habenular nuclei, substantia nigra pars compacta, periaqueductal gray, and raphe nuclei.
UCM765 activates neurons of the reticular thalamic nucleus
Given the presence of MT2 receptors in the Rt nucleus (Fig. 5A–D) and the importance of this nucleus in the induction of NREMS (Steriade, 1999), we first examined the effects of systemically administered UCM765 (20 mg/kg, i.v.) on the firing activity of these neurons. As reported in Table 2, UCM765 (n = 8), but not vehicle (n = 8), elicited an increase in firing activity (+91%, p < 0.001), percentage of spikes in burst (+134%; p = 0.002), and mean spike per burst (+50%; p = 0.02) in all neurons tested. Figure 6A illustrates an integrate histogram of a single-unit recording displaying the classical pattern of a typical Rt neuron before and after the UCM765 intravenous injection. A sustained increase in firing (second trace) and burst (third trace) activities was observed immediately after the injection of UCM765. On top of Figure 6 (insets), the typical accelerando-decelerando pattern of Rt neurons is shown at higher magnification. Figure 6B is the plot of mean interspike intervals against the number of spikes per burst in the basal condition and after vehicle and UCM765 injections for all Rt neurons tested (n = 8). UCM765 increases the number of spikes within bursts, but does not change the pattern of interspike interval distribution.
Table 2.
Firing and burst activity parameters of reticular thalamic neurons recorded in vivo in the basal condition and after administration of vehicle and UCM765(10 mg/kg, i.v.)
| Spontaneous firing rate activity |
Spontaneous burst activity |
||||||||
|---|---|---|---|---|---|---|---|---|---|
| Firing rate (Hz) | Interspike interval (s) | Coefficient of variation (%) | Number of bursts (3 min) | Spikes in bursts (%) | Spikes per burst | Burst interspike interval (ms) | Burst length (ms) | Intraburst firing rate (Hz) | |
| Treatment groups | |||||||||
| Basal (n = 8) | 2.3 ± 0.7 | 1.2 ± 0.4 | 72.0 ± 21.0 | 23.4 ± 8.0 | 16.2 ± 3.1 | 6.6 ± 1.2 | 13.0 ± 2.2 | 99.0 ± 31.8 | 118.5 ± 36.5 |
| Vehicle (n = 8) | 2.2 ± 0.8 | 1.2 ± 0.3 | 72.8 ± 15.0 | 19.1 ± 6.3 | 21.8 ± 7.2 | 6.5 ± 1.2 | 11.1 ± 1.7 | 74.5 ± 17.1 | 121.8 ± 31.0 |
| UCM765 (20 mg; n = 8) | 4.4 ± 0.9*** | 0.3 ± 0.1* | 68.6 ± 13.4 | 55.0 ± 8.0*** | 37.9 ± 8.0** | 9.9 ± 1.5* | 16.9 ± 2.8 | 164.6 ± 32.1 | 67.4 ± 7.4 |
| Statistics | F(2,14)=12.8 | F(2,14)=4.0 | F(2,14)=0.04 | F(2,14)=14.3 | F(2,14)=9.9 | F(2,14)=4.7 | F(2,14)=1.2 | F(2,14)=2.3 | F(2,14)=1.7 |
| p < 0.001 | p = 0.04 | p = 0.9 | p < 0.001 | p = 0.002 | p = 0.02 | p = 0.3 | p = 0.1 | p = 0.2 | |
Data are expressed as mean ± SEM from eight neurons (1 neuron per rat).
*p < 0.05;
**p < 0.01;
***p < 0.001, by SNK post hoc test.
Figure 6.

UCM765 in vivo enhanced the firing rate and rhythmic burst activity of Rt neurons. A, Single-neuron activity recording (first trace), with integrated histogram of spontaneous firing rate (second trace), burst event (third trace), and burst instantaneous frequency (fourth trace) after injection of vehicle or UCM765 (20 mg/kg, i.v.). Arrows indicate the start of injection. The time scale (20 s) applies to all four traces. B, Plot of mean interspike intervals (in milliseconds) against the number of spikes per burst, for 3 min in the basal condition and immediately after the intravenous injection of vehicle or UCM765. The mean from eight neurons (1 neuron per rat) is shown. C, Typical waveform of Rt neurons. Top insets, Amplification of recordings after vehicle and UCM765 injections, visualizing the typical accelerando-decelerando pattern of Rt neurons characterized by an initial part with frequency acceleration (200–250Hz) and deceleration, followed by long-lasting tonic barrage of spikes of ∼100 Hz (tail). Note that after UCM765 injection, the number of spikes per burst increases. Time scale, 50 ms.
To confirm that the firing and burst activation of Rt neurons was due to a direct activation of MT2 receptors localized within the nucleus, the MT2 antagonist 4P-PDOT (10 μg/10 μl; n = 7) was locally infused in the Rt before the intravenous injection of UCM765. The increase of firing and burst activation of Rt neurons after UCM765 injection was prevented by the local infusion of 4P-PDOT, confirming that this effect was mediated by MT2 receptors present within the nucleus [two-way ANOVA analysis for factors infusion (vehicle or 4P-PDOT) and treatment (basal, vehicle or UCM765), F(2,10) = 10.23, p = 0.004] (Fig. 7A–D).
Figure 7.
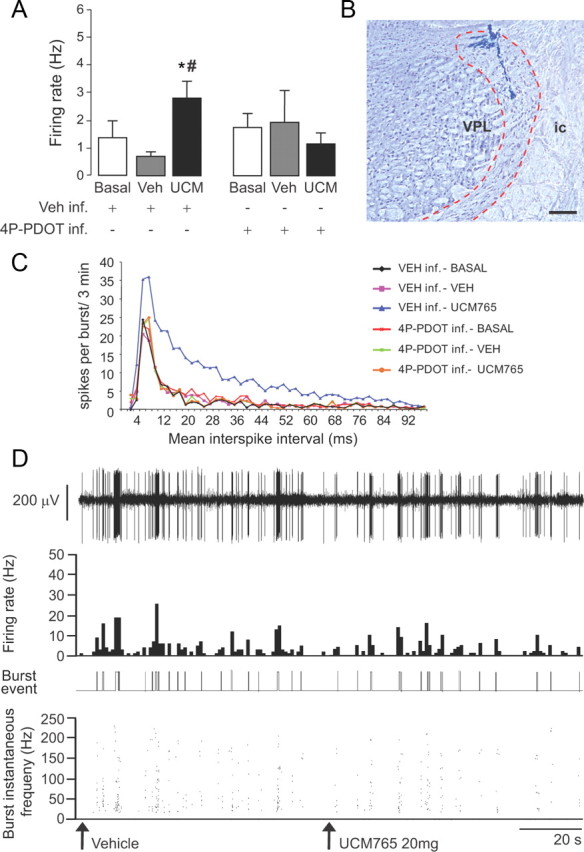
The effects of UCM765 on reticular thalamic neurons are mediated by MT2 receptors. Microinfusion of the MT2 antagonist 4P-PDOT into rat Rt prevents the firing rate and burst neuronal activation induced by UCM765 (20 mg/kg, i.v.; n = 7) A, Spontaneous firing rate (in hertz) of Rt neurons after either microinfusion of vehicle (Veh) into Rt followed by intravenous injection of vehicle or UCM765 (UCM), or microinfusion of 4P-PDOT (10 μg) followed by intravenous injection of vehicle or UCM765 (20 mg/kg). *p < 0.05, Veh inf. plus UCM765 versus Veh inf. plus Veh and versus Veh inf. plus basal; #p < 0.05, Veh.inf. plus UCM765 versus 4P-PDOT inf. plus UCM765, by SNK post hoc test. The means ± SEM from seven neurons (1 neuron per rat) are shown. B, Histological control of a recording site in Rt. The electrode track may be traced into the inner aspect of the dorsal Rt, at a middle rostrocaudal level across the nucleus. VPL, Ventral posterolateral thalamic nucleus; ic, internal capsule. Scale bar, 250 μm. C, Plot of mean interspike intervals (ms) against the number of spikes per burst for 3 min. The mean from seven neurons (1 neuron per rat) is shown. D, Single-neuron activity recording example (first trace), with integrated histogram of spontaneous firing rate (second trace), burst event (third trace), and burst instantaneous frequency (fourth trace); 4P-PDOT (10 μg) was microinfused into Rt prior the intravenous injections of vehicle and UCM765 (20 mg/kg). The time scale (20 s) applies to all four traces. Arrows indicate the start of intravenous injection.
In all brains in which the recording sites could be localized histologically, the electrode tract ended in the dorsal Rt, either in its anterior or in its middle third, rostrocaudally (Fig. 7B). In a single case in which the Rt was missed, the electrode tract was found immediately adjacent, but lateral, to the internal capsule.
Microinfusion of UCM765 in Rt but not in substantia nigra induces NREMS
To further confirm that UCM765 promoted NREMS by acting on Rt neurons, the compound was bilaterally infused into the Rt nuclei in nonanesthetized freely moving rats (n = 5), in which EEG/EMG activity was simultaneously recorded for 1 h (6:00–7:00 P.M.). UCM765 (10 μg bilaterally) significantly decreased NREMS latency compared to vehicle (−49%, 9.2 ± 2.4 min vs 18.2 ± 3.0; t = 2.31; 8 df; p = 0.04). Moreover, UCM765 increased NREMS total time (+93%; t = −2.81; 8 df; p = 0.02) and decreased wakefulness (−31%; t = 2.49; 8 df; p = 0.03) without affecting REMS (Fig. 8A–C). In three brains examined histologically after bilateral microinfusion, the lesions produced by the cannulas and deposits of pontamine sky blue encroached on the dorsal Rt, again in its rostral or middle third, rostrocaudally (Fig. 8B).
Figure 8.
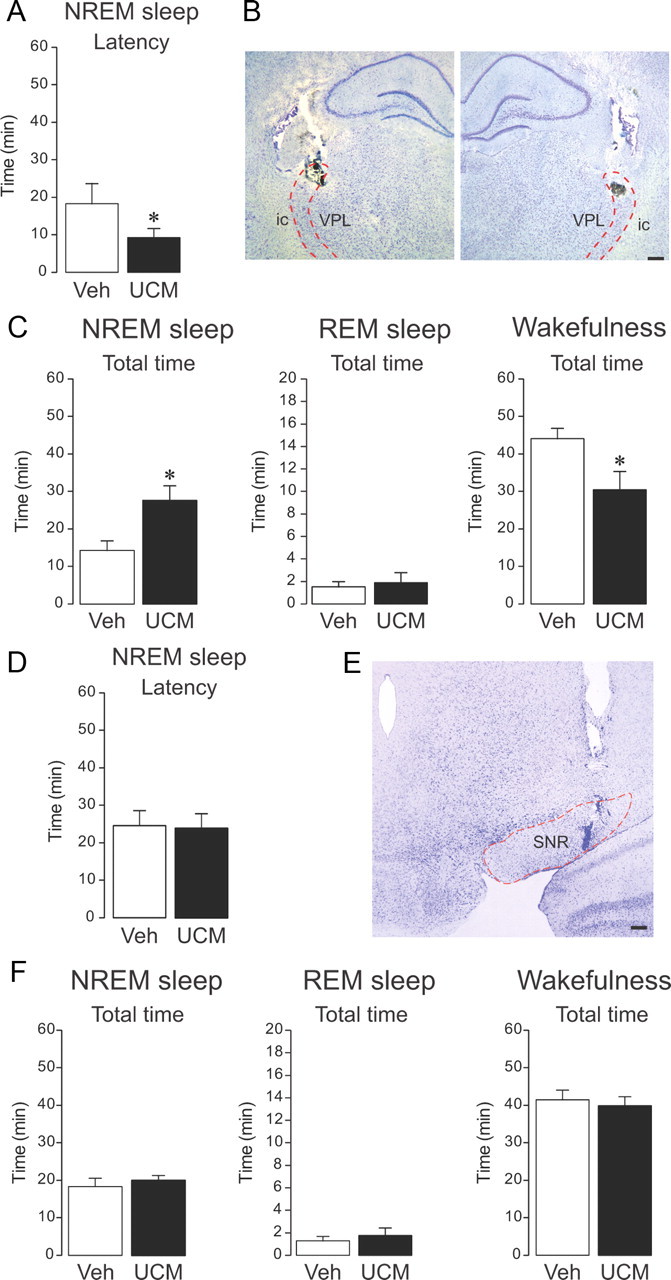
Local microinfusion of UCM765 into reticular thalamus promotes NREMS, whereas microinfusion into substantia nigra pars reticulata (SNR) does not affect sleep–wake parameters in freely moving non-anesthetized rats. A–C, Effects of bilateral microinfusion of UCM765 (10 μg) into the Rt and concomitant EEG/EMG recordings from 6:00 to 7:00 P.M. The means ± SEM from five rats are shown. A, UCM765 decreased the latency of the first episode of sleep. *p < 0.05. B, Histological control of bilateral microinfusion sites. On both sides, the lesion and deposit of pontamine sky blue is located in the middle third of the dorsal Rt. Abbreviations are as in Figure 7B. C, UCM765 increased the total time of NREMS and reduced wakefulness. *p < 0.05, t test. D–F, Effects of bilateral microinfusion of UCM765 (10 μg) into SNR and concomitant EEG/EMG recordings from 6:00 to 7:00 P.M. The means ± SEM from eight rats are shown. D, Latency of the first NREMS episode. E, Histological control of microinfusion site: the pontamine sky blue deposit is located within the SNR. F, Total time of NREMS, REMS, and wakefulness. Scale bars: 250 μm.
When UCM765 was bilaterally microinfused into the substantia nigra pars reticulata (n = 8), another area rich in MT2 receptor (Fig. 5G), no changes in the sleep–wake parameters were displayed (Fig. 8D–F) compared to vehicle, indicating that activation of MT2 receptors located into Rt are necessary for UCM765 to promote sleep.
Discussion
This is the first demonstration that activation of MT2 receptors by the novel selective partial agonist UCM765 induces and promotes NREMS. This effect of UCM765 is dependent on MT2 receptors, since it was nullified by the pharmacological blockade or genetic deletion of these receptors.
The promotion of NREMS is likely the result of the burst activation of Rt neurons. Indeed, the increase of Rt neural activity induced by systemic administration of UCM765 paralleled the NREMS enhancement, and its local microinfusion into Rt was sufficient to produce this effect. When UCM765 was microinfused into the substantia nigra, another area rich in MT2 receptor, but with less impact on sleep, there were no apparent changes in sleep–wake parameters.
MT2 receptors have not been implicated previously in the regulation of sleep, except in a recent study suggesting that the MT2 agonist IIK7 may transiently perturb the sleep–wake cycle (Fisher and Sugden, 2009). Thus far, MT2 receptors had been mostly implicated in the regulation of circadian rhythm, even though controversial results had been obtained by in vitro and in vivo techniques. For example, in brain slices from WT and MT2 KO mice, but not MT1 KO mice, MLT was found to inhibit neuronal firing in the suprachiasmatic nucleus, whereas the phase shift of neuronal firing rhythms induced by the MT1/MT2 agonist 2-iodoMLT was of smaller magnitude in suprachiasmatic nucleus (SCN) brain slices from MT1 KO mice than WTs (Liu et al., 1997). Moreover, in vivo studies have demonstrated that MLT induces phase shifts in WT and MT2 KO mice (Hudson et al., 2005), but not in MT1 KO mice (Dubocovich et al., 2005), whereas circadian rhythms appear to be unaltered in MT2 KO mice (Jin et al., 2003). These observations altogether suggest that MT1 but not MT2 receptors are directly involved in circadian regulation. Indeed, prior studies having hypothesized a role for MT2 receptors in phase shift presented several pitfalls; the experiments in vivo had been performed with relatively low doses of melatonin receptor ligands (Dubocovich et al., 1998), and those using SCN slices had inevitably eliminated the whole brain circuitry (Hunt et al., 2001). Nevertheless, although sleep and circadian rhythms are coupled, they are presumably generated by different neuronal mechanisms, in keeping with the notion that the time course of their ontogenic development is not consistently comparable (Mirmiran et al., 2003).
The bulk of our results suggest that MT2 receptors play a specific role in NREMS regulation during the inactive/light phase, whereas MT1 receptors are likely involved in the 24 h sleep–wake cycle, sleep regulation in the active phase, and overall spectral activity. Indeed, MT1 KO mice exhibited increased NREMS associated with a modified 24 h sleep–wake cycle. Conversely, the presence of MT1 receptors in MT2 KO mice left the 24 h sleep–wake cycle intact with a decrease in NREMS total time. In keeping with this view, two functions associated with NREMS (Marshall and Born, 2007), long-term potentiation in the hippocampus and memory consolidation (Larson et al., 2006), have been shown to be impaired in MT2 KO mice.
Our polysomnographic recordings suggest that the effects of UCM765 on sleep are different from those of nonselective, MT1/MT2, class congeners. In particular, the congener UCM793 slightly decreased sleep onset, but without effect on NREMS maintenance, similar to ramelteon, suggesting that the affinity of these compounds for both MLT receptors accounts for their effect on sleep onset, whereas selectivity toward MT2 receptors results in a more incisive effect on sleep onset as well as NREMS maintenance. As two receptors for the same neurotransmitter may have divergent functions, selectivity for a single receptor can provide a therapeutic advantage. For example, in hippocampal slices, MT1 and MT2 receptor activation appears to differentially modulate GABAA receptor function, suggesting that MLT, through activation of different receptor subtypes, may exert opposite effects in the same brain area (Wan et al., 1999). Similarly, MT1 and MT2 receptors have also been shown to act in an opposite manner on the vascular system, producing vasoconstriction and vasodilatation, respectively (Doolen et al., 1998). Our data also suggest differential functions in sleep; indeed NREMS is decreased in MT2 KO mice during the inactive/light phase and increased in MT1 KO mice during the active/dark phase.
As visualized by light microscopic immunohistochemistry, many regions of rat brain, more or less tightly implicated in different aspects of sleep, contain neurons bearing MT2 receptors. The focus of the present study was on Rt, because in rodents, Rt neurons are known to be all GABAergic and to provide inhibitory inputs to thalamic relay cells (Jones, 2007). Rt is of great importance for sleep regulation (Steriade, 1999), innervating thalamocortical relay neurons with a feedback inhibition that influences thalamocortical rhythm generation (Deleuze and Huguenard, 2006). During episodes of NREMS, Rt neurons discharge in a slow, rhythmic burst-firing mode that is transmitted to thalamic relay nuclei and modulated by corticothalamic inputs, resulting in a widespread synchronization across neuronal assemblies (Steriade et al., 1991) and a modification of consciousness (Tononi and Massimini, 2008).
Another remarkable finding of the present study was the induction by UCM765 of the burst activity of Rt neurons. This activity pattern was MT2-mediated since it was abolished by the intrathalamic microinfusion of a selective MT2 receptor antagonist. Since this burst activity promotes NREMS, MT2 receptors may thus be viewed as a key component in sleep regulation. The presence of MT2 receptors on Rt GABA neurons reinforces the evidence for an allosteric interaction between MT2 and GABAA receptors (Wan et al., 1999). The hypnotic effects of MLT are indeed blocked by BZ-GABAA antagonists in experimental animals (Wang et al., 2003a). However, the fact that MT2 ligands have a distinct profile from BZ, and that BZ are still active in MT2 KOs, suggest that MT2 ligands might modulate GABAergic activity in a differential manner compared to BZ/GABAA receptors, using, for example, a different intracellular pathway.
The signaling cascade through which UCM765 exerts its hypnotic effects remains to be elucidated, as well as the subregions of Rt involved in the promotion of NREMS mediated by MT2 receptors. Moreover, the potential effects of UCM765 in other brain structures known to be implicated in sleep, such as the basal forebrain (which has projections to Rt), the ventrolateral preoptic nucleus, and the suprachiasmatic nucleus, await some clarification. Nevertheless, the selective promotion of NREMS through the activation of Rt neurons designates MT2 receptors as a promising novel target for the treatment of insomnia and sleep disorders.
Footnotes
This work was supported by grants from the Fonds de la Recherche en Santé du Québec (G.G., F.R.B., L.D.), the Canadian Institutes of Health Research (PPP-81421 and PP2–90159 to G.G. and MOP-3544 to L.D.), the Canadian Foundation for Innovation (23381 to G.G.), MSBi Valorisation (G.G.), and the McGill University Health Center (G.G., S.C., F.R.B.). R.O.-S. was supported by a fellowship from the Fonds de la Recherche Québec, Nature et Technologies, and R.O.-S. and S.D.-L. were supported by fellowships from Consejo Nacional de Ciencia y Tecnologia (Mexico). This work would not have been done without the unconditional generosity of Dr. Guy Debonnel (1949–2006), who shared with us his knowledge in sleep neurophysiology and offered us the use of his sleep laboratory. We thank Drs. Weaver and Reppert for providing us with MT1 and MT2 knock-out mice. We also thank Drs Gianpaolo Zara, Alessandro Mauro, Alberto Strada, Julie Carrie, Valerie Mongrain, and Igor Timofeev for their assistance.
G.G., G.T., G.S., A.B., M.M., S.R., and F.F. are inventors of Patent WO/2007/079593 (International Application No. PCT/CA2007/000055; publication date, July 19, 2007). The patent is owned by McGill University and Universities of Urbino, Parma, and Milan. G.G. is the founder of CosmasTherapeutics Development Inc.
References
- Angeloni D, Longhi R, Fraschini E. Production and characterization of antibodies directed against the human melatonin receptors Mel-1a (mt1) and Mel-1b (MT2) Eur J Histochem. 2000;44:199–204. [PubMed] [Google Scholar]
- Boutin JA, Audinot V, Ferry G, Delagrange P. Molecular tools to study melatonin pathways and actions. Trends Pharmacol Sci. 2005;26:412–419. doi: 10.1016/j.tips.2005.06.006. [DOI] [PubMed] [Google Scholar]
- Brzezinski A, Vangel MG, Wurtman RJ, Norrie G, Zhdanova I, Ben-Shushan A, Ford I. Effects of exogenous melatonin on sleep: a meta-analysis. Sleep Med Rev. 2005;9:41–50. doi: 10.1016/j.smrv.2004.06.004. [DOI] [PubMed] [Google Scholar]
- Buscemi N, Vandermeer B, Hooton N, Pandya R, Tjosvold L, Hartling L, Vohra S, Klassen TP, Baker G. Efficacy and safety of exogenous melatonin for secondary sleep disorders and sleep disorders accompanying sleep restriction: meta-analysis. BMJ. 2006;332:385–393. doi: 10.1136/bmj.38731.532766.F6. [DOI] [PMC free article] [PubMed] [Google Scholar]
- Contreras D, Dossi RC, Steriade M. Electrophysiological properties of cat reticular thalamic neurons in vivo. J Physiol. 1993;470:273–294. doi: 10.1113/jphysiol.1993.sp019858. [DOI] [PMC free article] [PubMed] [Google Scholar]
- Deleuze C, Huguenard JR. Distinct electrical and chemical connectivity maps in the thalamic reticular nucleus: Potential roles in synchronization and sensation. J Neurosci. 2006;26:8633–8645. doi: 10.1523/JNEUROSCI.2333-06.2006. [DOI] [PMC free article] [PubMed] [Google Scholar]
- Den Boer JA, Bosker FJ, Meesters Y. Clinical efficacy of agomelatine in depression: the evidence. Int Clin Psychopharmacol. 2006;21:S21–S24. doi: 10.1097/01.yic.0000195661.37267.86. [DOI] [PubMed] [Google Scholar]
- Domich L, Oakson G, Steriade M. Thalamic burst patterns in the naturally sleeping cat—a comparison between cortically projecting and reticularis neurons. J Physiol. 1986;379:429–449. doi: 10.1113/jphysiol.1986.sp016262. [DOI] [PMC free article] [PubMed] [Google Scholar]
- Doolen S, Krause DN, Dubocovich ML, Duckles SP. Melatonin mediates two distinct responses in vascular smooth muscle. Eur J Pharmacol. 1998;345:67–69. doi: 10.1016/s0014-2999(98)00064-8. [DOI] [PubMed] [Google Scholar]
- Dubocovich ML, Yun K, Al-Ghoul WM, Benloucif S, Masana MI. Selective MT2 melatonin receptor antagonists block melatonin-mediated phase advances of circadian rhythms. FASEB J. 1998;12:1211–1220. doi: 10.1096/fasebj.12.12.1211. [DOI] [PubMed] [Google Scholar]
- Dubocovich ML, Hudson RL, Sumaya IC, Masana MI, Manna E. Effect of MT1 melatonin receptor deletion on melatonin-mediated phase shift of circadian rhythms in the C57BL/6 mouse. J Pineal Res. 2005;39:113–120. doi: 10.1111/j.1600-079X.2005.00230.x. [DOI] [PubMed] [Google Scholar]
- Erman M, Seiden D, Zammit G, Sainati S, Zhang J. An efficacy, safety, and dose-response study of Ramelteon in patients with chronic primary insomnia. Sleep Med. 2006;7:17–24. doi: 10.1016/j.sleep.2005.09.004. [DOI] [PubMed] [Google Scholar]
- Espinosa F, Torres-Vega MA, Marks GA, Joho RH. Ablation of Kv3.1 and Kv3.3 potassium channels disrupts thalamocortical oscillations in vitro and in vivo. J Neurosci. 2008;28:5570–5581. doi: 10.1523/JNEUROSCI.0747-08.2008. [DOI] [PMC free article] [PubMed] [Google Scholar]
- Fisher SP, Sugden D. Sleep-promoting action of IIK7, a selective MT2 melatonin receptor agonist in the rat. Neurosci Lett. 2009;457:93–96. doi: 10.1016/j.neulet.2009.04.005. [DOI] [PMC free article] [PubMed] [Google Scholar]
- Fisher SP, Davidson K, Kulla A, Sugden D. Acute sleep-promoting action of the melatonin agonist, ramelteon, in the rat. J Pineal Res. 2008;45:125–132. doi: 10.1111/j.1600-079X.2008.00565.x. [DOI] [PubMed] [Google Scholar]
- Franklin KBJ, Paxinos G. The mouse brain in stereotaxic coordinates. San Diego: Academic; 1997. [Google Scholar]
- Fuentealba P, Crochet S, Steriade M. The cortically evoked secondary depolarization affects the integrative properties of thalamic reticular neurons. Eur J Neurosci. 2004;20:2691–2696. doi: 10.1111/j.1460-9568.2004.03718.x. [DOI] [PubMed] [Google Scholar]
- Gerdin MJ, Masana MI, Ren D, Miller RJ, Dubocovich ML. Short-term exposure to melatonin differentially affects the functional sensitivity and trafficking of the hMT(1) and hMT(2) melatonin receptors. J Pharmacol Exp Ther. 2003;304:931–939. doi: 10.1124/jpet.102.044990. [DOI] [PubMed] [Google Scholar]
- Gottesmann C, Gandolfo G, Arnaud C, Gauthier P. The intermediate stage and paradoxical sleep in the rat: influence of three generations of hypnotics. Eur J Neurosci. 1998;10:409–414. doi: 10.1046/j.1460-9568.1998.00069.x. [DOI] [PubMed] [Google Scholar]
- Holmes SW, Sugden D. Effects of melatonin on sleep and neurochemistry in the rat. Br J Pharmacol. 1982;76:95–101. doi: 10.1111/j.1476-5381.1982.tb09194.x. [DOI] [PMC free article] [PubMed] [Google Scholar]
- Hudson RL, Stepien I, Ginter P, Dubocovich ML. Distinct roles for MT1 and MT2 melatonin (MLT) receptors in MLT-mediated phase shifts of circadian rhythms. Neuropsychopharmacology. 2005;30:S267. [Google Scholar]
- Hunt AE, Al-Ghoul WM, Gillette MU, Dubocovich ML. Activation of MT2 melatonin receptors in rat suprachiasmatic nucleus phase advances the circadian clock. Am J Physiol Cell Physiol. 2001;280:C110–C118. doi: 10.1152/ajpcell.2001.280.1.C110. [DOI] [PubMed] [Google Scholar]
- Jin X, von GC, Pieschl RL, Gribkoff VK, Stehle JH, Reppert SM, Weaver DR. Targeted disruption of the mouse Mel(1b) melatonin receptor. Mol Cell Biol. 2003;23:1054–1060. doi: 10.1128/MCB.23.3.1054-1060.2003. [DOI] [PMC free article] [PubMed] [Google Scholar]
- Jones BE. From waking to sleeping: neuronal and chemical substrates. Trends Pharmacol Sci. 2005;26:578–586. doi: 10.1016/j.tips.2005.09.009. [DOI] [PubMed] [Google Scholar]
- Jones EG. The thalamus. Cambridge, UK: Cambridge UP; 2007. [Google Scholar]
- Kopp C, Rudolph U, Low K, Tobler I. Modulation of rhythmic brain activity by diazepam: GABA(A) receptor subtype and state specificity. Proc Natl Acad Sci U S A. 2004;101:3674–3679. doi: 10.1073/pnas.0306975101. [DOI] [PMC free article] [PubMed] [Google Scholar]
- Lancel M. Role of GABA(A) receptors in the regulation of sleep: Initial sleep responses to peripherally administered modulators and agonists. Sleep. 1999;22:33–42. doi: 10.1093/sleep/22.1.33. [DOI] [PubMed] [Google Scholar]
- Larson J, Jessen RE, Uz T, Arslan AD, Kurtuncu M, Imbesi M, Manev H. Impaired hippocampal long-term potentiation in melatonin MT2 receptor-deficient mice. Neurosci Lett. 2006;393:23–26. doi: 10.1016/j.neulet.2005.09.040. [DOI] [PubMed] [Google Scholar]
- Leland G. Insomnia market. Nat Rev Drug Discov. 2006;5:15–16. doi: 10.1038/nrd1932. [DOI] [PubMed] [Google Scholar]
- Liu C, Weaver DR, Jin XW, Shearman LP, Pieschl RL, Gribkoff VK, Reppert SM. Molecular dissection of two distinct actions of melatonin on the suprachiasmatic circadian clock. Neuron. 1997;19:91–102. doi: 10.1016/s0896-6273(00)80350-5. [DOI] [PubMed] [Google Scholar]
- Mailliet F, Galloux P, Poisson D. Comparative effects of melatonin, zolpidem and diazepam on sleep, body temperature, blood pressure and heart rate measured by radiotelemetry in Wistar rats. Psychopharmacology. 2001;156:417–426. doi: 10.1007/s002130100769. [DOI] [PubMed] [Google Scholar]
- Marshall L, Helgadottir H, Molle M, Born J. Boosting slow oscillations during sleep potentiates memory. Nature. 2006;444:610–613. doi: 10.1038/nature05278. [DOI] [PubMed] [Google Scholar]
- Marshall U, Born J. The contribution of sleep to hippocampus-dependent memory consolidation. Trends Cogn Sci. 2007;11:442–450. doi: 10.1016/j.tics.2007.09.001. [DOI] [PubMed] [Google Scholar]
- Mayers AG, Baldwin DS. Antidepressants and their effect on sleep. Hum Psychopharmacol. 2005;20:533–559. doi: 10.1002/hup.726. [DOI] [PubMed] [Google Scholar]
- Mini L, Wang-Weigand S, Zhang J. Effects of ramelteon 8 mg on latency to persistent sleep in adults with severe sleep-initiation difficulty; post-hoc analysis of a 5-week trial. Sleep. 2007;30:A243. doi: 10.1016/s0149-2918(08)80056-2. [DOI] [PubMed] [Google Scholar]
- Mirmiran M, Pevet P. Effects of melatonin and 5-methoxytryptamine on sleep-wake patterns in the male rat. J Pineal Res. 1986;3:135–141. doi: 10.1111/j.1600-079x.1986.tb00736.x. [DOI] [PubMed] [Google Scholar]
- Mirmiran M, Maas YGH, Ariagno RL. Development of fetal and neonatal sleep and circadian rhythms. Sleep Med Rev. 2003;7:321–334. doi: 10.1053/smrv.2002.0243. [DOI] [PubMed] [Google Scholar]
- Morin CM, LeBlanc M, Daley M, Gregoire JP, Merette C. Epidemiology of insomnia: prevalence, self-help treatments, consultations, and determinants of help-seeking behaviors. Sleep Med. 2006;7:123–130. doi: 10.1016/j.sleep.2005.08.008. [DOI] [PubMed] [Google Scholar]
- Parmentier R, Ohtsu H, Djebbara-Hannas Z, Valatx JL, Watanabe T, Lin JS. Anatomical, physiological, and pharmacological characteristics of histidine decarboxylase knock-out mice: evidence for the role of brain histamine in behavioral and sleep-wake control. J Neurosci. 2002;22:7695–7711. doi: 10.1523/JNEUROSCI.22-17-07695.2002. [DOI] [PMC free article] [PubMed] [Google Scholar]
- Paxinos G, Watson C. The rat brain in stereotaxic coordinates. San Diego: Academic; 2006. [DOI] [PubMed] [Google Scholar]
- Quera Salva MA, Vanier B, Laredo J, Hartley S, Chapotot F, Moulin C, Lofaso F, Guilleminault C. Major depressive disorder, sleep EEG and agomelatine: an open-label study. Int J Neuropsychopharmacol. 2007;10:691–696. doi: 10.1017/S1461145707007754. [DOI] [PubMed] [Google Scholar]
- Rajaratnam SM, Polymeropoulos MH, Fisher DM, Roth T, Scott C, Birznieks G, Klerman EB. Melatonin agonist tasimelteon (VEC-162) for transient insomnia after sleep-time shift: two randomised controlled multicentre trials. Lancet. 2009;373:482–491. doi: 10.1016/S0140-6736(08)61812-7. [DOI] [PubMed] [Google Scholar]
- Rivara S, Lodola A, Mor M, Bedini A, Spadoni G, Lucini V, Pannacci M, Fraschini F, Scaglione F, Ochoa-Sanchez R, Gobbi G, Tarzia G. N-(substituted-anilinoethyl)amides: design, synthesis, and pharmacological characterization of a new class of melatonin receptor ligands. J Med Chem. 2007;50:6618–6626. doi: 10.1021/jm700957j. [DOI] [PubMed] [Google Scholar]
- Ruigt GSF, Vanproosdij JN, Vandelft AML. A large-scale, high-resolution, automated-system for rat sleep staging. 1. Methodology and technical aspects. Electroencephalogr Clin Neurophysiol. 1989;73:52–63. doi: 10.1016/0013-4694(89)90019-9. [DOI] [PubMed] [Google Scholar]
- Steriade M. Coherent oscillations and short-term plasticity in corticothalamic networks. Trends Neurosci. 1999;22:337–345. doi: 10.1016/s0166-2236(99)01407-1. [DOI] [PubMed] [Google Scholar]
- Steriade M, Dossi RC, Nunez A. Network modulation of a slow intrinsic oscillation of cat thalamocortical neurons implicated in sleep delta waves: cortically induced synchronization and brain-stem cholinergic suppression. J Neurosci. 1991;11:3200–3217. doi: 10.1523/JNEUROSCI.11-10-03200.1991. [DOI] [PMC free article] [PubMed] [Google Scholar]
- Stickgold R. Sleep-dependent memory consolidation. Nature. 2005;437:1272–1278. doi: 10.1038/nature04286. [DOI] [PubMed] [Google Scholar]
- Tasali E, Leproul R, Ehrmann DA, Van Cauter E. Slow-wave sleep and the risk of type 2 diabetes in humans. Proc Natl Acad Sci U S A. 2008;105:1044–1049. doi: 10.1073/pnas.0706446105. [DOI] [PMC free article] [PubMed] [Google Scholar]
- Tononi G, Massimini M. Why does consciousness fade in early sleep? Molecular and biophysical mechanisms of arousal, alertness, and attention. Ann N Y Acad Sci. 2008;1129:330–334. doi: 10.1196/annals.1417.024. [DOI] [PubMed] [Google Scholar]
- Urbain N, Creamer K, Debonnel G. Electrophysiological diversity of the dorsal raphe cells across the sleep-wake cycle of the rat. J Physiol. 2006;573:679–695. doi: 10.1113/jphysiol.2006.108514. [DOI] [PMC free article] [PubMed] [Google Scholar]
- van Lier H, Drinkenburg WHIM, van Eeten YJW, Coenen AML. Effects of diazepam and zolpidem on EEG beta frequencies are behavior-specific in rats. Neuropharmacology. 2004;47:163–174. doi: 10.1016/j.neuropharm.2004.03.017. [DOI] [PubMed] [Google Scholar]
- Wan Q, Man HY, Liu F, Braunton J, Niznik HB, Pang SF, Brown GM, Wang YT. Differential modulation of GABAA receptor function by Mel1a and Mel1b receptors. Nat Neurosci. 1999;2:401–403. doi: 10.1038/8062. [DOI] [PubMed] [Google Scholar]
- Wang F, Li JC, Wu CF, Yang JY, Xu F, Zhao Q. The GABA(A) receptor mediates the hypnotic activity of melatonin in rats. Pharmacol Biochem Behav. 2003a;74:573–578. doi: 10.1016/s0091-3057(02)01045-6. [DOI] [PubMed] [Google Scholar]
- Wang F, Li JC, Wu CF, Yang JY, Zhang RM, Chai HF. Influences of a light-dark profile and the pineal gland on the hypnotic activity of melatonin in mice and rats. J Pharm Pharmacol. 2003b;55:1307–1312. doi: 10.1211/0022357021729. [DOI] [PubMed] [Google Scholar]
- Witt-Enderby PA, Bennett J, Jarzynka MJ, Firestine S, Melan MA. Melatonin receptors and their regulation: biochemical and structural mechanisms. Life Sci. 2003;72:2183–2198. doi: 10.1016/s0024-3205(03)00098-5. [DOI] [PubMed] [Google Scholar]
- Zemlan FP, Mulchahey JJ, Scharf MB, Mayleben DW, Rosenberg R, Lankford A. The efficacy and safety of the melatonin agonist beta-methyl-6-chloromelatonin in primary insomnia: A randomized, placebo-controlled, crossover clinical trial. J Clin Psychiatry. 2005;66:384–390. doi: 10.4088/jcp.v66n0316. [DOI] [PubMed] [Google Scholar]