. 2019 Jun 19;8:e43761. doi: 10.7554/eLife.43761

Figure 9. Localization of the hub region in the monkey rACC using dMRI tractography.

(A) A coronal section illustrating the Paxinos atlas in the dMRI space provided by Duke University. (B) A coronal section of the atlas brain showing two example seed masks for areas 11 (red) and 46D (green). (C) A sagittal section of an individual monkey brain showing the probabilistic streamline terminals in the rACC, separately for the seeds in area 11 (red) and 46D (green). Voxels with overlapping terminals were in orange. (D) A sagittal section showing the localized hub in seven individual monkeys. Each red dot marks the center of the hub region in one monkey. The center of the hub was defined by the voxel with the highest weighted-sum of probabilistic streamlines from all 29 seeded areas.

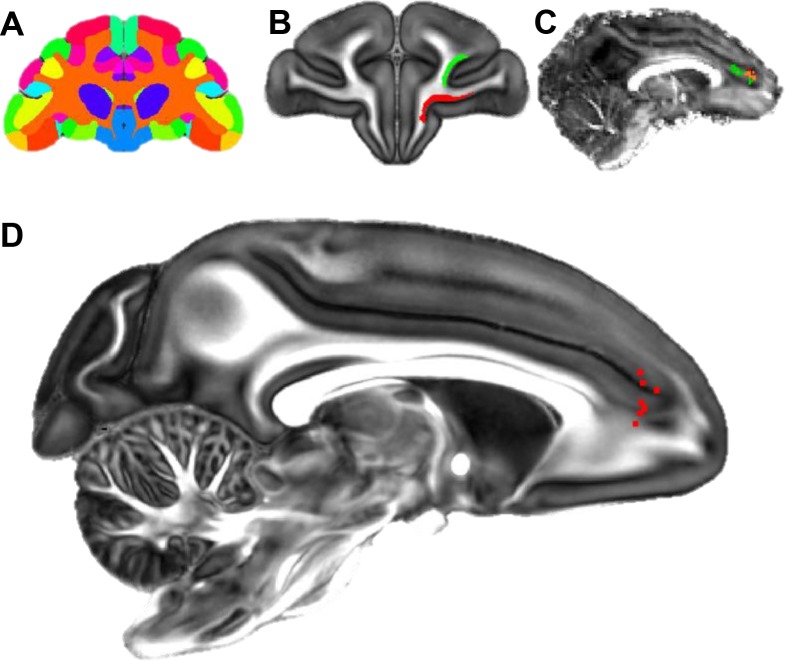
Figure 9.

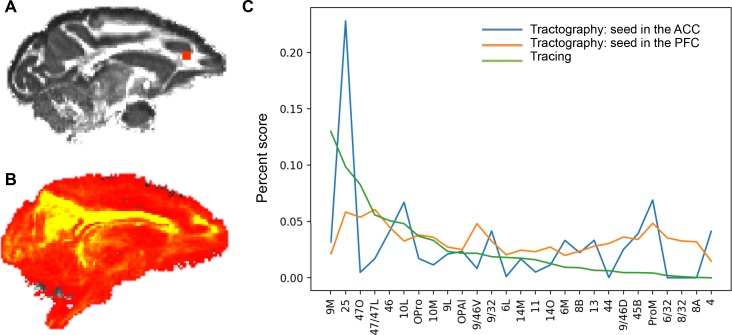
Figure 9—figure supplement 1. Difference in the tract strength pattern due to seeding procedures.

Figure 9—figure supplement 1.

(A) A seed mask in the rACC. (B) Probabilistic map of the streamlines from the rACC seed to all the other voxels in the brain, showing the dominant high values in the cingulum bundle. (C) Comparison of the probabilistic streamline distributions with the tract tracing result. The percent score for tracing is based on cell counts, and that for tractography is based on the tract density between the seed and the target masks (values in the fdt_path output by FSL). The tract strength by seeding the FC areas was more correlated (Pearson’s coefficient = 0.42, p<0.05) with the tract tracing result than that by seeding the rACC (Pearson’s coefficient = 0.17, p>0.05).