

Abstract
Objectives
‘Growing Up in Australia: The Longitudinal Study of Australian Children’ (LSAC) is Australia's only nationally representative children’s longitudinal study, focusing on social, economic, physical and cultural impacts on health, learning, social and cognitive development. LSAC's first decade collected wide-ranging repeated psychosocial and administrative data; here, we describe the Child Health CheckPoint, LSAC’s dedicated biophysical module.
Design, setting and participants
LSAC recruited a cross-sequential sample of 5107 infants aged 0–1 year and a sample of 4983 children aged 4–5 years in 2004, since completing seven biennial visits. CheckPoint was a cross-sectional wave that travelled Australia in 2015–2016 to reach LSAC’s younger cohort at ages 11–12 years between LSAC waves 6 and 7. Parent–child pairs participated in comprehensive assessments at 15 Assessment Centres nationwide or, if unable to attend, a shorter home visit.
Measures
CheckPoint’s intergenerational, multidimensional measures were prioritised to show meaningful variation within normal ranges and capture non-communicable disease (NCD) phenotype precursors. These included anthropometry, physical activity, fitness, time use, vision, hearing, and cardiovascular, respiratory and bone health. Biospecimens included blood, saliva, buccal swabs (also from second parent), urine, hair and toenails. The epidemiology and parent–child concordance of many measures are described in separate papers.
Results
1874 (54% of eligible) parent–child pairs and 1051 second parents participated. Participants' geographical distribution mirrored the broader Australian population; however, mean socioeconomic position and parental education were higher and fewer reported non-English-speaking or Indigenous backgrounds. Application of survey weights partially mitigates that the achieved sample is less population representative than previous waves of LSAC due to non-random attrition. Completeness was uniformly high for phenotypic data (>92% of eligible), biospecimens (74%–97%) and consent (genetic analyses 98%, accessing neonatal blood spots 97%, sharing 96%).
Conclusions
CheckPoint enriches LSAC to study how NCDs develop at the molecular and phenotypic levels before overt disease emerges, and clarify the underlying dimensionality of health in childhood and mid-adulthood.
Keywords: cohort profile, non-communicable disease, biological specimen bank, phenotype, reference values, parents, children, epidemiologic studies, cross-sectional studies, longitudinal studies
Strengths and limitations of this study.
The Child Health CheckPoint aimed to enrich the ongoing Longitudinal Study of Australian Children (LSAC) with sophisticated health assessments and biological samples.
Strengths include LSAC’s existing rich decade-long exposure and administrative data for the child and both parents, and CheckPoint’s collection of cross-generational parent–child assessments paired on time/date of assessment, protocols and equipment; timing of the module to capture early adolescence; and timely public release of data to researchers.
Families living in regional areas or with lower socioeconomic positions are under-represented; however, sample weights are available that enable analyses that are more reflective of the original design sample of Australian children and their families.
For each child participant, only one parent (predominantly the mother) undertook the detailed paired assessments, but the second parent contributed a buccal (DNA) sample, where possible.
Access policies are in place for future extraction of extensive additional data from the digital and biospecimen repositories held at the Murdoch Children’s Research Institute.
Introduction
Worldwide there is a large and growing burden of non-communicable diseases (NCD). Many have their genesis in early life, and develop over decades of cumulative exposures. This provides opportunities to prevent, slow or alter disease trajectories at multiple points of the life course. Wide gradients within the normal range of phenotypes relevant to many later NCDs are already measurable across many body systems from childhood.
It is evident that family, social and other environmental factors interact with an individual’s innate biology (including genetic profile) to create modifiable pathways (such as chronic inflammation) common to multiple NCDs.1 Shonkoff’s biodevelopmental framework of lifecourse determinants of health and their mechanisms proposes that health-promoting and health-threating environmental effects interact with genes and affect later health, via physiological adaptions during sensitive periods and cumulative effects over time.1 These physiological adaptions are the key intermediary step, which may be measured years or decades before overt ill health develops.
’Big picture' research into physiological adaptions and objective health outcomes has shifted from narrowly focused hypothesis-driven studies with a single outcome, towards multidisciplinary and/or multidimensional research with outcomes across multiple domains that recognise the interconnectedness of health.2 3 Around the start of the millennium, many countries launched large-scale birth cohort studies (eg, UK Millennium Cohort,4 Growing Up in Ireland,5 New Zealand,6 Singapore7). Australia’s study, Growing Up in Australia: The Longitudinal Study of Australian Children (LSAC) was intended to provide a strong evidence base for policy development and service delivery on a wide range of issues relating to children’s development and lifetime well-being.8
LSAC is a population-based cohort study from early childhood, and is the country’s only nationally representative children’s longitudinal study. It is broad in scope, surveying lifetime pathways in health, learning and development. Its design incorporates frequent (biennial) and ongoing data collection; multiple study respondents; linkage to lifetime universal parent and child administrative data including healthcare (eg, lifetime primary health services, medication prescriptions dispensed), education (eg, national literacy and numeracy exam results) and census data sets; and open access to the data sets for researchers. The federal government investment into LSAC is yielding major returns that influence policy,9 with several hundred publications in the first decade of the study (listed at http://flosse.fahcsia.gov.au/). Adopting a dual cross-sequential design, LSAC recruited two cohorts in 2004, each comprising ~5000 children. At recruitment, the K cohort children were aged 4–5 years (n=4984 families, 50.4% uptake), and B cohort were aged 0 – 1 year (n = 5107 families, 57.2 % uptake; figure 1). A two-stage random sampling design was applied, first randomly selecting 10% of postcodes (stratified by state and urban/rural locations), then in-age children within those postcodes from the Medicare database.10 Medicare is an Australian government programme within the universal healthcare system that reduces or covers medical visit and medication costs, into which 98% of children are enrolled by their first birthday.10 Very remote postcodes and those with <20 children (n=874 postcodes, 3.2% of population) were excluded. At wave 6 (child age 10–11 years), 74% of the original B cohort were retained; families with Indigenous or non-English-speaking backgrounds, or incomes less than $1000 per week were under-represented in later waves.11
Figure 1.
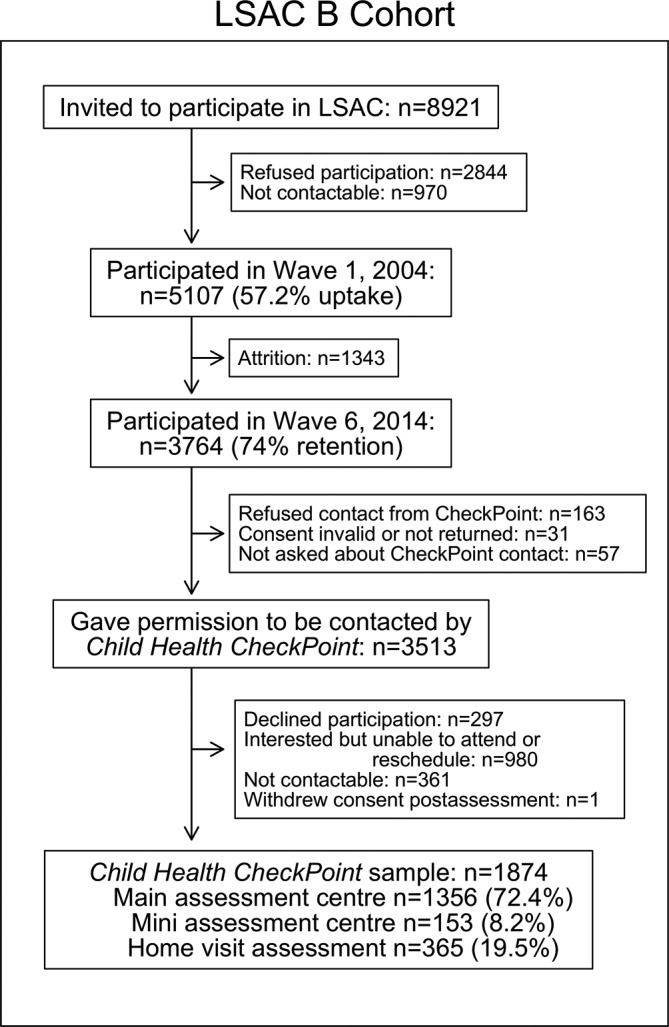
Participant flow chart. LSAC, Longitudinal Study of Australian Children; n, number of families.
Like other government-implemented children’s studies internationally, LSAC has mainly focused on psychosocial and demographic exposures, with all health items except anthropometry and blood pressure being parent-reported or self-reported. A physical health and biospecimen module was beyond the scope of the original study design. There was also uncertainty as to how such a biomarker module might impact (whether positively or negatively) on cohort retention and engagement.
To address this gap, we recently introduced an intergenerational physical health and biomarkers module, the Child Health CheckPoint. This one-off cross-sectional wave, nested between LSAC waves 6 and 7, was offered to the B cohort at child age 11–12 years. CheckPoint’s intergenerational, multidimensional measures were prioritised to show meaningful variation within normal ranges and capture NCD phenotype precursors both in adults and children. Wherever possible we captured raw digital data (eg, images, traces) that would support additional extraction and analysis beyond the core phenotypic summary data (eg, blood pressure readings). The broad set of paired measures, collected on parent–child dyads on the same day with identical equipment, was designed to allow researchers to simultaneously examine multiple phenotypes in both ages as well as the intergenerational transmission of health. In this paper, we describe the Child Health CheckPoint methods and sample characteristics. This allows researchers to understand and make best use of the robust data set and biospecimens. Other papers in this BMJ Open Special Issue explore the epidemiology and parent–child concordance of individual measures in greater depth.12–25
Methods
Study design
LSAC is a longitudinal child cohort study conducted in partnership between the Australian Government Department of Social Services, the Australian Institute of Family Studies and the Australian Bureau of Statistics. It is funded by the Australian Government.
The Child Health CheckPoint was conducted between February 2015 and March 2016 at child age 11–12 years. The CheckPoint was offered to the B cohort because: (A) it contains more detailed pregnancy and birth data; (B) LSAC’s data collections span the children’s entire postnatal lives; (C) by this child age, there is a wide range in normal values of risk factors predicting adult preclinical markers of disease; and (D) experience suggested that the health measurements would be of greater interest (and so attract higher uptake) to children and parents at this age than to the K cohort aged 15–16 years, an age when many birth cohorts experience heightened attrition.26–28
Study development
In 2007, the Department of Social Services commissioned a scoping report on the potential value, content and cost of a physical health and biomarkers module.29 A partnership was formed between LSAC senior management, LSAC researchers and child health researchers new to LSAC with physical health and biomarkers content expertise. In 2012, researchers at the Murdoch Children’s Research Institute (MCRI) partnered with investigators at the University of South Australia, University of Adelaide and Deakin University to form the CheckPoint Investigator Team and to lead a successful application to the Australian National Health and Medical Research Council (NHMRC Project Grant 1041352, 2013-17). This core funding enabled the child cardiorespiratory measures and leveraged additional institutional, competitive (NHMRC Project Grant 1109355, 2016-2020) and philanthropic funding, such that the CheckPoint ultimately encompassed a much wider range of health domains underpinning NCDs across two generations.
Feasibility of core CheckPoint assessments were tested in 2014 within the ‘3C’ study; a longitudinal study of 378 aged 7–17 years in the MCRI’s existing Parent Education and Support (PEAS),30 Live, Eat and Play 2 (LEAP2)31 and Shared Care Obesity Trial in Children (HopSCOTCH)32 cohorts examining cardiovascular outcomes of life course growth, diet and activity.33 34
Late in 2014, we tested the CheckPoint protocol with a vanguard of 52 Victorian LSAC families to fine-tune recruitment, visit flow, timing and feasibility, and test acceptability of the centre-based suite of measures ahead of the much larger bulk of children due to attend in 2015–2016. Child and parent participants prospectively rated enjoyment of each assessment and overall impressions (scored out of 10). Participants were also asked to rate how the CheckPoint module changed their feeling about being in LSAC overall, from 0 (Now I like it much less) to 10 (Now I like it much more).
Participants
LSAC B cohort families who completed a wave 6 home interview were eligible. The study child and one parent were invited to participate in comprehensive health assessments at an Assessment Centre or home visit. Choice of parent and whether or not biological was determined by the family; in practice this ’attending parent' was usually the mother. Second biological parents living with the child, if available, were also invited to participate after the visit by contributing a buccal swab.
Ethical approval and consent
The CheckPoint study was approved by The Royal Children’s Hospital Melbourne Human Research Ethics Committee (33225D) and the Australian Institute of Family Studies Ethics Committee (14-26); the latter also provides ethical review and approval for LSAC at every wave. A parent or guardian provided written consent for their own and their child’s participation in the study. Optional consent was requested for the collection, storage and non-genetic analysis of biospecimens; genetic analyses of these samples; sharing images and samples with other researchers; and access to the child’s birth data and dried newborn heel-prick blood samples that are stored indefinitely by most Australian states. Non-attending biological parents provided written consent for the storage and non-genetic analysis of their buccal swab, and optional consent for genetic analysis was requested. Participants were aware that no health, genetic or other information would be returned to them, beyond a summary of physical health measurements (eg, body mass index, blood pressure) provided at the end of the visit.
Patient and public involvement
Because LSAC is a population-based longitudinal study, no patient groups were involved in its design or conduct. To our knowledge, the public was not involved in the study design, recruitment or conduct of the LSAC study or its CheckPoint module. Parents received a summary health report for their child and themselves at or soon after the CheckPoint assessment visit. They consented to take part knowing that they would not otherwise receive individual results about themselves or their child.
Procedure
Participation in the CheckPoint involved (1) an Assessment Centre or home visit for the child and attending parent, (2) follow-up phone interview for the child, (3) a week of wearing an accelerometer (physical activity monitor) for the child and attending parent, and (4) a buccal (DNA) sample collection at home for the non-attending parent. Assessments and phone interviews were conducted by trained research assistants and students.
Sample recruitment: B cohort families were briefly introduced to the upcoming Child Health CheckPoint during the LSAC wave 6 home interview in 2014. A total of 3513 families (93% of wave 6 families and 69% of original cohort, see figure 1) gave written consent to be contacted by the CheckPoint Team.
Assessment visit types and locations: The core CheckPoint data collection mechanism was the ’pop-up' Main Assessment Centre, set up in seven major Australian cities (online supplementary figure 1) sequentially for between 2 and 8 weeks before being packed up and transported by road to the next location. On each operating day, up to 24 families were invited to attend the Assessment Centre for a 3.5-hour visit.
bmjopen-2017-020261supp001.jpg (143.3KB, jpg)
Road transport between Australian cities can take days. To maximise the size and geographic reach of the sample, ’pop-up' Mini Assessment Centres operated in eight regional cities for up to a week while the bulk of equipment was in transit. The 2.75-hour Mini Assessment Centre visit included most of the assessments offered at the Main Assessment Centres, except those requiring large equipment unable to be checked in as personal luggage on commercial flights. Those unable to attend an Assessment Centre were offered a 1.5-hour home visit with a subset of measures that could be conducted in the home by a trained research assistant (ie, not a phlebotomist) using portable equipment. Home visits occurred in Main Assessment and Mini Assessment Centre cities, and other regional towns.
In total, the study visited over 30 cities and towns over the 1-year data collection period (online supplementary figure 1). The Assessment Centre operated in 15 cities and towns. This number was constrained by the fixed data collection window and budget (ie, substantial time and costs of setting up in each location, regardless of the number of participants seen). The specific locations chosen were the cities and towns with the largest clusters of B cohort participants. Using mapping software, we plotted participants residing within 2 hours’ travel radius of each regional city. If the regional city had the necessary infrastructure for a Mini Assessment Centre and at least 40 eligible families within the radius, we set up a centre; otherwise we offered home visits. Most families (72%) attended a Main Assessment Centre, 8% attended a Mini Assessment Centre and 20% completed a home visit. Table 1 reports the assessments offered at each visit type, and figure 1 the sample size per visit type.
Table 1.
Summary of measures and biological samples collected in CheckPoint assessments
| Construct and measure | Main | Mini | Home | Station | Equipment/instrument* | Data/sample collection protocol in brief | |||
| Ch | P | Ch | P | Ch | P | ||||
| Anthropometry | |||||||||
| Height48 49 | ● | ● | ● | ● | ● | ● |

|
Portable rigid stadiometer (Invicta IP0955, Leicester, UK) | Standing height without shoes or socks, measured ×2, or ×3 if first two measures differed by ≥0.5 cm. |
| Weight and body composition48 49 | ● | ● | ● | ● | ● | ● |

|
4-limb segmental (InBody230, Biospace, Seoul, Korea) or 2-limb (Tanita BC-351, Kewdale, Australia) body composition scales | Weight and body composition wearing light clothing without shoes or socks, measured once. |
| Waist circumference48 49 | ● | ● | ● | ● | ● | ● |

|
Steel anthropometric measuring tape (Lufkin Executive Diameter W606PM, Maryland, USA) | Waist circumference at the narrowest point between the 10th rib and iliac crest, or midpoint between if no visible narrowing. Measured ×2, or ×3 if first two differed by ≥1 cm. |
| Pubertal status | |||||||||
| Pubertal development | ● | ● | ● |

|
Sexual Maturity Scale50
Pubertal Development Scale51 |
Sexual maturity assessed using three sets of images (1 male and 2 female) showing stages of puberty. Pubertal progress assessed using five sex-specific questions. |
|||
| Menstruation | ● | ● | ● | ● | ● | ● |


|
Study-designed questions about menstruation | Self-reported current menstruation (females only). Age of menstruation onset (girls only). |
| Acne | ● | ● | ● |

|
Modified Comprehensive Acne Severity Scale for the face52 | Current acne severity assessed using a sex-specific 5-point pictorial scale. | |||
| Bone and muscle measures | |||||||||
| Bone and muscle morphology, bone density53 54 | ● | ● |

|
Peripheral quantitative CT (pQCT, Stratec XCT 2000L scanner and XCT 2000 software, Birkenfeld, Germany) | Two pQCT scans of the non-dominant lower leg to image bone and muscle density and morphology. Scans taken at 4% (above ankle) and 66% (mid-calf) length of the tibia. | ||||
| Cardiovascular measures | |||||||||
| Carotid intima-media thickness and distensibility55 56 | ● | ● | ● | ● |

|
Portable ultrasound (GE Healthcare Vivid i BT06 with 10 MHz linear array probe, Little Chalfont, UK) with ECG | Performed in supine position with head turned 45° to the left. Probe applied to right side of the neck to capture carotid artery wall images, with concurrent ECG trace. | ||
| Arterial stiffness and blood pressure57 | ● | ● | ● | ● | ● | ● |

|
SphygmoCor XCEL (AtCor Medical, West Ryde, AUS) | Aortic-femoral pulse wave velocity measured ×3, supine, using a tonometer on the neck and blood pressure (BP) cuff on the thigh. Pulse wave analysis (including BP) measured ×3, 1 min apart, using a BP cuff on the arm. |
| Microvascular structure58 | ● | ● |

|
Retinal camera (Canon CR-DGi, Tokyo, Japan), fitted with a digital SLR camera (Canon EOS 60D, Tokyo, Japan) | In a darkened room without mydriasis, two retinal photographs were taken per eye, one focused on the macula and one focused on the optic disc. | ||||
| Respiratory measures | |||||||||
| Lung function | ● | ● | ● | ● | ● | ● |

|
Spirometer59 (Vyntus, CA, USA) and Sentry Suite software (CA, USA) for collection (V.2.10) and download (V.2.17) | Children and parents perform 3–8 maximal exhalation manoeuvres. Children inhale 4 puffs of bronchodilator (Ventolin), wait 10 min and repeat test. |
| Language | |||||||||
| Expressive and receptive language | ● | ● | ● | ● |

|
Recalling Sentences subtest, Pearson Clinical Evaluation of Language Fundamentals–fourth edition, Australian version,60 iPad (Apple, CA, USA) and headphones | Participant recalls and repeats up to 32 recorded spoken sentences of varying length and syntactic complexity. | ||
| Receptive vocabulary | ● | ● | ● | ● | ● | ● |

|
National Institutes of Health Picture Vocabulary test61 (NIH Toolbox software with Cognition package), iPad and headphones | Participant hears word and selects picture best representing the word’s meaning. Adaptive test using computer-based algorithms to quickly approximate and then precisely pinpoint participant ability. |
| Hearing | |||||||||
| Hearing threshold62 63 | ● | ● | ● | ● |

|
Audiometer (Oscilla USB-330, V.3.3.4, Taastrup, Denmark) and Oscilla headphones. Data exported using V.4.0.0 | In a soundproof booth with headphones, participant presses button on hearing sound. Adaptive test: sound presented at increasing and decreasing volume at 4 frequencies (1, 2, 4, 8 kHz). Each ear tested separately. | ||
| Middle ear function64 | ● | ● | ● | ● |

|
Tympanometer (Oscilla TSM300) and AudioConsole software (V.3.3.4) | Tympanometer in ear canal varies air pressure, vibrating the tympanic membrane to measure canal volume, middle ear pressure and compliance. | ||
| Speech reception threshold | ● | ● | ● | ● |

|
Listening in Spatialised Noise–Sentences Test v1.10465 66 (Phonak, NSW, Australia), laptop and headphones (Sennheiser HD215, Wedemark, Germany) | In a soundproof booth with headphones, participant repeats sentences at varying volume against fixed-volume background conversation. Adaptive test; computer algorithms pinpoint threshold. | ||
| Diet and food choices | |||||||||
| Food choices | ● | ● |

|
Digital weight scales accurate to 1 g (Breville, BSK500BSS) | Participant provided with a food box with prepacked snack food items to eat during a 15 min break. Boxes on different days randomised to differ by box size and food amount. Uneaten food weighed at end of session. | ||||
| Physical activity and time use | |||||||||
| Physical activity, sedentary behaviour, sleep67 | ● | ● | ● | ● | ● | ● |

|
Wrist-worn accelerometer (GENEActiv Original, Cambs, UK) and self-report activity log | Triaxial accelerometer worn on non-dominant wrist for 8 days. Participant records type of day (school, non-school), sleep times and activities with device off. |
| Time use | ● | ● | ● |

|
Multimedia Activity Recall for Children and Adults35 68 69 programme | Activities recalled from the previous 24–48 hours, in increments of ≥5 min. 2–3 days recalled, including one school and one non-school day. | |||
| Strength and fitness | |||||||||
| Eurofit broad jump70 | ● | ● | ● |

|
Gym mat and measuring tape (Lufkin L610CME, Maryland, USA) | Participant jumps horizontally from a standing start with double-leg take-off. After a practice jump, the distances of 3 jumps (measured in cm) are recorded. | |||
| PWC170 VO2 max test71 | ● |

|
Exercise bike (Monark 928G3, Manila, Philippines) and chest-worn heart rate monitor (Polar FT4, Smeaton Grange, Australia) | Warm up, then cycle at 60 RPM for 3×2 min bouts. Resistance increases as per heart rate at end of each bout. Aerobic work capacity (VO2max) estimated. | |||||
| Vision | |||||||||
| Visual acuity | ● | ● | ● | ● |

|
Computerised adaptive Freiburg Visual Acuity and Contrast Test72 with Landolt C optotypes (FrACT V.3.8.2, Breisgau, Germany) | Participant identifies optotypes (shapes) from 3 m. Right and left eyes tested separately, without glasses or contact lenses. Adaptive test; computer algorithms adjust size of optotypes presented to determine visual acuity. If visual acuity <1.0, test repeated with pinhole lens. | ||
| 2D and 3D oral photography | |||||||||
| 2D and 3D oral photography | ● | ● | ● | ● |

|
2D photography–Digital SLR camera (Canon 70D, Tokyo, Japan) 3D photography–3-pod 3D camera (3dMD Trio System, Georgia, USA) |
2D photos of the dorsum of extruded tongue; then with lip retractors in place, teeth in occlusion and slightly apart with lower incisal edges visible. 3D photo of teeth in occlusion with lip retractors in place. | ||
| 3D facial photography | ● | ● |

|
3-pod 3D camera (3dMD Trio System) | 3D photo of the face (neutral expression, hair pulled back in net to show hairline), ears and under chin. | ||||
| Written story | |||||||||
| Handwriting, written language | ● | ● | ● |

|
Pen, paper. Using protocol adapted from 1958 National Child Development Study (UK)73 | Child writes a short story about what they think their life will be like when they are 25 years old. | |||
| Well-being and quality of life | |||||||||
| General well-being | ● | ● | ● |

|
International Survey of Children’s Well-Being74 75
Pediatric Quality of Life (PedsQL) 4.0 General Well-Being Scale76 |
6-item measure of subjective well-being. 7-item measure of quality of life and general well-being. |
|||
| Health-related quality of life | ● | ● | ● |

|
PedsQL 4.0 Generic Core Scale76 | 23-item measure of physical and psychosocial health, yielding total, physical and psychosocial summary scores. | |||
| ● | ● | ● |

|
Assessment of Quality of Life 8D Scale77 | 35-item measure of health-related quality of life. Overall utility score and dimension scores calculated. | ||||
| ● | ● | ● | ● | ● | ● |


|
Child Health Utility 9D78 | 9-item measure of health-related quality of life. Overall utility score calculated. | |
| Pain | |||||||||
| Pain | ● | ● | ● | ● | ● | ● |


|
Pain severity questions79 with pain manikin adapted for online administration80 | Asked about pain >1 day in past month; if yes, when started, and (children only) which body regions. |
| Diet | |||||||||
| Diet | ● | ● | ● | ● | ● | ● |


|
Adapted National Secondary Students’ Diet and Activity81 questions, supplemented with adapted International Study of Childhood Obesity, Lifestyle and Environment82 items | 26-item brief food frequency survey of usual intake of a range of different foods including fruits and vegetables. |
| Allergy and eczema | |||||||||
| Family allergies and pet exposure | ● | ● | ● |

|
Allergy and pet exposure questions from the HealthNuts study83 84; parent reported | Branched questionnaire items about child’s siblings and parent’s history of asthma, eczema, hay fever, latex/insect/food allergy and the family’s pets. | |||
| Colouring | |||||||||
| Natural skin, hair and eye colouring | ● | ● | ● | ● | ● | ● |

|
Questions adapted to self-report format from Paediatric Autoimmune Disease study85 colour chart; parent reported | 3-item measure of the natural skin, hair and eye colour of both the child and parent. |
| Medications and supplements | |||||||||
| Current medications and supplements | ● | ● | ● |

|
Medications and supplement questions modified from LSAC28; parent reported | Branched questionnaire items about the child’s medication and supplement use. | |||
| Health, welfare and community services | |||||||||
| Hospital admissions and health insurance | ● | ● | ● |

|
Child lifetime hospitalisations, healthcare card and insurance coverage questions modified from LSAC28; parent reported | Branched questionnaire items about child’s lifetime hospital admissions (including age, diagnosis), and concession card/private health insurance coverage. | |||
| Health service use | ● | ● | ● |

|
Use of service questions modified from LSAC28; parent reported | Branched questionnaire items about child’s health service use and parent time spent on service use. | |||
| Community participation | ● | ● | ● |

|
Community activity use questions modified from LSAC28; parent reported | Branched questionnaire on community activity participation (eg, team sports, music) in last year. | |||
| Biological samples | |||||||||
| Venous blood | ● | ● | ● | ● |

|
S-Monovette Vacutainer: 2.7 mL K3 EDTA (05.1167.001), 9 mL K3 EDTA (02.1066.001), 7.5 mL lithium heparin liquid (01.1608.001), 9 mL serum gel with clotting activator (02.1388.001), Sarstedt, Australia | Approximately 28 mL blood from non-dominant arm of semireclining (45°), semifasted participants, processed into 0.5 mL aliquots. Up to 6 EDTA plasma, 6 EDTA buffy coat, 6 LiH plasma, 6 LiH buffy coat (viable cells) and 6 sera per participant. In addition, either a whole blood clot or 3 whole blood aliquots and a dried blood spot (see next row). All serum, plasma and clot samples frozen directly at −80°C on site, while buffy coat aliquots were prepared in a freeze mix (10% fetal bovine serum+10% dimethyl sulfoxide+80% basal medium eagle) and placed within CoolCells (BioTools, Australia) prior to control the rate of freezing at −80°C to maximise cell viability. | ||
| Dried blood spot | ● | ● | ● | ● | ● | ● |
|
Lancet (1.6 mm (No 85.1018) or 1.8 mm (No 85.1016) depth, Sarstedt Australia), Guthrie card | Card used for newborn screening is blotted with four drops of blood, collected via either a finger prick or pipetting a small amount of the venous whole blood sample. Stored at room temperature. |
| Urine | ● | ● | ● | ● | ● | ● |

|
70 mL screw cap polypropylene sterile pot (No 75.9922.731, Sarstedt, Australia) | Participant collects random urine sample into sterile urine pot, pipetted into 12×0.7 mL aliquots. Stored at −80○C on site. |
| Saliva | ● | ● | ● | ● |
|
50 mL polypropylene sterile tube (FAL352070, Falcon, Corning, NY, USA) | 5 min passive saliva drool into sterile tube. Sample weighed, then pipetted into 6×0.5 mL aliquots. Stored at −80°C on site. | ||
| Buccal swab | ○ | ● | ● ○ |
● | ● ○ |

|
Buccal swab (Oracollect DNA OCR-100, The Hague, Netherlands. If not available, FloqSwab, COPAN Flock Technologies, Brescia, Italy was used). | Participant rubs swab over gums/inner cheeks. OCR-100: immerses swab in the preserving liquid, seals tube. Aliquoted into 2×0.5 mL aliquots. FloqSwab: seals swab in air-tight container. Stored at room temperature then −80°C. |
|
| Hair | ● | ● | ● | ● |

|
String, aluminium foil, envelope, scissors | Two locks of hair (4 mm in diameter) tied with string and cut close to the scalp from the occipital area under the crown. Hair wrapped in aluminium foil (scalp end identified) and stored in a barcoded envelope at room temperature. | ||
| Toenails | ● | ● | ● |

|
Scissors, envelope | Clean toenails >3 mm trimmed from right big toe (if not available, left big toenail or fingernails) and stored at room temperature in barcoded envelope. | |||
Questionnaire measures are self-reported, unless indicated they were parent reported.
*All questionnaire items administered by iPad or laptop, except the pain manikin, which was completed on paper at home visits. For brevity, iPad or laptop is not listed for every questionnaire item. Open circles indicate sample collected from non-attending parent.
2D, two dimensional; 3D, three dimensional; Ch, data/sample collected relates to child participant; FrACT, Freiburg Visual Acuity and Contrast Test; LiH, lithium heparin; LSAC, Longitudinal Study of Australian Children; NIH, National Institutes of Health; P, data/sample collected relates to parent participant; VO2max, maximum volume of oxygen consumed.
Assessment sequence: Participants completed the assessments in a standard sequence (figure 2), designed to minimise interdependencies between measures. Bronchodilator administration (which may alter cardiovascular parameters) followed cardiovascular measures, and the snack station was scheduled after saliva and semifasting blood collection, but before exercise.
Figure 2.

Assessment sequence, by participant and visit type. Oblong box indicates child and parent attended the station together. Parents attended the Young Bloods stations twice; first for their own blood collection, then to accompany their child. Food Stop included consumption experiment at the Main Assessment Centre (ie, data collected), but was simply offering refreshments at the Mini Assessment Centre (ie, no data collected). The NIH Vocabulary Picture Test was administered in Bone Zone at the Main Assessment Centre, and as part of Sit and Click in Mini Assessment Centre and home visits. In home visits, Sit and Click (child questionnaire) had allocated time between other assessments; for the Assessment Centre visits, Sit and Click did not have an allocated time or physical location (children completed the questionnaire in downtime at other stations). Postvisit activities (ie, accelerometry, child follow-up phone interview and non-attending parent buccal swab) are not included in the diagram and followed the same protocol regardless of visit type.
The visit started with the parent providing consent, while the child wrote their story at Life at 25. At Assessment Centres, participants were then given a carry bag containing an iPad to complete the questionnaire, water bottle and urine sample collection kit, and a lanyard showing the order of data collection stations to visit. Participants advanced every 15 min from one station to the next (except child Lung Fun which was 30 min duration), following the previous participant in their journey around the Centre. Most stations were conducted one-on-one, but in some the study child and attending parent were both present (CheckPoint Check-in, Measure Up, Tooth Booth, Bone Zone, child Young Bloods and Endgames, see figure 2), and two children could be present at any one time for Life at 25, Jumping Beans and Bike Hike.
Prior to the last station Endgames, participants could take extra time to complete their questionnaire or provide a urine sample. At Endgames, a staff member explained the contents of a take-home pack. The child and parent were fitted with their wrist-worn accelerometers, and a follow-up phone interview was booked/confirmed for the child to complete additional time-use diaries.35 The take-home pack also included a reply-paid express post satchel, child and parent activity log cards, non-attending parent buccal sample collection kit (as applicable), summary of health results collected on the day, and thank you gifts and token reimbursement for travel.
Home visit consent, assessments and take-home packs used the same protocol as the Assessment Centres and included at least one measure from every major health domain; however, some assessments were omitted (table 1). The home visit sequence generally mirrored the centre flow, with minor adjustments to allow one staff member to assess both child and parent within the available time. Dried blood spot, urine and buccal swabs were obtained, and urine processing was delayed when local laboratory facilities were not available.36
Research assistants and students were trained by experts, and real-time quality checks were undertaken throughout the data collection period. These checks included data range checks integrated into the data entry forms; dynamic data completeness checks for each participant during and at the end of their visit, with gaps redressed by a dedicated staff member before departure; weekly completeness checks for the study overall and ongoing process modifications to address all causes of missing data identified; random visual checks of the data to identify and fix any developing departures from protocol; and ongoing staff training, time trials and testing knowledge of standard operating procedures. Inter-rater and intrarater reliability for data transcription and scoring was calculated, where relevant and possible. Data collection reliability was not available as the participant flow precluded repeated measures of same individual.
Measures
Measures and biological samples collected are briefly described in table 1. Other papers of this BMJ Open Special Issue 12–25 provide greater detail, epidemiological description and parent-child concordance for many of these; and their rationale has been previously published.37 Data were collected electronically via specialist medical equipment/software or, where not possible, staff entered data into REDCap (Research Electronic Data Capture) electronic data collection tools.38 REDCap was also used to administer the child and parent questionnaires on iPads. Data collection and data processing standing operating procedures are available (see http://www.checkpoint-lsac.mcri.edu.au). Measures were offered to both children and parents; however, the parent flow omitted the exercise stations (Bike Hike and Jumping Beans), time-use diary, postbronchodilator spirometry and toenail samples. Instead, parents completed a more detailed questionnaire about their child’s healthcare (including hospitalisations), medications and use of community services; and their own health-related quality of life.
Biospecimen collection and repository: Biospecimens collected are described in table 1. Samples (except buccal swabs) were processed within hours in an on-site laboratory set up at all Main Assessment and most Mini Assessment Centres. Blood and saliva samples were generally processed within an hour (blood: range 1 min to 3.8 hours, median 53 min; saliva: range 1 min to 5.7 hours, median 44 min). Urine sample processing was delayed if collected away from a laboratory; 56% of urine samples processed within 3 hours (range 1 min to 9 days, median 71 min).36 At the completion of each Assessment Centre, a single batch of all frozen samples was shipped on dry ice to the Melbourne Children’s Bioresource Centre (at the MCRI) for long-term storage at −80°C (except buffy coat aliquots are stored in vapour phase liquid nitrogen). A temperature data logger was included in each shipment to confirm optimal temperature throughout. All other samples, kept at room temperature, were transported at the same time. All samples are stored in a deidentified manner and are only identified for extraction from the repository. Newly derived biospecimen data are linked to the participant by an external staff member using a linkage key. Samples were tracked using QR code scanners and FreezerPro Enterprise (RuRo, Maryland, USA) software. Frozen samples are stored in boxes of 96 aliquots, and aliquot picking is undertaken by hand (ie, not automated by robot). As of April 2019, completed biomarker analyses for all parents and children with relevant samples were serum metabolomics (http://www.nightingalehealth.com),22 39 40 urinary albumin-creatinine ratio,19 telomere length16 and genotyping; micronutrient and one-carbon pathway analyses were under way.
Data access
The LSAC data are available to researchers under licence, and from early 2019 include the first tranche of completed parent and child CheckPoint data. The LSAC website explains access to these data
(http://www.growingupinaustralia.gov.au/data/dataaccessmenu.html).
It is intended that all further CheckPoint data and biospecimens will also be accessible to all researchers. Applications to undertake new data extraction and biosamples, or to collaborate with CheckPoint investigators on in-train funded new data, are considered by CheckPoint’s Data/Biospecimens Access Committees (see http://www.checkpoint-lsac.mcri.edu.au).
Statistical analyses
Sample characteristics, sample size and consent rates were described as counts, proportions, means and SDs. Baseline demographic characteristics of LSAC families who did and did not participate in CheckPoint were compared to consider the representativeness of the maintained CheckPoint sample in relation to preceding LSAC waves.
Survey weights
CheckPoint survey weights were created41 using methods similar to those used for previous waves of LSAC, and are provided in the CheckPoint data set. These methods account for the selection probability of each child to establish the target design sample, initial non-response to the baseline survey and subsequent loss to follow-up. LSAC and CheckPoint survey weights have been estimated to reflect the likelihood of participation from wave to wave within the limits of the information available from study measures.
Applying LSAC survey weights produces analyses that will be as representative as possible for all Australian children born in 2004 and their parents. CheckPoint differs in that, for the majority of measures, only the attending parent (usually the mother) was assessed, and thus weighted analyses of the parent data are more difficult to interpret because the weighting does not estimate a representative sample of all parents.
Results
Below we summarise the vanguard participants' evaluation of the CheckPoint module. We then describe B cohort recruitment and reasons for non-participation in the CheckPoint module, and demographic characteristics of CheckPoint participants and non-responders. Lastly, we summarise data completeness for each measure, and biospecimen collection and consent rates.
In 2014, ahead of the main data collection wave, the vanguard families reported high levels of enjoying the CheckPoint visit (mean out of 10: children 8.8, parents 8.2), recommending it to others (children 7.7, parents 9.0) and valuing the child health report provided on the day (children 7.7, parents 8.2). Children and parents were also asked if participating in the CheckPoint had changed how they feel about being in the LSAC study (from 1 ’Like it much less' to 10 ’Like it much more'); on average, participants liked LSAC more after their CheckPoint visit (mean: children 8.4, parents 7.7).
The CheckPoint sample size was fixed by LSAC retention to wave 6. Of a total of 3764 families who participated in wave 6, there were 3513 (93%) consented to CheckPoint contact, 3152 (84%) provided valid contact details and were invited into CheckPoint and 1875 (50%) participated (figure 1). One family withdrew consent after assessment. Thus, the CheckPoint analytic sample included 1874 parent–child pairs, plus 1051 non-attending resident parents.
Most non-participation (60%) was due to inability to attend or reschedule a visit during the short period CheckPoint was in each location. Far fewer families declined (18%).
Demographic characteristics of the CheckPoint sample and non-responders are summarised in table 2. Within the CheckPoint sample, 99% of attending parents and all non-attending participants were a biological parent of the study child. There was an equal distribution of boys and girls. However, the sample of attending parents did not equally or randomly comprise mothers and fathers, since each family decided which parent or guardian attended and most (88%) attending parents were mothers. Almost 90% of attending parents were nominated ‘Parent 1’ (ie, the parent who knows the child best and completes the main questionnaire) in previous LSAC waves. The majority of CheckPoint families lived in major cities, with a distribution across the states and territories similar to the Australian population. Larger proportions of families were in the higher socioeconomic position quintiles than in the Australian population. Detailed comparisons of the LSAC sample to the Australian population have been published previously.11 42
Table 2.
Child Health CheckPoint sample characteristics
| Characteristic Values are %, unless indicated |
Sample characteristics at CheckPoint (2015–2016)* n=1874 families | Baseline characteristics (2004)† | |
| In CheckPoint n=1874 families | Not in CheckPoint n=3233 families | ||
| Child age in years, mean (SD) | 12.4 (0.4) | 0.8 (0.2) | 0.8 (0.2) |
| Parent age in years, mean (SD) | 44.4 (5.2) | 32.1 (4.9) | 30.4 (5.7) |
| Female child | 49.0 | 49.0 | 48.9 |
| Female parent | 87.7 | 98.7 | 98.5 |
| Child accompanied by biological parent | 98.9 | 99.7 | 99.7 |
| Child has indigenous background | 2.0 | 2.0 | 6.0 |
| Parent born in Australia | 79.0 | 79.3 | 81.2 |
| Parent home language not English | 10.8 | 11.2 | 16.3 |
| Area of residence¶ | |||
| Major city | 70.3 | 70.5 | 64.0 |
| Inner regional | 20.3 | 18.0 | 20.6 |
| Outer regional | 8.7 | 9.9 | 12.8 |
| Remote | 0.8 | 1.6 | 2.6 |
| Australian state/territory of residence | |||
| Australian Capital Territory | 2.8 | 2.9 | 1.6 |
| Northern Territory | 1.6 | 2.4 | 1.3 |
| New South Wales | 28.6 | 29.9 | 32.6 |
| Queensland | 21.5 | 20.0 | 20.1 |
| South Australia | 8.0 | 7.5 | 6.4 |
| Tasmania | 3.3 | 3.2 | 1.6 |
| Victoria | 22.5 | 22.2 | 25.8 |
| Western Australia | 11.8 | 11.8 | 9.7 |
| Socioeconomic position,** mean (SD) | 0.2 (1.0) | 0.3 (1.0) | −0.2 (1.0) |
| Neighbourhood disadvantage index††, mean (SD) and % in national quintiles | 1023 (60) | 1019 (61) | 1003 (59) |
| 1 (least disadvantaged quintile) | 34.8 | 29.0 | 18.9 |
| 2 | 23.4 | 20.3 | 19.8 |
| 3 | 18.8 | 19.3 | 21.6 |
| 4 | 14.8 | 19.8 | 21.7 |
| 5 (most disadvantaged quintile) | 8.2 | 11.6 | 18.1 |
| Parent’s highest level of education | |||
| Did not complete high school | 20.1 | 21.4 | 39.0 |
| High school | 44.4 | 42.3 | 39.9 |
| Undergraduate degree (Bachelor) | 23.6 | 26.6 | 15.5 |
| Postgraduate degree | 11.9 | 9.7 | 5.7 |
| Attending parent’s employment status | |||
| Working full time (≥30 hours/week) | 46.9 | 31.8 | 22.4 |
| Working part-time | 37.4 | 2.7 | 1.6 |
| Not currently working | 15.7 | 65.5 | 76.0 |
| Parent has a spouse/partner | 88.1 | 95.7 | 91.3 |
*Data collected in CheckPoint 2015–2016 wave, except child Indigenous background collected at wave 1 (2004), and parent birth country, home language, educational qualifications and employment status; and family socioeconomic position collected at wave 6 (2014). Parent data=CheckPoint ’attending parent'.
†Data collected in wave 1 (2004). Parent data=’Parent 1'. CheckPoint attending parent is the wave 1 Parent 1 for 89.3% of families.
¶Australian Bureau of Statistics (ABS) Remoteness Area Code.86
**Longitudinal Study of Australian Children (LSAC)-derived family socioeconomic position z-score.87 Higher scores=greater advantage.
††ABS Socio-Economic Indexes for Areas Index of Relative Socio-Economic Disadvantage.88
Compared with B cohort families who did not take part in the CheckPoint, table 2 shows that participating families at baseline (2004) reported higher socioeconomic position and parental education, and lower likelihood of non-English-speaking or indigenous backgrounds.
Data completeness for each measure was high (table 3) at >92% of participants eligible for each measure, except for accelerometry and child pain. A shortage of accelerometers at certain points over the data collection period meant physical activity data were available for 74% of children and 77% of parents. Initial problems with the branching architecture of questions36 meant pain data were available for only 85% of children (but 99% of parents). The most common reasons for missing data were the measure not being included in all visit types, followed by equipment unavailability, participant refusal and erroneous data removed in the preparation of the data set.36 Data from all of the measures listed in table 3 are included in the first CheckPoint data release in early 2019, except the handwritten story; retinal, oral and facial photographs; and telomere length.
Table 3.
Sample size by measure and participant group
| Construct | Measure | Children | Parents | Parent–child pairs | 2019 Data release | ||
| n=1874 | All n=1874 | Biological n=1854 | All n=1874 | Biological n=1854 | |||
| Anthropometry | Height, weight | 1873 (99.9) | 1865 (99.5) | 1845 (98.5) | 1864 (99.5) | 1844 (98.4) | ● |
| Body composition* | 1859 (99.2) | 1844 (98.4) | 1824 (97.3) | 1837 (98.0) | 1817 (97.0) | ● | |
| Pubertal status | Puberty Development, Sexual Maturity scales | 1807 (96.4) | – | – | – | – | ● |
| Menstruation† | 844 (45.0) | 1610 (85.9) | 1598 (85.3) | 740 (39.5) | 733 (39.1) | ● | |
| Modified Comprehensive Acne Severity Scale | 1762 (94.0) | – | – | – | – | ● | |
| Bone, muscle | Peripheral quantitative CT | 1271 (67.8) | 1250 (66.7) | 1240 (66.2) | 1231 (65.7) | 1222 (65.2) | ● |
| Cardiovascular | Carotid intima-media thickness | 1489 (79.5) | 1476 (78.8) | 1463 (78.1) | 1462 (78.0) | 1449 (77.3) | ● |
| Pulse wave velocity, pulse wave analysis | 1836 (98.0) | 1790 (95.5) | 1773 (94.6) | 1769 (94.4) | 1752 (93.5) | ● | |
| Blood pressure | 1777 (94.8) | 1749 (93.3) | 1732 (92.4) | 1682 (89.8) | 1666 (88.9) | ● | |
| Microvascular structure (retinal photography) | 1307 (69.7) | 1317 (70.3) | 1307 (69.7) | 1292 (68.9) | 1282 (68.4) | ||
| Respiratory | Spirometry | 1759 (93.9) | 1774 (94.7) | 1754 (93.6) | 1688 (90.1) | 1668 (89.0) | ● |
| Language | Expressive and receptive language (Recall' Sent) | 1441 (76.9) | 1446 (77.2) | 1433 (76.5) | 1415 (75.5) | 1402 (74.8) | ● |
| Receptive vocabulary (NPVT) | 1443 (77.0) | 1457 (77.7) | 1444 (77.1) | 1401 (74.8) | 1389 (74.1) | ● | |
| Hearing | Pure tone audiometry | 1488 (79.4) | 1493 (79.7) | 1480 (79.0) | 1480 (79.0) | 1467 (78.3) | ● |
| Tympanometry | 1099 (58.6) | 1101 (58.8) | 1092 (58.3) | 1065 (56.8) | 1056 (56.4) | ● | |
| Speech reception threshold (LiSN-S) | 1483 (79.1) | 1482 (79.1) | 1469 (78.4) | 1466 (78.2) | 1453 (77.5) | ● | |
| Diet and food choices | National Secondary Students’ Diet and Activity | 1846 (98.5) | 1862 (99.4) | 1846 (98.5) | 1837 (98.0) | 1821 (97.2) | ● |
| Snack observation | 1294 (69.1) | 1246 (66.5) | 1235 (65.9) | 1205 (64.3) | 1195 (63.8) | ● | |
| Physical activity, time use | Accelerometry | 1382 (73.7) | 1440 (76.8) | 1424 (76.0) | 1223 (65.3) | 1209 (64.5) | ● |
| Time-use diary (MARCA) | 1830 (97.7) | – | – | – | – | ● | |
| Strength and fitness | Eurofit broad jump | 1771 (94.5) | – | – | – | – | ● |
| PWC170 VO2max test | 1301 (69.4) | – | – | – | – | ● | |
| Vision | Freiburg Visual Acuity Test | 1494 (79.7) | 1491 (79.6) | 1478 (78.9) | 1481 (79.0) | 1468 (78.3) | ● |
| 2D and 3D photography | 2D and 3D photos of teeth and tongue | 1486 (79.3) | 1480 (79.0) | 1467 (78.3) | 1478 (78.9) | 1465 (78.2) | |
| 3D photos of face | 1331 (71.0) | 1316 (70.2) | 1305 (69.6) | 1313 (70.1) | 1302 (69.5) | ||
| Handwriting, written language | Handwritten story about life at age 25 | 1811 (96.6) | – | – | – | – | |
| General well-being | ISCW and PedsQL General Well-Being | 1860 (99.3) | – | – | – | – | ● |
| Health-related quality of life | PedsQL, Child Health Utility 9D, AQoL-8D‡ | 1854 (98.9) | 1871 (99.8) | 1853 (98.9) | 1854 (98.9) | 1836 (98.0) | ● |
| Pain | Pain§ | 1586 (84.6) | 1859 (99.2) | 1843 (98.3) | 1576 (84.1) | 1562 (83.4) | ● |
| Natural colouring | Skin, hair and eye colour | 1859 (99.2) | 1859 (99.2) | 1843 (98.3) | 1859 (99.2) | 1843 (98.3) | ● |
| Medications, supplements | Current medications and supplements | 1853 (98.9) | – | – | – | – | ● |
| Health, welfare and community services |
Health service use, hospital admissions | 1874 (100.0) | – | – | – | – | ● |
| Community participation and services | 1822 (97.2) | – | – | – | – | ● | |
| Serum metabolites | NMR metabolomics platform | 1180 (63.0) | 1325 (70.7) | 1313 (70.1) | 1139 (60.8) | 1133 (60.5) | ● |
| Renal function | Urinary albumin and creatinine concentration | 1579 (84.3) | 1671 (89.2) | 1653 (88.2) | 1535 (81.9) | 1518 (81.0) | ● |
| Biological ageing | Telomere length | 1206 (64.4) | 1343 (71.7) | 1330 (71.0) | 1151 (61.4) | 1143 (61.0) | |
Values are n (%) of participants or pairs with data available. These may differ slightly from sample sizes presented in other CheckPoint papers in this BMJ Open Special Issue, where authors have restricted analyses to participants meeting specified levels of data quality or completeness. ’All parents' and ’all parent–child pairs' include biological and non-biological (eg, step, adoptive or biological relatives other than mother or father) parent–child relationships. Parent–child pairs include families where both the child and the parent have data available for that measure.
*381 children and 344 parents have body fat % measured using a two-limb BIA scale at home visits; the remainder have detailed body composition measured using a four-limb BIA scale.
†Girls were asked ’has menstruation started' and ’are you menstruating today?' and women were asked ’are you menstruating today?'
‡Children completed the PedsQL, parents completed the AQoL-8D and both children and parents completed the Child Health Utility 9D.
§Parents completed a subset of the pain questions completed by children.
AQoL-8D, Assessment of Quality of Life 8D; BIA, bioelectrical impedance analysis; ISCW: International Survey of Children’s Well-Being; LiSN-S, Listening in Spatialised Noise–Sentence Test; MARCA, Multimedia Activity Recall for Children and Adults; NMR, nuclear magnetic resonance; NPVT, National Institute of Health Picture Vocabulary Test; PedsQL, Pediatric Quality of Life.
Biospecimen collection rates were also high (table 4) for blood (venous or finger prick, 91% of children and 96% of attending parents) and other biological samples (>70%). Most (95%) of children and parents had either a saliva (collected when laboratory facilities were available) or buccal swab (stable for 60 days before processing) sample. Consent was obtained for ≥97% of samples to be shared with other researchers and used for genetic analyses, and for ≥94% of participants' digital images to be shared with other researchers and child perinatal birth data and neonatal blood spots be accessed. Buccal samples were also collected from 1051 non-attending parents (of whom 94% consented to share, and 98% to undertake genetic analyses). In total, 1021 (55%) families have at least one sample available for the child and both biological parents.
Table 4.
Data/sample collection rates and consent for use of images/sample
| Measure or sample | Children n=1874 | Attending parents n=1874 | ||||
| Data/sample collected | Consent to share | Consent to genetic analyses | Data/sample collected | Consent to share | Consent to genetic analyses | |
| Digital images (photos) | ||||||
| 2D and 3D teeth | 1486 (79.3) | 1398 (94.1) | – | 1480 (79.0) | 1397 (94.4) | – |
| 3D face | 1331 (71.0) | 1251 (94.0) | – | 1316 (70.2) | 1241 (94.3) | – |
| Retinal | 1307 (69.7) | 1229 (94.0) | – | 1317 (70.3) | 1240 (94.2) | – |
| Perinatal birth data* | 1838 (98.1) | – | – | – | – | – |
| Newborn Guthrie card* | 1810 (96.6) | 1760 (97.2) | 1775 (98.1) | – | – | – |
| Blood | 1701 (90.8) | 1646 (96.8) | 1673 (98.4) | 1792 (95.6) | 1731 (96.6) | 1762 (98.3) |
| Plasma | 1230 (65.6) | 1196 (97.2) | 1211 (98.5) | 1371 (73.2) | 1331 (97.1) | 1353 (98.7) |
| Serum | 1192 (63.6) | 1160 (97.3) | 1174 (98.5) | 1336 (71.3) | 1297 (97.1) | 1319 (98.7) |
| Whole blood/clot | 1223 (65.3) | 1189 (97.2) | 1204 (98.4) | 1358 (72.5) | 1318 (97.1) | 1340 (98.7) |
| Guthrie card | 1424 (76.0) | 1382 (97.1) | 1405 (98.7) | 1468 (78.3) | 1421 (96.8) | 1446 (98.5) |
| Urine | 1595 (85.1) | 1548 (97.1) | 1571 (98.5) | 1686 (90.0) | 1637 (97.1) | 1662 (98.6) |
| Saliva | 1375 (73.4) | 1327 (96.5) | 1350 (98.2) | 1392 (74.3) | 1347 (96.8) | 1370 (98.4) |
| Buccal | 398 (21.2) | 385 (96.7) | 392 (98.5) | 390 (20.8) | 378 (96.9) | 383 (98.2) |
| Hair | 1390 (74.2) | 1343 (96.6) | 1365 (98.2) | 1439 (76.8) | 1397 (97.1) | 1418 (98.5) |
| Toenail | 1586 (84.6) | 1534 (96.7) | 1561 (98.4) | – | – | – |
Values are n (%). Data/sample collected % is the proportion of the sample (×/1874). Consent % is the proportion of participants who provided data/sample(s).
*Access to these data has been consented to by participants, but not yet attempted by the study team as of April 2019.
Discussion
Principal findings
The Child Health CheckPoint provides a paired cross-generational snapshot of the health of Australian children aged 11–12 years and their parents who took part in the CheckPoint assessment (mostly mothers). Data completeness was high among the nearly 2000 families who participated. The utility of the data and biospecimens is further enhanced by near-universal consent for genetic analysis and sharing with other researchers. Enriching LSAC’s lifelong environmental data with CheckPoint’s biological data strengthens the utility of LSAC to address important questions on how NCDs develop phenotypically before overt disease is evident, and shed light on the underlying dimensionality of health at different life stages.
Key logistic challenges faced by the CheckPoint were its short-time window both to plan and conduct (a fixed 12 months from February 2015), the sheer size of Australia (approximately the same as continental USA) and the limited funding allowing for only one set of heavy equipment and thus curtailing the period during which the CheckPoint was available to participants in each city.
Strengths and limitations
Strengths of LSAC include its large population-based sample, data linkage, historical repeated measures and open data access. Strengths of the CheckPoint module include the sophistication of its health assessments, and the cross-generational child–parent assessments paired on time of assessment, protocols and equipment. Utility of the CheckPoint data is strengthened by its timing relative to child age (ie, adolescence onset) and LSAC duration (ie, 10 years of data already available); and its timely release of curated data to researchers (within 3 years of data collection), with more to come as data scoring and biomarker analyses are completed. The CheckPoint is led by diverse and specialty-based researchers, who continue to develop multisystem hypotheses and discovery research. We have prioritised harmonisation of methods with other internationally significant cohorts (eg, utilisation of the Nightingale metabolomics and Illumina Global Screening Array genotyping platforms). Finally, the CheckPoint module was enjoyable for participants, and its impact on participant retention in future LSAC waves will be examined.
The sample reflects the broader Australian population in many attributes, including state/territory of residence. A limitation (that can be partly addressed by using survey weights41) is that families were more likely to live in major cities and have a higher socioeconomic status than non-participants and Australians in general. The limitation that the majority of the parent sample are mothers reflects the design of the study and cannot be addressed using survey weights so should be considered and noted in all analyses of parents. Due to sample attrition, the final number of parent–child dyads was only around 1900, limiting power for rare exposures and outcomes; this is partly offset by LSAC’s common exposures, and CheckPoint’s focus on continuous outcome measures. Almost all measures were collected from only one of the child’s parents, although family studies will be possible for the 55% of families for whom we collected a DNA sample from both parents. A further potential limitation is that LSAC does not have prospective prenatal data on the children, although it does include prospective data from very early life (child age at wave 1 spanned 3–19 months) and permission to link to birth data.
Implications and future research
The wealth and depth of longitudinal LSAC data available gives important context to CheckPoint’s health and biomarker data. To commence a brand-new cohort incorporating these measures is exceptionally expensive and would have set back the availability of such data by decades, at a time when other prominent efforts to do so internationally have failed.43 44 Other internationally significant efforts, such as the US Environmental Influences On Child Health Outcomes (ECHO) Program,45 are now taking a similar approach to CheckPoint. For example, ECHO is enriching existing traditional child cohorts with additional cutting-edge biophysical modules and forward harmonisation. This will add great value to these cohorts and to knowledge that can be generated from their interrogation.
In the study’s first decade, over 500 papers have been published using LSAC data. Child health is one of the most common topics of LSAC papers,42 and many of these health-related research questions could be extended on now that the CheckPoint data are available. For example, research papers on the parent-reported health comorbidities of overweight46 or short sleep duration47 published by our group could be extended to include comprehensive objective measures of segmental body composition, 24 hours’ time use including sleep and a range of health outcomes (eg, serum blood parameters, arterial structure and function). The greater precision brought by using these measures may reveal nuances in the associations not detectable using reported measures. Many new health-related questions are also now able to be examined, as LSAC’s broad range of early life exposures is reflected in peripubertal metabolic health and development of a wide range of body systems. In addition, the CheckPoint data set will be augmented with genetic data in late 2019, which will facilitate gene-environment analyses for the first time in this cohort.
In summary, the efficient addition of objective health measures and biospecimens into the open-access LSAC repository greatly increases the utility of this widely used data set. Analysis of the CheckPoint data holds great promise in integrating cutting-edge measures of mid-childhood physiology with lifetime trajectories of mental and physical health, growth, behaviour and healthcare within a single population study. The data’s utility will continue to grow as ongoing waves of the main LSAC study accrue into adulthood, when CheckPoint health data will be able to be examined both as outcomes of early life exposures (LSAC waves 1–6) and predictors of later life health (LSAC wave 7 onwards).
Supplementary Material
Acknowledgments
This paper uses unit record data from Growing Up in Australia, the Longitudinal Study of Australian Children. The study is conducted in partnership between the Department of Social Services (DSS), the Australian Institute of Family Studies (AIFS) and the Australian Bureau of Statistics (ABS).
REDCap (Research Electronic Data Capture) electronic data capture tools were used in this study. More information about this software can be found at www.project-redcap.org. The authors
thank the LSAC and CheckPoint study participants, staff and students for their contributions. In particular, the authors thank the CheckPoint team members Richard Liu, John Nguyen, Elissa Phillips, Anna Czajko and Josh Muller who made important contributions to the study.
Footnotes
Contributors: SAC is the study project manager, and planned and conducted the analyses, and drafted the initial manuscript. PSA, LAB, DPB, JBC, MC, TD, BE, LG, JAK, FKM, TSO, SR, HR, RS, MS, PJS, LS, TYW and SRZ are study investigators involved in the conception and oversight of the Child Health CheckPoint, and provided expert advice and critical review of this manuscript. SD, SE, ANG, ACG, KLy and KLa are study staff or postdoctoral fellows and provided critical review of this manuscript. MW is the principal investigator of the Child Health CheckPoint, planned the analyses and provided critical review of this manuscript.
Funding: This work was supported by the National Health and Medical Research Council (NHMRC) of Australia (Project Grants 1041352, 1109355), The Royal Children’s Hospital Foundation (2014-241), the Murdoch Children’s Research Institute (MCRI), The University of Melbourne, the National Heart Foundation of Australia (100660), Financial Markets Foundation for Children (2014-055, 2016-310) and the Victoria Deaf Education Institute. The urinary albumin and creatinine quantification was funded through NHMRC Program Grant 633003 Screening and Test Evaluation Program. The following authors were supported by the NHMRC: Senior Research Fellowships to MW (1046518) and DPB (1064629); Career Development Fellowship to FKM (1111160); Early Career Fellowship to KLy (1091124) and LG (1035100). The following authors were supported by the National Heart Foundation of Australia: Honorary Future Leader Fellowship to DPB (100369); Postdoctoral Fellowship to KLy (101239). MW is supported by Cure Kids New Zealand. The MCRI administered the research grants for the study and provided infrastructural support (IT and biospecimen management) to its staff and the study, but played no role in the conduct or analysis of the trial. DSS played a role in study design; however, no other funding bodies had a role in the study design and conduct; data collection, management, analysis and interpretation; preparation, review or approval of the manuscript; and decision to submit the manuscript for publication.
Disclaimer: The findings and views reported in this paper are those of the authors and should not be attributed to DSS, AIFS or the ABS.
Competing interests: All authors have completed the ICMJE uniform disclosure form at www.icmje.org/coi_disclosure.pdf and declare financial support as described in the funding section. Personal fees were received by MW, PSA, MS and SRZ from the AustralianDepartment of Social Services. MW received grants from New Zealand Ministry of Business, Innovation & Employmentand A Better Start/Cure Kids New Zealand, and support from Sandoz to present ata symposium outside the submitted work.
Ethics approval: The Royal Children’s Hospital Melbourne Human Research Ethics Committee (33225D) and the Australian Institute of Family Studies Ethics Committee (14-26).
Provenance and peer review: Not commissioned; externally peer reviewed.
Data sharing statement: The Longitudinal Study of Australian Children datasets and technical documents are available to researchers at no cost via a licence agreement. Data access requests are co-ordinated by the National Centre for Longitudinal Data. More information is available at https://dataverse.ada.edu.au/dataverse/lsac.
Collaborators: Child Health CheckPoint Team: Peter S Azzopardi (Murdoch Children’s Research Institute, Parkville, Victoria, Australia; Department of Paediatrics, The University of Melbourne, Parkville, Victoria, Australia; Maternal and Child Health Program, International Development Discipline, Burnet Institute, Melbourne, Victoria, Australia), Louise A Baur (The Discipline of Child and Adolescent Health, The University of Sydney, Westmead, New South Wales, Australia), David P Burgner (Murdoch Children’s Research Institute, Parkville, Victoria, Australia; Department of Paediatrics, The University of Melbourne, Parkville, Victoria, Australia; Department of Paediatrics, Monash University, Clayton, Victoria, Australia), John B Carlin (Murdoch Children’s Research Institute, Parkville, Victoria, Australia; Department of Paediatrics, The University of Melbourne, Parkville, Victoria, Australia), Michael Cheung (Murdoch Children’s Research Institute, Parkville, Victoria, Australia; Department of Paediatrics, The University of Melbourne, Parkville, Victoria, Australia; Cardiology Department, The Royal Children’s Hospital, Parkville, Victoria, Australia), Terence Dwyer (Murdoch Children’s Research Institute, Parkville, Victoria, Australia; Department of Paediatrics, The University of Melbourne, Parkville, Victoria, Australia; Nuffield Department of Obstetrics and Gynaecology, The George Institute for Global Health, University of Oxford, Oxford, UK; Institute for Medical Research, University of Tasmania, Hobart, Tasmania, Australia), Ben Edwards (Australian National University Centre for Social Research and Methods, Canberra, Australian Capital Territory, Australia), Susan Ellul (Murdoch Children’s Research Institute, Parkville, Victoria, Australia), Alanna N Gillespie (Murdoch Children’s Research Institute, Parkville, Victoria, Australia; Department of Paediatrics, The University of Melbourne, Parkville, Victoria, Australia), Lisa Gold (School of Health and Social Development, Deakin University, Geelong, Victoria, Australia), Anneke C Grobler (Murdoch Children’s Research Institute, Parkville, Victoria, Australia), Jessica A Kerr (Murdoch Children’s Research Institute, Parkville, Victoria, Australia; Department of Paediatrics, The University of Melbourne, Parkville, Victoria, Australia), Kate Lycett (Murdoch Children’s Research Institute, Parkville, Victoria, Australia; Department of Paediatrics, The University of Melbourne, Parkville, Victoria, Australia; School of Psychology, Deakin University, Burwood, Victoria, Australia), Katherine Lange (Murdoch Children’s Research Institute, Parkville, Victoria, Australia; Department of Paediatrics, The University of Melbourne, Parkville, Victoria, Australia), Fiona K Mensah (Murdoch Children’s Research Institute, Parkville, Victoria, Australia; Department of Paediatrics, The University of Melbourne, Parkville, Victoria, Australia), Timothy S Olds (Murdoch Children’s Research Institute, Parkville, Victoria, Australia; Alliance for Research in Exercise, Nutrition and Activity, University of South Australia, Adelaide, South Australia, Australia), Sarath Ranganathan (Murdoch Children’s Research Institute, Parkville, Victoria, Australia; Department of Paediatrics, The University of Melbourne, Parkville, Victoria, Australia; Respiratory and Sleep Medicine Department, The Royal Children’s Hospital, Parkville, Victoria, Australia), Helen Rogers (National Centre for Longitudinal Data, Department of Social Services, Canberra, Australian Capital Territory, Australia), Richard Saffery (Murdoch Children’s Research Institute, Parkville, Victoria, Australia; Department of Paediatrics, The University of Melbourne, Parkville, Victoria, Australia), Michael Sawyer (School of Medicine, University of Adelaide, Adelaide, South Australia, Australia; Research and Evaluation Unit, Women’s and Children’s Health Network, Adelaide, South Australia, Australia), Peter J Simm (Murdoch Children’s Research Institute, Parkville, Victoria, Australia; Department of Paediatrics, The University of Melbourne, Parkville, Victoria, Australia; Endocrinology and Diabetes Department, The Royal Children’s Hospital, Parkville, Victoria, Australia), Luke Stevens (Murdoch Children’s Research Institute, Parkville, Victoria, Australia), Tien Y Wong (Singapore Eye Research Institute, Singapore National Eye Centre, Singapore; Department of Ophthalmology, Yong Loo Lin School of Medicine, National University of Singapore and National University Health System, Singapore; Ophthalmology and Visual Sciences Academic Clinical Programme, Duke-NUS Medical School, National University of Singapore, Singapore), Stephen R Zubrick (Telethon Kids Institute, Subiaco, Western Australia, Australia; Graduate School of Education, University of Western Australia, Crawley, Western Australia, Australia).
Patient consent for publication: Not required.
Contributor Information
Child Health CheckPoint Team:
Peter S Azzopardi, Louise A Baur, David P Burgner, John B Carlin, Michael Cheung, Terence Dwyer, Ben Edwards, Susan Ellul, Alanna N Gillespie, Lisa Gold, Anneke C Grobler, Jessica A Kerr, Kate Lycett, Katherine Lange, Fiona K Mensah, Tim S Olds, Sarath Ranganathan, Helen Rogers, Richard Saffery, Michael Sawyer, Peter J Simm, Luke Stevens, Tien Y Wong, and Stephen R Zubrick
Collaborators: Child Health CheckPoint Team
References
- 1. Shonkoff JP. Building a new biodevelopmental framework to guide the future of early childhood policy. Child Dev 2010;81:357–67. 10.1111/j.1467-8624.2009.01399.x [DOI] [PubMed] [Google Scholar]
- 2. Khoury MJ, Lam TK, Ioannidis JP, et al. . Transforming epidemiology for 21st century medicine and public health. Cancer Epidemiol Biomarkers Prev 2013;22:508–16. 10.1158/1055-9965.EPI-13-0146 [DOI] [PMC free article] [PubMed] [Google Scholar]
- 3. Lauer MS, Gordon D, Wei G, et al. . Efficient design of clinical trials and epidemiological research: is it possible? Nat Rev Cardiol 2017;14:493–501. 10.1038/nrcardio.2017.60 [DOI] [PubMed] [Google Scholar]
- 4. Connelly R, Platt L. Cohort profile: UK Millennium Cohort Study (MCS). Int J Epidemiol 2014;43:1719–25. 10.1093/ije/dyu001 [DOI] [PubMed] [Google Scholar]
- 5. Greene S, Williams J, Layte R, et al. . Growing Up in Ireland Background and Conceptual Framework. Dublin, Ireland: Office of the Minister for Children and Youth Affairs, Department of Health and Children, 2010. [Google Scholar]
- 6. Morton SM, Atatoa Carr PE, Grant CC, et al. . Cohort profile: Growing Up in New Zealand. Int J Epidemiol 2013;42:65–75. 10.1093/ije/dyr206 [DOI] [PubMed] [Google Scholar]
- 7. Soh SE, Tint MT, Gluckman PD, et al. . Cohort profile: Growing Up in Singapore Towards healthy Outcomes (GUSTO) birth cohort study. Int J Epidemiol 2014;43:1401–9. 10.1093/ije/dyt125 [DOI] [PubMed] [Google Scholar]
- 8. Sanson A, Johnstone R. The LSAC Research Consortium & FaCS LSAC Project Team. Growing Up in Australia takes its first steps. Family Matters 2004;67:46–53. [Google Scholar]
- 9. Wake M. Tracking the health of the next generation: Sax Institute. 2016. https://www.saxinstitute.org.au/news/tracking-the-health-of-the-next-generation/.
- 10. Soloff C, Lawrence D, Johnstone R. LSAC technical paper number 1: Sample design. Melbourne: Australian Institute of Family Studies, 2005. [Google Scholar]
- 11. Cusack B, Defina R. LSAC technical paper number 10: Wave 5 weighting and non response. Melbourne: Australian Institute of Family Studies, 2013. [Google Scholar]
- 12. Welsh L, Kathriachchige G, Raheem T, et al. . Spirometry: population epidemiology and concordance in 11-12 year old Australian children and their parents. BMJ Open 2019;9 (suppl 3):53–62. [DOI] [PMC free article] [PubMed] [Google Scholar]
- 13. Vlok J, Simm PJ, Clifford SA, et al. . pQCT bone geometry and strength: population epidemiology and concordance in Australian children aged 11-12 years and their parents. BMJ Open 2019;9 (suppl 3):63–74. [DOI] [PMC free article] [PubMed] [Google Scholar]
- 14. Vivarini P, Kerr JA, Grobler AC, et al. . Food choices: concordance in Australian children aged 11-12 years and their parents. BMJ Open 2019;9 (suppl 3):147–56. [DOI] [PMC free article] [PubMed] [Google Scholar]
- 15. Smith J, Wang J, Grobler AC, et al. . Hearing, speech reception, vocabulary and language: population epidemiology and concordance in Australian children aged 11-12 years and their parents. BMJ Open 2019;9 (suppl 3):85–94. [DOI] [PMC free article] [PubMed] [Google Scholar]
- 16. Nguyen MT, Lycett K, Vryer R, et al. . Telomere length: population epidemiology and concordance in Australian children aged 11-12 years and their parents. BMJ Open 2019;9 (suppl 3):118–26. [DOI] [PMC free article] [PubMed] [Google Scholar]
- 17. Matricciani L, Fraysse F, Grobler AC, et al. . Sleep: population epidemiology and concordance in Australian children aged 11-12 years and their parents. BMJ Open 2017;9 (suppl 3):127–35. [DOI] [PMC free article] [PubMed] [Google Scholar]
- 18. Liu RS, Dunn S, Grobler AC, et al. . Carotid artery intima-media thickness, distensibility, and elasticity: population epidemiology and concordance in Australian children aged 11-12 years and their parents. BMJ Open 2019;9(suppl 3):23–33. [DOI] [PMC free article] [PubMed] [Google Scholar]
- 19. Larkins NG, Kim S, Carlin JC, et al. . Albuminuria: population epidemiology and concordance in Australian children aged 11-12 years and their parents. BMJ Open 2019;9(suppl 3):75–84. [DOI] [PMC free article] [PubMed] [Google Scholar]
- 20. Kahn FK, Wake M, Lycett K, et al. . Vascular function and stiffness: population epidemiology and concordance in Australian children aged 11-12 years and their parents. BMJ Open 2019;9(suppl 3):34–43. [DOI] [PMC free article] [PubMed] [Google Scholar]
- 21. Fraysse F, Grobler AC, Muller J, et al. . Physical activity and sedentary activity: population epidemiology and concordance in Australian children aged 11-12 years and their parents. BMJ Open 2019;9(suppl 3):136–46. [DOI] [PMC free article] [PubMed] [Google Scholar]
- 22. Ellul S, Wake M, Clifford SA, et al. . Metabolomics: population epidemiology and concordance in Australian children aged 11-12 years and their parents. BMJ Open 2019;9(suppl 3):106–17. [DOI] [PMC free article] [PubMed] [Google Scholar]
- 23. Dascalu J, Lui M, Lycett K, et al. . Retinal microvasculature: population epidemiology and concordance in Asutralian children aged 11-12 years and their parents. BMJ Open 2019;9(suppl 3):44–52. [DOI] [PMC free article] [PubMed] [Google Scholar]
- 24. Clifford SA, Gillespie AN, Olds TS, et al. . Body composition: population epidemiology and concordance in Australian children aged 11-12 years and their parents. BMJ Open 2019;9(suppl 3):95–105. [DOI] [PMC free article] [PubMed] [Google Scholar]
- 25. Catchpool M, Gold L, Grobler AC, et al. . Health-related quality of life: population epidemiology and concordance in Australian children aged 11-12 years and their parents. BMJ Open 2019;9(suppl 3):157–64. [DOI] [PMC free article] [PubMed] [Google Scholar]
- 26. Boyd A, Golding J, Macleod J, et al. . Cohort Profile: the ’Children of the 90s'--the index offspring of the Avon Longitudinal Study of Parents and Children. Int J Epidemiol 2013;42:111–27. 10.1093/ije/dys064 [DOI] [PMC free article] [PubMed] [Google Scholar]
- 27. Straker L, Mountain J, Jacques A, et al. . Cohort Profile: The Western Australian Pregnancy Cohort (Raine) Study-Generation 2. Int J Epidemiol 2017;46:dyw308–85. 10.1093/ije/dyw308 [DOI] [PMC free article] [PubMed] [Google Scholar]
- 28. Australian Institute of Family Studies. Longitudinal Study of Australian Children Data User Guide. Melbourne: Australian Institute of Family Studies, 2015. [Google Scholar]
- 29. Wake M, Canterford L, Nicholson J, et al. . Options for physical and biomarker augmentation in LSAC: Discussion paper, 2008. [Google Scholar]
- 30. Wake M, Gallagher S, Poulakis Z, et al. . The Parent Education and Support (PEAS) Program: Final report. Melbourne, Australia: Centre for Community Child Health, Royal Children’s Hospital, 2003. [Google Scholar]
- 31. Wake M, Baur LA, Gerner B, et al. . Outcomes and costs of primary care surveillance and intervention for overweight or obese children: the LEAP2 randomised controlled trial. BMJ 2009;339:b3308 10.1136/bmj.b3308 [DOI] [PMC free article] [PubMed] [Google Scholar]
- 32. Wake M, Lycett K, Sabin MA, et al. . A shared-care model of obesity treatment for 3-10 year old children: protocol for the HopSCOTCH randomised controlled trial. BMC Pediatr 2012;12:39 10.1186/1471-2431-12-39 [DOI] [PMC free article] [PubMed] [Google Scholar]
- 33. Hanvey AN, Mensah FK, Clifford SA, et al. . Adolescent cardiovascular functional and structural outcomes of growth trajectories from infancy: prospective community-based study. Child Obes 2017;13:154–63. 10.1089/chi.2016.0263 [DOI] [PubMed] [Google Scholar]
- 34. Hanvey AN, Clifford SA, Mensah FK, et al. . Which body composition measures are associated with cardiovascular function and structure in adolescence? Obes Med 2016;3:20–7. 10.1016/j.obmed.2016.08.001 [DOI] [Google Scholar]
- 35. Olds TS, Ridley K, Dollman J, et al. . The validity of a computerized use of time recall, the Multimedia Activity Recall for Children and Adolescents. Pediatr Exerc Sci 2010;22:34–43. 10.1123/pes.22.1.34 [DOI] [PubMed] [Google Scholar]
- 36. Davies S, Clifford SA, Gillespie AN, et al. . Longitudinal Study of Australian Children’s Child Health CheckPoint Data Issues Paper - December 2018. Melbourne, Australia: Murdoch Children’s Research Institute, 2018. [Google Scholar]
- 37. Wake M, Clifford SA, York E, et al. . Introducing Growing Up in Australia’s Child Health CheckPoint. Family Matters 2014;95:15–23. [Google Scholar]
- 38. Harris PA, Taylor R, Thielke R, et al. . Research electronic data capture (REDCap)--a metadata-driven methodology and workflow process for providing translational research informatics support. J Biomed Inform 2009;42:377–81. 10.1016/j.jbi.2008.08.010 [DOI] [PMC free article] [PubMed] [Google Scholar]
- 39. Soininen P, Kangas AJ, Würtz P, et al. . High-throughput serum NMR metabonomics for cost-effective holistic studies on systemic metabolism. Analyst 2009;134:1781–5. 10.1039/b910205a [DOI] [PubMed] [Google Scholar]
- 40. Kettunen J, Tukiainen T, Sarin AP, et al. . Genome-wide association study identifies multiple loci influencing human serum metabolite levels. Nat Genet 2012;44:269–76. 10.1038/ng.1073 [DOI] [PMC free article] [PubMed] [Google Scholar]
- 41. Ellul S, Hiscock R, Mensah FK, et al. . Longitudinal Study of Australian Children’s Child Health CheckPoint Technical Paper 1: Weighting and Non-Response. Melbourne: Murdoch Children’s Research Institute, 2018. [Google Scholar]
- 42. Edwards B. Growing Up in Australia: The Longitudinal Study of Australian Children: Entering adolescence and becoming a young adult. Family Matters 2014;95:5–14. [Google Scholar]
- 43. Pearson H. Massive UK baby study cancelled. Nature 2015;526:620–1. 10.1038/526620a [DOI] [PubMed] [Google Scholar]
- 44. Landrigan PJ, Baker DB. The National Children’s Study--end or new beginning? N Engl J Med 2015;372:1486–7. 10.1056/NEJMp1500276 [DOI] [PubMed] [Google Scholar]
- 45. Schmidt CW. Growing a New Study: Environmental Influences on Child Health Outcomes. Environ Health Perspect 2015;123:A260–3. 10.1289/ehp.123-A260 [DOI] [PMC free article] [PubMed] [Google Scholar]
- 46. Wake M, Clifford SA, Patton GC, et al. . Morbidity patterns among the underweight, overweight and obese between 2 and 18 years: population-based cross-sectional analyses. Int J Obes 2013;37:86–93. 10.1038/ijo.2012.86 [DOI] [PubMed] [Google Scholar]
- 47. Price AMH, Quach J, Wake M, et al. . Cross-sectional sleep thresholds for optimal health and well-being in Australian 4-9-year-olds. Sleep Med 2016;22:83–90. 10.1016/j.sleep.2015.08.013 [DOI] [PubMed] [Google Scholar]
- 48. Marfell-Jones M, Olds T, Stewart A, et al. ; International Standards for Anthropometric Assessment. Potchefstroom, RSA: North-West University, 2006. [Google Scholar]
- 49. World Health Organization. Physical status: The use of and interpretation of anthropometry: report of a WHO expert committee. WHO Technical Report Series. Geneva 1995. [PubMed] [Google Scholar]
- 50. Morris NM, Udry JR. Validation of a self-administered instrument to assess stage of adolescent development. J Youth Adolesc 1980;9:271–80. 10.1007/BF02088471 [DOI] [PubMed] [Google Scholar]
- 51. Petersen AC, Crockett L, Richards M, et al. . A self-report measure of pubertal status: Reliability, validity, and initial norms. J Youth Adolesc 1988;17:117–33. 10.1007/BF01537962 [DOI] [PubMed] [Google Scholar]
- 52. Tan JK, Tang J, Fung K, et al. . Development and validation of a comprehensive acne severity scale. J Cutan Med Surg 2007;11:211–6. [DOI] [PubMed] [Google Scholar]
- 53. Moyer-Mileur LJ, Quick JL, Murray MA. Peripheral quantitative computed tomography of the tibia: pediatric reference values. J Clin Densitom 2008;11:283–94. 10.1016/j.jocd.2007.11.002 [DOI] [PubMed] [Google Scholar]
- 54. Zemel BS. Quantitative computed tomography and computed tomography in children. Curr Osteoporos Rep 2011;9:284–90. 10.1007/s11914-011-0076-x [DOI] [PubMed] [Google Scholar]
- 55. Stein JH, Korcarz CE, Hurst RT, et al. . Use of carotid ultrasound to identify subclinical vascular disease and evaluate cardiovascular disease risk: a consensus statement from the American Society of Echocardiography Carotid Intima-Media Thickness Task Force. Endorsed by the Society for Vascular Medicine. J Am Soc Echocardiogr 2008;21:93–111. 10.1016/j.echo.2007.11.011 [DOI] [PubMed] [Google Scholar]
- 56. Touboul P-J, Hennerici MG, Meairs S, et al. . Mannheim Carotid Intima-Media Thickness and Plaque Consensus (2004–2006–2011). Cerebrovasc Dis 2012;34:290–6. 10.1159/000343145 [DOI] [PMC free article] [PubMed] [Google Scholar]
- 57. Laurent S, Cockcroft J, Van Bortel L, et al. . Expert consensus document on arterial stiffness: methodological issues and clinical applications. Eur Heart J 2006;27:2588–605. 10.1093/eurheartj/ehl254 [DOI] [PubMed] [Google Scholar]
- 58. Zhang AJ, Yu XJ, Wang M. The clinical manifestations and pathophysiology of cerebral small vessel disease. Neurosci Bull 2010;26:257–64. 10.1007/s12264-010-1210-y [DOI] [PMC free article] [PubMed] [Google Scholar]
- 59. Miller MR, Hankinson J, Brusasco V, et al. . Standardisation of spirometry. Eur Respir J 2005;26:319–38. 10.1183/09031936.05.00034805 [DOI] [PubMed] [Google Scholar]
- 60. Semel E, Wiig E, Secord W. Clinical Evaluation of Language Fundamentals, fourth edition, Australian standardised edition (CELF-4 Australian). Marrickville: Harcourt Assessment, 2006. [Google Scholar]
- 61. Weintraub S, Dikmen SS, Heaton RK, et al. . Cognition assessment using the NIH Toolbox. Neurology 2013;80(11 Suppl 3):S54–64. 10.1212/WNL.0b013e3182872ded [DOI] [PMC free article] [PubMed] [Google Scholar]
- 62. Niskar AS, Kieszak SM, Holmes A, et al. . Prevalence of hearing loss among children 6 to 19 years of age: the Third National Health and Nutrition Examination Survey. JAMA 1998;279:1071–5. [DOI] [PubMed] [Google Scholar]
- 63. Wake M, Poulakis Z, Hughes EK, et al. . Hearing impairment: a population study of age at diagnosis, severity, and language outcomes at 7-8 years. Arch Dis Child 2005;90:238–44. 10.1136/adc.2003.039354 [DOI] [PMC free article] [PubMed] [Google Scholar]
- 64. Cone BK, Wake M, Tobin S, et al. . Slight-mild sensorineural hearing loss in children: audiometric, clinical, and risk factor profiles. Ear Hear 2010;31:202–12. 10.1097/AUD.0b013e3181c62263 [DOI] [PubMed] [Google Scholar]
- 65. Cameron S, Glyde H, Dillon H. Listening in Spatialized Noise-Sentences Test (LiSN-S): normative and retest reliability data for adolescents and adults up to 60 years of age. J Am Acad Audiol 2011;22:697–709. 10.3766/jaaa.22.10.7 [DOI] [PubMed] [Google Scholar]
- 66. National Acoustic Laboratories. Listening in Spatialised Noise Sentences Test (LiSN-S). 2016. https://www.nal.gov.au/products/licensed-products/listening-in-spatialized-noise-sentences-test-lisn-s/.
- 67. Esliger DW, Rowlands AV, Hurst TL, et al. . Validation of the GENEA Accelerometer. Med Sci Sports Exerc 2011;43:1085–93. 10.1249/MSS.0b013e31820513be [DOI] [PubMed] [Google Scholar]
- 68. Ridley K, Ainsworth BE, Olds TS. Development of a compendium of energy expenditures for youth. Int J Behav Nutr Phys Act 2008;5:45 10.1186/1479-5868-5-45 [DOI] [PMC free article] [PubMed] [Google Scholar]
- 69. Foley LS, Maddison R, Rush E, et al. . Doubly labeled water validation of a computerized use-of-time recall in active young people. Metabolism 2013;62:163–9. 10.1016/j.metabol.2012.07.021 [DOI] [PubMed] [Google Scholar]
- 70. Ortega FB, Ruiz JR, Castillo MJ, et al. . Physical fitness in childhood and adolescence: a powerful marker of health. Int J Obes 2008;32:1–11. 10.1038/sj.ijo.0803774 [DOI] [PubMed] [Google Scholar]
- 71. Boreham CA, Paliczka VJ, Nichols AK. A comparison of the PWC170 and 20-MST tests of aerobic fitness in adolescent schoolchildren. J Sports Med Phys Fitness 1990;30:19–23. [PubMed] [Google Scholar]
- 72. Bach M. The Freiburg Visual Acuity test--automatic measurement of visual acuity. Optom Vis Sci 1996;73:49–53. 10.1097/00006324-199601000-00008 [DOI] [PubMed] [Google Scholar]
- 73. Elliot J, Morrow V. Imagining the Future: Preliminary analysis of NCDS essays written by children at age 11. London: Centre for Longitudinal Studies, 2007. [Google Scholar]
- 74. Seligson JL, Huebner ES, Valois RF. Preliminary Validation of the Brief Multidimensional Students' Life Satisfaction Scale (BMSLSS). Soc Indic Res 2003;61:121–45. 10.1023/A:1021326822957 [DOI] [Google Scholar]
- 75. Children’s Worlds. International Survey of Children’s Well-Being, 2017. Available from http://isciweb.org.
- 76. Varni JW, Seid M, Kurtin PS. PedsQL 4.0: reliability and validity of the Pediatric Quality of Life Inventory version 4.0 generic core scales in healthy and patient populations. Med Care 2001;39:800–12. 10.1097/00005650-200108000-00006 [DOI] [PubMed] [Google Scholar]
- 77. Richardson J, Iezzi A, Khan MA, et al. . Validity and reliability of the Assessment of Quality of Life (AQoL)-8D multi-attribute utility instrument. Patient 2014;7:85–96. 10.1007/s40271-013-0036-x [DOI] [PMC free article] [PubMed] [Google Scholar]
- 78. Stevens K. Assessing the performance of a new generic measure of health-related quality of life for children and refining it for use in health state valuation. Appl Health Econ Health Policy 2011;9:157–69. 10.2165/11587350-000000000-00000 [DOI] [PubMed] [Google Scholar]
- 79. Derogatis LR, Lipman RS, Covi L. SCL-90: an outpatient psychiatric rating scale--preliminary report. Psychopharmacol Bull 1973;9:13–28. [PubMed] [Google Scholar]
- 80. Jones GT, Watson KD, Silman AJ, et al. . Predictors of low back pain in British schoolchildren: a population-based prospective cohort study. Pediatrics 2003;111(4 Pt 1):822–8. 10.1542/peds.111.4.822 [DOI] [PubMed] [Google Scholar]
- 81. Flood VM, Webb K, Rangan A. Recommendations for short questions to assess food consumption in children for the NSW Health Surveys, 2005. [Google Scholar]
- 82. Saloheimo T, González SA, Erkkola M, et al. . The reliability and validity of a short food frequency questionnaire among 9-11-year olds: a multinational study on three middle-income and high-income countries. Int J Obes Suppl 2015;5:S22–S28. 10.1038/ijosup.2015.15 [DOI] [PMC free article] [PubMed] [Google Scholar]
- 83. Koplin JJ, Wake M, Dharmage SC, et al. . Cohort Profile: The HealthNuts Study: Population prevalence and environmental/genetic predictors of food allergy. Int J Epidemiol 2015;44:1161–71. 10.1093/ije/dyu261 [DOI] [PubMed] [Google Scholar]
- 84. Peters RL, Koplin JJ, Gurrin LC, et al. . The prevalence of food allergy and other allergic diseases in early childhood in a population-based study: HealthNuts age 4-year follow-up. J Allergy Clin Immunol 2017. [DOI] [PubMed] [Google Scholar]
- 85. Pezic A, Ponsonby AL, Cameron FJ, et al. . Constitutive and relative facultative skin pigmentation among Victorian children including comparison of two visual skin charts for determining constitutive melanin density. Photochem Photobiol 2013;89:714–23. 10.1111/php.12043 [DOI] [PubMed] [Google Scholar]
- 86. Australian Bureau of Statistics. Australian Statistical Geography Standard (ASGS): Volume 5 - Remoteness Structure, July 2011 (cat. no. 1270.0.55.005): Australian Bureau of Statistics, 2011. [Google Scholar]
- 87. Blakemore T, Strazdins L, Gibbings J. Measuring family socioeconomic position. Australian Social Policy 2009;8:121–68. [Google Scholar]
- 88. Australian Bureau of Statistics. Census of Population and Housing: Socio-Economic Indexes for Areas (SEIFA) Australia 2011 (cat. no. 2033.0.55.001). http://www.abs.gov.au/websitedbs/censushome.nsf/home/seifa2011.
Associated Data
This section collects any data citations, data availability statements, or supplementary materials included in this article.
Supplementary Materials
bmjopen-2017-020261supp001.jpg (143.3KB, jpg)