Abstract
Objective
MS is a demyelinating CNS disorder with a spectrum of clinical patterns regarding course and prognosis. Although several prognostic factors are considered in the initial evaluation of patients, biological markers defining the disease course and guiding treatments are currently lacking. It is unknown whether patients with CSF pleocytosis differ in regard to symptoms, disease course, and prognosis from those without. The aim of this study was to evaluate whether CSF pleocytosis during the initial presentation has an impact on the clinical course and progression of MS.
Methods
We retrospectively evaluated patients attending the MS Clinic at Rabin Medical Center between January 1999 and January 2016 who underwent lumbar puncture (LP) at disease presentation, considering CSF cell count, clinical diagnosis (clinically isolated syndrome [CIS] and relapsing-remitting MS [RRMS]), annualized relapse rate (ARR), paraclinical findings (imaging, CSF oligoclonal bands, and evoked potentials), and disease progression, expressed by the Expanded Disability Status Scale (EDSS).
Results
One hundred fourteen patients (72 females) underwent LP at disease presentation (RRMS: n = 100, CIS: n = 14). Age at diagnosis was 32.4 ± 12.2 years, and the follow-up time was 9.4 ± 3.8 years. Forty-six patients showed a pleocytic CSF (≥5 cells per μL). Compared with patients with <4 cells per μL, patients with pleocytosis had a higher ARR (0.60 ± 0.09 vs 0.48 ± 0.04; p = 0.0267) and a steeper increase (slope) in the EDSS score throughout the follow-up period (correlation coefficient: r2 = 0.04; p = 0.0251).
Conclusions
CSF pleocytosis may be considered a biological unfavorable predictive factor regarding disease course and progression in MS.
MS is one of the most common chronic and disabling disorders of the CNS and the leading cause of neurologic disability in young adults. The disease usually begins in young adulthood and affects women more frequently than men. The incidence and prevalence of MS vary between different countries, with higher rates reported in northern geographical regions. Recent data suggest that the incidence and prevalence of MS are increasing over the last decades.1–3 In most cases, a relapsing-remitting MS (RRMS) course develops, but in 10%–20% of patients, a primary progressive form without acute relapses is seen from disease onset.4
The diagnosis of MS is largely based on clinical grounds and on brain and spinal cord MRI findings, which can demonstrate disease dissemination in time and space even after the first clinical presentation. Patients after a typical attack who do not fulfill these criteria are classified as having a clinically isolated syndrome (CIS). A recent update of the McDonald diagnostic criteria allows the diagnosis of clinically definite MS (CDMS) after a single typical attack in patients having MRI evidence of dissemination in space and the presence of oligoclonal bands (OCBs) in the CSF.5
The clinical course of the disease varies significantly between patients and is unpredictable at initial disease presentation.4,6,7 This lack of information is often frustrating for patients and clinicians as biological markers to predict the clinical course of the disease are lacking.
In some studies focusing on CSF findings in patients with MS, attempts have been made to correlate CSF parameters and clinical aspects of the disease. Sellebjerg et al.8 reported that CSF levels of myelin basic protein significantly correlated with the Kurtzke Expanded Disability Status Scale (EDSS) score in patients with MS (but this finding was not verified elsewhere).9
Increased intrathecal synthesis of immunoglobulins of restricted specificity (OCBs) or the synthesis of IgG has for long been recognized as the major characteristic CSF finding of the disease. The past literature also analyzed the relationship between CSF OCBs or IgG index and clinical outcome, but its predictive significance is still uncertain. For example, it has been shown that the presence of OCBs in patients with CIS almost doubles the risk of a second clinical attack,10 but there was no correlation between intrathecal antibody synthesis and progression of neurologic disability in patients with early MS.11,12 More recently, both CSF immunoglobulin free light chains and CSF neurofilament levels have been proposed as prognostic biomarkers,13–21 and serum neurofilaments are also gaining interest as a potential prognostic marker of the disease.22 Other serum and CSF biomarkers have been proposed,23–26 but none has yet been proven as having a significant prognostic impact.
Much less attention was given to the presence of CSF pleocytosis as a predictive biomarker, and it is unknown whether the number of white blood cells (WBCs) in the CSF of patients with MS at the beginning of the disease (e.g., after the first clinical attack) correlates with clinical course.
The aim of this study was to examine the possible association between CSF pleocytosis during the initial presentation and disease course and disability progression in MS.
Methods
We retrospectively reviewed the clinical files of all patients attending the MS clinic at Rabin Medical Center between January 1999 and January 2016 with a diagnosis of either CDMS or CIS to identify those who underwent lumbar puncture (LP) at disease presentation.
Diagnosis of CDMS and CIS was assigned according to the 2010 modified McDonald criteria.27 Hence, patients presenting with at least 1 acute or subacute clinical manifestation suggestive of MS were categorized as RRMS if they fulfilled the criteria of dissemination in time and dissemination in space or as CIS if they did not fulfill one of these criteria. For the purpose of this study, patients having an initial relapsing course who advanced into a secondary progressive stage over time were considered as part of the RRMS group.
In all cases, only patients who underwent LP during the initial diagnostic process were included in the study. This implies the majority of patients who presented with a suspected demyelinating episode during the study period, as it has been our practice to routinely examine CSF in these patients to verify that the condition is not due to other disorders, such as infiltrative and infectious.
CSF was evaluated for number of WBCs, protein and glucose levels (calculated in mg/dL), and presence of elevated IgG index or OCBs. CSF cell count was considered abnormal if ≥5 cells/µL, in accordance with the accepted laboratory values.28–30 To evaluate whether CSF pleocytosis has an impact on MS disease course and progression, we compared patients with normal CSF cell count (<4 cells/µL) with 2 groups of patients, having ≥5 cells/µL and ≥10 cells/µL.
Disease activity and progression were evaluated by the number of relapses throughout the follow-up period of patients with RRMS (annualized relapse rate [ARR]) and EDSS score differences between the end and the beginning of follow-up for all groups. For that purpose, a relapse was considered as typical inflammatory demyelinating event occurring after at least 30 days of clinically stable state and lasting for more than 24 hours, in the absence of fever or infection. The EDSS score was calculated by an experienced clinician specialized in MS (I.L. or M.A.H.) at the end of each year throughout the follow-up period.
Baseline paraclinical parameters (brain and spinal cord MRI and evoked potential studies [EPSs]) were evaluated in relation to CSF pleocytosis. MRI was evaluated for total number of T2 lesions (recorded as follows: (a) between 0 and 1 lesion; (b) between 2 and 9 lesions; and (c) ≥10 lesions) and presence of T1 gadolinium-enhancing lesions. EPSs were recorded as either normal or abnormal for each of the modalities evaluated (visual EPs, brainstem EPs, and sensory EPs).
Statistical analysis
To evaluate differences between 2 groups, we used either Student t test or Mann-Whitney U test. For multiple comparisons, we used either one-way analysis of variance or Kruskal-Wallis test and set the significance level as <0.05. Correlating the trend in EDSS change in relation to WBC count for the entire study population was calculated using the Pearson correlation coefficient.
Standard protocol approvals, registrations, and patient consents
The study was approved by the Rabin Medical Center local research ethics committee.
Data availability
Anonymized data presented in this report will be made available to bona fide investigators upon request to the corresponding author.
Results
Demographics and CSF results at the time of first LP
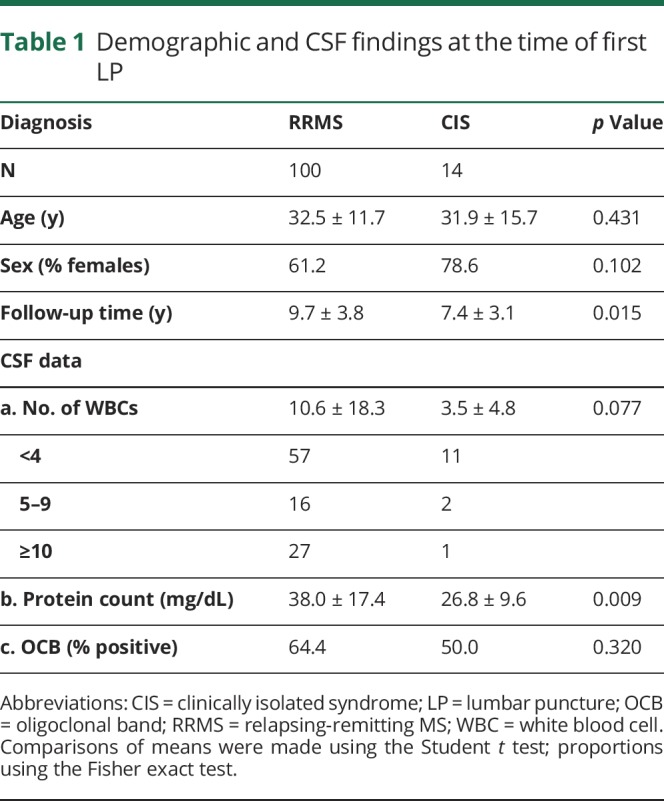
The cohort included a total of 114 patients (72 females and 42 males; 1.71:1 ratio) in whom LP was performed at the first clinical episode (RRMS: n = 100; CIS: n = 14), with an average age of 32.4 ± 12.2 years. The mean follow-up time was 9.4 ± 3.8 years, with a range of 3–19 years.
Leukocyte CSF counts at the time of LP in our cohort were in the range of 0–115 cells/µL (9.70 ± 17.3; median: 3). Forty-six patients (40.3%) showed CSF pleocytosis (≥5 cells/µL). The mean CSF protein count was 36.5 ± 16.4 mg/dL and correlated with the numbers of cells in the CSF (r2 = 0.094; p = 0.0005). There was no significant difference in the CSF leukocyte count between male and female patients (male vs female: 8.5 ± 2.4 and 10.3 ± 2.1; p = 0.46). The number of cells was inversely correlated with patient's age (r2 = 0.048; p = 0.0136). The demographics and CSF results at the time of LP are summarized in table 1.
Table 1.
Demographic and CSF findings at the time of first LP
CSF cell count and disease course
We evaluated the initial CSF leukocyte count and its correlation with progression of the EDSS score for all patients. The EDSS score at presentation was 2.7 ± 0.7 (n = 114; range: 0–7) and increased after 10 years of follow-up to 3.36 ± 2.44 (n = 53; range 0–9). In addition, we calculated the change in the EDSS score per year (Δ-EDSS/year) for each patient and correlated this with the initial CSF cell count. Patients with increased CSF cell counts showed a steeper worsening of the EDSS score (CSF leukocyte count and Δ-EDSS/year: r2 = 0.04; p = 0.0251; figure 1).
Figure 1. CSF cell count and disease course.
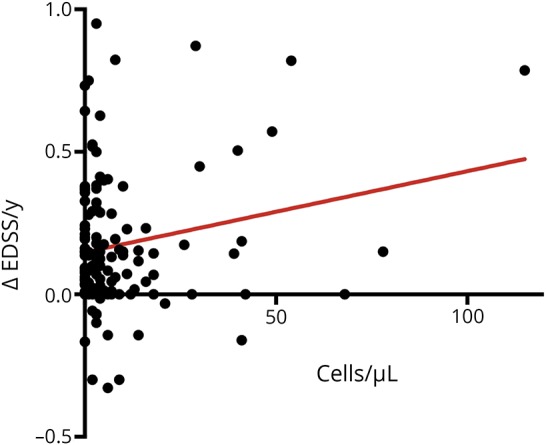
A higher CSF cell count during the initial clinical presentation of MS is associated with a higher yearly change in the EDSS score during follow-up. EDSS = Expanded Disability Status Scale.
In addition, patients with an initial pleocytosis on LP (≥5 cells/µL) were more likely to have a relapsing-remitting disease course rather than a monophasic one ([CIS], p = 0.057).
CSF cell count and presence of CSF OCBs at presentation
OCBs in the CSF were present in 62.8% of all patients included in the study (for 9 patients, data were not available). Notably, cell count in the CSF of patients with positive OCBs was significantly higher compared with those without OCBs (OCB+: 13.9 ± 2.8 cells, n = 58 and OCB−: 4.75 ± 1.45 cells, n = 32; p = 0.0083). OCBs were positive in only 54% of patients with less than 5 cells/µL compared with 75% of patients with more than 5 cells/µL, and once more than 10 cells were found in the CSF, 92% of patients were positive for OCBs.
Baseline MRI and EPS data in relation to CSF leukocyte count
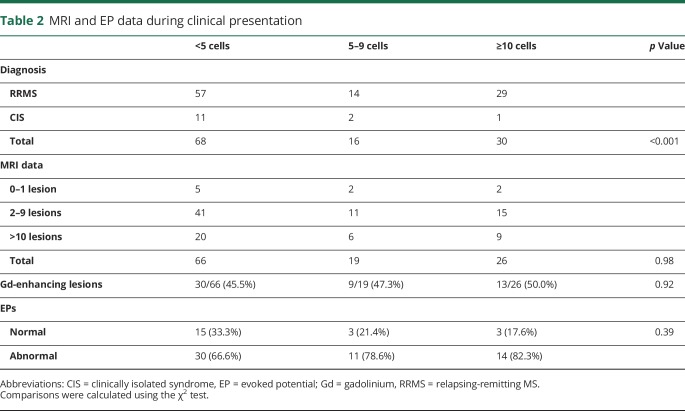
Comparing the total number of T2 lesions and the number of gadolinium-enhancing lesions in patients with <4 and ≥10 cells, we did not find a significant difference between the 2 groups. Likewise, there was not a significant difference in the number of patients who had abnormal EPSs in relation to CSF cell count. These data are summarized in table 2.
Table 2.
MRI and EP data during clinical presentation
ARR and CSF leukocyte count
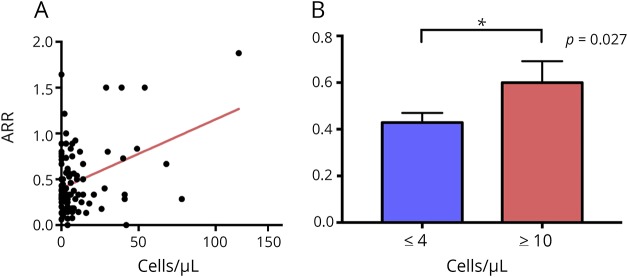
On subgroup analysis regarding only patients with RRMS, a significant correlation between the initial CSF leukocyte cell count and annual relapse rate was observed (n = 100; r2 = 0.14; p = 0.0001; figure 2A). Comparing patients with RRMS with less than 4 cells with those above 10 cells on initial LP, we noted a significantly higher ARR in the latter group (ARR for <4 vs ≥10 cells/µL: 0.48 ± 0.04 vs 0.60 ± 0.09; n = 57 and 27; p = 0.0267; figure 2B).
Figure 2. ARR and CSF cell count.
(A) Patients with a higher CSF cell count during the initial presentation of MS tend to have a higher ARR during follow-up. (B) Patients with ≥10 cells/μL have a significantly higher ARR compared with patients with <4 cells/μL. ARR = annual relapse rate. *Indicates a statistically significant difference between the two groups.
Correlation between the ARR and treatment with DMTs in patients with <4 and ≥10 cells/µL
In the group of patients with <4 cells in the CSF (n = 57), 51 patients (89.5%) were treated with a disease-modifying therapy (DMT), and 6 were not treated. In the group with ≥10 (n = 27), 23 patients (85.2%) were treated, and 4 were not treated. There was no difference between the 2 groups regarding the percentage of patients treated with DMTs (χ2: p = 0.57), and none of the patients were under treatment before LP. Hence, the trend of patients with ≥10 cells/µL to have a higher ARR does not seem to be influenced by DMTs.
Discussion
In the current era of availability of a spectrum of anti-inflammatory medications to control MS that also carry severe side effects, the need to predict disease activity over time is a mandatory prerequisite to create a therapeutic algorithm for patients presenting with highly active course in the early disease stages.31–35 The ability to tailor for the individual patient the specific agent that will address a more active course should be based on clinical and biological marker(s). Unfortunately, in a disorder with a remarkable diverse clinical spectrum, the ability to predict disease activity is a formidable challenge.
In a condition that is considered immune mediated, CSF cellular response might reflect disease activity and course. Thus, our study was aimed to examine the relation between disease activity, measured by ARR and by accumulating neurologic disability, and CSF pleocytosis at presentation. In addition, presence of CSF OCBs, number of lesions on MRI, and abnormal EPs were also measured. The hypothesis behind the present study was that CSF pleocytosis at presentation may predict a more active disease course and eventually indicate the need for a more active therapeutic approach.
A previous study using brain biopsy samples of patients with MS in early stages showed massive cortical gray matter demyelination and meningeal cellular aggregates besides white matter lesions.36 In this study, no correlation was identified between meningeal or cortical lesions and clinical features or disease progression. More recently, Absinta et al.37 reported focal MRI contrast enhancement in the leptomeningeal compartment of patients with MS and an association between leptomeningeal inflammation and subpial cortical demyelinating lesions.
It is possible and to be speculated that CSF pleocytosis would be another marker of inflammation. Indeed, in the present study, we found that CSF pleocytosis at presentation is associated with a higher ARR and a more rapid progression of neurologic disability, as measured by the EDSS among patients with a relapsing-remitting disease course. Moreover, a more rapid worsening in the EDSS score was associated with a higher CSF leukocyte count among patients with relapsing disease course.
Several additional observations emerge from our study:
CSF pleocytosis correlated with the OCB status, which is another marker of intrathecal immune activity and a well-recognized prognostic biomarker in MS.12,38–40 As a matter of fact, although CSF examination is not mandatory for the diagnosis of MS, OCB status has regained an important role in the revised McDonald diagnostic criteria.5,43
The degree of CSF cells was not correlated with MRI lesions or with abnormal EPs. This is in contradiction with several other studies reporting an association between initial MRI findings and disability progression,20,40–42 but there are also studies suggesting that MRI abnormalities do not correlate with disease activity.43–45
The percentage of patients with positive OCBs in our cohort is lower than that reported in other MS cohorts from Caucasian populations.46–48 However, there are other cohorts reporting lower rates of OCBs among patients with MS.49–51 This may be due to ethnic and immunogenetic factors, which are currently unknown.
As of to date, besides the number of lesions on MRI, the main parameter predicting the risk of conversion from CIS to CDMS and the risk of disability accumulation for patients with MS are the presence of positive OCBs, whereas sex, age, and clinical presentation are of less importance.52–54 However, the clinical course of the disease is largely unpredictable.4,7
Why do cells in the CSF predict disease activity? They may reflect one of 2 possibilities or both. The first would be the intensity of the immune response in brain regions adjacent to the subarachnoid space. They might also represent an innate response to infection, probably viral, triggering the initial relapse. Whether they represent a marker or a factor with pathogenetic significance is currently unknown.
Last, these findings may have a therapeutic implication. In a condition supposed to be immune mediated, markers of inflammation associated with a more severe disease course might suggest a more aggressive therapeutic approach.
Several limitations should be taken into consideration when evaluating these results: the study's retrospective design, the small sample size, and the lack of paraclinical data during follow-up to confirm the correlation with the clinical results.
In conclusion, CSF pleocytosis at presentation of MS might serve as another biological marker reflecting a more active inflammatory process and thus might indicate an active immunosuppressive therapy in the future.
Glossary
- ARR
annualized relapse rate
- CDMS
clinically definite MS
- CIS
clinically isolated syndrome
- DMT
disease-modifying therapy
- EDSS
Expanded Disability Status Scale
- EP
evoked potential
- EPS
evoked potential study
- LP
lumbar puncture
- OCB
oligoclonal band
- RRMS
relapsing-remitting MS
- WBC
white blood cell
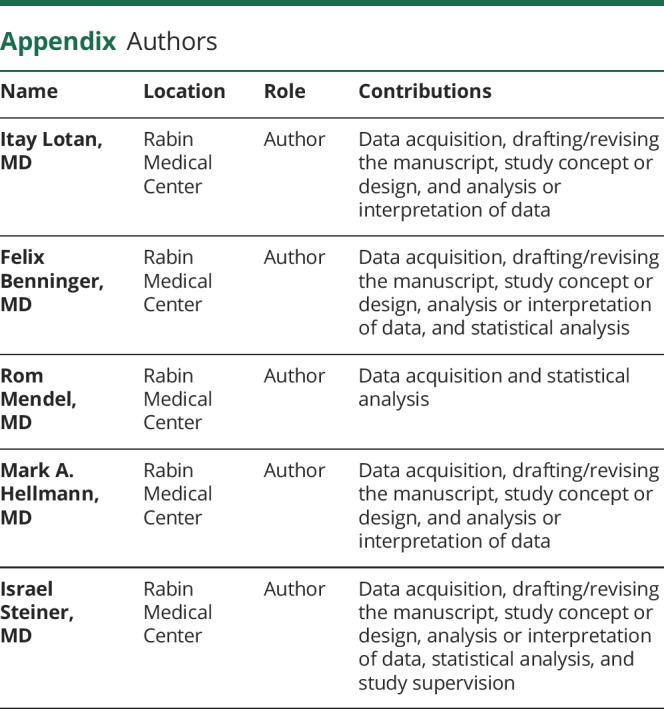
Appendix. Authors
Study funding
This research did not receive any specific grant from funding agencies in the public, commercial, or nonprofit sectors.
Disclosure
Disclosures available: Neurology.org/NN
References
- 1.Leray E, Moreau T, Fromont A, Edan G. Epidemiology of multiple sclerosis. Rev Neurol (Paris) 2016;172:3–13. [DOI] [PubMed] [Google Scholar]
- 2.Pugliatti M, Rosati G, Carton H, et al. The epidemiology of multiple sclerosis in Europe. Eur J Neurol 2006;13:700–722. [DOI] [PubMed] [Google Scholar]
- 3.Koch-Henriksen N, Sorensen PS. The changing demographic pattern of multiple sclerosis epidemiology. Lancet Neurol 2010;9:520–532. [DOI] [PubMed] [Google Scholar]
- 4.Compston A, Coles A. Multiple sclerosis. Lancet 2008;372:1502–1517. [DOI] [PubMed] [Google Scholar]
- 5.Thompson AJ, Banwell BL, Barkhof F, et al. Diagnosis of multiple sclerosis: 2017 revisions of the McDonald criteria. Lancet Neurol 2018;17:162–173. [DOI] [PubMed] [Google Scholar]
- 6.Huang WJ, Chen WW, Zhang X. Multiple sclerosis: pathology, diagnosis and treatments. Exp Ther Med 2017;13:3163–3166. [DOI] [PMC free article] [PubMed] [Google Scholar]
- 7.Sayao AL, Devonshire V, Tremlett H. Longitudinal follow-up of “benign” multiple sclerosis at 20 years. Neurology 2007;68:496–500. [DOI] [PubMed] [Google Scholar]
- 8.Sellebjerg F, Christiansen M, Nielsen PM, Frederiksen JL. Cerebrospinal fluid measures of disease activity in patients with multiple sclerosis. Mult Scler 1998;4:475–479. [DOI] [PubMed] [Google Scholar]
- 9.Kuhle J, Pohl C, Mehling M, et al. Lack of association between antimyelin antibodies and progression to multiple sclerosis. N Engl J Med 2007;356:371–378. [DOI] [PubMed] [Google Scholar]
- 10.Tintore M, Rovira A, Río J, et al. Do oligoclonal bands add information to MRI in first attacks of multiple sclerosis? Neurology 2008;70:1079–1083. [DOI] [PubMed] [Google Scholar]
- 11.Moroso A, Deloire MS, Ruet A, Ouallet JC, Casey R, Brochet B. Does cerebrospinal fluid analysis add predictive value to magnetic resonance imaging for long term irreversible disability in patients with early multiple sclerosis? J Neurol Sci 2015;354:51–55. [DOI] [PubMed] [Google Scholar]
- 12.Dobson R, Ramagopalan S, Davis A, Giovannoni G. Cerebrospinal fluid oligoclonal bands in multiple sclerosis and clinically isolated syndromes: a meta-analysis of prevalence, prognosis and effect of latitude. J Neurol Neurosurg Psychiatry 2013;84:909–914. [DOI] [PubMed] [Google Scholar]
- 13.Bodini B, Calabresi PA. From neurofilament research to multiple sclerosis clinical practice: where do we stand? Neurology 2017;88:816–817. [DOI] [PubMed] [Google Scholar]
- 14.Petzold A. The prognostic value of CSF neurofilaments in multiple sclerosis at 15-year follow-up. J Neurol Neurosurg Psychiatry 2015;86:1388–1390. [DOI] [PubMed] [Google Scholar]
- 15.Petzold A, Steenwijk MD, Eikelenboom JM, Wattjes MP, Uitdehaag BM. Elevated CSF neurofilament proteins predict brain atrophy: a 15-year follow-up study. Mult Scler 2016;22:1154–1162. [DOI] [PubMed] [Google Scholar]
- 16.Soelberg Sorensen P, Sellebjerg F. Neurofilament in CSF-A biomarker of disease activity and long-term prognosis in multiple sclerosis. Mult Scler 2016;22:1112–1113. [DOI] [PubMed] [Google Scholar]
- 17.Teunissen CE, Khalil M. Neurofilaments as biomarkers in multiple sclerosis. Mult Scler 2012;18:552–556. [DOI] [PubMed] [Google Scholar]
- 18.Rathbone E, Durant L, Kinsella J, et al. Cerebrospinal fluid immunoglobulin light chain ratios predict disease progression in multiple sclerosis. J Neurol Neurosurg Psychiatry 2018;89:1044–1049. [DOI] [PMC free article] [PubMed] [Google Scholar]
- 19.Saez MS, Rojas JI, Lorenzón MV, et al. Validation of CSF free light chain in diagnosis and prognosis of multiple sclerosis and clinically isolated syndrome: prospective cohort study in Buenos Aires. J Neurol 2019;266:112–118. [DOI] [PubMed] [Google Scholar]
- 20.Voortman MM, Stojakovic T, Pirpamer L, et al. Prognostic value of free light chains lambda and kappa in early multiple sclerosis. Mult Scler 2017;23:1496–1505. [DOI] [PubMed] [Google Scholar]
- 21.Eikelenboom MJ, Petzold A, Lazeron RH, et al. Multiple sclerosis: neurofilament light chain antibodies are correlated to cerebral atrophy. Neurology 2003;60:219–223. [DOI] [PubMed] [Google Scholar]
- 22.Kuhle J, Nourbakhsh B, Grant D, et al. Serum neurofilament is associated with progression of brain atrophy and disability in early MS. Neurology 2017;88:826–831. [DOI] [PMC free article] [PubMed] [Google Scholar]
- 23.Housley WJ, Pitt D, Hafler DA. Biomarkers in multiple sclerosis. Clin Immunol 2015;161:51–58. [DOI] [PubMed] [Google Scholar]
- 24.Katsavos S, Anagnostouli M. Biomarkers in multiple sclerosis: an up-to-date overview. Mult Scler Int 2013;2013:340508. [DOI] [PMC free article] [PubMed] [Google Scholar]
- 25.Axisa PP, Hafler DA. Multiple sclerosis: genetics, biomarkers, treatments. Curr Opin Neurol 2016;29:345–353. [DOI] [PMC free article] [PubMed] [Google Scholar]
- 26.Harris VK, Tuddenham JF, Sadiq SA. Biomarkers of multiple sclerosis: current findings. Degener Neurol Neuromuscul Dis 2017;7:19–29. [DOI] [PMC free article] [PubMed] [Google Scholar]
- 27.Polman CH, Reingold SC, Banwell B, et al. Diagnostic criteria for multiple sclerosis: 2010 revisions to the McDonald criteria. Ann Neurol 2011;69:292–302. [DOI] [PMC free article] [PubMed] [Google Scholar]
- 28.Fischman RA. Cerebrospinal Fluid in Diseases of the Nervous System. Philadelphia: Saunders; 1992:431. [Google Scholar]
- 29.Zunt JR, Marra CM. Cerebrospinal fluid testing for the diagnosis of central nervous system infection. Neurol Clin 1999;17:675–690. [DOI] [PubMed] [Google Scholar]
- 30.Coyle PK. Overview of acute and chronic meningitis. Neurol Clin 1999;17:711–736. [DOI] [PMC free article] [PubMed] [Google Scholar]
- 31.Karussis D. Immunotherapy of multiple sclerosis: the state of the art. BioDrugs 2013;27:113–148. [DOI] [PubMed] [Google Scholar]
- 32.D'Amico E, Ziemssen T, Cottone S. Induction therapy for the management of early relapsing forms of multiple sclerosis. A critical opinion. Expert Opin Pharmacother 2017;18:1553–1556. [DOI] [PubMed] [Google Scholar]
- 33.Kalincik T, Manouchehrinia A, Sobisek L, et al. Towards personalized therapy for multiple sclerosis: prediction of individual treatment response. Brain 2017;140:2426–2443. [DOI] [PubMed] [Google Scholar]
- 34.Merkel B, Butzkueven H, Traboulsee AL, Havrdova E, Kalincik T. Timing of high-efficacy therapy in relapsing-remitting multiple sclerosis: a systematic review. Autoimmun Rev 2017;16:658–665. [DOI] [PubMed] [Google Scholar]
- 35.Ziemssen T, De Stefano N, Sormani MP, Van Wijmeersch B, Wiendl H, Kieseier BC. Optimizing therapy early in multiple sclerosis: an evidence-based view. Mult Scler Relat Disord 2015;4:460–469. [DOI] [PubMed] [Google Scholar]
- 36.Lucchinetti CF, Popescu BF, Bunyan RF, et al. Inflammatory cortical demyelination in early multiple sclerosis. N Engl J Med 2011;365:2188–2197. [DOI] [PMC free article] [PubMed] [Google Scholar]
- 37.Absinta M, Vuolo L, Rao A, et al. Gadolinium-based MRI characterization of leptomeningeal inflammation in multiple sclerosis. Neurology 2015;85:18–28. [DOI] [PMC free article] [PubMed] [Google Scholar]
- 38.Petzold A. Intrathecal oligoclonal IgG synthesis in multiple sclerosis. J Neuroimmunol 2013;262:1–10. [DOI] [PubMed] [Google Scholar]
- 39.Bsteh G, Ehling R, Lutterotti A, et al. Long term clinical prognostic factors in relapsing-remitting multiple sclerosis: insights from a 10-year observational study. PLoS One 2016;11:e0158978. [DOI] [PMC free article] [PubMed] [Google Scholar]
- 40.Gajofatto A, Calabrese M, Benedetti MD, Monaco S. Clinical, MRI, and CSF markers of disability progression in multiple sclerosis. Dis Markers 2013;35:687–699. [DOI] [PMC free article] [PubMed] [Google Scholar]
- 41.von Gumberz J, Mahmoudi M, Young K, et al. Short-term MRI measurements as predictors of EDSS progression in relapsing-remitting multiple sclerosis: grey matter atrophy but not lesions are predictive in a real-life setting. PeerJ 2016;4:e2442. [DOI] [PMC free article] [PubMed] [Google Scholar]
- 42.Uher T, Vaneckova M, Sobisek L, et al. Combining clinical and magnetic resonance imaging markers enhances prediction of 12-year disability in multiple sclerosis. Mult Scler 2017;23:51–61. [DOI] [PubMed] [Google Scholar]
- 43.Barkhof F. The clinico-radiological paradox in multiple sclerosis revisited. Curr Opin Neurol 2002;15:239–245. [DOI] [PubMed] [Google Scholar]
- 44.Ciccarelli O, Brex PA, Thompson AJ, Miller DH. Disability and lesion load in MS: a reassessment with MS functional composite score and 3D fast FLAIR. J Neurol 2002;249:18–24. [DOI] [PubMed] [Google Scholar]
- 45.Barkhof F. MRI in multiple sclerosis: correlation with expanded disability status scale (EDSS). Mult Scler 1999;5:283–286. [DOI] [PubMed] [Google Scholar]
- 46.Pryce G, Baker D. Oligoclonal bands in multiple sclerosis; Functional significance and therapeutic implications. Does the specificity matter? Mult Scler Relat Disord 2018;25:131–137. [DOI] [PubMed] [Google Scholar]
- 47.Huss AM, Halbgebauer S, Öckl P, et al. Importance of cerebrospinal fluid analysis in the era of McDonald 2010 criteria: a German-Austrian retrospective multicenter study in patients with a clinically isolated syndrome. J Neurol 2016;263:2499–2504. [DOI] [PMC free article] [PubMed] [Google Scholar]
- 48.Freedman MS, Thompson EJ, Deisenhammer F, et al. Recommended standard of cerebrospinal fluid analysis in the diagnosis of multiple sclerosis: a consensus statement. Arch Neurol 2005;62:865–870. [DOI] [PubMed] [Google Scholar]
- 49.da Gama PD, Machado Ldos R, Livramento JA, et al. Oligoclonal bands in cerebrospinal fluid of black patients with multiple sclerosis. Biomed Res Int 2015;2015:217961. [DOI] [PMC free article] [PubMed] [Google Scholar]
- 50.Andreadou E, Chatzipanagiotou S, Constantinides VC, Rombos A, Stamboulis E, Nicolaou C. Prevalence of cerebrospinal fluid oligoclonal IgG bands in Greek patients with clinically isolated syndrome and multiple sclerosis. Clin Neurol Neurosurg 2013;115:2094–2098. [DOI] [PubMed] [Google Scholar]
- 51.Gama PD, Machado Ldos R, Livramento JA, et al. Study of oligoclonal bands restricted to the cerebrospinal fluid in multiple sclerosis patients in the city of São Paulo. Arq Neuropsiquiatr 2009;67:1017–1022. [DOI] [PubMed] [Google Scholar]
- 52.Tintore M, Rovira À, Río J, et al. Defining high, medium and low impact prognostic factors for developing multiple sclerosis. Brain 2015;138(pt 7):1863–1874. [DOI] [PubMed] [Google Scholar]
- 53.Ruet A, Arrambide G, Brochet B, et al. Early predictors of multiple sclerosis after a typical clinically isolated syndrome. Mult Scler 2014;20:1721–1726. [DOI] [PubMed] [Google Scholar]
- 54.Jokubaitis VG, Spelman T, Kalincik T, et al. Predictors of disability worsening in clinically isolated syndrome. Ann Clin Transl Neurol 2015;2:479–491. [DOI] [PMC free article] [PubMed] [Google Scholar]
Associated Data
This section collects any data citations, data availability statements, or supplementary materials included in this article.
Data Availability Statement
Anonymized data presented in this report will be made available to bona fide investigators upon request to the corresponding author.


