Abstract
Electrical activities of excitable cells produce diverse spiking-bursting patterns. The dynamics of the neuronal responses can be changed due to the variations of ionic concentrations between outside and inside the cell membrane. We investigate such type of spiking-bursting patterns under the effect of an electromagnetic induction on an excitable neuron model. The effect of electromagnetic induction across the membrane potential can be considered to analyze the collective behavior for signal processing. The paper addresses the issue of the electromagnetic flow on a modified Hindmarsh–Rose model (H–R) which preserves biophysical neurocomputational properties of a class of neuron models. The different types of firing activities such as square wave bursting, chattering, fast spiking, periodic spiking, mixed-mode oscillations etc. can be observed using different injected current stimulus. The improved version of the model includes more parameter sets and the multiple electrical activities are exhibited in different parameter regimes. We perform the bifurcation analysis analytically and numerically with respect to the key parameters which reveals the properties of the fast-slow system for neuronal responses. The firing activities can be suppressed/enhanced using the different external stimulus current and by allowing a noise induced current. To study the electrical activities of neural computation, the improved neuron model is suitable for further investigation.
Keywords: Improved H–R model, Electromagnetic induction effect, Bifurcation, Various neuronal responses, Noise
Introduction
The dynamics of electrical activities in the nervous system mainly responds to the propagation and transmission of signals (Coombes and Bressloff 2005; Izhikevich 2007; Wang and Ma 2018). The basic functional unit of the nervous system is neurons which compose the large nervous system with astrocyte and gliocytes cells (Tang et al. 2013, 2016; Li et al. 2016). The different firing activities and information processing present complex nonlinear dynamical behavior (Izhikevich 2007; Ma and Tang 2015). Based on the experimental results, different biophysical mathematical neuron models have been constructed. The application of nonlinear dynamical theory and numerical computational results on these models reveal the biophysical phenomena often found in the experiments. The mathematical neuron models (Izhikevich 2004) advance the rapid development in biophysical research and it allows theoretical and computational studies of neural computation. Many research articles have been studied the electrical activities (Tsaneva-Atanasova et al. 2010; Lv et al. 2016; Lv and Ma 2016; Herz et al. 2006; Bertram and Rubin 2017; Upadhyay et al. 2017) and collective behavior of networks (Izhikevich et al. 2003; Zhou et al. 2012; Wig et al. 2011). The various firing activities of single neurons involve different patterns such as quiescent, different spiking and bursting using suitable injected current stimulus and different parameter sets. It is considered that the variations of membrane voltage depend on the transmembrane current functions, on-off switching conditions of ion channels and even functional activities generated by astrocyte (Tang et al. 2013). The nonlinear neuronal oscillators are biologically plausible and computationally efficient to describe the electrical activities of neurons.
The injected current stimulus and electrical field cause variations in the membrane voltage. The variations in ionic conductances occur when the charged ionic particles pass through the ion channels across the membrane. Time delay can be considered in the excitable biophysical model and there is a potential importance to estimate the memory effects in the time delayed system. Apart from the effects of ion channel concentrations, the biophysical effects of autapse can be considered to study the mode transition and various electrical activities (Bekkers 2003; Song et al. 2015; Herrmann and Klaus 2004; Qin et al. 2014). It is biophysically plausible to describe the memory flux across the cell membrane. The activity of memristor is widely used in nonlinear dynamical systems and electrical circuits (Bao et al. 2016; Wu et al. 2016a, b). The major effects of electromagnetic induction can be considered during the variations of ionic concentrations across the cell membrane. It can originate time dependent electromagnetic field and induced current stimulus in the media (Lv and Ma 2016; Lv et al. 2016; Xu et al. 2017; Wang et al. 2017; Zhan and Liu 2017). Hence, the magnetic flux can be introduced to show the effect of electromagnetic induction in the cell. It is often found that the bifurcation analysis can be useful to understand the transition of electrical activities i.e., the firing behavior and its stability. The experimental studies and further works on bifurcation analysis help us to understand the different transition modes of firing patterns of neurons (Xiao-Bo et al. 2008; Gu et al. 2013, 2014). More predominant parameters can be incorporated in the H–R model to investigate the intrinsic dynamics and bifurcation analysis (Shilnikov and Kolomiets 2008; Storace et al. 2008; Barrio and Shilnikov 2011; Gu and Pan 2015).
In this article, the effects of electromagnetic induction are considered on an improved version of H–R model by introducing more controlled bifurcation parameters (Perc and Marhl 2005) using an externally injected current stimulus. In order to facilitate the analytical and numerical computations, we demonstrate that the qualitative behavior of the excitable model is suitable to study the firing activities and the bifurcations which control different firing patterns at different key parameters. Further, the role of noise in changing the dynamical properties of the excitable biological systems (Faisal et al. 2008; Higham 2001; Lindner et al. 2004) are studied. The effects of noise have potential applications in neuronal systems (Ditlevsen and Samson 2013; Perc 2006; Longtin 2010). Generally, it is observed that noise can excite the quiescent state of the neuron, however it can also suppress the natural firing activities of the neurons. We add white Gaussian noise to the system to demonstrate the changes in firing activity of the system. The injected force such as noise induces the deterministic system into a stochastic one under certain parameter regimes (Wang et al. 2017). Such complete fast-slow system analysis provides different views of the solution. The approach of the solution technique reveals the nature of the attractors and inner dynamics of the system.
The description of the improved H–R system
The H–R system consists of three coupled ODEs (Izhikevich 2004; Lv et al. 2016; Shilnikov and Kolomiets 2008; Barrio and Shilnikov 2011). The effects of electromagnetic induction is considered during the variations of membrane voltage of excitable cells. The formulation of the improved model is based on the H–R model. The dynamical equations for the modified version of the H–R system with induced electromagnetic induction and injected current stimulus are described as follows (Tsaneva-Atanasova et al. 2010; Lv and Ma 2016; Lv et al. 2016)
| 1 |
where the functions and are sufficiently smooth functions and the systems variables (u, v, z, w) . The parameters and denote the rate constants that control the separation of time scale. The state variable, u represents the membrane voltage of the H–R neuron. The system variables, v and z measure the gating dynamics of the ion channels and the dynamics of cytosolic channels respectively (Tsaneva-Atanasova et al. 2010). The function indicates a cubic polynomial function that confirms N-shaped u-nullcline. It measures the contribution of ionic inward current. The negative value of v in the right hand side expression of first equation of Eq. 1 indicates the contribution of the outward voltage sensitive ionic currents. The value measures the contribution of the outward calcium-sensitive potassium current. The function displays the delayed rectifier activation kinetics. It depends on the membrane voltage. The third function is a linear function and it shows the dynamics of ionic channels. The expression including exchanges the source of calcium ions across the voltage-gated ion channels where measures the location of the fixed point of the system and the parameter controls the location and type of bifurcation in the system. The term is responsible for decay dynamics of cytosolic channels (Tsaneva-Atanasova et al. 2010). The first two equations present the fast subsystem and the third equation indicates the slow subsystem. We consider in the system for numerical computation and has small positive value. The exchange of ions through cell membrane can generate variations in membrane voltage and time dependent electromagnetic field can be generated in the neuronal cell. The electromagnetic induction (Lv et al. 2016; Lv and Ma 2016) is considered in the system. The fourth system variable, w indicates the magnetic flux across the cell membrane. The function describes the memory conductance of a magnetic flux-controlled memristor (Bao et al. 2010; Muthuswamy 2010; Li et al. 2015). The function, explores the coupling relation between magnetic flux and membrane voltage of the H–R neuron. The memory conductance of memristor can be expressed as , where and represent fixed parameter values (Li et al. 2015). The parameters and measure the interaction between membrane voltage and magnetic flux. The term denotes the suppression modulation on membrane voltage and it depends on the variation of magnetic flux by generating current function (Lv and Ma 2016; Lv et al. 2016; Xu et al. 2017). A negative feedback condition is considered due to the effects of sodium and potassium ionic currents to the membrane voltage and magnetic flux condition across the cell membrane.
Stability, Bifurcation analysis and diverse firing activities of the improved H–R system
The mathematical model may be useful for further investigation in the transition of different electrical activities by time varying injected current under the effect of electromagnetic induction. To study the nature of the dynamical behavior of the system, we analyze the stability, bifurcation and various firing activities. To find the fixed points, we consider be an equilibrium point of the system 1 at () (see “Appendix A”). Two different parameter sets are considered for numerical simulation (Tsaneva-Atanasova et al. 2010; Lv et al. 2016) where , , Set I: and Set II: respectively. The applied injected current stimulus is considered as , where measures the angular frequency and A is the amplitude of the external current stimulus. The real equilibrium points at the parameter sets I and II are (a) and (b) respectively. Now, it follows that is a stable focus node and is a saddle focus which is unstable. The system 1 is in a resting state condition at first parameter set and the system exhibits oscillatory behavior at the second parameter set around the unstable equilibrium solution. Now, the bifurcation scenarios and the various firing properties are studied at the above parameter sets.
Bifurcation analysis
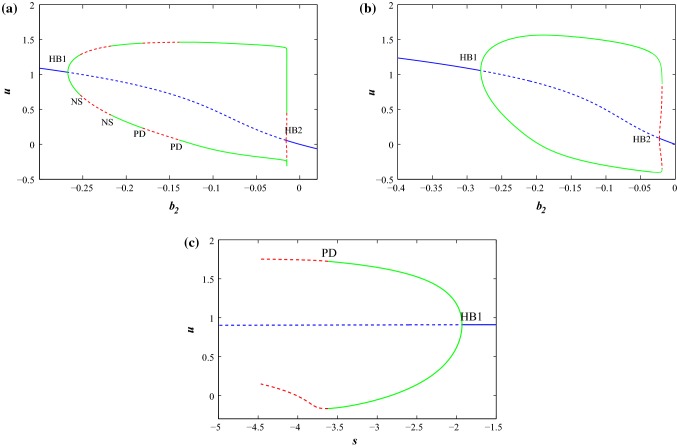
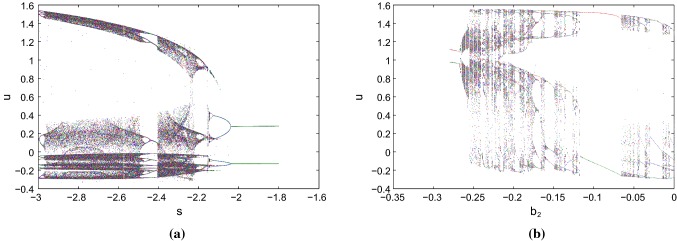
We draw the bifurcation scenarios with the predefined predominant prameters and s respectively at the two parameter sets with different external stimulus current, I using MATCONT software. First, we consider parameter Set I and . For , the system has a stable focus node and there exists quiescent state. For , the system changes its behavior from quiescent state to bursting then tonic spiking and later it shows regular spiking as we increase the value of the parameter . The system has unstable focus node and saddle node in between after that there arises a stable focus node. The quiescent state disappears through a supercritical Hopf bifurcation (HB1) by the birth of a stable limit cycle at = . The limit cycle changes its stability through Neimark Sacker (NS) bifurcation at and respectively. As we increase the value of , the limit cycle changes its stability through period doubling bifurcation (PD) and limit point bifurcation of cycles (LPC) at , and respectively. Again the quiescent state appears through a subcritical Hopf bifurcation (HB2) at = . In Fig. 1a, the thick blue line describes the stable region and dashed blue line describes the unstable region of fixed points. A stable limit cycle (thick green line) changes its stability to an unstable limit cycle shown in dashed red line. Now, we consider parameter Set II and . For , the system has a stable focus node and there exists quiescent state. For , the system changes its behavior from quiescent state to tonic spiking as we increase the value of the parameter . The system has unstable focus node in between after that there arises a stable focus node. As we increase the value of the quiescent state disappears through a supercritical Hopf bifurcation (HB1) at = . The stable limit cycle changes its stability through limit point bifurcation of cycles (LPC) at . The quiescent state again appears through a subcritical Hopf bifurcation (HB2) at = . In Fig. 1b, the thick blue line describes the stable region and dashed blue line describes the unstable region of fixed points. A stable limit cycle (thick green line) changes its stability to an unstable limit cycle shown in dashed red line. Next, we consider s as predominant parameter with parameter Set II and , for the system has a stable focus node and there exist quiescent state. For , the system has unstable focus node upto and after that it has saddle point. As we decrease the value of s the quiescent state disappears through a supercritical Hopf bifurcation (HB1) at , which indicates the born of a limit cycle at this point (see Fig. 1c). The stable limit cycle changes its stability through period doubling bifurcation (PD) at . Next, we consider the parameter Set I with external stimulus . The system undergoes chaotic region and with the increase of s, it enters into period halving bifurcation region (see Fig. 2a).With parameter Set I and , it bifurcates from two points and generates period doubling bifurcation. Next, it undergoes multiple periodic patterns with the increase of . Finally, with further increase of , it undergoes period halving bifurcation from the two windows and enters into limit cycle region (see Fig. 2b).
Fig. 1.
Bifurcation scenarios of the improved H–R system (1) with . The thick blue line describes the stable equilibrium branch and dashed blue line describes the unstable equilibrium branch. The stable and unstable limit cycles are denoted by thick green line and dashed red line respectively. a and b as a predominant parameter with set I and set II respectively. cs as a predominant parameter with set II. (Color figure online)
Fig. 2.
Bifurcation scenarios of the system 1 with the predominant parameter s and at parameter set I respectively under electromagnetic induction and different external current stimulus
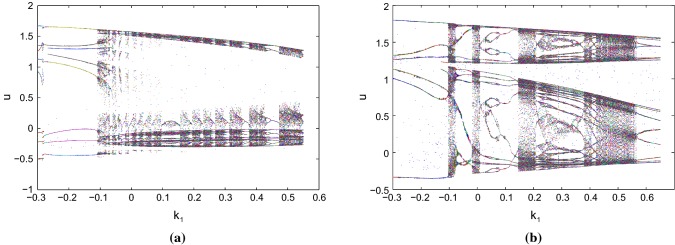
We perform the bifurcation scenarios with respect to the feedback gain parameter as the predominant parameter from negative to positive region at the two parameter sets and remaining parameters have their base values. We can change the dynamics by varying the values of under the action of electromagnetic induction with the help of bifurcation scenarios. At the second parameter set, the system enters into a chaotic and limit cycle regions alternatively and finally, it shows multiple single periodic windows from chaotic region (see Fig. 3).
Fig. 3.
Bifurcation scenarios of the system 1 with feedback gain parameter as the predominant parameter of the system at the two parameter sets respectively under electromagnetic induction and current stimulus a, and b respectively
We analytically derive the Hopf bifurcation point with the predominant parameter to verify the numerical results (see Fig. 1a).
The characteristic equation of the system 1 can be written as
| 2 |
the coefficients of the characteristic Eq. 2 are described in “Appendix B”. In Andronov–Hopf bifurcation case (Hsü and Kazarinoff 1976, 1977; Kuznetsov 1998), it produces a limit cycle from a fixed point or equilibrium solution in a dynamical systems of ODEs, when the fixed point changes its stability through a pair of purely imaginary eigenvalues. The bifurcation can be supercritical or subcritical, resulting in stable or unstable limit cycle, respectively.
Consider the model 1 with the predominant parameter , where the equilibrium point is depending on . Let the eigenvalues of the Jacobian (see “Appendix B”) about the fixed point becomes Suppose the following conditions are satisfied for particular critical value of , say .
The Jacobian matrix J (see “Appendix B”) has a simple pair of purely imaginary eigenvalues and other eigenvalues have negative real parts at the critical value of around the fixed point (i.e., , known as non-hyperbolicity condition). Then there exists a smooth curve of fixed point with the critical point of and the eigenvalues vary smoothly with the change of . Moreover, if
(known as transversality condition), then the system undergoes a Hopf-bifurcation.
To test the Hopf-bifurcation analysis, assume that the characteristic equation has a pair of purely imaginary roots , then the equation becomes this implies Accordingly, we separate the real and imaginary parts we have i.e., and
Consider the charactersitic polynomial where represents the predominant or control parameter of the system. Assume that there is a smooth curve of equilibium solution at for the H–R system 1. With the help of Routh-Hurwitz (R-H) condition, it can be described that for the occurence of a simple Hopf bifurcation the above conditions (a) and (b) are equivalent to the following conditions on the coefficients of the characteristic equation . , and at . Suppose there exists an interval containing the point for some preassigned , so that . The characteristic equation of the equilibrium point has purely imaginary roots. Numerically, the complex roots of the characteristic Eq. 2 are derived in “Appendix C”.
At parameter Set I, substitute , we find the critical value of . The point becomes while the remaining parameters are fixed. We derived analytically the value of at this critical point of . It is observed that the real parts of eigenvalue becomes and imaginary part is At parameter Set I, the value of the equilibrium point at becomes . The complex roots become (it is verified by ) and the other two real roots become . Now, it is observed that all the R-H criterion are satisfied at the critical value of around the fixed point . Therefore, the system exhibits a simple Hopf-bifurcation around . Now, using condition (b), it can be found that the derivative of real parts of the complex eigenvalue is non zero and it is .
To find the stability of the bifurcating periodic solution, we consider the following method (Hsü and Kazarinoff 1976, 1977). Suppose the system can be written as where and it is written x for to shift the fixed point at origin. A is the linearized matrix at the equilibrium point i.e., the Jacobian matrix, J (see “Appendix B”). Suppose A has two purely complex eigenvalues as mentioned above and F is analytic in x and . Then the bifurcation theorem (Hsü and Kazarinoff 1977) ensures that a one parameter family of periodic solutions exists for one of the conditions of the values of or or . It can be found from the formula (See “Appendix C”) (Hsü and Kazarinoff 1976, 1977) (also known as genericity condition). If , then under the conditions of Hopf-bifurcation (a) and (b), the bifurcating periodic solutions emerging from the fixed point near the control parameter are aymptotically orbitally stable with asymptotic phase if , however it is unstable if . Now, numerically the value of can be found using above formula. The bifurcating periodic solutions emerging from the fixed point at parameter Set I with critical value of are aymptotically orbitally stable with asymptotic phase as . Here, the dynamical phenomenon in Hopf-bifurcation includes that a stable focus node becomes saddle focus as the control parameter is increased around a neighbourhood of and the attractor becomes a limit cycle attractor. This analytical results show that the occurrence of Hopf bifurcation at the crictical value is supercritical which verified our numerical results (see Fig. 1a).
Various firing activities
The deterministic system dynamics is integrated using fourth-order Runge–Kutta (R–K) method with time step 0.001. The initial conditions of the system variables are used small positive quantities randomly perturbed from the real fixed points of the system 1. The different types of spiking and bursting patterns are observed under negative feedback induction current function as well as positive feedback induction current function (i.e., positive and negative values of ). The system can change its oscillatory behavior with multiple electrical activities from quiescent state at an appropriate parameter set by injecting a periodic current stimulus. Various bursting patterns are exhibited with the increase of amplitude of the periodic currents for different angular frequencies, . The spiking behavior are observed with small intensity of injected current and bursting are produced with larger intensity of current amplitudes for different angular frequencies.
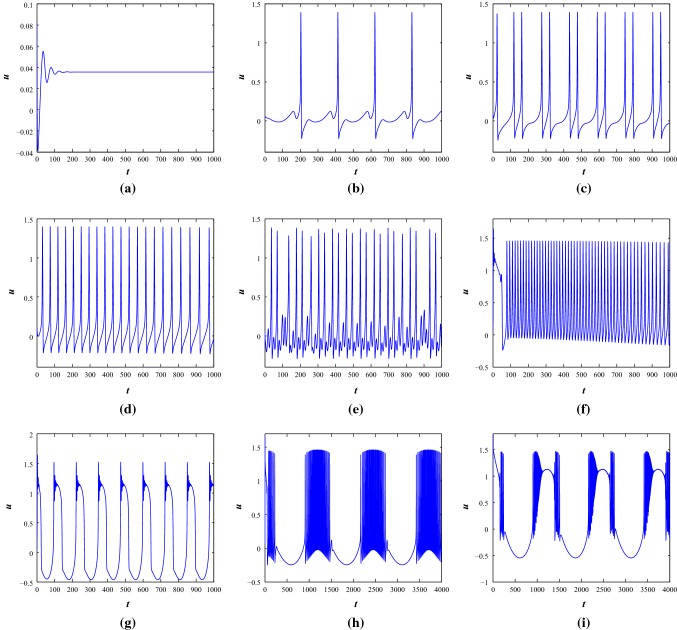
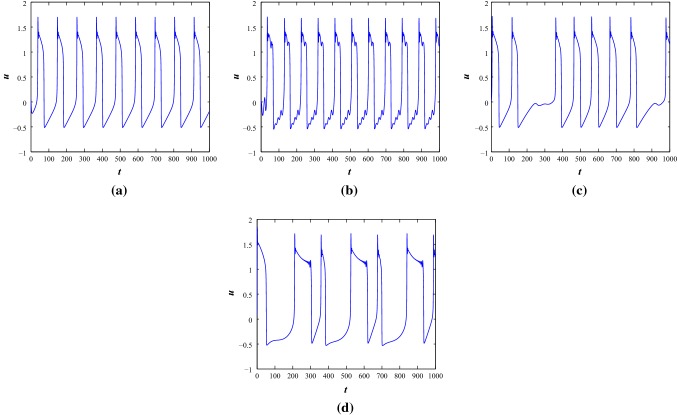
First, we consider negative feedback induced current with (Lv et al. 2016). It is found that resting state, periodic firing state, fast spiking oscillations, regular/irregular bursting, chattering, mixed mode oscillations can be produced by changing appropriate external periodic applied stimulus, at both the parameter sets. At , the system is in a resting state condition (see Fig. 4a). With the increase of amplitude A and various angular frequency , the system produces different spiking and bursting. With , the system produces train of regular spikes () and chattering () (see Fig. 4b–c). When the external stimulus converges to with and , the system generates periodic spiking and mixed mode oscillations (see Fig. 4d–e). The mixed mode oscillations consist of multiple number of regular single spikes and subthreshold oscillations. While the external stimulus is changed to , fast spiking oscillations are generated with and another kind of regular periodic bursting with respectively (see Fig. 4f–g). Now, with fixed and various amplitude of and 1.5, the improved H–R system produces regular square wave bursting and different bursting patterns (see Fig. 4h–i).
Fig. 4.
The time series scenarios of membrane voltage of the system 1 at parameter Set I under different injected current stimulus. a, , b, c, and 0.04, d, e, and 0.4, f, g, and 0.05, h, i, and 1.5 respectively
Now, we consider positive feedback induction current function with to observe the firing activities of the systems at different current stimulus, I (see Fig. 5). The electrical activities at parameter Set I for shows that, the system fires with regular spikes however, the system is in resting state condition with negative feedback induction current. With and , the system produces multiple number of irregular spikes while with , the system generates mixed mode oscillations. With the increase of amplitude of current and , the system shows spikes with different interspike intervals. However, with negative feedback current, the system presents regular bursting. Further, with the increase of and , the firing behavior of negative and positive feedback current is different. One shows bursting and another produces spiking.
Fig. 5.
The time series scenarios of membrane voltage of the system 1 at parameter Set I under different injected current stimulus, I with positive feedback induced current function . a, , b, , c, and d, respectively
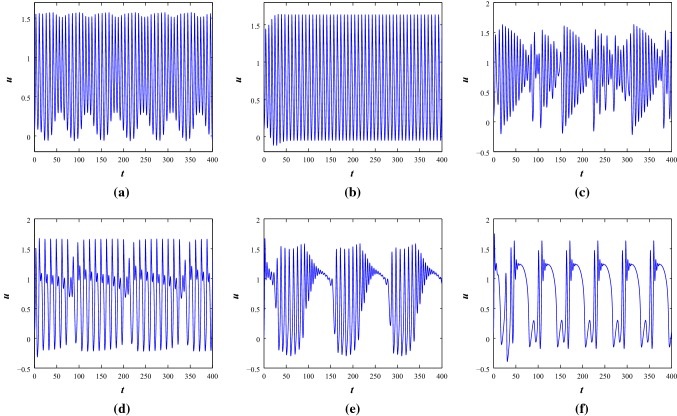
Next, we deal with the parameter Set II for negative feedback current (see Fig. 6). With , the system produces irregular multiple spiking when the angular frequency is considered as , regular fast spiking with and irregular bursting with respectively. With the increase of and , it produces bursting and with and , it also exhibits different bursting patterns. Bursting patterns with subthreshold oscillations can be observed with and (see Fig. 6).
Fig. 6.
The time series scenarios of membrane voltage of the system 1 at parameter Set II under different external injected current stimulus. a–c, and 1, d, , e, and f, respectively
Now, we consider the positive feedback current with (see Fig. 7). The system produces planar bursting behavior (Izhikevich 2007) with and , however the system shows irregular multiple spiking with negative feedback current function. The system produces regular spiking at and however, the nature of the firing pattern is different in the two cases. With and , the system shows bursting.
Fig. 7.
The time series scenarios of membrane voltage of the system 1 at parameter Set II under different injected current stimulus, I with positive feedback induced current function . a, , b, and c, respectively
Noise induced oscillations
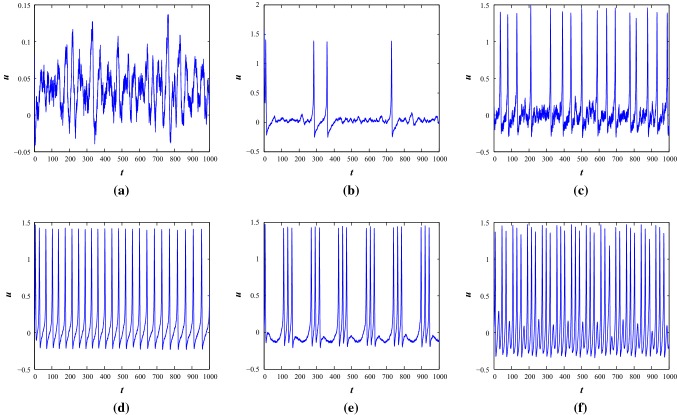
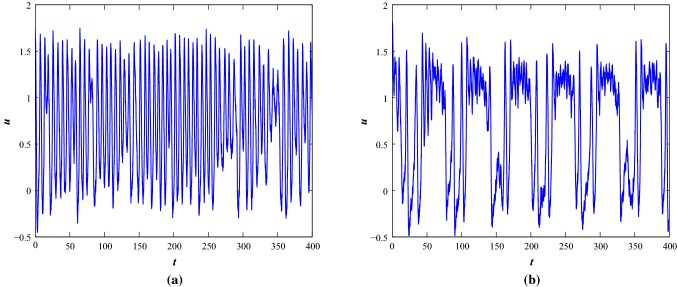
Noise can act as a driving force in nonlinear dynamical systems. The noisy system dynamics can be explored by allowing a white Gaussian noise current in the system with noise intensity, and satisfies the properties which shows the autocorrelation function and . The noise amplitudes can be scaled using the value of to achieve higher noise intensities. The noise induced system can be considered as where shows the stochastic process. indicates a Wiener process. It can be expressed in the form , where is the white noise process. The functions and present the drift and diffusion coefficients of the stochastic system where is the parameter space. In this work, the additive white noise is considered. Assume the discretization of time steps Now, the time steps are defined as and the increments of the Wiener process are defined as . It defines that which is used to costruct the solution of the stochastic differential equations and it is assumed that the process is time-homogeneous. The noisy system assumes that some degree of noisiness exists in the dynamical processes of the system. We use EM (Higham 2001; Ditlevsen and Samson 2013) technique to compute the numerical results and consider small positive values as initial conditions. The solution is computed in a discretized way by allowing a fixed time interval with time step 0.01. The effective noisy current term is injected through first equation of Eq. 1 as . We will show the effects of noise only at parameter set I as the system is in a steady state condition with . While we apply small noise, the system shows subthreshold oscillation and with the increase of noise amplitudes, , the system shows occassional single spikes and irregular multiple spiking activities (see Fig. 8). With the increase of noise intensities, the basic bursting patterns are changed and irregular bursting patterns are achieved at the two parameter sets (see Figs. 8 and 9).
Fig. 8.
Noise induced the time series of membrane voltage of the system 1 at parameter Set I under different external injected current stimulus. a–c, and , d–f, and respectively
Fig. 9.
Noise induced the time series of membrane voltage of the system 1 at parameter Set II under different external injected current stimulus. a, and , b, , , respectively
It is observed that multiple firing patterns are exhibited by the neuron model. It can be found that when noise amplitudes are increased, it produces irregular firing activities or even it forces the system to evoke a spike. This indicates that noisy stimulus could be different from the injected periodic forcing on the neuron model. Finally, the quantity signal-noise-ratio (SNR) (Lee and Kim 1999; Chik et al. 2001; Baltanas and Casado 2002) is measured to observe the possible statistical properties for membrane voltages i.e., the calculated time series. Stochastic resonance (SR) can be observed when the external random fluctuations are increased in a deterministic system. It has been observed in many excitable systems and it can be quantified and reported in biophysical oscillatory systems. It is a noise induced process that enhances the nonlinear responses of the nonlinear model systems. It is known that neurons inherently show stochastic behavior for signal transmission and they can also respond to a weak signal. SR can be relevant to the signal detection and coding of information in sensory neurons. In our case, an excitatory model is periodically forced in the presence of Gaussian noise, when a bell shaped SNR curve is achieved using the different weak noise strengths, it shows the SR effects. We introduce a sinusoidal applied force by allowing noise in the system. A resonance takes place between the signal and the noise induced oscillations at the first parameter set. One type of features of SR is to enhance the signal processing and encoding the signals in the systems. It can be measured using the signal to noise ratio. When a weak noise is applied in the system, the bell shaped SNR increases with the increase of frequency of periodical force. We present it for the first parameter set with weak noise intensities. If the noise strength becomes large, it becomes flattened.
SNR generally measures the dimensionless quantity of the output signal power to the injected Gaussian noise in the neuroscience applications. In our case, the signal i.e., the membrane voltage is noise affected. Suppose it is a random variable, then the output firing patterns i.e., the spikes is a summation of deterministic and stochastic signals. The random variable’s power equals to its mean-squared value, i.e., expected value of its square and injected white noise has zero mean. The resulting SNR equals to , where measures the variance of noise term, here it equals to 0.01. In excitable systems, noise allows to cross the subthreshold values of the response of the system to produce spikes. The characteristic feature of the noise-induced resonance of the system can be computed using SNR values for several values of the sinusoidal applied forcing frequency for different values of noise intensity. In our case, the location of the maxima values of the SNR are obtained at a same range of frequency for increasing of noise intensity. The occurrence of SR in excitable systems needs the conjunction of a periodic appllied signal with noise term and a threshold. Figure 10 shows that noise plays a constructive role where it leads to an increase of SNR values as noise strengths is increased to a certain extent.
Fig. 10.
The values of signal-to-noise ratio for different values of external forcing frequency at for different noise intensities under the effects of electromagnetic induction with the parameter Set I
Further study
It can be observed the effects of electromagnetic induction on a modified M-L neuron proposed by Larter et al. (1999). The model responses the electrical activities of the hippocampal region involving the dynamics of seizure like activity. It is a three dimensional conductance based model to observe the effects of inhibitory interneurons synapsing on pyramidal cells. The features of the model are useful to study the excitation and inhibition on the system dynamics. The model presents the relationship between the excitatory principal cells interacting with inhibitory interneurons with appropriate functional relation (Larter et al. 1999; Upadhyay et al. 2017). The dynamical equations are represented by the following coupled nonlinear ODEs
| 3 |
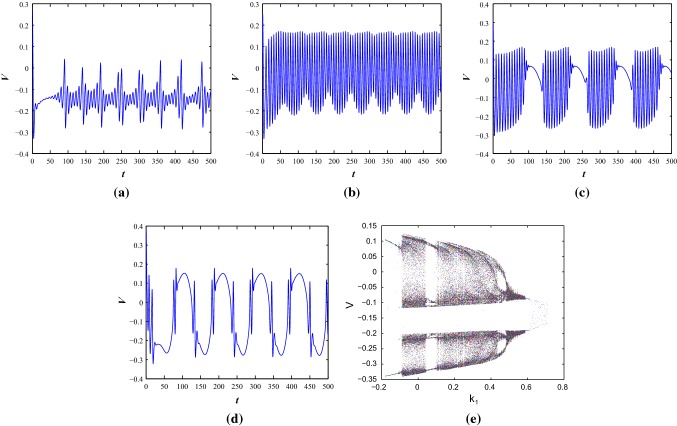
where , , . and . The variables V and Z represent the mean membrane voltages of excitatory and inhibitory cells respectively. The system variable W measures the fraction of open potassium channels at any instant of time. The detailed descriptions and other meanings of the parameters are discussed in the articles (Larter et al. 1999; Upadhyay et al. 2017). It is a fast-slow system. The system has a rich dynamics. The interesting dynamical properties are occurred due to the interactions between faster subsystem and a slower one with the inhibitory interneurons. The dimensionless parameters and measure the synaptic strengths of excitatory neurons and inhibitory interneurons. The trigonometric hyperbolic expressions and are parametrized using the above dimensionless parameters. We show the bifurcation scenarios at a constant injected current, I with the effects of magnetic induction on different firing activities with a fixed parameter set. We consider the following parameter set (Larter et al. 1999)
The system dynamics can be improved as system 1 by introducing the magnetic flux. The parameter set is considered as the previous model with the variable external current stimulus . Now, the different firing activities are observed with variable injected current I. The spiking pattern (mixed mode oscillation) is observed from Fig. 11a with and rest of the values of electromagnetic induction function are same as described in previous section. In Fig. 11b–d, the applied current is considered as periodic stimulus as described in Eq. 3, with . The different spiking and bursting behavior (regular spiking, fast spiking, bursting) are observed using the effects of induction and various stimulus currents. Therefore, the modified spiking M-L model produces bursting under the effects of electromagnetic induction. One can study further with this model with electromagnetic induction and noise effects. We consider as the predominant parameter. The bifurcation scenario of the system under the effects of electromagnetic induction at a constant injected current (with ) is presented in Fig. 11e. It has two windows pattern and undergoes limit cycle and chaotic region alternatively with the increase of . Later, it has period one pattern from two windows and shows some scattered phase points in a small neighborhood of and accumulates it in the small region.
Fig. 11.
The time series of membrane voltage of the system 3 with eletromagnetic induction as system 1 under different external injected current stimulus a, bcos(0.1t), ccos(0.05t) and dcos(0.06t) respectively. e Bifurcation diagram of the same system under electromagnetic induction effect with as the predominant parameter
Discussions and conclusions
The improved and modified H–R neuron model is based on the original 3D H–R model. The dynamical properties are examined by introducing the effects of electromagnetic induction. The effects of electromagnetic induction is considered using magnetic flux across cell membrane (Ma et al. 2017a, b; Lv and Ma 2016; Lv et al. 2016). An injected current stimulus is added to the system. It can be observed that the neuron model responds to certain injected stimulus with various firing activities at certain parameter regimes. The bifurcation scenarios are observed and analyzed considering some of the parameters of the system as the predominant parameters. The condition of Hopf bifurcation is studied with respect to certain predominant parameters of the system.
Next, we consider an induced additive noise through the membrane voltage of the H–R system. We observed that noise effects on the firing activities of the systems at the first parameter set. It forces the stable systems to produce spiking behavior with the increase of noise intensities. The noisy firing activities are demonstrated in the article at different noise amplitudes. The variations in the membrane voltage and signal processing in neural system can originate electrical field and induced current due to the effect of electromagnetic induction. The signals and information in the neurons could be recorded under the effect of magnetic field (Lv and Ma 2016; Lv et al. 2016; Xu et al. 2017). The system can produce various types of spiking and bursting with suitable induced current stimulus at certain parameter sets. This model may be helpful to understand the various electrical activities with induced electromagnetic induction and applied current stimulus. Further, the network of this system can be used to analyze the collective behavior of neurons under electromagnetic induction effects with noise.
Acknowledgements
This work is supported by the Council of Scientific and Industrial Research (CSIR), Govt. of India under Grant No. 25(0277)/17/EMR-II) to the author (R. K. Upadhyay).
Appendix A
The equilibrium points are derived from the following system of equations
| 4a |
| 4b |
| 4c |
| 4d |
In the following, we consider the nature of roots of Eq. (4a) to obtain the values of . Eq. (4a) can be written as , where , , with the condition at the preassigned parameter set. The number and types of the roots are determined using the discriminant of the cubic equation. The general solution of the equation involves the following expressions
and .
The general rule to find all the roots of the cubic equation is of the following form , where (which denotes a cube root of unity). Now, we can easily obtain the corresponding roots of the equation.
Appendix B
The variational matrix is derived from the system 1 as follows
The coefficients of the characteristic Eq. 2 are as follows
, ,
,
,
.
Appendix C
The complex roots are , where , , , and .
Genericity condition is as follows
where and . Now,
 and M is a nonsingular matrix such that at , . F is the nonlinear functions and it becomes
The matrix U becomes
A is the Jacobian matrix whose elements are , around the fixed point with the critical value of at parameter Set I. Suppose be the eigenvectors corresponding to the eigenvalues , then consider the nonsingular matrix col and the elements are derived as .
Footnotes
Publisher's Note
Springer Nature remains neutral with regard to jurisdictional claims in published maps and institutional affiliations.
Contributor Information
Argha Mondal, Email: arghamondalb1@gmail.com.
Ranjit Kumar Upadhyay, Email: ranjit_ism@yahoo.com.
Jun Ma, Email: hyperchaos@163.com.
References
- Baltanas JP, Casado JM. Noise-induced resonances in the Hindmarsh-Rose neuronal model. Phys Rev E. 2002;65(4):041915. doi: 10.1103/PhysRevE.65.041915. [DOI] [PubMed] [Google Scholar]
- Bao B, Jiang T, Xu Q, et al. Coexisting infinitely many attractors in active band-pass filter-based memristive circuit. Nonlinear Dyn. 2016;86(3):1711–1723. [Google Scholar]
- Bao BC, Liu Z, Xu JP. Steady periodic memristor oscillator with transient chaotic behaviors. Electron Lett. 2010;46(3):237–238. [Google Scholar]
- Barrio R, Shilnikov A. Parameter-sweeping techniques for temporal dynamics of neuronal systems: case study of Hindmarsh-Rose model. J Math Neurosci. 2011;1(1):6. doi: 10.1186/2190-8567-1-6. [DOI] [PMC free article] [PubMed] [Google Scholar]
- Bekkers JM. Synaptic transmission: functional autapses in the cortex. Curr Biol. 2003;13(11):R433–R435. doi: 10.1016/s0960-9822(03)00363-4. [DOI] [PubMed] [Google Scholar]
- Bertram R, Rubin JE. Multi-timescale systems and fast-slow analysis. Math Biosci. 2017;287:105–121. doi: 10.1016/j.mbs.2016.07.003. [DOI] [PubMed] [Google Scholar]
- Chik DTW, Wang Y, Wang ZD. Stochastic resonance in a Hodgkin-Huxley neuron in the absence of external noise. Phys Rev E. 2001;64(2):021913. doi: 10.1103/PhysRevE.64.021913. [DOI] [PubMed] [Google Scholar]
- Coombes S, Bressloff PC. Bursting: the genesis of rhythm in the nervous system. Singapore: World Scientific; 2005. [Google Scholar]
- Ditlevsen S, Samson A. Introduction to stochastic models in biology. In: Bachar M, Batzel J, editors. Stochastic biomathematical models with applications to neuronal modeling. Berlin: Springer; 2013. [Google Scholar]
- Faisal AA, Selen LPJ, Wolpert DM. Noise in the nervous system. Nat Rev Neurosci. 2008;9(4):292. doi: 10.1038/nrn2258. [DOI] [PMC free article] [PubMed] [Google Scholar]
- Gu HG, Jia B, Chen GR. Experimental evidence of a chaotic region in a neural pacemaker. Phys Lett A. 2013;377(9):718–720. [Google Scholar]
- Gu H, Pan B. A four-dimensional neuronal model to describe the complex nonlinear dynamics observed in the firing patterns of a sciatic nerve chronic constriction injury model. Nonlinear Dyn. 2015;81(4):2107–2126. [Google Scholar]
- Gu H, Pan B, Chen G, et al. Biological experimental demonstration of bifurcations from bursting to spiking predicted by theoretical models. Nonlinear Dyn. 2014;78(1):391–407. [Google Scholar]
- Herrmann CS, Klaus A. Autapse turns neuron into oscillator. Int J Bifurc Chaos. 2004;14(2):623–633. [Google Scholar]
- Herz AVM, Gollisch T, Machens CK, et al. Modeling single-neuron dynamics and computations: a balance of detail and abstraction. Science. 2006;314(5796):80–85. doi: 10.1126/science.1127240. [DOI] [PubMed] [Google Scholar]
- Higham DJ. An algorithmic introduction to numerical simulation of stochastic differential equations. SIAM Rev. 2001;43(3):525–546. [Google Scholar]
- Hsü ID, Kazarinoff ND. An applicable Hopf bifurcation formula and instability of small periodic solutions of the Field-Noyes model. J Math Anal Appl. 1976;55(1):61–89. [Google Scholar]
- Hsü ID, Kazarinoff ND. Existence and stability of periodic solutions of a third-order non-linear autonomous system simulating immune response in animals. Proc R Soc Edinburgh Sect A. 1977;77(1–2):163–175. [Google Scholar]
- Izhikevich EM. Dynamical systems in neuroscience. Cambridge: MIT Press; 2007. [Google Scholar]
- Izhikevich EM. Which model to use for cortical spiking neurons? IEEE Trans Neural Netw. 2004;15(5):1063–1070. doi: 10.1109/TNN.2004.832719. [DOI] [PubMed] [Google Scholar]
- Izhikevich EM, Desai NS, Walcott EC, et al. Bursts as a unit of neural information: selective communication via resonance. Trends Neurosci. 2003;26(3):161–167. doi: 10.1016/S0166-2236(03)00034-1. [DOI] [PubMed] [Google Scholar]
- Kuznetsov YA. Elements of applied bifurcation theory. 2. New York: Springer; 1998. [Google Scholar]
- Larter R, Speelman B, Worth RM. A coupled ordinary differential lattice model for the simulation of epileptic seizures. Chaos. 1999;9(3):795–804. doi: 10.1063/1.166453. [DOI] [PubMed] [Google Scholar]
- Lee SG, Kim S. Parameter dependence of stochastic resonance in the stochastic Hodgkin-Huxley neuron. Phys Rev E. 1999;60(1):826. doi: 10.1103/physreve.60.826. [DOI] [PubMed] [Google Scholar]
- Li J, Tang J, Ma J, et al. Dynamic transition of neuronal firing induced by abnormal astrocytic glutamate oscillation. Sci Rep. 2016;6:32343. doi: 10.1038/srep32343. [DOI] [PMC free article] [PubMed] [Google Scholar]
- Li Q, Zeng H, Li J. Hyperchaos in a 4D memristive circuit with infinitely many stable equilibria. Nonlinear Dyn. 2015;79(4):2295–2308. [Google Scholar]
- Lindner B, Garcia-Ojalvo J, Neiman A, et al. Effects of noise in excitable systems. Phys Rep. 2004;392(6):321–424. [Google Scholar]
- Longtin A. Stochastic dynamical systems. Scholarpedia. 2010;5(4):1619. [Google Scholar]
- Lv M, Ma J. Multiple modes of electrical activities in a new neuron model under electromagnetic radiation. Neurocomputing. 2016;205:375–381. [Google Scholar]
- Lv M, Wang C, Ren G, et al. Model of electrical activity in a neuron under magnetic flow effect. Nonlinear Dyn. 2016;85(3):1479–1490. [Google Scholar]
- Ma J, Tang J. A review for dynamics of collective behaviours of network of neurons. Sci China Technol Sci. 2015;58(12):2038–2045. [Google Scholar]
- Ma J, Wu F, Hayat T, et al. Electromagnetic induction and radiation-induced abnormality of wave propagation in excitable media. Phys A. 2017;486:508–516. [Google Scholar]
- Ma J, Wang Y, Wang C, et al. Mode selection in electrical activities of myocardial cell exposed to electromagnetic radiation. Chaos Solitons Fractals. 2017;99:219–225. [Google Scholar]
- Muthuswamy B. Implementing memristor based chaotic circuits. Int J Bifurc Chaos. 2010;20(5):1335–1350. [Google Scholar]
- Perc M. Thoughts out of noise. Eur J Phys. 2006;27(2):451. [Google Scholar]
- Perc M, Marhl M. Amplification of information transfer in excitable systems that reside in a steady state near a bifurcation point to complex oscillatory behavior. Phys Rev E. 2005;71(2):026229. doi: 10.1103/PhysRevE.71.026229. [DOI] [PubMed] [Google Scholar]
- Qin HX, Ma J, Jin WY, et al. Dynamics of electrical activities in neuron and neurons of network induced by autapses. Sci China Technol Sci. 2014;57(5):936–946. [Google Scholar]
- Shilnikov A, Kolomiets M. Methods of the qualitative theory for the Hindmarsh-Rose model: a case study-a tutorial. Int J Bifurc Chaos. 2008;18(8):2141–2168. [Google Scholar]
- Song XL, Wang CN, Ma J, et al. Transition of electric activity of neurons induced by chemical and electric autapses. Sci China Technol Sci. 2015;58(6):1007–1014. [Google Scholar]
- Storace M, Linaro D, de Lange E. The Hindmarsh-Rose neuron model: bifurcation analysis and piecewise linear approximations. Chaos. 2008;18(3):033128. doi: 10.1063/1.2975967. [DOI] [PubMed] [Google Scholar]
- Tang J, Liu TB, Ma J, et al. Effect of calcium channel noise in astrocytes on neuronal transmission. Commun Nonlinear Sci Numer Simul. 2016;32:262–272. [Google Scholar]
- Tang J, Luo JM, Ma J. Information transmission in a neuron-astrocyte coupled model. PLoS ONE. 2013;8(11):e80324. doi: 10.1371/journal.pone.0080324. [DOI] [PMC free article] [PubMed] [Google Scholar]
- Tsaneva-Atanasova K, Osinga HM, Rie T, et al. Full system bifurcation analysis of endocrine bursting models. J Theor Biol. 2010;264(4):1133–1146. doi: 10.1016/j.jtbi.2010.03.030. [DOI] [PMC free article] [PubMed] [Google Scholar]
- Upadhyay RK, Mondal A, Teka WW. Mixed mode oscillations and synchronous activity in noise induced modified Morris-Lecar neural system. Int J Bifurc Chaos. 2017;27(5):1730019. [Google Scholar]
- Wang C, Ma J. A review and guidance for pattern selection in spatiotemporal system. Int J Mod Phys B. 2018;32(6):1830003. [Google Scholar]
- Wang Y, Ma J, Xu Y, et al. The electrical activity of neurons subject to electromagnetic induction and Gaussian white noise. Int J Bifurc Chaos. 2017;27(2):1750030. [Google Scholar]
- Wig GS, Schlaggar BL, Petersen SE. Concepts and principles in the analysis of brain networks. Ann N Y Acad Sci. 2011;1224(1):126–146. doi: 10.1111/j.1749-6632.2010.05947.x. [DOI] [PubMed] [Google Scholar]
- Wu F, Wang C, Xu Y, et al. Model of electrical activity in cardiac tissue under electromagnetic induction. Sci Rep. 2016;6(1):28. doi: 10.1038/s41598-016-0031-2. [DOI] [PMC free article] [PubMed] [Google Scholar]
- Wu H, Bao B, Liu Z, et al. Chaotic and periodic bursting phenomena in a memristive Wien-bridge oscillator. Nonlinear Dyn. 2016;83(1–2):893–903. [Google Scholar]
- Xiao-Bo W, Juan M, Ming-Hao Y. Two different bifurcation scenarios in neural firing rhythms discovered in biological experiments by adjusting two parameters. Chin Phys Lett. 2008;25(8):2799. [Google Scholar]
- Xu Y, Ying H, Jia Y, et al. Autaptic regulation of electrical activities in neuron under electromagnetic induction. Sci Rep. 2017;7:43452. doi: 10.1038/srep43452. [DOI] [PMC free article] [PubMed] [Google Scholar]
- Zhan F, Liu S. Response of electrical activity in an improved neuron model under electromagnetic radiation and noise. Front Comput Neurosci. 2017;11(107):1–12. doi: 10.3389/fncom.2017.00107. [DOI] [PMC free article] [PubMed] [Google Scholar]
- Zhou J, Wu Q, Xiang L. Impulsive pinning complex dynamical networks and applications to firing neuronal synchronization. Nonlinear Dyn. 2012;69(3):1393–1403. [Google Scholar]


