

Abstract
Aims
To quantitatively compare pharmacokinetics (PK) and the exposure–response (ER) relationship of the sodium‐glucose cotransporter‐2 inhibitor, dapagliflozin, between adolescents/young adults and adults with type 1 diabetes mellitus (T1DM).
Methods
Data from 2 clinical studies for dapagliflozin were analysed using a non‐linear mixed‐effects approach. The PK and the relationship between dapagliflozin exposure and response (24‐hour urinary glucose excretion) were characterized. PK was evaluated using a 2‐compartment model with first‐order absorption while the exposure response‐relationship was analysed using a sigmoidal maximal‐effect model. The 24‐hour median blood glucose, estimated glomerular filtration rate (eGFR), sex, age and body weight were evaluated as covariates.
Results
A 2‐compartment model with first order absorption provided a reasonable fit to the dapagliflozin PK data. Body weight was found to be a significant covariate on dapagliflozin exposure. The ER relationship was best described by a sigmoidal maximal effect model with 24‐hour median blood glucose and eGFR as significant covariates on maximal effect. In accordance with the observed data, model‐predicted urinary glucose excretion response following 10 mg dapagliflozin dose was higher in the study in adolescents/young adults (138.0 g/24 h) compared to adults (70.5 g/24 h) with T1DM. This is linked to higher eGFR and 24‐hour median blood glucose in this trial.
Conclusions
Dapagliflozin PK and ER relationship were similar in the 2 analysed studies after accounting for covariate effects. These results suggest that no dose adjustment is required for adolescent patients with T1DM.
Keywords: covariates, dapagliflozin, exposure–response, paediatric, pharmacokinetics, type 1 diabetes mellitus
What is already known about this subject
The pharmacokinetics and exposure–response relationship for urinary glucose excretion in adult type 1 diabetes mellitus (T1DM) patients is well characterized for the sodium‐glucose cotransporter type‐2 inhibitor, dapagliflozin.
The therapeutic use of dapagliflozin in adolescents/young adults (12–21 years) with T1DM is not well understood.
What this study adds
The intrinsic relationship between dapagliflozin exposure and urinary glucose excretion is similar between adult and adolescent T1DM patients.
In this study, the use of glucose infusion in some patients may have had an important impact on the measured dapagliflozin effect.
The results provide important information that can support further clinical development of dapagliflozin for paediatric patients with T1DM.
1. INTRODUCTION
Incidence trends of type 1 diabetes mellitus (T1DM) in the paediatric population show an increase in cases over the last decade in the USA and worldwide with a disproportionately higher incidence in certain ethnic minorities.1, 2 Achieving glycaemic control in patients with T1DM is essential3 but regardless only 17% of adolescent patients with T1DM accomplish glycaemic goals with the currently available management options.4 To date, insulin is the only agent approved worldwide for the treatment of paediatric patients with T1DM.4 Dapagliflozin, an oral antidiabetic agent, is currently approved for adults with type 2 diabetes mellitus (T2DM5) and is in clinical development for adult patients with T1DM.
Dapagliflozin is a potent, highly selective and orally active inhibitor of the human renal sodium‐glucose cotransporter type‐2 (SGLT2), the major transporter responsible for renal glucose reabsorption.6 Dapagliflozin lowers plasma glucose by inhibiting the renal reabsorption of glucose, thereby promoting its urinary excretion.7 Dapagliflozin is rapidly absorbed with a half‐life of about 13 hours. It has been found to have an oral bioavailability of about 78%. Dapagliflozin metabolism occurs predominantly in the liver and kidneys by uridine diphosphate‐glucuronosyltransferase‐1A9 (UGT 1A9). No clinically relevant differences were observed in dapagliflozin exposure with respect to age, race, sex, body weight, food or presence of T2DM.8 Dapagliflozin in adults with T1DM has been investigated in phase III studies (NCT02268214 and NCT02460978), showing clinically significant improvements in glycaemic control and variability accompanied by moderate weight loss.9, 10 In adults with T1DM, linear systemic dapagliflozin exposure has been demonstrated over a dose range of 1–10 mg (NCT01498185). With regards to efficacy in patients with T1DM, exposure to dapagliflozin results in a dose‐dependent increase in urinary glucose excretion (UGE). This is dependent on the filtered glucose load (systemic glucose × estimated glomerular filtration rate [eGFR]), such that as systemic glucose and/or eGFR increase, the efficacy of dapagliflozin also increases.8, 11
A pharmacokinetic (PK)/pharmacodynamic (PD) study of dapagliflozin in adolescents/young adults with T1DM aged 12–21 years (NCT02325206) was recently completed, contributing valuable data towards the potential therapeutic use of dapagliflozin in such a patient population.12 Following a single 10 mg oral dose (n = 33), dapagliflozin was rapidly absorbed and mean 24‐hour UGE increased compared to placebo treatment. The study involved constant intravenous glucose and insulin infusion which aimed at marginally elevated blood glucose levels (160–220 mg/dL). In such a design, filtered glucose load is expected to be high and consequently to have an impact on UGE. These data were integrated with data from an adult study that included dapagliflozin doses from 1–10 mg (NCT0149818513) with the aim to assess the potential similarities and differences in PK and exposure–response (ER) between adolescents/young adults and adults with T1DM using a PK/PD modelling approach. Specifically, the objective of the present analysis was to assess if the PK, and the relationship of dapagliflozin exposure (area under the dapagliflozin plasma concentration–time curve from 0 to 24 hours [AUC24]) and the response (24‐hour UGE) following dapagliflozin treatment in a study in adolescents/young adults with T1DM vs in a study in adults with T1DM was similar, after accounting for relevant covariates.
2. METHODS
2.1. Data
Data from 2 clinical studies were pooled for this analysis: a study including adolescents/young adults (NCT0232520612) and a study including adults (NCT0149818513) with T1DM who had PK and UGE data available following either single (adolescents/young adults) or repeated (adults) administration of dapagliflozin (Table S1). Each study was conducted in accordance with Good Clinical Practice as defined by the International Conference on Harmonisation and the Declaration of Helsinki. All patients or their legal guardians provided written informed consent prior to study participation. All drug/molecular target nomenclature conforms to the IUPHAR/BPS Guide to Pharmacology nomenclature classification.14 PK samples for adults with T1DM (NCT01498185) were only available on treatment day 7 after repeated once daily dosing, but urinary glucose responses were available on day 1 and day 7. Therefore, based on a population PK model, AUC24 on Day 1 for adult with T1DM (NCT01498185) was calculated as the integral of predicted Day 1 dapagliflozin concentration–time curve using NONMEM (version 7.3; Globomax, Hanover, MD, USA). Urine samples were collected 24 hours after the first dose to measure the total amount of glucose excreted in the urine. Mean blood glucose was either monitored off‐site (NCT01498185) or measured by clinical personnel at the site (NCT02325206). eGFR was calculated using the Modification of Diet in Renal Disease (eGFR [mL/min/1.73m2] = 175 × [standardized Serum creatinine (Scr)] – 1.154 × Age – 0.203 × [0.742 if female] × [1.212 if black]) and updated Schwartz formulas in the adult and paediatric populations, respectively.15, 16
2.2. Previous modelling experience
The PK of dapagliflozin in patients with T1DM was previously described by a 2‐compartment model with first order absorption and linear clearance.17 Renal function, sex, body weight and age were found to impact dapagliflozin exposure.
Previously published ER (UGE) models were developed using pooled data from patients with T1DM and T2DM.18 A longitudinal model was used with the sigmoidal maximal effect (Emax) function with baseline fasting plasma glucose, eGFR and UGE were included as covariates. Another published ER model was based on pooled adult and paediatric T2DM data using sigmoidal Emax model.19 Baseline eGFR, fasting plasma glucose and sex were significant covariates that affected dapagliflozin UGE response (additionally race was identified as a covariate in paediatric patients; this was suggested to be related to the potentially inaccurate assessment of the true renal function in black paediatric patients with T2DM). The ER model developed using data from adult patients with T1DM showed that average self‐monitored blood glucose, change from baseline in total insulin dose, and baseline eGFR had a significant effect on 24‐hour UGE, with self‐monitored blood glucose being the most influential.20
2.3. Software
Nonlinear mixed‐effect modelling was conducted using NONMEM (version 7.3.0, Icon Development Solutions, Ellicott City, MD, USA). Graphics were produced using R version 3.2.4 (R‐project, www.r‐project.org), and Xpose4 (R package version 4.5.3).21 Visual predictive check was performed using Perl‐speaks‐NONMEM.22
2.4. Model development
The analysis was performed sequentially: first, a population PK model was used to derive the exposure metric, AUC24 for each patient. As a next step, derived AUC24 values were used in the ER modelling. Different error models were tested to quantify the difference between the model predictions and observations in this analysis (Table S2).
2.5. Population PK analysis
A 2‐compartment model23 served as the structural model. First order absorption with/without lag‐time and the transit compartment model were explored to describe the absorption phase. The effects of the following covariates on the PK of dapagliflozin were investigated: age, sex, eGFR and body weight. The effects of all covariates were tested on apparent clearances (apparent clearance from the central compartment and apparent intercompartmental clearance between the central compartment and peripheral compartment), and age, sex and body weight were tested on volumes of distribution using a range of mathematical functions (Table S2). The covariates were chosen based on the mechanistic plausibility and/or graphical covariate analysis where model parameter estimates were plotted against covariate values and the correlation was assessed.
2.6. ER analysis
A sigmoidal Emax model was used to assess the ER relationship of dapagliflozin. The structure of the base model was defined by the following equation:
| (1) |
where BSLN is baseline UGE, Placebo is the dapagliflozin placebo effect on UGE, Emax is the maximum UGE and AUC2450 is the AUC24 at which half of Emax is achieved. During model development, the estimation of baseline UGE was tested. Further, inclusion of a Hill coefficient, an exponent of AUC2450 and AUC24, was evaluated.
Prespecified covariates were selected based on physiological plausibility and/or graphical covariate analysis. The effects of the following covariates were analysed: body weight, BMI, sex, eGFR and 24‐hour median blood glucose. For this purpose, several mathematical functions were tested (Table S2). Twelve patients from study NCT01498185 (12.6% of the participants of both clinical studies) had missing 24‐hour median blood glucose data which were imputed by median value of the 24‐hour median blood glucose.
Model selection, validation and prediction are detailed in the supplementary materials.
2.7. Simulations
Predictions based on the final ER model were computed by first simulating a set of 1000 parameter vectors (i.e. Emax and AUC2450) using mean parameter values and the covariance matrix. For each vector, a model prediction was then derived (i.e. 24‐hour UGE for a given AUC value; AUC range between 0.001 and 500 was simulated). As a second step, a mean of the derived 1000 predictions was calculated; this was defined as the predicted treatment effect for a given AUC. Median population values of blood glucose and eGFR were used in the simulations; specifically: adolescents/young adults, median blood glucose of 200 mg/dL and median eGFR of 104 mL/min/1.73 m2, adults, median blood glucose of 148 mg/dL and median eGFR of 89.9 mL/min/1.73 m2, pooled data, median blood glucose of 163.7 mg/dL and median eGFR of 94.5 mL/min/1.73 m2. All simulations were performed in R (R‐project, www.rproject.org) using the nonmem2R package (https://CRAN.R‐project.org/package=nonmem2R).
2.8. Nomenclature of targets and ligands
Key protein targets and ligands in this article are hyperlinked to corresponding entries in http://www.guidetopharmacology.org, the common portal for data from the IUPHAR/BPS Guide to PHARMACOLOGY,24 and are permanently achieved in the Concise Guide to PHARMACOLOGY 2017/2018.25
3. RESULTS
3.1. Patient population
Baseline characteristics of individuals used in the PK analysis are summarized in Table S3. Of the 103 dapagliflozin‐treated patients (33 adolescents/young adults, 70 adults) enrolled and randomized in the clinical studies included in this analysis, data from 87 patients (33 adolescents/young adults, 54 adults) who had adequate PK‐profile data available were included in the population PK analysis (Table S4). Ninety‐six patients (31 adolescents/young adults from NCT02325206, 65 adults from NCT01498185) who had AUC24 and UGE data available following single‐dose administration of dapagliflozin were analysed for development of the ER model (Table 2). Baseline demographic and disease characteristics of individuals used in the ER analysis are described in Table 1. Higher blood glucose levels were expected in adolescent/young adult patients of study NCT02325206 receiving intravenous insulin administration, where glucose infusion kept glucose levels at 160–220 mg/dL. Adults with T1DM, however, received standardized meals and were retained on their insulin regimen, which resulted in overall lower levels of 24‐hour median glucose (Table 1).
Table 2.
Summary statistics of PK/PD parameters used in the ER analysis
| Study | Population | Dose, mg | n | Model deriveda PK parameters | Observed PD parameters | ||
|---|---|---|---|---|---|---|---|
| Median, AUC24, ng h/mL, (range) | SD, AUC24, ng h/mL | Median, UGE, g/24 h (range) | SD, UGE, g/24 h | ||||
| NCT01498185 | Adults | Placebo | 12 | 0 (0–0) | 0 | 9.22 (0.13–30.4) | 8.17 |
| 1 | 11 | 40.5 (27.2–50.5) | 6.62 | 43.6 (32.1–65.9) | 10.6 | ||
| 2.5 | 15 | 100 (52.2–144.0) | 24.7 | 50.2 (3.4–104.0) | 28.8 | ||
| 5 | 14 | 210 (161.0–274.0) | 32.7 | 61.6 (18.3–105.0) | 24.5 | ||
| 10 | 13 | 434 (215.0–610.0) | 110.0 | 60.3 (26.0–143.0) | 32.0 | ||
| NCT02325206 | Adolescents/young adults | Placebo | 31 | 0 (0–0) | 0 | 19.5 (9.19–50.9) | 11.3 |
| 10 | 31 | 445.0 (307.0–590.0) | 72.3 | 155.0 (85.5–250.0) | 38.4 | ||
Only adult PK was predicted.
AUC24, area under the dapagliflozin plasma concentration–time curve from time 0 to 24 hours on day 1; ER, exposure–response; PD, pharmacodynamic; PK, pharmacokinetic; SD, standard deviation; UGE, observed 24‐hour urinary glucose excretion on day 1.
Table 1.
Summary of baseline demographic and disease characteristics in the ER analysis dataset
| Parameter | Study | |
|---|---|---|
| NCT01498185 (adults; n = 65) | NCT02325206 (adolescents/young adults; n = 31) | |
| Age (y) mean (range) | 35.7 (18–65) | 16.1 (12–21) |
| Sex, n (%) | ||
| Male | 38 (58.5) | 13 (41.9) |
| Race, n (%) | ||
| White | 58 (89.2) | 28 (90.3) |
| Black | 5 (7.7) | 0 |
| Asian | 1 (1.5) | 0 |
| Other | 1 (1.5) | 3 (9.7) |
| Weight (kg), mean (range) | 75.2 (54.7–118.0) | 67.7 (50.0–89.8) |
| BMI (kg/m2), median (range) | 24.9 (19.0–33.4) | 22.7 (17.9–29.7) |
| eGFR (mL/min/1.73 m2), median (range) | 89.8 (49.4–144.5) | 103.8 (72.1–146.8) |
| Blood glucose (mg/dL), median (range)a | 149.5 (99.9–260.0) | 205.9 (188.7–246.6) |
| 24‐h UGE, (g), median (range) | 8.1 (0.1–51.5) | —b |
n = 53.
baseline UGE was not measured in the adolescent/young adult study.
BMI, body mass index; eGFR, estimated glomerular filtration rate; ER, exposure–response. UGE, urinary glucose excretion.
For the same dapagliflozin dose (10 mg and placebo) adolescent/young adult participants of study NCT02325206 had a higher response (i.e. 24‐hour UGE) compared to adult patients from study NCT01498185 (Table 2; Figure 1). The similar 24‐hour UGE values for the 5 and 10 mg dapagliflozin doses in the adult data set indicate that the ER relationship is at or near the plateau of the maximal achievable response for these doses.
Figure 1.

(A) AUC24 and (B) 24‐hour UGE with 1st, 2nd, 3rd quartile and predictions/observations outside quartile range and (C) 24‐hour UGE vs AUC24 in adolescent/young adult and adult patients with T1DM following single‐dose oral administration of 1, 2.5, 5, 10 mg and placebo (0). Dots represent observed data. AUC24, model predicted area under the dapagliflozin plasma concentration–time curve from time 0 to 24 hours on day 1; T1DM, type 1 diabetes mellitus; UGE, urine glucose excretion
3.2. PK model and covariate analysis
Dapagliflozin plasma concentration over time after single and repeated dose administration was described by a 2‐compartment model with first‐order absorption through 3 transit compartments and linear clearance (Figure S1 and S2). The goodness of fit (GOF) plots and visual predictive check plots for the PK model indicated good agreement between predicted and observed dapagliflozin plasma concentration across all doses. It was challenging to optimally describe the absorption phase in the adolescent study, as can be seen in the GOF plots (i.e. bias observed in the right panel of Figure S2). Different absorption models were assessed to address this discrepancy; even though it could not fully describe the absorption in adolescent patients, the first‐order absorption model with 3 transit compartments was selected as the best one, based on the lowest relative standard errors for PK parameters and the lowest objective function value (OFV) among all tested models. Body weight was identified as a covariate for clearance, apparent clearance from the central compartment and apparent central volume of distribution. Patients with higher body weight were expected to have lower dapagliflozin AUC24 (Figure 2). Parameter estimates for the final PK model were reliable, with low relative standard errors (Table S5). As seen in Figure 1, day 1 AUC24 in study NCT02325206 (adolescents/young adults) was comparable to the predicted AUC24 in study NCT01498185 (adults) following the same dose of dapagliflozin.
Figure 2.

Covariate effects on (A) relative steady‐state AUC24 (AUC24/reference AUC24) and (B) relative 24‐hour UGE (24‐hour urine glucose/reference 24‐hour urine glucose). High and low covariate values represent the 5th and 95th percentile of the study population, error bars represent the 90% confidence interval. AUC24, area under the dapagliflozin plasma concentration–time curve from time 0 to 24 hours; eGFR, estimated glomerular filtration rate; SMPG, self‐monitored plasma glucose; UGE, urinary glucose excretion. Reference group: body weight, 72.1 kg; eGFR, 94.5 mL/min/m2; median 24‐hour blood glucose, 164 mg/dL
3.3. ER model and covariate analysis
The relationship between dapagliflozin ER after single‐dose administration was described using the sigmoidal Emax model for both studies. For adolescents/young adults with T1DM (NCT02325206) no baseline 24‐hour UGE was measured so that both a baseline 24‐hour UGE effect and a potential placebo effect were estimated as a single effect. For adults with T1DM (NCT01498185) baseline 24‐hour UGE was added to the 24‐hour UGE response and the additional placebo effect was estimated based on placebo data. Addition of a Hill coefficient did not improve the fit of the data; therefore, it was removed in the final model. The model appeared acceptable, showing a good fit to the observed data (Figures 3, S3 and S4). Mean population parameter estimates for Emax and AUC2450 were 111.2 g/24 h and 67.2 ng h/mL, respectively. Parameter estimates for the final ER model were reliable, with low relative standard errors (Table S2). According to the model, adolescents/young adults (NCT02325206) were predicted to have higher UGE response compared to adults (NCT01498185), which was consistent with the observed data, as demonstrated in Figure 3. Baseline eGFR and 24‐hour median blood glucose were identified as significant covariates on dapagliflozin Emax. Based on the final model, patients with higher baseline eGFR and 24‐hour median blood glucose are expected to have a higher UGE response (Figure 2). Other evaluated covariates resulted in only minor improvements in fit and were not included in the final ER model. After adjusting for baseline covariates, model predicted ER was similar between adolescents/young adults and adults as can be seen in Figure 4.
Figure 3.

Deterministic simulation of ER profiles for typical adult (solid line) and adolescent/young adult (dotted line) patients with T1DM. Squares and circles represent actual observations from adolescent/young adult and adult patients, respectively. AUC24, model predicted area under the dapagliflozin plasma concentration–time curve from time 0 to 24 hours on day 1; ER, exposure–response; T1DM, type 1 diabetes mellitus; UGE, urinary glucose excretion
Figure 4.
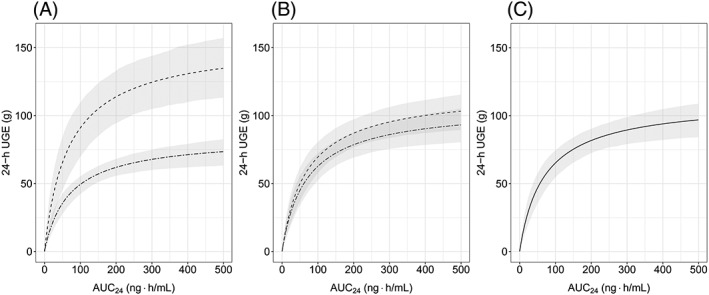
Simulated absolute change in dapagliflozin 24‐hour UGE from placebo based on the ER model: (A) before, (B) after normalization for blood glucose, and (C) after normalization for both blood glucose and baseline eGFR. Median UGE response is represented by dashed lines for adolescents/young adults and by double‐dashed lines for adults. Grey ribbons are 90% confidence intervals for the median predictions. AUC24, model predicted area under the dapagliflozin plasma concentration–time curve from time 0 to 24 hours on day 1; eGFR, estimated glomerular filtration rate; ER, exposure–response; UGE, urine glucose excretion. 24‐hour UGE response was simulated using population‐specific median blood glucose and eGFR in (A), pooled‐data median blood glucose and population‐specific eGFR in (B) and pooled‐data blood glucose and eGFR in (C). See Methods for details
Body weight was identified as a predictor of dapagliflozin exposure. Therefore, changes in body weight were assessed for any significant impact on UGE response. The results can be found in Supplementary Material (Figure S5), where it can be seen that UGE changes only slightly with body weight.
4. DISCUSSION
The aim of this analysis was to compare the PK and the ER relationship of dapagliflozin between 2 populations (adolescents/young adults and adults with T1DM). The results demonstrated that a 2‐compartment PK model with first‐order absorption accurately described dapagliflozin exposure in both studies. A sigmoidal Emax model successfully described the relationship between dapagliflozin exposure (AUC24) and response (24‐hour UGE) after single‐dose oral administration. Both models were acceptable using standard diagnostic and GOF criteria. For the ER model, the 24‐hour UGE response to dapagliflozin 10 mg was slightly under predicted for adolescents/young adults. This might be explained by differences in the study design, since in the adolescent/young adult study glucose was infused to maintain blood glucose levels between 160 and 220 mg/dL.
The identified covariates, baseline eGFR and 24‐hour median blood glucose had significant impact on dapagliflozin efficacy (as measured by UGE) in both studies. This is consistent with the previously developed PK/PD model for T1DM in adults, where baseline eGFR and 24‐hour median blood glucose were found to affect dapagliflozin Emax and AUC2450.20
In our study, eGFR was estimated using different methods for patients aged <18 years and patients aged ≥18 years (see Methods for details). Using different methods of eGFR estimation could potentially result in bias when comparing 2 populations. Specifically, the Schwartz formula (used to estimate eGFR in paediatric/adolescent patients) does not contain correction factors for black race, sex or obesity (as opposed to the Modification of Diet in Renal Disease formula used in adults). Consequently some adolescent patients (e.g. black, obese) may have incorrectly estimated renal function, which would have impact on dapagliflozin efficacy as has been reported previously.19 However, since there were no black adolescent patients with T1DM included in the current study (see Table 1), race is not applicable in the current analysis. The impact of sex and body weight on the eGFR calculation was assessed by including both factors as covariates in the ER model. Neither sex nor body weight were identified to impact dapagliflozin efficacy, therefore, we can conclude that there is no bias in the current analysis due to the fact that eGFR was not adjusted for those 2 factors in adolescent patients with T1DM.
After a 10‐mg single‐dose administration of dapagliflozin, the model‐predicted UGE response was higher in adolescents/young adults vs adults (138.0 g/24 h vs 70.5 g/24 h) with T1DM, consistent with the observed data (Figure 2). Since UGE increased with both identified covariates, this was attributable to a combination of improved kidney function (higher eGFR) and higher 24‐hour median blood glucose in adolescents/young adults (NCT02325206) compared to adults (NCT01498185). The impact of both covariates on UGE efficacy is connected to the mechanism of action of the drug; a higher renal filtered glucose load (systemic glucose × eGFR) results in a higher UGE response.8, 11 Conversely, the higher median blood glucose levels in the adolescents/young adults study vs those in the adult study (205.9 mg/dL vs 149.5 mg/dL) suggests that the observed greater response in adolescents/young adults is partially a result of the study design (i.e. the presence of constant glucose/insulin infusion resulting in blood glucose concentrations above the daily recommended levels for paediatric patients with T1DM [90–150 mg/dL]). It is expected that under more standard conditions (i.e. real‐life situation without glucose infusion) UGE response would be similar in adolescents/young adults and adults (Figure 4). Notably, according to the model simulated UGE response (Figure 4), the covariate effect of blood glucose (study specific) was larger than the effect of baseline eGFR (population specific). Although the impact of blood glucose and renal function on UGE response may be potentially confounded in the current analysis due to the specific study design, these results corroborate previous findings. For example, Sokolov et al. reported that blood glucose was the most influential covariate on dapagliflozin UGE efficacy in adult patients with T1DM20 while fasting plasma glucose had a larger impact on dapagliflozin efficacy than renal function in adult and paediatric patients with T2DM.19
In conclusion, participants of the 2 trials had similar dapagliflozin exposure with higher AUC24 in patients with lower body weight. The greater observed UGE response to a single oral dose of dapagliflozin in adolescents/young adults with T1DM can be potentially explained by the population‐specific higher eGFR and study‐specific higher 24‐hour median blood glucose. These results support that paediatric patients and adult patients with T1DM have similar ER relationship after accounting for baseline covariates (i.e. eGFR and blood glucose levels). Consequently, our results suggest that no dose adjustment is required for adolescent patients with T1DM. These findings support the further clinical development of dapagliflozin for adolescent patients at the same dose as in adult patients with T1DM.
COMPETING INTERESTS
D.B. was an employee of AstraZeneca at the time of drafting this manuscript. J.P., D.W.B., W.T. and M.F.S. are employees/shareholders of AstraZeneca. T.D. has acted as consultant, advisory board member, steering committee member or speaker for Abbott, Medtronic, Roche, Lexicon, Menarini, Boehringer Ingelheim, AstraZeneca, Novo Nordisk, Sanofi, Dexcom and Eli Lilly, and has received research grants from Abbott, AstraZeneca, Novo Nordisk, Medtronic and Sanofi. V.S. is a contractor of AstraZeneca. NCT02325206 was financially supported by AstraZeneca. T.B. received travel support from AstraZeneca and received honoraria from Medtronic, DexCom, YpsoMed and Roche.
CONTRIBUTORS
D.B. performed the modelling analysis. All authors contributed equally to the modelling strategy, and to the development and revision of this manuscript.
Supporting information
Figure S1.
Goodness‐of‐fit plots representing appropriateness of the final population pharmacokinetics model. (A) Logarithm of dependent variable vs logarithm of predictions and (B) weighted residuals vs independent variable of both clinical studies.
Figure S2. Visual predictive check plots of dapagliflozin plasma concentration for studies NCT01498185 (A‐D) and NCT02325206 (E) representing appropriateness of the final pharmacokinetics model.
Figure S3. Goodness‐of‐fit plots representing appropriateness of the final exposure–response model. (A) dependent variable vs predictions and (B) weighted residuals vs independent variable of both clinical studies.
Figure S4. Visual predictive check plots of 24‐hour urinary glucose excretion vs dapagliflozin area under the dapagliflozin plasma concentration–time curve from time 0 to 24 hours for (A) adults and (B) adolescents representing appropriateness of the final exposure–response model.
Figure S5. 24‐hour urinary glucose excretion vs body weight for adolescent/young adult patients following 2.5, 5, 10 mg dapagliflozin doses.
Table S1. Summary of the studies used in the analysis
Table S2. Equations tested in the modelling process
Table S3. Summary of baseline demographic and disease characteristics in the pharmacokinetics analysis dataset
Table S4. Summary statistics of pharmacokinetics parameters
Table S5. Population pharmacokinetics model parameter estimates
Table S6. Population exposure–response model parameter estimates
ACKNOWLEDGEMENTS
These analyses were funded by AstraZeneca. The authors gratefully acknowledge Dinko Rekic, Johanna Melin, Magnus Åstrand and Bengt Hamrén for their support of the modelling work. Editorial support was provided by Shivani Balasubramanian of Cactus Communications.
Busse D, Tang W, Scheerer MF, et al. Comparison of pharmacokinetics and the exposure–response relationship of dapagliflozin between adolescent/young adult and adult patients with type 1 diabetes mellitus. Br J Clin Pharmacol. 2019;85:1820–1828. 10.1111/bcp.13981
The authors confirm that the PI for this paper is Prof. Thomas Danne and that he had direct clinical responsibility for patients.
REFERENCES
- 1. Mayer‐Davis EJ, Lawrence JM, Dabelea D, et al. Incidence trends of type 1 and type 2 diabetes among youths, 2002–2012. New Eng J Med. 2017;376(15):1419–1429. [DOI] [PMC free article] [PubMed] [Google Scholar]
- 2. Gao Y‐Q, Gao MIN, Xue Y. Treatment of diabetes in children. Exp Ther Med. 2016;11(4):1168–1172. [DOI] [PMC free article] [PubMed] [Google Scholar]
- 3. DCCT/EDIC . Mortality in type 1 diabetes in the DCCT/EDIC vs the general population. Diabetes Care. 2016;39:1378–1383. [DOI] [PMC free article] [PubMed] [Google Scholar]
- 4. Miller KM, Foster NC, Beck RW, et al. Current state of type 1 diabetes treatment in the U.S.: updated data from the T1D exchange clinic registry. Diabetes Care. 2015;38(6):971–978. [DOI] [PubMed] [Google Scholar]
- 5. Farxiga [Prescribing Information]. Wilmington, DE, USA: AstraZeneca/Bristol Myers Squibb. [Google Scholar]
- 6. Meng W, Ellsworth BA, Nirschl AA, et al. Discovery of dapagliflozin: a potent, selective renal sodium‐dependent glucose cotransporter 2 (SGLT2) inhibitor for the treatment of type 2 diabetes. J Med Chem. 2008;51(5):1145–1149. [DOI] [PubMed] [Google Scholar]
- 7. Han S, Hagan DL, Taylor JR, et al. Dapagliflozin, a selective SGLT2 inhibitor, improves glucose homeostasis in normal and diabetic rats. Diabetes. 2008;57(6):1723–1729. [DOI] [PubMed] [Google Scholar]
- 8. Kasichayanula S, Liu X, LaCreta F, Griffen SC, Boulton DW. Clinical pharmacokinetics and pharmacodynamics of dapagliflozin, a selective inhibitor of sodium‐glucose co‐transporter type 2. Clin Pharmacokinet. 2014;53(1):17–27. [DOI] [PubMed] [Google Scholar]
- 9. Dandona P, Mathieu C, Phillip M, et al. Efficacy and safety of dapagliflozin in patients with inadequately controlled type 1 diabetes (DEPICT‐1): 24 week results from a multicentre, double‐blind, phase 3, randomised controlled trial. Lancet Diabetes Endocrinol. 2017;5(11):864–876. [DOI] [PubMed] [Google Scholar]
- 10. Mathieu C, Dandona P, Gillard P, et al. Efficacy and safety of dapagliflozin in patients with inadequately controlled type 1 diabetes (the DEPICT‐2 study): 24‐week results from a randomized controlled trial. Diabetes Care. 2018;41(9):1938–1946. [DOI] [PubMed] [Google Scholar]
- 11. Tang W, Reele S, Hamer‐Maansson JE, Parikh S, de Bruin TWA. Dapagliflozin twice daily or once daily: effect on pharmacokinetics and urinary glucose excretion in healthy subjects. Diabetes Obes Metab. 2015;17(4):423–425. [DOI] [PubMed] [Google Scholar]
- 12. Biester T, Aschemeier B, Fath M, et al. Effects of dapagliflozin on insulin‐requirement, glucose excretion and ß‐hydroxybutyrate levels are not related to baseline HbA1c in youth with type 1 diabetes. Diabetes Obes Metab. 2017;19(11):1635–1639. [DOI] [PubMed] [Google Scholar]
- 13. Henry RR, Rosenstock J, Edelman S, et al. Exploring the potential of the SGLT2 inhibitor dapagliflozin in type 1 diabetes: a randomized, double‐blind, placebo‐controlled pilot study. Diabetes Care. 2015;38(3):412–419. [DOI] [PubMed] [Google Scholar]
- 14. Alexander SP, Kelly E, Marrion NV, et al. The concise guide to pharmacology 2017/18: overview. Br J Pharmacol. 2017;174(Suppl 1):S1–s16. [DOI] [PMC free article] [PubMed] [Google Scholar]
- 15. Schwartz GJ, Work DF. Measurement and estimation of GFR in children and adolescents. Clin J am Soc Nephrol. 2009;4(11):1832–1843. [DOI] [PubMed] [Google Scholar]
- 16. Levey AS, Coresh J, Greene T, et al. Using standardized serum creatinine values in the modification of diet in renal disease study equation for estimating glomerular filtration rate. Ann Intern Med. 2006;145(4):247–254. [DOI] [PubMed] [Google Scholar]
- 17. Melin J, Parkinson J, Rekić D, Hamrén B, Penland RC, Boulton DW, Tang W. Dapagliflozin pharmacokinetics is similar in adults with type 1 and type 2 diabetes mellitus. In: Annual Meeting of the Population Approach Group in Europe, 2018: 27. Abstr 8427.
- 18. Tang W, Leil TA, Johnsson E, Boulton DW, LaCreta F. Comparison of the pharmacokinetics and pharmacodynamics of dapagliflozin in patients with type 1 vs type 2 diabetes mellitus. J Med Chem. 2016;18:236–240. [DOI] [PubMed] [Google Scholar]
- 19. Parkinson J, Tang W, Johansson CC, Boulton DW, Hamrén B. Comparison of the exposure–response relationship of dapagliflozin in adult and paediatric patients with type 2 diabetes mellitus. Diabetes Obes Metabol. 2016;18(7):685–692. [DOI] [PubMed] [Google Scholar]
- 20. Sokolov V, Yakovleva T, Ueda S, et al. Urinary glucose excretion after dapagliflozin treatment: an exposure‐response modelling comparison between Japanese and non‐Japanese patients diagnosed with type 1 diabetes mellitus. Diabetes Obes Metab. 2019;21:829–836. [DOI] [PMC free article] [PubMed] [Google Scholar]
- 21. Jonsson EN, Karlsson MO. Xpose—an S‐PLUS based population pharmacokinetic/pharmacodynamic model building aid for NONMEM. Comput Methods Programs Biomed. 1998;58(1):51–64. [DOI] [PubMed] [Google Scholar]
- 22. Lindbom L, Ribbing J, Jonsson EN. Perl‐speaks‐NONMEM (PsN)—a Perl module for NONMEM related programming. Comput Methods Programs Biomed. 2004;75(2):85–94. [DOI] [PubMed] [Google Scholar]
- 23. Savic RM, Jonker DM, Kerbusch T, Karlsson MO. Implementation of a transit compartment model for describing drug absorption in pharmacokinetic studies. J Pharmacokinet Pharmacodyn. 2007;34(5):711–726. [DOI] [PubMed] [Google Scholar]
- 24. Harding SD, Sharman JL, Faccenda E, et al. The IUPHAR/BPS Guide to PHARMACOLOGY in 2018: updates and expansion to encompass the new guide to IMMUNOPHARMACOLOGY. Nucl Acids Res. 2018;46(D1):D1091‐D1106. [DOI] [PMC free article] [PubMed] [Google Scholar]
- 25. Alexander SPH, Kelly E, Marrion NV, et al. The Concise Guide to PHARMACOLOGY 2017/18: Transporters. Br J Pharmacol. 2017;174(Suppl 1):S360–S446. [DOI] [PMC free article] [PubMed] [Google Scholar]
Associated Data
This section collects any data citations, data availability statements, or supplementary materials included in this article.
Supplementary Materials
Figure S1.
Goodness‐of‐fit plots representing appropriateness of the final population pharmacokinetics model. (A) Logarithm of dependent variable vs logarithm of predictions and (B) weighted residuals vs independent variable of both clinical studies.
Figure S2. Visual predictive check plots of dapagliflozin plasma concentration for studies NCT01498185 (A‐D) and NCT02325206 (E) representing appropriateness of the final pharmacokinetics model.
Figure S3. Goodness‐of‐fit plots representing appropriateness of the final exposure–response model. (A) dependent variable vs predictions and (B) weighted residuals vs independent variable of both clinical studies.
Figure S4. Visual predictive check plots of 24‐hour urinary glucose excretion vs dapagliflozin area under the dapagliflozin plasma concentration–time curve from time 0 to 24 hours for (A) adults and (B) adolescents representing appropriateness of the final exposure–response model.
Figure S5. 24‐hour urinary glucose excretion vs body weight for adolescent/young adult patients following 2.5, 5, 10 mg dapagliflozin doses.
Table S1. Summary of the studies used in the analysis
Table S2. Equations tested in the modelling process
Table S3. Summary of baseline demographic and disease characteristics in the pharmacokinetics analysis dataset
Table S4. Summary statistics of pharmacokinetics parameters
Table S5. Population pharmacokinetics model parameter estimates
Table S6. Population exposure–response model parameter estimates