

SUMMARY
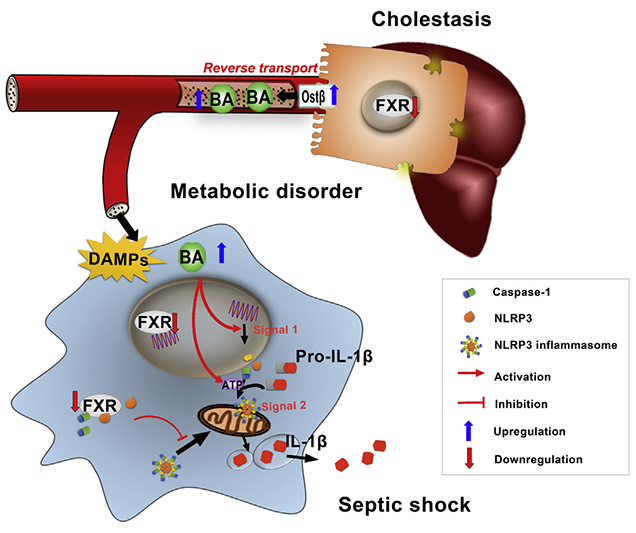
Cholestasis is a common complication of sepsis, and the increased plasma levels of bile acids are predictive of sepsis-associated mortality. However, the exact mechanism by which cholestasis aggravates sepsis development remains elusive. Here, we show that bile acids are danger-associated molecular patterns (DAMPs) that can activate both signal 1 and 2 of the NLRP3 inflammasome in inflammatory macrophages. Mechanistically, bile acids induce a prolonged calcium influx and activate the NLRP3 inflammasome synergistically with ATP. Experimental cholestasis sensitizes, while cholestyramine, a bile acid sequestrant, protects mice from LPS-induced sepsis. FXR negatively regulates the NLRP3 inflammasome via physical interaction with NLRP3 and caspase 1. Fxr-null mice are more sensitive, while FXR-overexpressing mice are more resistant, to endoxemia shock. These findings suggest that bile acids and FXR play pivotal roles in sepsis via controlling the NLRP3 inflammasome, and that targeting FXR may represent a therapeutic strategy for cholestasis-associated sepsis.
Graphical Abstract
In Brief
Cholestasis is associated with high mortality due to sepsis. Hao et al. dissect how cholestasis potentiates septic shock progression and reveal that bile acids act as DAMPs activating both signal 1 and 2 of the NLRP3 inflammasome in inflammatory macrophages. They further show that FXR negatively regulates NLRP3 activation.
INTRODUCTION
Inflammasomes are a class of cytoplasm ic protein complexes sensing endogenous or exogenous pathogen-associated molecular patterns (PAMPs) or danger-associated molecular patterns (DAMPs) that induce inflammatory responses by governing the cleavage of proinflammatory cytokines, including pro-IL-1b and pro-IL18 (Mariathasan et al., 2004; Martinon et al., 2002). NLRP3 represents one of the most comprehensively characterized inflammasomes that was shown to be involved in diverse conditions such as sepsis and infectious diseases (Reboldi et al., 2014; Wirnsberger et al., 2016), auto-inflammatory diseases (Dinarello, 2009; Youm et al., 2015), and metabolic diseases, including diabetes (Jourdan et al., 2013), obesity (Vandanmagsar et al., 2011), gout (Martinon et al., 2006), and atherosclerosis (Duewell et al., 2010). The role of NLRP3 inflammasome in many types of diseases is in line with the finding that NLRP3 can sense structurally diverse PAMPs or DAMPs.
Cholestasis is a common complication in patients with extrahepatic infection and sepsis (Giovannini et al., 2008). Indeed, infection and sepsis-associated cholestasis are found in more than 20% of all hospitalized patients with jaundice. Infections of gram-negative bacteria and the onset of sepsis disrupt the biotransformation and hepatobiliary excretion machinery of bile acids, which is characterized by a significant reduction in BSEP, MRP2, and NTCP, leading to increased levels of bile acids in the liver and circulation (Geier et al., 2006; Vanwijngaerden et al., 2011). Importantly, cholestasis, preceding the conventional markers of liver function, is a very early event in the pathological process of sepsis, and the plasma levels of bile acids represent highly sensitive and specific biomarkers in predicting the mortality of patients with sepsis (Recknagel et al., 2012). Prospective studies also indicated that patients with cholestasis and sepsis exhibit a poor prognostic outcome. Increasing evidence strongly suggests that cholestasis, an early and common complication in sepsis, may potentiate the pathological development of final septic shock. Although the reduced clearance of lipopolysaccharide (LPS) might partially explain the increased mortality of sepsis under conditions of cholestasis, it remains unclear whether and how the accumulated bile acids are involved in the pathological development of cholestasis-associated sepsis.
Bile acids are increasingly recognized as important signaling molecules that play pivotal roles in metabolic homeostasis (Pols et al., 2011), liver regeneration (Huang et al., 2006), and inflammatory responses (Zhou et al., 2014). Thus, bile acids may not only represent a prognostic biomarker of sepsis, but also may be functionally involved in triggering inflammatory responses by serving as DAMPs. The current study revealed that bile acids, in particular chenodeoxycholic acid (CDCA), deoxycholic acid (DCA), and their taurine conjugates, are important DAMPs capable of activating both signal 1 and 2 of the NLRP3 inflammasome. Bile acids can synergize with LPS and ATP to activate the signal 1 and 2, respectively, of the NLRP3 inflammasome, thus providing a physiologically relevant rationale of how the inflammasome is activated in vivo by multiple PAMPs/DAMPs working together. Surprisingly, FXR was found to be an important negative regulator of the NLRP3 inflammasome by directly interacting with NLRP3 and caspase 1. Targeting FXR may provide a therapeutic option for cholestasis-associated sepsis.
RESULTS
FXR Is Dysregulated in Endotoxic Mice
Liver dysfunction and the resultant cholestasis are well-known complications of sepsis. The increased plasma levels of bile acids are believed to be a prognostic biomarker of sepsis, although it is not clear whether this is due to dysregulated catabolism and transport of bile acids and whether it is an early or later event in sepsis. To this end, a non-targeted metabolomic study of LPS-induced endotoxemia was performed in mice. LPS challenge induced an apparent metabolic change as early as 1 hr, and a more dramatic change was observed at 6 hr after LPS dosing (Figure 1). VIP score and heatmap analysis of the biomarkers showed that bile acids were among the top com pounds that produced the metabolomic differences (Figures 1A and S1A). Qualitative and quantitative analysis of bile acid species showed that taurine conjugates of DCA and CDCA were markedly increased as early as 1 hr after LPS challenge in both the serum and peritoneal macrophages (PMs) (Figures 1D and 1E), thus indicating that elevation of serum bile acids is an early event of endotoxemia. Consistently, the hepatic mRNA and protein levels of FXR were sharply reduced, while OSTβ, which is responsible for hepatic efflux transport of taurine conjugates of bile acids from the hepatocytes to blood, was significantly increased (Figures 1F, 1G, and S1B). Notably, the increase of Ostβ was witnessed as early as 1 hr after LPS treatment (Figure 1F). The levels of Ntcp and Bsep mRNAs were slightly but significantly reduced after LPS treatment, although their respective protein levels were largely unchanged (Figures 1G and S1B). A longer time may be necessary to see a biologically relevant reduction of these proteins. These results demonstrate a reverse transport of bile acids and particularly the taurine conjugates from the liver to the blood compartment, resulting in increased serum bile acids.
Figure 1. Bile Acids Are Altered in LPS-Induced Sepsis.

(A) Heatmap illustrating serum metabolite profiles in mice 1 hr after LPS treatment; the top 35 metabolite features were ranked by t test, distance measure was by Pearson correlation, and clustering was determined using the Ward algorithm. C1–C6 represents control mice and L1–L6 represents LPS-treated mice.
(B) Three-dimensional principal component analysis (3D-PCA) of serum metabolome containing, overall, 77 markers 1 hr and 6 hr after LPS treatment in mice.
(C) Variable importance in projection (VIP) plot identified by partial least squares discriminant analysis (PLS-DA) displaying the top 45 most important metabolite features in mice after 1 hr of LPS treatment.
(D and E) Levels of the main bile acid species in serum (D) and PMs(E) in mice after 6 hr of LPS treatment determined by high-performance liquid chromatography-quadrupole time-of-flight tandem mass spectrometry (HPLC-triple/TOF-MS); data of PMs were normalized by protein concentrations.
(F and G) mRNA levels of FXR and bile acid transporters in the liver of mice after 1 (F) or 6 hr(G)of LPS treatment; Gapdh mRNA was used as internal control (n = 6).
Data are representative of two independent experiments and shown as mean ± SEM of six mice, **p < 0.01, *p < 0.05; two-tailed Student’s t tests.
See also Figure S1.
Bile Acids Activate Both Signal 1 and 2 of the NLRP3 Inflammasome
To explore the functional significance of increased uptake of bile acids to macrophages, we determined the role of bile acid species in the activation of the NLRP3 inflammasome, which was shown to be a pivotal player in sepsis despite the debate over the role of IL-1β in sepsis-associated mortality (Rathinam et al., 2012; Reboldi et al., 2014). In both primary mouse PMs and Raw264.7 cells, treatment with bile acids and particularly CDCA and DCA significantly upregulated the levels of mRNAs encoding NRLP3 and IL-1β (Figures 2A and S2A), demonstrating that bile acids are able to activate signal 1 of the NLRP3 inflammasome. Activation of the first signal of the Nlrp3 inflammasome by bile acids occurred in a time-dependent manner, peaking at 4 hr after treatment (Figure S2B). Of interest, DCA synergized with LPS in the upregulation of the NLRP3 inflammasome components (Figure S2C). Pretreatment with TAK-242, a TLR4 inhibitor, had little influence on bile acid-induced NLRP3 inflammasome activation, thus excluding the possibility that LPS contamination of the bile acid source influenced activation (Figures S2D and S2E). We next determined whether bile acids also activate signal 2 of the NLRP3 inflammasome inTHP-1 and PMs. With LPS priming, multiple bile acid species, including CDCA, DCA, and their taurine conjugates, promoted the cleavage of caspase 1 and the maturation of IL-1β in PMs (Figure 2 B) and THP-1 cells (Figure S2F). DCA activated signal 2 in a concentration-dependent manner (Figure S2G). Because bile acids could also activate signal 1 of the NLRP3 inflammasome, it was tested whether bile acids alone without LPS priming could directly activate caspase 1 and IL-1β. In PMs, DCA or CDCA or even their taurine conjugates alone without LPS priming significantly activated caspase 1 and IL-1β (Figure 2C). This revealed that they activate both signal 1 and 2 of the NLRP3 inflammasome. DCA or CDCA alone also activated the NLRP3 inflammasome in THP-1 cells (Figures S2H and S2I); however, the taurine conjugates showed only a very weak activation of the NLRP3 inflammasome in THP-1 cells (Figures S2J and S2K). These results were in line with the finding that the signal 1 activating effects of taurine conjugates were much weaker than that of unconjugated bile acids (Figures 2A and S2A). Because ATP was supposed to be an important DAMP in activation of the NLRP3 inflammasome in sepsis, we tested whether bile acids may synergize with ATP to activate the NLRP3 inflammasome. CDCA and DCA, at a low concentration that is insufficient to activate the NLRP3 inflammasome, dramatically promoted LPS/ATP-triggered activation (Figure 2D). IL-1β levels were elevated in the culture medium when DCA or CDCA was applied together with ATP, compared with that of ATP alone (Figures 2E and 2F). CDCA, DCA, and their taurine conjugates, at a concentration of 50 μM, also activated the NLRP3 inflammasome in murine bone marrow-derived macrophages (BMDMs) (Figure 2H) and macrophages differentiated from human peripheral blood monocytes (Figure 2J), but not in murine bone marrow-derived monocytes (Figure 2G) and human peripheral blood monocytes (Figure 2 I). These results suggest that bile acids can activate the NLPR3 inflammasome in inflammatory macrophages, but not in monocytes.
Figure 2. Bile Acids Activate Both Signal 1 and 2 of the NLRP3 Inflammasome.

(A-C) Bile acid activation of the NLRP3 inflammasome in PMs. Relative expression of Nlrp3 and Il-1β mRNAs (A). PMs were stimulated with 50 μM bile acids or 50 ng/mL LPS for 4 hr. Western blot analysis of caspase 1 and IL-1β in cells with (B) or without (C) LPS priming at 50 ng/mL for 2 hr. The concentration for all bile acids tested is 50 μM.
(D-F) Synergistic effects of bile acids and ATP as assessed by western blot (D) and ELISA (E and F). LPS-primed PMs were stimulated with 25 μM bile acids for 4 hr with or without 0.5 mM ATP, which was spiked for 30 min.
(G-J) ELISA analysis of IL-1β in BM D M s and peripheral blood mononuclear cells (PBMCs). Freshly prepared BM D M s (G) or differentiated BM D M s (H) were stimulated with bile acids (50 μM) for 4 hr, with or without LPS (500 ng/mL) priming for 2 hr. Human PBMCs (I) or human PBMC differentiated macrophages (J) were stimulated with bile acids (50 μM) for 4 hr, with or without LPS (500 ng/mL) priming for 2 hr. A total of 2 mM ATP treatment for 30 min was used as the positive control.
GAPDH was used as internal standard/loading control in qPCR/immunoblot analyses. Data are representative of at least two independent experiments and expressed as mean ± SEM (n = 3). **p < 0.01, *p < 0.05 compared to control unless indicated otherwise; two-tailed Student’s t test.
See also Figure S2.
Bile Acids Activate NLRP3 Inflammasome by Promoting Calcium Influx
To determine the potential mechanisms by which bile acids activate the NLRP3 inflammasome, reactive oxygen species (ROS), potassium, and calcium, all of which had been previously defined as key mediators in activation of the NLRP3 inflammasome by diverse agents, were examined (Man and Kanneganti, 2015). Although both DCA and CDCA induced a significant production of intracellular ROS in THP-1 cells (Figure S3A), treatment with N-acetylcysteine (NAC), a ROS scavenger, was not able to reverse bile acid-induced activation of the NLRP3 inflammasome (Figure S3C), suggesting that ROS might not influence activation of the NLRP3 inflammasome by bile acids. DCA and CDCA induced no change of intracellular potassium, although a significant decrease of intracellular potassium was observed when bile acids were applied together with ATP to THP-1 cells (Figure S3B). High extracellular potassium slightly repressed activation of the NLRP3 inflammasome by CDCA (Figure S3C).
Calcium is believed to be a common trigger of various NLRP3-activating agents, although different routes of calcium flux might be involved in the activity of different agents (Lee et al., 2012; Murakami et al., 2012). Intracellular calcium analysis indicated that bile acids induced a slight but prolonged calcium influx, whereas ATP induced a dramatic but short influx (Figure 3A). It was of interest to note that application of bile acids after the calcium burst induced by ATP triggered a second phase of calcium influx (Figure 3B). Similarly, ATP can also trigger a second phase of calcium influx after the first one by bile acids (Figure 3C). In both cases, the second phase is stronger than the first, supporting a synergistic role in triggering calcium influx between ATP and bile acids. Treatment with calcium chelator BAPTA-AM (Sigma-Aldrich) largely abolished, whereas the treatment of ionomycin (EMD Millipore) drastically promoted, bile acid-induced activation of NLRP3 inflammasome (Figures 3D–3F), supporting the idea that calcium influx is a key mediator involved in bile acid-induced activation of the NLRP3 inflammasome. Accumulating evidence supports the view that mitochondria are involved in activating the NLRP3 inflammasome (Elliott and Sutterwala, 2015). Confocal analysis showed that bile acids promoted the accumulation of calcium within mitochondria (Figure 3G). Moreover, bile acids, with or without LPS priming, dramatically promoted mitochondrial accumulation of caspase 1 (Figures 3H and 3I). These results suggest that bile acids synergizing with ATP might promote calcium influx and redistribution to the mitochondria, which drives activation of the NLRP3 inflammasome. Taken together, these results indicate that although the involvement of potassium efflux and other factors cannot be excluded, calcium influx might be a dominant mechanism underlying activation of the NLRP3 inflammasome by bile acids.
Figure 3. Bile Acids Activate the NLRP3 Inflammasome in a Calcium Influx-Dependent Manner.

(A-C) Intracellular calcium concentrations detected by a fluorescent probe Fluro-4AM together with probenecid; THP-1 cells were stimulated with 200 μM bile acids (A) and 2 mM ATP was spiked in 75 s before (B) or 150 s after bile acid treatment (C). Data are presented as mean value of n = 5; error bars were not shown for clarity.
(D-F) LPS-prim edTHP-1 cells treated with 100 μM bile acid s for 4 hr with or with o u t 1 mM ATP spiked in at last30 min. Cells were pretreated with 50 μM BAPTA-AM or 2.5 μM ionomycin for 30 min.
(G) Representative immunofluorescence images of calcium influx in THP-1 cells that were stimulated with 200 μM bile acids or 2 mM ATP for 5 min. MitoTracker and Fluro-4AM/probenecid were loaded 45 min prior to stimulation.
(H and I) Representative immunofluorescence images of caspase 1 in THP-1 cells that were stimulated with 200 μM bile acids for 4 hr(H) or primed with LPS for 2 hr and then stimulated with 100 μM bile acids for 4 hr or 1 mM ATP for 30 min. Scale bars, 20 μm; one representative image of three independent experiments is shown.
Data are representative of at least two independent experiments and expressed as mean ± SEM (n = 3). **p < 0.01, *p < 0.05 between indicated groups; n.s. represents no significance; two-tailed Student’s t test.
See also Figure S3.
Experimental Cholestasis Aggravates LPS-Induced Sepsis
Cholestasis is a common complication of patients with sepsis and is predictive of worse prognosis (Recknagel et al., 2012). However, how cholestasis influences sepsis and the underlying mechanisms remain largely unknown. All mice survived up to 48 hr after a single intraperitoneal injection at a sub-lethal dose of LPS or DCA alone (Figure S4A). In sharp contrast, co-administration of LPS and DCA at this dose resulted in mice dying as early as 4 hr after treatment, with all mice dying within 48 hr (Figure S4A). Serum levels of IL-1β in mice treated with both LPS and DCA were much higher than in mice treated with either LPS or DCA alone (Figure S4B). Ex vivo analysis showed that LPS and DCA co-treatment induced a much stronger activation by caspase 1 and IL-1β of PMs (Figure S4C). To mimic the pathological condition of sepsis-associated cholestasis, bile duct ligation (BDL) with subsequent injection of LPS was performed. BDL induced a dramatic accumulation of bile acids in the serum (Figure 4A), and the gallbladder was dramatically enlarged (Figure S4D). All mice survived from either BDL or LPS treatment alone, while all mice died within 36 hr from treatment with BDL together with LPS (Figure 4 B). Histopathological analysis showed that BDL and LPS treatment induced drastic injury of multiple organs including liver, lung, and kidney (Figure S4E). BDL alone increased the serum levels of IL-1β and activated caspase 1 and IL-1β in PMs (Figures 4C and 4D). In particular, serum levels of IL-1β and the extent of caspase 1 and IL-1β activation in PMs analyzed ex vivo were much higher in BDL/LPS mice than that in mice treated with LPS alone (Figures 4C and 4D). These results provide direct evidence that cholestasis can aggravate the pathological development of sepsis associated with the activation of the NLRP3 inflammasome.
Figure 4. FXR and Bile Acid Axis Controls Septic Shock in Mice.

(A) Total bile acids in serum of mice.
(B, E, H, and K) Survival analyses of LPS-challenged mice, n = 10. Bile duct ligation-induced cholestasis (B), resin treatment (E), Fxr−/− (H), and Ad-FXR transfection (K).
(C, F, I, and L) Serum levels of IL-1β. Bile duct ligation-induced cholestasis (C), resin treatment (F), Fxr−/− (I), and Ad-FXR transfection (L).
(D, G, J, and M) Western blot analysis of lysates of PMs from mice. Bile duct ligation-induced cholestasis (D), resin treatment (G), Fxr−/− (J), and Ad-FXR transfection (M).
GAPDH or β-actin was used as loading control (n = 3). Data are shown as mean ± SEM of six mice, **p < 0.01, *p < 0.05 compared to sham (A and C) or LPS (F and I) group; two-way ANOVA (A and C) or two-tailed Student’s t tests (F, I, and L).
See also Figure S4.
FXR Controls LPS-Induced Sepsis
To explore the role of FXR and bile acids in sepsis, various approaches to the regulation of FXR/bile acid axis were designed. Pretreatment with cholestyramine resin, a bile acid sequestrant, for 5 days significantly reduced the serum levels of bile acids (Figure S4F) and IL-1β, improved the survival, and repressed activation of caspase 1/IL-1β in PMs as analyzed ex vivo (Figures 4E–4G). FXR is the master regulator of bile acid homeostasis via the regulation of genes involved in bile acid synthesis and transport (Sinal et al., 2000). It is well known that the plasma levels of bile acids are significantly increased in the Fxr-null (Fxr−/− mice. Fxr−/− mice were more susceptible to LPS-induced death (Figure 4 H). Serum levels of IL-1β in Fxr−/− mice were higher than that in the wild-type (WT) controls after LPS treatment (Figure 4I). Ex vivo analysis of PMs indicated that activation of caspase 1/IL-1β from Fxr−/− mice was more evident than that from the WT control mice (Figures 4J and S4G). To further validate the role of FXR in sepsis, a study was performed using adenovirus transfection of FXR to increase FXR levels. FXR transfection significantly restored the serum levels of bile acids (Figure S4H), decreased the serum levels ofIL-1β, and repressed activation of caspase 1/IL-1β in PMs analyzed ex vivo (Figures 4K–4M). Next, we tested whether FXR agonists could protect against LPS-induced septic shock. Unexpectedly, treatment of mice with GW4064 or OCA, both of which are typical FXR agonists, could not improve survival, decrease the serum level of IL-1β, and repress activation of caspase 1/IL-1β in PMs analyzed ex vivo (Figures 5A–5D, S5A, and S5B). GW4064 also had little effect on LPS-induced increase of serum bile acids (Figure 5 E). These results might be explained by the marked reduction of FXR in the liver upon LPS treatment (Figure 1F). Consistently, forced expression of FXR, but not the treatment with FXR agonists such as GW4064 or OCA, significantly restored the expression of FXR target genes (Figures S5C–S5E).
Figure 5. The FXR Agonist GW-4064 Does Not Inhibit Septic Shock in Mice.

(A) Survival analysis (n = 10).
(B) Serum levels of IL-1β determined by ELISA.
(C) Relative mRNA levels of Nlrp3, Pycard, Caspase-1, and Il-1β in PMs.
(D) Western blot analysis of lysates of PMs.
(E) Individual bile acids in serum.
Mice were challenged with LPS at a dose of 30 mg/kg for6 hr with or without combination of 5 mg/kg GW −4064, which was intraperitoneally injected 30 min prior to LPS. Gapdh mRNA and GAPDH were used as internal standard/loading controls in qPCR and western blot analyses, respectively. Data are shown as mean ± SEM of six mice (B, C, and E), **p < 0.01; two-way ANOVA (C) or two-tailed Student’s t tests (B and E). Data are representative of two independent experiments. See also Figure S5.
FXR Negatively Regulates the NLRP3 Inflammasome
Because FXR is positively expressed and can be functionally activated in macrophages (Figures S6A–S6C), we sought to determine whether FXR in macrophages could directly regulate activation of the NLRP3 inflammasome. To this end, PMs were isolated from Fxr−/− mice and their WT littermates to test the responses to inflammasome activation. PMs from Fxr−/− mice were much more susceptible to caspase 1/IL-1β activation by DCA alone in a concentration-dependent manner (Figure 6A). It was of interest to note that the difference in caspase 1/IL-1β activation between FXR-positive and negative PMs treated with LPS together with ATP or DCA was not as evident as that from cells treated with bile acids alone (Figure 6 B), which may be explained by the fact that FXR was rapidly and dramatically downregulated upon LPS treatment. The increased susceptibility of Fxr−/− PMs to caspase 1/IL-1β activation was also supported by the analysis of other bile acid species, including CDCA, TCDCA, and TDCA (Figure 6C). In particular, CA and T-p-MCA activated caspase 1/IL-1β in Fxr−/− PMs, but not in WT PMs (Figure 6C). Moreover, the basal level of activated caspase 1 and mature IL-1β was much higher in Fxr−/− PMs than in those from the WT mice (Figure 6C). Confocal analysis of the mitochondrial recruitment of caspase 1 confirmed that Fxr−/− PMs were more susceptible to bile acid or ATP stimulation than that of FXR-positive controls (Figure 6 D). WT and Fxr−/− bone marrow was transplanted into WT mice; qPCR analysis confirmed that the WT-WT and Fxr−/−-WT mice were highly chimeric (Figure 6 E). After LPS treatment for 6 hr, serum levels of IL-1β were increased in Fxr−/−-WT mice compared to WT-WT mice (Figure 6F). Cleavage of caspase-1 and the maturation of IL-1β in PMs were also increased in Fxr−/−-WT mice compared to WT-WT mice (Figure 6G). These results indicate that FXR in macrophages has a direct negative regulatory effect on Nlrp3 activation.
Figure 6. FXR Negatively Regulates the NLRP3 Inflammasome.

(A-C) Representative western blot analysis of Caspase-1 and IL-1β in PMs. PMs were stimulated with 0–200 μM D C A for 4 hr(A), or primed with 50 ng/mL LP S for 2 hr before treatment with 100 μM bile acids for an additional 4 hr (B), or treatment with 200 μM of various bile acids for 4 hr (C).
(D) Representative immunofluorescence images of LPS-primed PMs that were stimulated with 50 μM bile acids for 4 hr or 0.5 mM ATP for 30 min. Scale bars, 20 μm.
(E-G) The WT mice transplanted with the bone m arrow from WT and Fxr−/− mice. Mice were challenged with LPS at a dose of 20 mg/kg for 6 hr.
(E) Diagnostic PCR for the genotype at the Fxr locus in the genomic DNA isolated from the circulating white blood cells and peripheral tissues.
(F) The plasma levels of IL-1β.
(G) Representative western blot analysis of IL-1β and Caspase-1 in PM s ex vivo.
Data are shown as mean ± SEM, *p < 0.05; by two-tailed Student’s t tests, n = 7. Data are representative of two independent experiments; β-actin or tubulin was used as loading control in western blot analyses.
See also Figure S6.
FXR negatively regulates NLRP3 activation, and paradoxically, FXR ligands, including DCA, CDCA, and their taurine conjugates, promote NLRP3 activation. These results suggest that the repressive effect of FXR on the NLRP3 inflammasome might not be attributed to the ligand-dependent transcriptional activity. NLRP3 inflammasome activation depends on the formation of a protein complex including NLRP3, caspase 1, and ASC. Thus it was tested whether FXR could directly interact with the components of the NLRP3 inflammasome. In the co-immunoprecipitation analysis, FXR antibody, but not the IgG control, co-precipitated NLRP3and caspase 1 (Figure 7A). FXR transfection of THP-1 cells further increased the co-precipitation of NLRP3, caspase 1, and even ASC (Figure 7B). In contrast, FXR knockdown with small interfering RNA (siRNA) sharply decreased the level of NLRP3 inflammasome components found in the co-precipitate (Figure 7C). These results suggest that FXR may physically interact with either NLRP3 or caspase 1 to prevent assembling NLRP3 inflammasome components, thereby repressing its activation.
Figure 7. FXR Physically Interacts with CASPASE 1 and NLRP3.

(A) Co-immunoprecipitation analysis of FXR interaction with NLRP3 inflammasome in THP-1 cells.
(B) Influence of the FXR plasmid transfection.
(C) Influence of FXR silencing.
Proteins were immunoprecipitated with FXR-specific antibody or an IgG control. Precipitates were probed for FXR, NLRP3, ASC, and CASPASE 1; aliquots were blotted in parallel as a loading control. GAPDH was used as loading control in western blot analyses (n = 3).
(D) Schematic illustration of the role and mechanism of FXR/bile acids in the regulation of NLRP3 inflammasome in cholestasis-associated sepsis.
DISCUSSION
Although it was established that cholestasis predicts poor prognostic outcome of sepsis, the underlying mechanisms of how cholestasis aggravates the pathological development of septic injury are largely unknown. The current study revealed that bile acids are a class of DAMPs that activate both signal 1 and 2 of the NLRP3 inflammasome in a calcium influx-dependent manner, providing a mechanistic link to explain why cholestasis aggravates the pathological development of septic injury. In particular, bile acids synergize with ATP in activating the NLRP3 inflammasome, suggesting that multiple DAMPs, instead of a previously proposed single type of DAMPs, underscore the process of NLRP3 inflammasome activation. Moreover, FXR was identified as a negative regulator of the NLRP3 inflammasome, probably via direct physical interaction with NLRP3 and caspase 1 and thereby preventing its assembly in the mitochondria (Figure 7D).
Excessive activation of the NLRP3 inflammasome is believed to be an important factor in the pathological development of septic injury. Pathogen-derived factors and particularly LPS can transcriptionally upregulate Nlrp3, ASC, and Il-1β for priming the NLRP3 inflammasome, after which the host-derived DAMPs, mainly ATP and mitochondrial DNA, may activate signal 2 of the NLRP3 inflammasome (Man and Kanneganti, 2015; Shimada et al., 2012). In addition to these earlier findings, it was recently suggested that metabolic derangement mediated by UCP2 and NOX4 might be implicated in aberrant activation of the NLRP3 inflammasome (Moon et al., 2015, 2016), hinting at an important role of fatty acid dysregulation in sepsis, diabetes, obesity, and other diseases associated with metabolic inflammation (Finucane et al., 2015; Wen et al., 2011). These findings suggest that metabolic disorders may integrate with pathogen-derived factors and host-derived DAMPs in triggering hyperinflammatory responses. Increased plasma levels of bile acids were found in critically ill patients, including sepsis, and are a specific biomarker predicting the mortality of septic patients (Recknagel et al., 2012; Vanwijngaerden et al., 2011). However, the mechanistic link has not been described. Using a non-targeted metabolomics approach, bile acids were found to be a very early biomarker of the LPS-induced entoxemia shock. LPS treatment decreased the expression of Ntcp and Bsep but significantly increased the expression of Ostβ, favoring a reverse transport of bile acids to the blood, leading to increased uptake of bile acids into macrophages. Bile acids can activate both signal 1 and 2 of the NLRP3 inflammasome. Moreover, this activation can be synergized with LPS and ATP, respectively. Under conditions of cholestasis, the plasma levels of total bile acids can be as high as 500 μM. Thus, the current identification of bile acids as a kind of NLRP3 activating DAMPs sheds light on how metabolic derangement integrates other host-derived factors and pathogens in the activation of NLRP3 inflammasome. It is also important to note that bile acids at physiological concentrations are unlikely to activate the NLRP3 inflammasome. This mechanism is important for maintaining homeostasis under physiological conditions.
During revision of the current paper, a report was published indicating that bile acids may repress the NLRP3 inflammasome via activation of TGR5 (Guo et al., 2016). In the current study, multiple bile acid species were found to activate the NLRP3 inflammasome in murine PMs, and macrophages differentiated from THP-1, human peripheral blood monocytes, and murine BMDMs, but not in human peripheral blood monocytes and murine bone m arrow-derived monocytes. The repressive effect of bile acids on activation of the NLRP3 inflammasome was observed mainly from non-differentiated BMDMs treated with LCA (Guo et al., 2016), the strongest endogenous TGR5 agonist, but this metabolite is highly toxic and almost undetectable in circulation. Thus, it seems that the functional influence of bile acids on the NLRP3 inflammasome may vary depending on different immune cell types and conditions. Under infection-induced sepsis, bile acids may activate the NLRP3 inflammasome in inflammatory macrophages in infected tissues, synergistically with PAMPs and other host-derived DAMPs, thereby contributing to the hyper-inflammatory responses in the early phase of sepsis. Actually, the differentiated responses and mechanisms between monocytes and macrophages to the NLRP3 inflammasome activation had previously been observed. The NLRP3 inflammasome in monocytes is constitutively activated and thus LPS alone is sufficient to trigger secretion of mature IL-1β; in contrast, the addition of exogenous signal 2 activating agents like ATP is mandatory for the full activation of the NLRP3 inflammasome in macrophages (Netea et al., 2009). In view of the changes in transcriptional, epigenetic, translational, and metabolomic regulation networks during the differentiation from monocytes to macrophages (Saeed et al., 2014), the differentiated responses between monocytes and macrophages to NLRP3 inflammasome activation are understandable, but the exact mechanisms warrant additional studies. Notably, immunoparalysis, characterized by the inability to respond to secondary infections by innate immunological cells, was observed in the latter phase of sepsis and was predictive of poor prognosis. This phenomenon raises another question, whether prior exposure of monocytes/macrophages to bile acids would lead to a blunted response to the secondary challenge by LPS or other PAMPs, resulting in immunoparalysis in the latter phase of sepsis. Collectively, these results suggest that bile acids, and probably other DAMPs, may exert differential influences on NLRP3 inflammasome in different immunological cells and in different states of sepsis. Nevertheless, results from the current study strongly indicate that bile acids represent a kind of DAMP to activate the NLRP3 inflammasome in inflammatory macrophages in the early phase of sepsis, providing a mechanistic understanding of the clinical findings of why cholestasis is associated with the poor prognosis of sepsis.
While inflammasome activation represents a host defense to pathogens and host-derived damaging signals, excessive activation results in inflammatory injury, and therefore inflammasome activation should be tightly controlled (Man and Kanneganti, 2015). Indeed, a panel of negative regulators of the NLRP3 inflammasome was identified. Dopamine can repress NLRP3 inflammasome activation by targeting dopamine D1 receptor, thereby stimulating the activity of cAMP, which binds to NLRP3 and promotes its ubiquitination via the E3 ubiquitin ligase MARCH7 (Yan et al., 2015). IKKα controls inflammasome by interacting with the adaptor ASC in the nucleus of resting macrophages in an IKKα kinase-dependent manner (Martin et al., 2014). Aryl hydrocarbon receptor and A20 repress NLRP3 activation via transcriptional repression of NLRP3 expression (Huai et al., 2014; Vande Walle et al., 2014). Other negative regulators include T cells via contact with macrophages and T cell-derived IFNγ via the induction of iNOS, andautophagy via the removal of mitochondrial DNA (Mao et al., 2013; Park et al., 2013). Despite these advancements in understanding the negative regulation of inflammasome, the causal link of such negative regulators with the pathological development of real diseases remains incompletely understood. Here, FXR, the master regulator of bile acid homeostasis, was found to be a negative regulator of the NLRP3 inflammasome. FXR physically interacts with NLRP3 and caspase 1, thereafter preventing their assembly in the mitochondria, which is believed to be the major organelle for NLRP3 inflammasome assembly and activation. Notably, LPS treatment resulted in dramatically decreased expression of FXR in both the liver and macrophages, and automatic activation of the NLRP3 inflammasome was found in Fxr−/− macrophages. Decreased expression of hepatic FXR may lead to decreased transport and the resultant increased levels of bile acids in the blood, which subsequently activate NLRP3 inflammasome in the macrophages, in which the downregulation of FXR reinforces the activation. These findings strongly support a pivotal role for the FXR-bile acid axis in regulation of the NLRP3 inflammasome.
Dysregulation of bile acid homeostasis was also found in a set of other diseases including colitis and its associated cancer, diabetes, obesity, and various liver diseases (Cully, 2015; Fang et al., 2015; Jiang et al., 2015; Ryan et al., 2014; Zhou et al., 2014). Moreover, dysregulation of the NLRP3 inflammasome was implicated in bile acid relevant diseases. The current identification of FXR as a negative regulator and bile acids as an activator of the NLRP3 inflammasome may provide insights into understanding the causal link among FXR signaling, bile acids, the NLRP3 inflammasome, and the pathological development of these diseases. Nevertheless, future research is warranted to verify the exact causal link and thereby ascertain whether and how FXR could be targeted to control metabolic inflammation in these diseases. One critical concern in targeting FXR is that when FXR is extremely downregulated, as found in the case of LPS-induced sepsis, FXR agonists may not work to counteract the metabolic inflammation. Restoration of FXR expression in the liver and macrophages might be necessary for reactivating FXR in the negative regulation of NLRP3 inflammasome and in the regulation of bile acid homeostasis.
STAR ★ METHODS
CONTACT FOR REAGENT AND RESOURCE SHARING
Further information and requests for reagents may be directed to and will be fulfilled by the Lead Contact, Frank J. Gonzalez (gonzalef@mail.nih.gov).
EXPERIMENTAL MODEL AND SUBJECT DETAILS
Animals
Specific pathogen-free male C57BL/6 mice were obtained from Shanghai SLAC Laboratory Animal Co., Ltd (Shanghai, China) at the age of 5 weeks and maintained at Animal Facility according to protocols approved by the Review Committee of Animal Care and Use. On arrival, all mice were completely randomized and transferred to plastic cages, and given free access to drinking water and diet, under controlled conditions of humidity (50 ± 10%), light (12/12 hr light/dark cycle), and temperature (25 ± 2°C). The wild-type (WT) mice and the whole-body Fxr null (Fxr−/−) mice are both on a C57BL/6J genetic background (Sinal et al., 2000). The mice were housed in temperature- and light-controlled rooms and given water and pelleted NIH-31 chow ad libitum. All animal studies were performed in accordance with Institute of Laboratory Animal Resources guidelines and approved by the National Cancer Institute Animal Care and Use Committee. All mice were quarantined for one week before starting the experiment.
Cell Lines
Human acute monocytic leukemia cell line THP-1 (source from ATCC, TIB-202, male), murine macrophage cell line RAW264.7 (source from ATCC, TIB-71, male) and murine fibroblast cell line L-929 (source from ATCC, CCL-1, male) were obtained from the Stem Cell Bank of the Chinese Academy of Sciences (Shanghai, China). Cells were maintained in 5% CO2 at 37°C and grown in RPMI-1640 medium for THP-1, DMEM medium for RAW264.7 and DMEM/F12 medium for L-929 containing 10% Fetal Bovine Serum (FBS), 2 mM L-glutamine, penicillin (50 U/ml) and streptomycin (100 μg/ml) (All medium and supplements were obtained from GIBCO). THP-1 cells were differentiated into macrophages by treatment with 10 ng/ml PMA (phorbol 12-myristate 13-acetate, Sigma-Aldrich) for 48 hr. None mycoplasma contamination was tested by a ‘EZ-PCR Mycoplasma Test Kit’.
Primary Human Macrophages
Primary human peripheral blood CD14+ monocytes (PB14C-1, Hemacare) from healthy male donor were maintained in RPMI-1640 medium containing 10% heat- inactivated human AB serum, 5% FBS, penicillin (50 U/ml) and streptomycin (100 μg/ml). Cells were differentiated into macrophages by 100 U/ml recombinant human M-CSF (Z02914–100, GenScript) for 7 days.
Primary Murine Macrophages
Isolation of mouse peritoneal macrophages from male C57BL/6 mice was performed as previously described with minor modification (Ray and Dittel, 2010; Zhang et al., 2008). In detail, 3 mL of 3% Brewer thioglycollate medium (BD difco) was intraperitoneally injected per mouse, allowing the inflammatory response to proceed for three days. Mice were euthanized by rapid cervical dislocation and soaked with 75% alcohol for 5 min and then the abdominal skin was retracted to fully expose the intact peritoneal. 10 mL of ice-cold RPMI-1640 medium (containing 5% FBS) were intraperitoneally injected into each mouse along the spleen side, and then fluid was aspirated from the peritoneum by using a 10 mL syringe with 21-G needle. The peritoneal exudate cells were centrifuged for 10 min at 400 × g, at 4°C. For western blot analysis in the septic mouse model, cells were resuspended with RIPA lysis (containing 2mM PMSF) followed by protein extraction. For confocal imaging or ex vivo experiments, cell pellets in cold RPMI-1640 medium were resuspended by gently pipetting up and down and counted before plating.
Bone marrow-derived macrophages (BMDMs) were obtained by differentiating bone marrow progenitors from bone marrow of male C57BL/6 mice; bone marrow cells were harvested as previously described (Zhang et al., 2008). In detail, mice were euthanized by rapid cervical dislocation and soaked with 75% alcohol for 5 min. Under aseptic condition, peel the skin from hind legs, cut off and discard the foot along with the skin, and cut off the hind legs at the hip joint, leaving the intact femur in plastic dish containing sterile PBS. Remove excess muscle from legs with forceps and scissors and carefully sever leg bones proximal to each joint. A 10 mL syringe with 25-G needle was inserted into bone marrow cavity of femur, flushing bone cavity with 2 to 5 mL of the wash medium (Dulbecco’s phosphate-buffered saline without calcium and magnesium) until the bone cavity turned white. The medium was collected into a sterile 50 mL conical centrifuge tube on ice. Cells were centrifuged 10 min at 500 × g and the cell pellets were resuspended and cultured in the DMEM/F12 complete medium containing 20% of L-929 conditioned medium. The medium was replaced on day 3 and the cells used for assays on day 7. For assays of non-differentiated BMDMs, the cells were plated and treated immediately within 24 hr until adherence.
Plasmids and Adenoviral Vectors
The expression plasmid ICIS human FXR was provided by Grace L. Guo (Li et al., 2012). The Ad-flag-FXR virus was supplied by Jongsook Kim Kemper (Kemper et al., 2009).
METHOD DETAILS
Animal treatments
Septic shock was induced by intraperitoneal injection of LPS (20 mg/kg for 6 h; 30 mg/kg for survival assays). For activation or inhibition of FXR-bile acid signaling, mice were treated with GW4064 (i.p. 5 mg/kg 30 min before LPS challenge), OCA (i.g. 15 mg/kg 1 hr before LPS challenge), DCA-Na (i.p. 50 mg/kg 2 hr after LPS challenge), Ad-flag-FXR virus (i.v. 5 × 10¹⁰ cfu/kg/d for 3 days prior to LPS challenge) or cholestyramine resin (i.g. 2.5 g/kg twice per day for 5 days prior to LPS challenge). LPS (E.coli 0111:B4), DCA-Na and cholestyramine resin were from Sigma-Aldrich (St Louis, USA), and obetacholic acid (OCA) and GW4064 were from Selleck Chemicals (Houston, USA).
Bone Marrow Transplantation
The WT and Fxr−/− mice total bone marrow hematopoietic progenitor donor cells were harvested and transplanted via tail vein injection into the lethally irradiated (Co60, 1000 rad) WT mice. The transplanted mice were maintained for 6 weeks and treated with 20 mg/kg LPS i.p. for 6 hr.
Common Bile Duct Ligation
All animals were anesthetized with chloral hydrate solution (0.3 g/kg) administered by intraperitoneal injection. After induction of anesthesia, a median abdominal incision was made and the common bile duct was identified. The duct was dissected carefully and doubly ligated with 7–0 Prolene (Ethicon, Somerville, NJ). In the sham operation group, the duct was dissected without ligation. We injected 0.5 mL of 0.9% saline intraperitoneally to improve recovery and survival after ligation or sham control. The abdominal incision was closed in two layer sand wiped with alcohol swab after surgery; the mice were kept warm until recovery. Five days after surgery, the mice were intraperitoneally injected with 10 mg/kg LPS for induction of endotoxemia, and peritoneal macrophages isolated four hours after injection. For survival experiments, the mice were intraperitoneally injected with LPS at a dose of 20 mg/kg to induce sepsis.
SiRNA Transfection
THP-1 cells were transfected with FXR siRNA (sc-38848, Santa Cruz) or negative control siRNA (sc-44230, Santa Cruz) using a reverse transfection method according to instructions. A complex of 500 μL Opti-MEM medium and 5 μL of Lipofecramine RNAiMAX containing 20nM FXR SiRNA or 20nM negative control was premixed per well in a 6-well plate (transfection reagents were all from Life Technologies). THP-1 cells were then plated at a density of 1 × 10⁶ per well; optimal transfection time was of 48 hr as the maximal silence efficiency evidenced by western blot analysis.
Plasmid Transfection
THP-1 cells were electrotransfected with FXR plasmid DNA(2.5 μg/1 × 106 cells) using a Mouse Macrophage Nucleofector Kit or Cell Line Nucleofector Kit V (Amaxa, Lonza) following the manufacturer’s instructions, LONZA 4D-Nucleofector System (Lonza, Germany) was used for transfection with the built-in program (code: FF-100). Cells were then transferred to a 6-well plate for immunoprecipitation analysis or to a poly-L-lysine coated glass bottom 24-well plate for immunofluorescence analysis.
Immunoprecipitation
Approximately 1 × 10⁷ THP-1 cells were harvested and proteins were extracted in 1 mL of NP-40 lysate with protease inhibitor cocktail (P8340, Sigma-Aldrich); the lysates were immunoprecipitated with primary antibody of FXR (sc-13063, Santa cruz) for 4 hr at 4°C followed by Protein A Agarose (15918–014, Novex) for 1 hr at 4°C. The mixture was washed with lysis buffer reducing sample buffer, and proteins in the immunoprecipitates were then subjected to western blot analysis.
Immunofluorescence
For confocal imaging of primary mouse PMs and differentiated THP-1 cells, cells were plated in a 24-well glass bottom plate at a density of 1 × 10⁵ per well. After the NLRP3 inflammasome activating treatment, the cells were washed twice with PBS, fixed with cold 4% paraformaldehyde for 20 min, permeabilized using 1% Triton X-100 in 2% BSA for 15 min, blocked with 2% BSA for 1 hr at room temperature and then incubated with primary antibodies at suitable dilution as instructed overnight at 4°C. The secondary antibodies used were Alexa-Fluor 488 conjugated chiken anti-mouse (Life Technologies). Cell images were acquired on a LSM700 confocal microscope (Zeiss, Oberkochen, Germany).
Intracellular Calcium Concentrations
Intracellular calcium concentration was detected following the manufacturer’s instructions. In brief, PMA differentiated THP-1 cells were loaded with Fluo-4 AM (molecular probes, Life Technologies) together with Probenecid (molecular probes, Life Technologies) in 37°C for 45 min. Then the cells were treated as indicated and the fluorescence was recorded (emission at 515 nm, excitation at 488 nm). Detection was performed every 5 s by using Synergy H1 multi-mode reader (Bio Tek, Winooski, USA).
Measurements of Intracellular Potassium
Intracellular K+ measurement was performed according to the manufacturer’s instructions. Briefly, PMA differentiated THP-1 were loaded with the cell permeant acetoxymethyl ester PBFI (PBFI-AM, molecular probes) at 5 μM in 37°C for 60 min in the presence of 0.02% (w/w) pluronic F-127 (Sigma-Aldrich) before the indicated stimulation. The expected intracellular potassium decrease was detected in PBFI 340/380 fluorescence ratio. Fluorescence detection was conducted at indicated time after incubation with bile acids by using Synergy H1 multi-mode reader (Bio Tek, Winooski, USA).
Intracellular ROS Production Assays
PMA differentiated THP-1 cells were treated as indicated and incubated with fresh medium added containing 10 μM DCFH-DA (Sigma-Aldrich) at 37°C for30 min. The cells were then washed with PBS 3 times and lysed with lysis buffer (50% methanol containing 0.1 M NaOH). After gently stripping the cells from the plate and spinning at 4500 rpm for 5 min, the supernatants were transferred and fluorescence at 488/525 nm detected using a Synergy H1 multi-mode reader (Biotek). All the data were normalized with protein concentration.
Metabolomics Analysis
For serum metabolomics, a 65-ml aliquot of serum was extracted with 260 ml of ice-cold methanol containing 3.75 μg/ml 13C-Glucose (Cambridge Isotope Laboratories, Inc., MA, USA) as internal standard. After vibration and centrifugation at 18,000 g for 5 min, 250 μl supernatant was transferred and evaporated to dryness at room temperature under vacuum. The residue was dissolved in 50 μl of ddH2O (1:1) prior to metabolomics analysis performed by HPLC-Triple-TOF/MS (Sciex, USA) equipped with an ESI source. Separation was achieved on an XBridge BEH Amide HPLC column (100 mm × 4.6 mm i.d., 3.5 μm, Waters Corp.). The mobile phase A was a mixture of acetonitrile/water (5/95, v) containing 5 mM ammonium acetate (pH 9.0) and phase B was acetonitrile. The gradient elution program consisted of a 3min isocratic elution of 85% B, a 3 min linear gradient of 85% B to 30% B, to 2% B at 15 min and maintained to 18 min, a linear increase to 85% B at 19 min and maintained to 26 min to equilibrate the column. The column temperature was maintained at 40°C and the flow rate was 0.65 ml/min. MS data was acquired in the negative ESI modes at a range of m/z 50 to 1,000.
ELISA
IL-1β in serum or supernatant was measured using an IL-1β ELISA Kit (ExCell Bio, Shanghai, China) following the manufacturer’s instructions.
qPCR
RNA was extracted from liquid nitrogen frozen tissue and cell samples using RNAiso Plus reagent (Takara, Japan) according to the manufacturer’s instructions. cDNA was synthesized from 2.5 μg total RNA using Superscript II reverse transcriptase (Applied Biosystems, CA, USA). Sequences of qPCR primers were from PrimerBank followed by NCBI blast. The primer sequences shown in the Table S1. mRNA levels were normalized to Gapdh mRNA and expressed as fold change relative to the control/vehicle group.
Western Blotting
The collected cells were lysed in RIPA lysis solution containing 2 mM PMSF, and whole-cell proteins extracted and quantitated by the BCA assay (all protein extraction and quantification reagents were from Beyotime Biotechnology). Sixty μg of protein were then subjected to SDS-PAGE electrophoresis (Bio-rad), transferred to polyvinylidene fluoride (PVDF) membranes (Bio-Rad) and probed with primary antibodies followed by HRP-conjugated secondary antibodies. The immunoreactive bands were visualized with HRP substrate (Luminata, Millipore) using ChemiDocTM XRS+ system (Bio-Rad). The following antibodies were used: ASC (sc-22514, Santa Cruz); Caspase-1 (sc-56036, Santa Cruz); IL-1β (sc-7884, Santa Cruz); NLRP3 (ab4207, Abcam); FXR (sc-1204, Santa Cruz); GAPDH (5174, CST); β-actin (8457L, CST); α/β-Tublin (2148, CST); anti-rabbit, anti-mouse HRP-conjugated second antibodies (7074S and 7076S, CST), and anti-goat HRP-conjugated second antibody (ab6885, Abcam).
QUANTIFICATION AND STATISTICAL ANALYSIS
For animal studies, the sample sizes were based on the empirically assessed variability of the model systems or assays used, and groups contained no less than six mice as possible to minimize type I / II errors. No sample was excluded from data analysis. Statistical analyses were performed using GraphPad Prism 6 software (GraphPad) and using the built-in statistical tests indicated in the individual figure legends. p values of < 0.05 were considered significant. Error bars represent s.e.m. as noted in the individual figure legends. Metabolic analyses were performed using MetaboAnalyst 3.0. Unless otherwise stated, at least two independent experiments were carried out for animal studies and at least three for in vitro/ex vivo assays, and the displayed figures are representative of the obtained results.
Supplementary Material
KEY RESOURCES TABLE
| REAGENT or RESOURCE | SOURCE | IDENTIFIER |
|---|---|---|
| Antibodies | ||
| Rabbit polyclonal anti-FXR | Santa Cruz | Cat#sc-13063; RRID: AB_2155051 |
| Mouse monoclonal anti-caspase1 | Santa Cruz | Cat#sc-56036; RRID: AB_781816 |
| Goat polyclonal anti-NLRP3 | Abeam | Cat#ab4207; RRID: AB_955792 |
| Rabbit polyclonal anti-ASC | Santa Cruz | Cat#sc-22514; RRID: AB_2174874 |
| Rabbit polyclonal anti-IL-1β | Santa Cruz | Cat#sc-7884; RRID: AB_2124476 |
| Goat polyclonal anti-FXR | Santa Cruz | Cat#sc-1204; RRID: AB_2283053 |
| Rabbit monoclonal anti-GAPDH | Cell Signaling Technology | Cat#5174; RRID: AB_10622025 |
| Rabbit monoclonal anti-β-Actin | Cell Signaling Technology | Cat#8457L; RRID: AB_10950489 |
| Rabbit polyclonal anti-α/β-Tubulin | Cell Signaling Technology | Cat#2148 |
| Chicken anti-mouse, Alexa Fluor 488 | Life Technologies | Cat#A-21200; RRID: ABJ41606 |
| Bacterial and Virus Strains | ||
| Adenovirus-flag-FXR | (Kemper et al., 2009) | N/A |
| Chemicals, Peptides, and Recombinant Proteins | ||
| Lipopolysaccharides from Escherichia coli 0111:B4 | Sigma-Aldrich | Cat#L2630 |
| Phorbol 12-myristate 13-acetate | Sigma-Aldrich | Cat#P8139; CAS: 16561-29-8 |
| Protease inhibitor cocktail | Sigma-Aldrich | Cat#P8340 |
| Protein A Agarose | Novex | Cat#15918–014 |
| U-13C6-Glucose | Cambridge Isotope Laboratories | Cat#CLM-1396–1; CAS:110187-42-3 |
| Deoxycholic acid | Sigma-Aldrich | Cat#D2510; CAS:83-44-3 |
| Chenodeoxycholic acid | Sigma-Aldrich | Cat#C9377; CAS:474-25-9 |
| Sodium taurodeoxycholate hydrate | Sigma-Aldrich | Cat#T0875; CAS:207737-97-1 |
| Sodium taurochenodeoxycholate | Sigma-Aldrich | Cat#T6260; CAS:6009-98-9 |
| 2’,7’-Dichlorofluorescin diacetate | Sigma-Aldrich | Cat#D6883; CAS:4091-99-0 |
| Pluronic F-127 | Sigma-Aldrich | Cat#P2443; CAS:9003-11-6 |
| BAPTA-AM | Sigma-Aldrich | Cat#A1076; CAS: 126150-97-8 |
| Cholestyramine resin | Sigma-Aldrich | Cat#C4650; CAS:11041-12-6 |
| Cholic acid | Sigma-Aldrich | Cat#C1129;CAS:81-25-4 |
| Obeticholic acid | Selleck | Cat#S7660; CAS:459789-99-2 |
| GW4064 | Selleck | Cat#S2782; CAS:278779-30-9 |
| Taurocholic acid sodium salt hydrate | Sigma-Aldrich | Cat#T4009; CAS:345909-26-4 |
| Adenosine 5’-triphosphate disodium salt hydrate | Sigma-Aldrich | Cat#A7699; CAS:34369-07-8 |
| lonomycin, Free Acid | Merck Millipore | Cat#407950; CAS:56092-81-0 |
| Tauro β-muricholic acid sodium salt | Steraloids | Cat#C1899-000 |
| Recombinant Human M-CSF | GenScript | Cat#Z02914-100 |
| Sodium deoxycholate | Sigma-Aldrich | Cat#30970; CAS:302-95-4 |
| TAK-242 (Resatorvid) | Chemleader Biomedical | CAS:243984-11-4 |
| Thioglycollate Medium, Brewer Modified | BD, Difco | Cat#211716 |
| Mitotracker Red CMXRos | Cell Signaling Technology | Cat#9082P |
| Normal rabbit IgG | Santa Cruz | Cat#SC-2027 |
| Critical Commercial Assays | ||
| Fluo-4 NW Calcium Assay Kit | Molecular Probes | Cat#F36206 |
| Human IL-1β ELISA Kit | ExCell Bio | Cat#EH001–96 |
| PBFI, AM, cell permeant | Molecular Probes | Cat#P1267MP |
| SG Cell Line 4D-Nucleofector X Kit L | Lonza | Cat#V4XC-3024 |
| P2 Primary Cell 4D-Nucleofector X Kit L | Lonza | Cat#V4XP-2024 |
| Mouse IL-1β ELISAKit | ExCell Bio | Cat#EM001–96 |
| EZ-PCR Mycoplasma Test Kit | Biological Industries | Cat#20–700-20 |
| Reactive Oxygen Species Assay Kit | Beyotime | Cat#S0033 |
| Experimental Models: Cell Lines | ||
| Human: THP-1 cells | Stem Cell Bank of the Chinese Academy of Sciences | ATCC TIB-202 |
| Mouse: RAW264.7 cells | Stem Cell Bank of the Chinese Academy of Sciences | ATCCTIB-71 |
| Mouse: fibroblast cell line L-929 cells | Stem Cell Bank of the Chinese Academy of Sciences | ATCC CCL-1 |
| Experimental Models: Organisms/Strains | ||
| Mouse: C57B176J | Shanghai SLAC Laboratory Animal Co. | RRID: IMSR_JAX:000664 |
| Mouse:Fxr-null (Fxr−/−): C57BL/6J | (Sinal et al., 2000) | N/A |
| Human:primary CD14+ monocytes from healthy volunteers | Hemacare | Cat#PB14C-1 |
| Oligonucleotides | ||
| FXR siRNA | Santa Cruz | Cat#SC-38848 |
| Control siRNA-B | Santa Cruz | Cat#SC-44230 |
| Primers for qPCR; see Table S1 | This paper | N/A |
| Recombinant DNA | ||
| pCMV-ICIS human FXR | (Li et al.,2012) | N/A |
| Software and Algorithms | ||
| GraphPad Prism 6 software (GraphPad) | http://www.graphpad.com/ | N/A |
| MetaboAnalyst 3.0 | http://www.metaboanalyst.ca/ | N/A |
Highlights.
Bile acids activate both signal 1 and 2 of the NLRP3 inflammasome
Bile acids activate the NLRP3 inflammasome via promoting calcium influx
FXR is a negative regulator of the NLRP3 inflammasome
The FXR-bile acid axis modulates LPS-induced sepsis
ACKNOWLEDGMENTS
We thank Grace L. Guo (University of Rutgers) for providing plasmid ICIS human FXR and Jongsook Kim Kemper (University of Illinois) for providing Ad-flag-FXR. This study was financially supported by the National Natural Science Foundation of China (grants 81325025, 81430091, 91429308, 81273586, 81522007, and 81603193), the project for Major New Drug Innovation and Development (grant 2015ZX09501010) to H.H., National Natural Science Foundation of China (grants 81530098 and 81421005) to G.W., and Intramural Research Program of the National Cancer Institute (ZIA BC005562) to F.J.G.
Footnotes
SUPPLEMENTAL INFORMATION
Supplemental Information includes six figures and one table and can be found with this article online at http://dx.doi.org/10.1016/j.cmet.2017.03.007.
REFERENCES
- Cully M (2015). Obesity and diabetes: FXR and JAK step up to BAT. Nat. Rev. Drug Discov. 74, 91. [DOI] [PubMed] [Google Scholar]
- Dinarello CA (2009). Interleukin-1beta and the autoinflammatory diseases. N. Engl. J. M ed. 360, 2467–2470. [DOI] [PubMed] [Google Scholar]
- Duewell P, Kono H, Rayner KJ, Sirois CM, Vladimer G, Bauernfeind FG, Abela GS, Franchi L, Nuñez G, Schnurr M, et al. (2010). NLRP3 inflammasomes are required for atherogenesis and activated by cholesterol crystals. Nature 464, 1357–1361. [DOI] [PMC free article] [PubMed] [Google Scholar]
- Elliott EI, and Sutterwala FS (2015). Initiation and perpetuation of NLRP3 inflammasome activation and assembly. Immunol. Rev 265, 35–52. [DOI] [PMC free article] [PubMed] [Google Scholar]
- Fang S, Suh JM, Reilly SM, Yu E, Osborn O, Lackey D, Yoshihara E, Perino A, Jacinto S, Lukasheva Y, et al. (2015). Intestinal FXR agonism promotes adipose tissue browning and reduces obesity and insulin resistance. Nat. M ed 27, 159–165. [DOI] [PMC free article] [PubMed] [Google Scholar]
- Finucane OM, Lyons CL, Murphy AM,, Reynolds CM, Klinger R, Healy NP, Cooke AA, Coll RC, McAllan L, Nilaweera KN, et al. (2015). Monounsaturated fatty acid-enriched high-fat diets impede adipose NLRP3 inflammasome-mediated IL-1β secretion and insulin resistance despite obesity. Diabetes 6 4, 2116–2128. [DOI] [PubMed] [Google Scholar]
- Geier A, Fickert P, and Trauner M (2006). Mechanisms of disease: mechanisms and clinical implications of cholestasis in sepsis. Nat. Clin. Pract. Gastroenterol. Hepatol 3, 574–585. [DOI] [PubMed] [Google Scholar]
- Giovannini I, Chiarla C, Giuliante F, Vellone M, Ardito F, and Nuzzo G (2008). Sepsis-induced cholestasis. H epatology 47, 361. [DOI] [PubMed] [Google Scholar]
- Guo C, Xie S, Chi Z, Zhang J, Liu Y, Zhang L, Zheng M, Zhang X, Xia D, Ke Y, et al. (2016). Bile acids control inflammation and metabolic disorder through inhibition of NLRP3 inflammasome. Immunity 45, 802–816. [DOI] [PubMed] [Google Scholar]
- Huai W, Zhao R, Song H, Zhao J, Zhang L, Zhang L, Gao C, Han L, and Zhao W (2014). Aryl hydrocarbon receptor negatively regulates NLRP3 inflammasome activity by inhibiting NLRP3 transcription. Nat. Commun 5 , 4738. [DOI] [PubMed] [Google Scholar]
- Huang W, Ma K, Zhang J, Qatanani M, Cuvillier J, Liu J, Dong B, Huang X, and Moore DD (2006). Nuclear receptor-dependent bile acid signaling is required for normal liver regeneration. Science 372, 233–236. [DOI] [PubMed] [Google Scholar]
- Jiang C, Xie C, Lv Y, Li J, Krausz KW, Shi J, Brocker CN, Desai D, Amin SG, Bisson WH, et al. (2015). Intestine-selective farnesoid X receptor inhibition improves obesity-related metabolic dysfunction. Nat. Commun 6, 10166. [DOI] [PMC free article] [PubMed] [Google Scholar]
- Jourdan T, Godlewski G, Cinar R, Bertola A, Szanda G, Liu J, Tam J, Han T, Mukhopadhyay B, Skarulis MC, et al. (2013). Activation of the Nlrp3 inflammasome in infiltrating macrophages by endocannabinoids mediates beta cell loss in type 2 diabetes. Nat. Med 79, 1132–1140. [DOI] [PMC free article] [PubMed] [Google Scholar]
- Kemper JK, Xiao Z, Ponugoti B, Miao J, Fang S, Kanamaluru D, Tsang S, Wu SY, Chiang CM, and Veenstra TD (2009). FXR acetylation is normally dynamically regulated by p300 and SIRT1 but constitutively elevated in metabolic disease states. Cell M etab. 70, 392–404. [DOI] [PMC free article] [PubMed] [Google Scholar]
- Lee GS, Subramanian N, Kim AI, Aksentijevich I, Goldbach-M ansky R, Sacks DB, Germain RN, Kastner DL, and Chae JJ (2012). The calcium-sensing receptor regulates the NLRP3 inflammasome through Ca2+ and cAMP. Nature 492, 123–127. [DOI] [PMC free article] [PubMed] [Google Scholar]
- Li G, Thomas AM, W illiams JA, Kong B, Liu J, Inaba Y, Xie W, and Guo GL (2012). Farnesoid X receptor induces murine scavenger receptor Class B type I via intron binding. PLoS ONE 7, e35895. [DOI] [PMC free article] [PubMed] [Google Scholar]
- Man SM, and Kanneganti TD (2015). Regulation of inflammasome activation. Immunol. Rev 265, 6–21. [DOI] [PMC free article] [PubMed] [Google Scholar]
- Mao K, Chen S, Chen M, Ma Y, Wang Y, Huang B, He Z, Zeng Y, Hu Y, Sun S, et al. (2013). Nitric oxide suppresses NLRP3 inflammasome activation and protects against LPS-induced septic shock. Cell Res. 23, 201–212. [DOI] [PMC free article] [PubMed] [Google Scholar]
- Mariathasan S, Newton K, Monack DM, Vucic D, French DM, Lee WP, Roose-Girma M, Erickson S, and Dixit VM (2004). Differential activation of the inflammasome by caspase-1 adaptors ASC and Ipaf. Nature 430, 213–218. [DOI] [PubMed] [Google Scholar]
- Martin BN, Wang C, Willette-Brown J, Herjan T, Gulen MF, Zhou H, Bulek K, Franchi L, Sato T, Alnemri ES, et al. (2014). IKKa negatively regulates ASC-dependent inflammasome activation. Nat. Commun 5, 4977. [DOI] [PMC free article] [PubMed] [Google Scholar]
- Martinon F, Burns K, and Tschopp J (2002). The inflammasome: a molecular platform triggering activation of inflammatory caspases and processing of proIL-beta. Mol. Cell 10, 417–426. [DOI] [PubMed] [Google Scholar]
- Martinon F, Pétrilli V, Mayor A, Tardivel A, and Tschopp J (2006). Gout-associated uric acid crystals activate the NALP3 inflammasome. Nature 440, 237–241. [DOI] [PubMed] [Google Scholar]
- Moon JS, Lee S, Park MA, Siempos II, Haslip M, Lee PJ, Yun M, Kim CK, Howrylak J, Ryter SW, et al. (2015). UCP2-induced fatty acid synthase promotes NLRP3 inflammasome activation during sepsis. J. Clin. Invest 125, 665–680. [DOI] [PMC free article] [PubMed] [Google Scholar] [Retracted]
- Moon JS, Nakahira K, Chung KP, DeNicola GM, Koo MJ, Pabón MA, Rooney KT, Yoon JH, Ryter SW, Stout-Delgado H, and Choi AM (2016). NOX4-dependent fatty acid oxidation promotes NLRP3 inflammasome activation in macrophages. Nat. M ed 22, 1002–1012. [DOI] [PMC free article] [PubMed] [Google Scholar] [Retracted]
- Murakami T, Ockinger J, Yu J, Byles V, McColl A, Hofer AM, and Horng T (2012). Critical role for calcium mobilization in activation of the NLRP3 inflammasome. Proc. Natl. Acad. Sci. USA 109, 11282–11287. [DOI] [PMC free article] [PubMed] [Google Scholar]
- Netea MG, Nold-Petry CA, Nold MF, Joosten LA, Opitz B, van der Meer JH, van de Veerdonk FL, Ferwerda G, Heinhuis B, Devesa I, et al. (2009). Differential requirement for the activation of the inflammasome for processing and release of IL-1beta in monocytes and macrophages. Blood 113,2324–2335. [DOI] [PMC free article] [PubMed] [Google Scholar]
- Park YJ, Yoon SJ, Suh HW, Kim DO, Park JR, Jung H, Kim TD, Yoon SR, Min JK, Na HJ, et al. (2013). TXNIP deficiency exacerbates endotoxic shock via the induction of excessive nitric oxide synthesis. PLoS Pathog. 9, e1003646. [DOI] [PMC free article] [PubMed] [Google Scholar]
- Pols TW, Nomura M, Harach T, Lo Sasso G, Oosterveer MH, Thomas C, Rizzo G, Gioiello A, Adorini L, Pellicciari R, et al. (2011). TGR5 activation inhibits atherosclerosis by reducing macrophage inflammation and lipid loading. Cell Metab. 14, 747–757. [DOI] [PMC free article] [PubMed] [Google Scholar]
- Rathinam VA, Vanaja SK, W aggoner L, Sokolovska A, Becker C, Stuart LM, Leong JM, and Fitzgerald KA (2012). TRIF licenses caspase-11-dependent NLRP3 inflammasome activation by gram-negative bacteria. Cell 150, 606–619. [DOI] [PMC free article] [PubMed] [Google Scholar]
- Ray A, and Dittel BN (2010). Isolation of mouse peritoneal cavity cells. J. Vis. Exp 35, 1488. [DOI] [PMC free article] [PubMed] [Google Scholar]
- Reboldi A, Dang EV, McDonald JG, Liang G, Russell DW, and Cyster JG (2014). Inflammation. 25-hydroxycholesterol suppresses interleukin-1-driven inflammation downstream of type I interferon. Science 345 , 679–684. [DOI] [PMC free article] [PubMed] [Google Scholar]
- Recknagel P, Gonnert FA, W estermann M, Lam beck S, Lupp A, Rudiger A, Dyson A, Carré JE, Kortgen A, Krafft C, et al. (2012). Liver dysfunction and phosphatidylinositol-3-kinase signalling in early sepsis: experimental studies in rodent models of peritonitis. PLoS Med. 9, e1001338. [DOI] [PMC free article] [PubMed] [Google Scholar]
- Ryan KK, Tremaroli V, Clemmensen C, Kovatcheva-Datchary P, M yronovych A, Karns R, Wilson-Perez HE, Sandoval DA, Kohli R, Bäckhed F, and Seeley RJ (2014). FXR is a molecular target for the effects of vertical sleeve gastrectom y. Nature 509, 183–188. [DOI] [PMC free article] [PubMed] [Google Scholar]
- Saeed S, Quintin J, Kerstens HH, Rao NA, Aghajanirefah A, Matarese F, Cheng SC, Ratter J, Berentsen K, van der Ent MA, et al. (2014). Epigenetic programming of monocyte-to-macrophage differentiation and trained innate immunity. Science 345, 1251086. [DOI] [PMC free article] [PubMed] [Google Scholar]
- Shimada K, Crother TR, Karlin J, Dagvadorj J, Chiba N, Chen S, Ramanujan VK, W olf AJ, Vergnes L, Ojcius DM, et al. (2012). Oxidized mitochondrial DNA activates the NLRP3 inflammasome during apoptosis. Immunity 36, 401–414. [DOI] [PMC free article] [PubMed] [Google Scholar]
- Sinal CJ, Tohkin M, Miyata M, Ward JM, Lambert G, and Gonzalez FJ (2000). Targeted disruption of the nuclear receptor FXR/BAR impairs bile acid and lipid homeostasis. Cell 102, 731–744. [DOI] [PubMed] [Google Scholar]
- Vandanmagsar B, Youm YH, Ravussin A, Galgani JE, Stadler K, Mynatt RL, Ravussin E, Stephens JM, and Dixit VD (2011). The NLRP3 inflammasome instigates obesity-induced inflammation and insulin resistance. Nat. M ed. 17, 179–188. [DOI] [PMC free article] [PubMed] [Google Scholar]
- Vande Walle L, Van Opdenbosch N, Jacques P, Fossoul A, Verheugen E, Vogel P, Beyaert R, Elewaut D, Kanneganti TD, van Loo G, and Lamkanfi M (2014). Negative regulation of the NLRP3 inflammasome by A20 protects against arthritis. Nature 512, 69–73. [DOI] [PMC free article] [PubMed] [Google Scholar]
- Vanwijngaerden YM, W auters J, Langouche L, Vander Perre S, Liddle C, Coulter S, Vanderborght S, Roskams T, Wilmer A, Van den Berghe G, and Mesotten D (2011). Critical illness evokes elevated circulating bile acids related to altered hepatic transporter and nuclear receptor expression. Hepatology 54, 1741–1752. [DOI] [PubMed] [Google Scholar]
- Wen H, Gris D, Lei Y, Jha S, Zhang L, Huang MT, Brickey WJ, and Ting JP (2011). Fatty acid-induced NLRP3-ASC inflammasome activation interferes with insulin signaling. Nat. Immunol 12, 408–415. [DOI] [PMC free article] [PubMed] [Google Scholar]
- Wirnsberger G, Zwolanek F, Asaoka T, Kozieradzki I, Tortola L, W immer RA, Kavirayani A, Fresser F, Baier G, Langdon WY, et al. (2016). Inhibition of CBLB protects from lethal Candida albicans sepsis. Nat. Med 22, 915–923. [DOI] [PMC free article] [PubMed] [Google Scholar]
- Yan Y, Jiang W, Liu L, Wang X, Ding C, Tian Z, and Zhou R (2015). Dopamine controls systemic inflammation through inhibition of NLRP3 inflammasome. Cell 160, 62–73. [DOI] [PubMed] [Google Scholar]
- Youm YH, Nguyen KY, Grant RW, Goldberg EL, Bodogai M, Kim D, D’Agostino D, Planavsky N, Lupfer C, Kanneganti TD, et al. (2015). The ketone metabolite β-hydroxybutyrate blocks NLRP3 inflammasome-mediated inflammatory disease. Nat. Med 21, 263–269. [DOI] [PMC free article] [PubMed] [Google Scholar]
- Zhang X, Goncalves R, and Mosser DM (2008). The isolation and characterization of murine macrophages. Curr. Protoc. Immunol Chapter 14, 10.1002/0471142735.im1401s83. [DOI] [PMC free article] [PubMed] [Google Scholar]
- Zhou X, Cao L, Jiang C, Xie Y, Cheng X, Krausz KW, Qi Y, Sun L, Shah YM, Gonzalez FJ, et al. (2014). PPARα-UGT axis activation represses intestinal FXR-FGF15 feedback signalling and exacerbates experimental colitis. Nat. Commun 5, 4573. [DOI] [PMC free article] [PubMed] [Google Scholar]
Associated Data
This section collects any data citations, data availability statements, or supplementary materials included in this article.