Abstract
Epidemiological studies demonstrate a possible relationship between chronic ethanol drinking and thrombotic diseases, such as myocardial infarction and stroke. However, the precise mechanism for this association remains unclear. Sulfatides are endogenous glycosphin-golipids composed of ceramide, galactose, and sulfate, known to have anti-thrombotic properties. Low (0.5 g/kg/ day), middle (1.5 g/kg/day), and high (3.0 g/kg/day) doses of ethanol were administered for 21 days intraperitoneally to female wild-type mice, and serum/liver sulfatide levels were measured. No significant changes in cholesterol and triglycerides were seen in serum and liver by ethanol treatment. However, serum/liver sulfatide levels were significantly decreased by middle- and high-dose ethanol treatment, likely due to downregulation of hepatic cerebro-side sulfotransferase (CST) levels. Marked decreases in the expression of catalase and superoxide dismutases and ensuing increases in lipid peroxides were also observed in the livers of mice with middle- and high-dose ethanol treatment, suggesting the association between the suppression of hepatic CST expression and enhancement of oxidative stress. Furthermore, serum levels of tissue factor, a typical pro-coagulant molecule, were significantly increased in the mice with middle- and high-dose ethanol treatment showing decreases in serum sulfatide levels. Collectively, these results demonstrate that chronic ethanol consumption reduces serum sulfatide levels by increasing oxidative stress and decreasing the expression of CST in the liver. These findings could provide a mechanism by which chronic ethanol drinking increases thrombotic events.
Keywords: Ethanol, Sulfatide, Cardiovascular disease, Cerebroside sulfotransferase, Oxidative stress, Tissue factor
Introduction
Most adults drink ethanol with no harmful effects to their health. Indeed, drinking moderately decreases the incidence of cardiovascular disease (CVD) due in part to increases in serum high-density lipoprotein cholesterol (HDL-C) levels (Gaziano et al. 2000; Sesso 2001; Brinton 2012). However, ethanol-related problems resulting from chronic drinking or binge drinking are among the most significant public health concerns in the USA and worldwide. Each year in the USA, approximately 80,000 people die from ethanol-related causes, making it the third leading preventable cause of death. The causes of death by heavy ethanol drinking are not only a consequence of alcoholic liver disease (ALD), but also thrombotic diseases, such as stroke and myocardial infarction (Djoussé and Gaziano 2008; Lakshman et al. 2010; Kloner and Rezkalla 2007; Paunio et al. 1996; Lin et al. 2005). However, the mechanism of increased risk of cardiovascular/cerebrovascular events by heavy ethanol drinking remains unclear.
Chronic ethanol consumption causes lipid accumulation and increases oxidative stress in the livers of mice and humans. The feeding of 4 % ethanol-containing Lieber-DeCarli diet to mice lacking peroxisome proliferator-activated receptor alpha (PPARα) gene for 6 months exhibits hepatomegaly, macrovesicular steatosis, hepatocyte apoptosis, mitochondrial swelling, hepatitis, and hepatic fibrosis, resembling clinicopathological features of ALD in humans (Nakajima et al. 2004). Polyenephosphatidylcholine, a major component of essential phospholipids, could prevent ALD in Ppara-null mice by attenuating the increases in oxidative stress (Okiyama et al. 2009). These findings indicate a close relationship among lipid metabolism, oxidative stress, and ethanol toxicity.
Sulfatides are glycosphingolipids composed of ceramide, galactose, and sulfate and are widely distributed in various organs (Ishizuka 1997; Hara and Taketomi 1987, 1991; Kyogashima 2004; Hara et al. 1993, 1996). Sulfatides are mainly produced in the liver and secreted into blood as a component of lipoprotein (Ishizuka 1997; Hara and Taketomi 1987). Although the physiological roles of serum sulfatides are not fully understood, the administration of exogenous sulfatides prolongs blood coagulation time, indicating the anti-coagulant and anti-thrombotic properties (Hara and Taketomi 1987, 1991; Kyogashima 2004; Hara et al. 1993, 1996). Indeed, it was reported that serum sulfatide levels are significantly decreased in hemodialysis patients having a history of CVD compared with those having no history of CVD (Hu et al. 2007). It is tempting to speculate that decreases in serum sulfatide levels may be associated with the development of thrombotic events in heavy drinkers. However, the relationship between ethanol consumption and sulfatide metabolism has not been examined.
In the present study, serum/liver sulfatide levels were measured in mice treated with different doses of ethanol in order to examine whether high-dose ethanol administration can affect sulfatide metabolism.
Materials and methods
Mice and experimental design
Female Sv/129 mice (26 weeks of age; 22–34 g body weight) were used according to the previous studies of acute ethanol toxicity (Zhou et al. 2003; Vasiliou et al. 2006). The mice were housed under temperature- and light-controlled environment (25 °C; 12-h light/dark cycle) in a specific pathogen-free facility and fed standard rodent diet and tap water ad libitum. The mice were randomly assigned to 4 groups [vehicle, low-dose (0.5 g/kg/day), middle-dose (1.5 g/kg/day), and high-dose (3.0 g/kg/day) ethanol treatment groups; n = 6 in each group]. The dose of ethanol at 3.0 g/kg/day in mice corresponds to more than 50 g/day in humans who are defined as heavy drinkers. Ethanol was administered intraperitoneally once a day (10:00 a.m.) for 21 days, as reported previously (Vasiliou et al. 2006; Guo and Ren 2010; Guo et al. 2010; Ma et al. 2009; Malcolm and Alkana 1981; Walker et al. 2009). In brief, ethanol (Wako Pure Chemical Industries Ltd., Osaka, Japan) was diluted with physiological saline (Otsuka Pharmaceutical Factory, Inc., Tokushima, Japan), and the solutions containing 3.3, 10, and 20 % (v/v) ethanol were prepared to inject 10 or 15 mL/kg/day to mice. For acclimatization, 0.33, 1.0, and 2.0 g/kg/day of ethanol was injected in each group within 2 days. The dose of ethanol was raised to 0.5, 1.5, or 3.0 g/kg/day, respectively, at day 3. The same amount of saline was administered to the vehicle group in a similar manner. In the present study, intraperitoneal injection was selected as ethanol administration according to the following 2 reasons. First, we wanted to minimize the influence of the gastrointestinal tract to make serum ethanol levels as high as possible. In fact, the maximum serum concentrations of ethanol after intraperitoneal administration of 3.0 g/kg ethanol were significantly higher than those after oral administration (61.0 ± 3.18 vs. 43.0 ± 4.06 mmol/L, P = 0.05, n = 3 in each group). Serum ethanol levels could be efficiently increased by intraperitoneal administration compared to oral administration. Second, in preliminary experiments, some mice died after oral administration of high-dose ethanol. Ethanol may induce the production of immunoregulatory cytokines on contact with the stomach (Carson and Pruett 1996). The intraperitoneal administration of ethanol may provide a reasonable representation of repeated binge drinking without the increases in the immunoregulatory cytokines.
Daily food intake was determined in each cage in the same group, and the body weight was measured just before ethanol injection. At day 21, the mice were killed under anesthesia 2 h after the last injection and serum and liver were collected from each mouse and stored at –80 °C until analysis. Serum ethanol concentrations were measured using the F-Kit Ethanol (Roche Diagnostics). All animal experiments were conducted in accordance with the animal study protocols approved by the Shinshu University School of Medicine.
Measurement of lipids
Serum triglyceride (TG) concentrations were measured using the Triglyceride E-Test Wako kits (Wako). To measure hepatic TG and the total cholesterol content, the total lipid in liver tissue (30 mg) was extracted according to the hexane/isopropanol method (Hara and Radin 1978). The lipid extract was solubilized in distilled water by the addition of Triton X-100 (Wako) as described previously with minor modifications (Carr et al. 1993), and hepatic TG and the total cholesterol content was measured using the Triglyceride E-Test Wako kits and the Cholesterol E-Test kit (Wako), respectively. Serum lipoprotein profiles were examined by nondenaturing discontinuous gradient poly-acrylamide gel electrophoresis (Lipofilm kit, Sebia, Issyles-Moulineaux, France) according to the manufacturer’s instructions (Peters et al. 1997).
Quantitation and identification of sulfatides
Sulfatides were extracted from 50 μL of serum and hepatic homogenate of each mouse according to the hexane/isopropanol method (Hara and Radin 1978). Sulfatides were converted to lysosulfatides (LS; sulfatides without fatty acids) by saponification with sodium hydroxide (Fig. 1, Li et al. 2007; Hu et al. 2007; Wang et al. 2011; Sheng et al. 2012). After purification, the LS samples were desalted by Monotip C18 cartridges (GL Sciences, Tokyo, Japan) followed by the addition of N-acetyl LS possessing sphinganine (LS-d18:0 NAc) as an internal standard. They were then analyzed by matrix-assisted laser desorption ionization-time-of-flight mass spectrometry (MALDI-TOF MS) using a Voyager Elite XL Biospectrometry Workstation (PerSeptive Biosystems, Framingham, MA, USA) in negative ionization mode (Li et al. 2007). A two-point external calibration was performed with LS-d18:0 NAc ([M–H]– = 584.31) and LS-(4E)-sphinganine (LS-d18:1) ([M–H]– = 540.28). The following 7 molecular species of LS were detected based on the differences in sphingoid base structure: LS-sphingadienine (LS-d18:2), LS-d18:1, LS-d18:0, LS-phytosphingosine (LS-t18:0), LS-(4E)-icosasphingenine (LS-d20:1), LS-icosasphinganine (LS-d20:0), and LS-4D-hydroxyi-cosasphinganine (LS-t20:0) (Ishizuka 1997, Li et al. 2007). The levels of sulfatides were calculated as the sum of the levels of these 7 LS species.
Fig. 1.
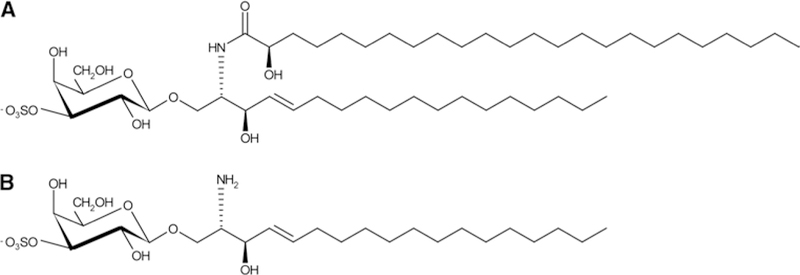
Structure of the representative sulfatide (a) and lysosulfatide (b). a Sulfatide-possessing d18:1 as a sphingoid base with cerebronic acid. b Lysosulfatide (LS-d18:1), which is generated from (a)
Analysis of mRNA
Total liver RNA was extracted using the RNeasy Mini Kits (QIAGEN, Hilden, Germany), and the mRNA was reverse-transcribed using oligo-dT primers with SuperScript II reverse transcriptase (Invitrogen Corporation, Carlsbad, CA, USA). Levels of mRNA were analyzed by quantitative real-time polymerase chain reaction (PCR) using a SYBR Premix Ex Taq II (Takara Bio, Otsu, Japan) on a Thermal Cycler Dice TP800 system (Takara Bio) (Xiaowei et al. 2009; Tanaka et al. 2008a). The specific primers were designed by Primer Express software (Applied Biosystems, Foster City, CA, USA) and the sequences are shown in supplemental Table 1 (Xiaowei et al. 2009; Tanaka et al. 2008a). Each mRNA level was normalized to glyceralde-hyde-3-phosphate dehydrogenase (Gapdh) mRNA and then normalized to that of mice in the vehicle group.
Immunoblot analysis
Preparations of whole-liver lysates were performed as described previously (Aoyama et al. 1994, 1995, 1989, 1998; Tanaka et al. 2008b). Protein concentrations were determined using the BCA Protein Assay Kits (Pierce Biotechnology, Rockford, IL, USA). Whole-liver lysates (50 μg protein) were subjected to sodium dodecyl sulfate gel electrophoresis and transferred to nitrocellulose membranes (GE Healthcare, Chalfont St. Giles, UK). The sodium dodecyl sulfate polyacrylamide precast gels (10 %) were purchased from TEFCO (Tokyo, Japan). After blocking, these membranes were incubated with primary antibodies followed by alkaline-phosphatase-conjugated secondary antibodies and then treated with 1-Step NBT/BCIP substrate (Pierce Biotechnology, Rockford, IL, USA). A mouse polyclonal primary antibody against cerebroside sulfotransferase (CST) was purchased from Abnova Corporation (Jhouzih St., Taiwan). A mouse polyclonal primary antibody against UDP-glucuronosyltransferase (UGT) 8a and monoclonal primary antibody against galactosylceramidase (GALC) were purchased from Santa Cruz Biotechnology (Santa Cruz, CA, USA). A goat polyclonal primary antibody against arylsulfatase A (ARSA) and rabbit polyclonal primary antibodies against actin and 4-hydroxynonenal (4-HNE) were obtained from Everest Biotech (Upper Heyford, Oxfordshire, UK), Santa Cruz Biotechnology (Santa Cruz, CA), and ALEXIS Biochemicals (Farmingdale, NY, USA), respectively. A polyclonal primary antibody to catalase was prepared using purified catalase (Furuta et al. 1986). Other primary antibodies, against neutrophil cytosolic factor (NCF) 1, NADPH oxidase 2 (CYBB), superoxide dismutase (SOD) 1, SOD2, and glutathione peroxidasel (GPX1), were obtained from Santa Cruz Biotechnology (Santa Cruz, CA). Alkaline-phosphatase-conjugated goat anti-rabbit IgG, rabbit anti-goat IgG, and goat anti-mouse IgG antibodies were obtained from Jackson ImmunoResearch Laboratories (West Grove, PA, USA). The positions of protein bands were determined by co-electrophoresis of molecular weight marker. Band intensities were quantified densitometrically, normalized to those of actin, and then normalized to those of mice in the vehicle group.
Measurement of lipid peroxides
The concentrations of malondialdehyde (MDA) and 4-HNE in liver were measured using a LPO-586 kit (OXIS International, Beverly Hills, CA, USA).
Assessment of liver injury
Serum levels of aspartate and alanine aminotransferases (AST and ALT, respectively) were measured by use of commercial kits purchased from Wako (Tanaka et al. 2010). For histological examination, small blocks of liver tissue from each mouse were fixed in 10 % formalin in phosphate-buffered saline and embedded in paraffin. Sections (4 μm thick) were stained with hematoxylin and eosin as described previously (Tanaka et al. 2008c).
Measurement of serum tissue factor (TF)
Serum TF levels were determined using the AssayMax Human Tissue Factor ELISA kit (AssayPro, Anaheim, CA, USA). The data sheet states that the mouse TF is completely cross-reacted to the anti-human TF used in this kit.
Statistical analysis
Results are expressed as mean ± standard deviation (SD). Statistical analysis was performed using SPSS software 11.5J for Windows (SPSS Inc., Chicago, IL, USA). Comparison between the groups was made by means of Student’s t test. A P < 0.05 was considered to be statistically significant.
Results
Decreased serum/liver sulfatide levels by middle- and high-dose ethanol treatment
All mice appeared healthy throughout the experimental period with no significant differences in food intake, body weight, liver/body weight ratio, and serum AST and ALT levels between the ethanol-treated groups and controls (Supplemental Fig. 1). Serum ethanol levels were increased in a dose-dependent manner (Supplemental Fig. 1). Histological findings of the liver showed no inflammation or steatosis in all mice (Supplemental Fig. 2). TG and total cholesterol in serum and liver and the distribution of serum lipoproteins were examined, revealing no significant differences between the ethanol-treated groups and controls (Fig. 2).
Fig. 2.
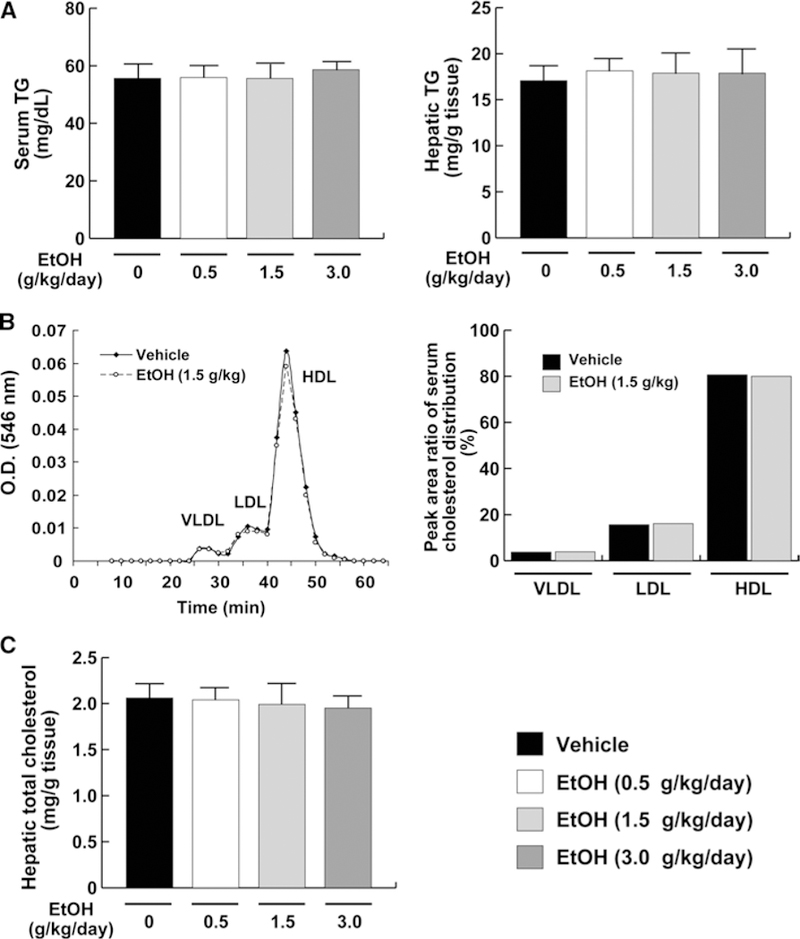
Serum and liver cholesterol/TG levels in mice receiving ethanol treatment. a Serum/liver TG levels. b Representative cholesterol profile composed of very low-density Lipoprotein (VLDL), low-density lipoprotein (LDL), and high-density lipoprotein (HDL) and the peak area ratio of the serum cholesterol distribution. c Hepatic total cholesterol levels. Data for (a) and (c) are expressed as mean ± SD. Data for (b) are expressed as mean. Vehicle, vehicle group (n = 6); EtOH (0.5 g/kg/day), low-dose ethanol treatment group (n = 6); EtOH (1.5 g/kg/day), middle- dose ethanol treatment group (n = 6); EtOH (3.0 g/kg/day), high-dose ethanol treatment group (n = 6)
To investigate the influence of ethanol on sulfatide metabolism, serum concentrations of sulfatides were examined. Serum sulfatide levels in the low-dose ethanol group (0.5 g/kg/day) were not altered, but were significantly decreased in the middle-dose (1.5 g/kg/day) and high-dose ethanol groups (3.0 g/kg/day) (Fig. 3). Such changes in serum sulfatide concentrations were correlated with changes in hepatic sulfatide contents, which are in agreement with previous observations (Sheng et al. 2012). These results showed that chronic high-dose ethanol consumption decreased serum/liver sulfatide levels.
Fig. 3.
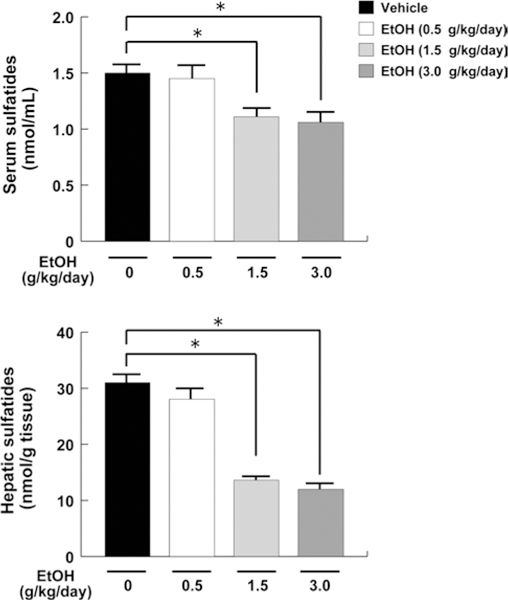
Serum and liver sulfatide levels in mice receiving ethanol treatment. Sulfatide levels in serum and liver were measured by MALDI-TOF MS and calculated as the sum of 7 LS species. Data are expressed as mean ± SD. The groups and numbers of mice were the same as Fig. 2. *P < 0.05 between the vehicle and indicated ethanol treatment groups
Expression of the genes associated with lipid transport in the liver
Since sulfatides are present in serum as components of lipoprotein (Ishizuka 1997; Hara and Taketomi 1987), there is a possibility that the reduction in serum sulfatide levels might be due to impairment of lipid transport in hepatocytes. To assess this possibility, the mRNA levels of the genes associated with lipid transport [fatty acid-binding protein 1 (Fabp1) and sterol carrier protein 2 (Scp2)] and secretion [microsomal TG transfer protein (Mttp) and apolipoprotein B (Apob)] were examined. However, the expression of these genes did not change in all groups (Fig. 4).
Fig. 4.
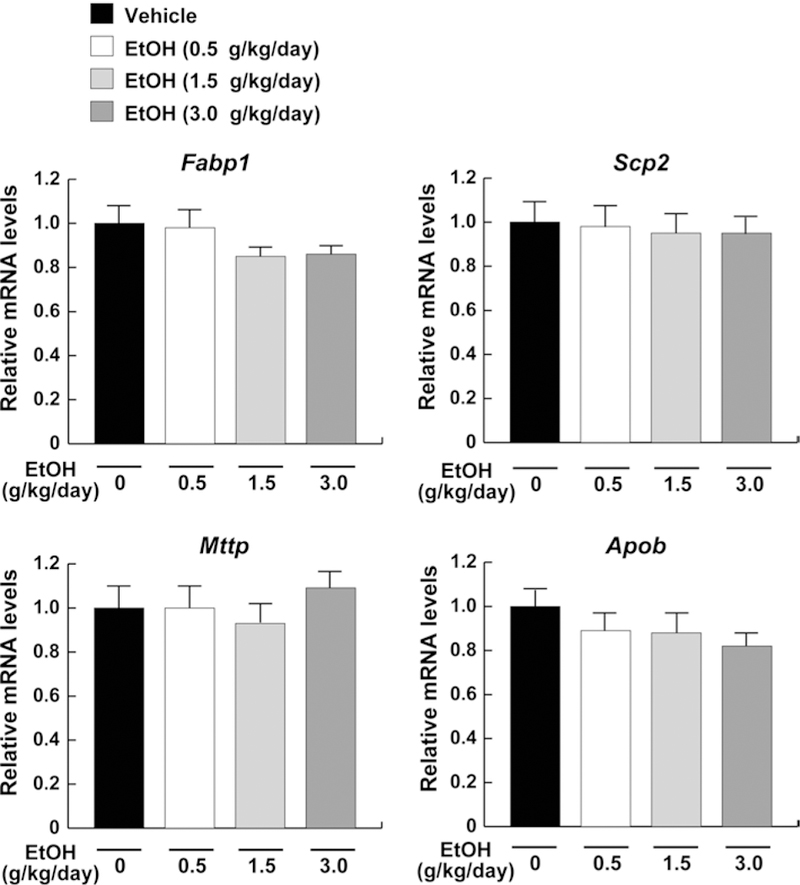
Expression of the genes associated with lipid transport in mice receiving ethanol treatment. Hepatic mRNA levels encoding Fabp1, Scp2, Mttp, and Apob were measured using quantitative real-time PCR and normalized to those of Gapdh mRNA. Relative mRNA levels are shown as fold changes to that of mice in the vehicle group. Data are expressed as mean ± SD. The groups and numbers of mice were the same as Fig. 2
Decreased expression of CST, a sulfatide-synthesizing enzyme, by middle- and high-dose ethanol treatment
To elucidate the molecular mechanisms underlying the decreases in serum/liver sulfatides in middle- and high-dose ethanol-treated mice, hepatic expression of sulfatide-metabolizing enzymes was examined. The mRNA levels encoding Cst, a key enzyme of sulfatide synthesis, were significantly decreased by the middle- and high-dose ethanol treatment, but not altered in the low-dose ethanol group (Fig. 5a). The mRNA levels encoding Arsa, a major enzyme of sulfatide degradation, were not altered by any ethanol treatments (Fig. 5a). Similar changes were also confirmed by immunoblot (Fig. 5b). Furthermore, hepatic expression of galactosylceramide-metabolizing enzymes was examined because galactosylceramide is a precursor of sulfatide and its amounts may influence sulfatide levels. Indeed, the mRNA and protein levels of UGT8a and GALC did not change by different doses of ethanol (Fig. 6). These results indicated that the decreases in serum/liver sulfatide levels by middle- and high-dose ethanol were mainly due to downregulation of hepatic CST expression.
Fig. 5.
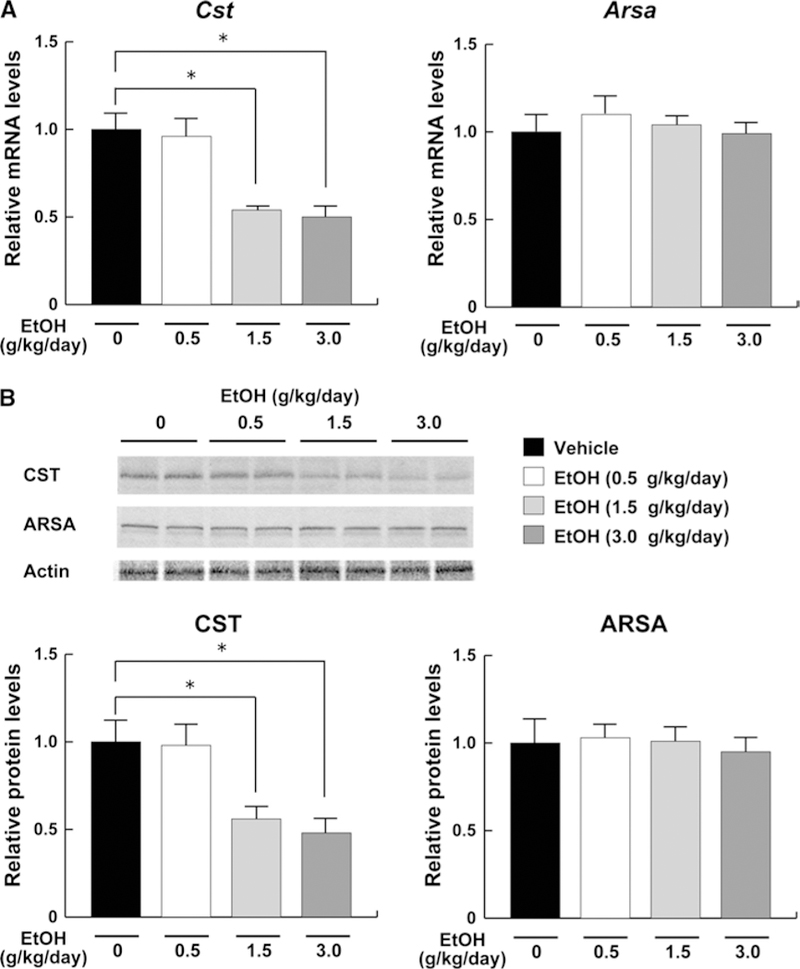
Hepatic expression of the enzymes involved in sulfatide metabolism in mice receiving ethanol treatment. a The mRNA levels encoding Cst and Arsa. The same samples in Fig. 4 were used. Relative mRNA levels are shown as fold changes to that of mice in the vehicle group. b Immunoblot analysis of CST and ARSA. Fifty micrograms of whole-liver lysate protein prepared from each mouse was loaded into each well for electrophoresis. Actin was used as the loading control. Band intensities were measured densitometrically, normalized to those of actin, and then normalized to those of mice in the vehicle group. Data are expressed as mean ± SD. The groups and numbers of mice were the same as Fig. 2. *P < 0.05 between the vehicle and indicated ethanol treatment groups
Fig. 6.
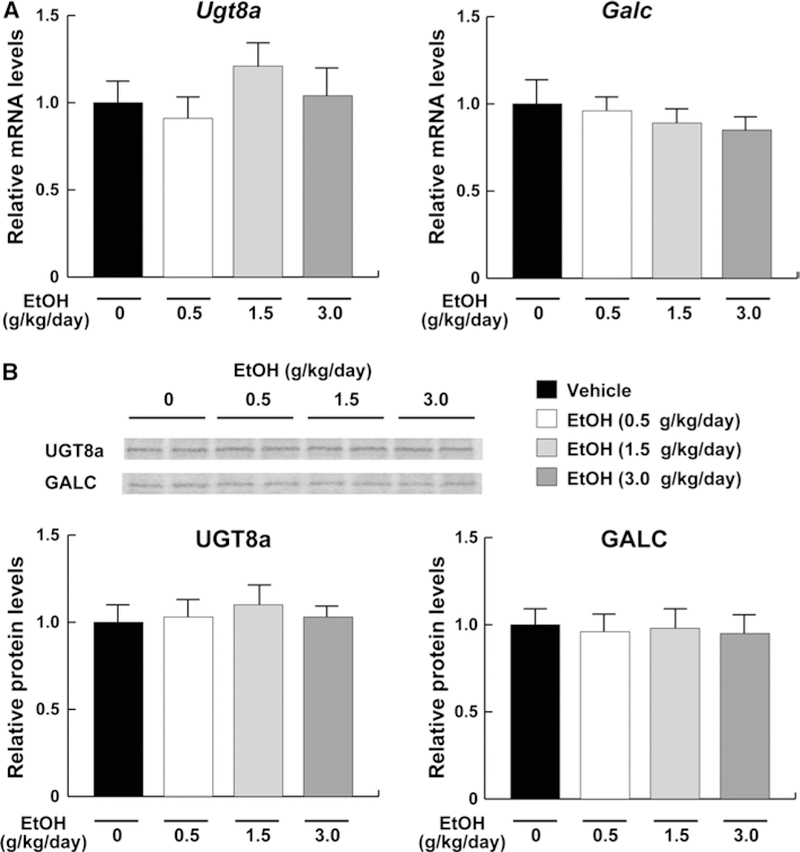
Hepatic expression of the enzymes involved in galactosylceramide metabolism in mice receiving ethanol treatment. a The mRNA levels encoding Ugt8a and Galc. The same samples in Fig. 4 were used. b Immunoblot analysis of UGT8a and GALC. The same samples in Fig. 5b (50 μg of protein) were used. Band intensities were measured densitometrically, normalized to those of actin, and then normalized to hepatic levels of mice in the vehicle group. Data are expressed as mean ± SD. The groups and numbers of mice were the same as Fig. 2
Increased hepatic oxidative stress by middle- and high-dose ethanol treatment
A previous report suggests the possible link between suppression of hepatic CST expression and increased oxidative stress (Xiaowei et al. 2009). In agreement with this finding, hepatic contents of lipid peroxidation byproducts, MDA and 4-HNE, were significantly increased in the middle- and high-dose ethanol groups (Fig. 7). There were no significant changes in hepatic expression of reactive oxygen species (ROS)-generating enzymes, NADPH oxidase subunits NCF1 and CYBB, in all groups (Fig. 8). However, hepatic expression of catalase, SOD1, and SOD2 mRNA and protein, which are involved in the elimination of ROS, were markedly decreased in the middle- and high-dose ethanol groups, while the expression of GPX1 mRNA and protein was not different between the groups (Fig. 9).
Fig. 7.
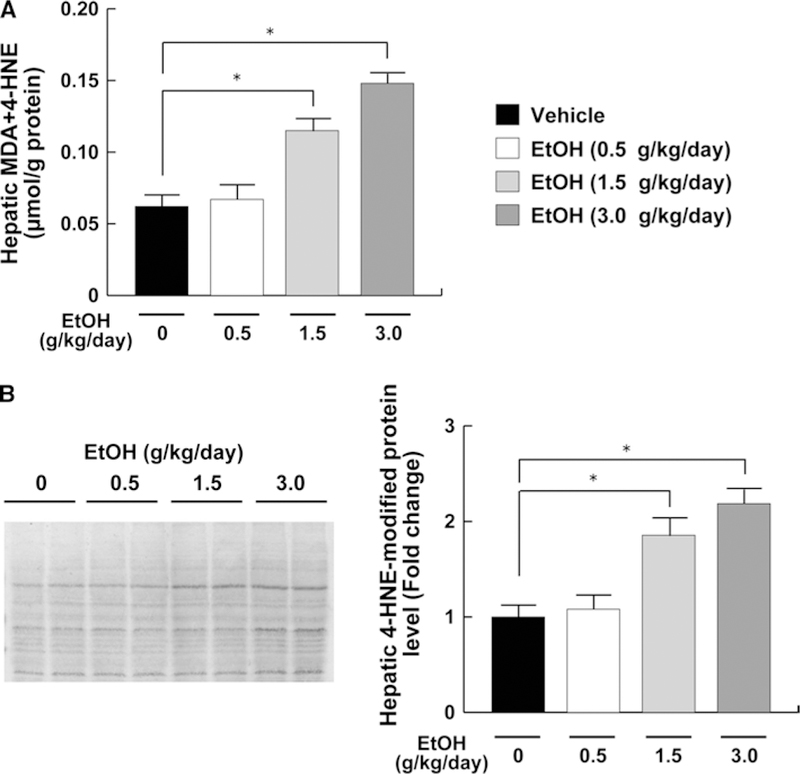
Hepatic oxidative stress in mice receiving ethanol treatment. a Hepatic contents of Lipid peroxides. b Immunoblot analysis of 4-HNE. The same samples in Fig. 5b (50 μg of protein) were used. Band intensities were measured densitometrically, normalized to those of actin, and then normalized to hepatic levels of mice in the vehicle group. The groups and numbers of mice were the same as Fig. 2. *P < 0.05 between the vehicle and indicated ethanol treatment groups
Fig. 8.

Hepatic expression of the NADPH oxidases in mice receiving ethanol treatment. a The mRNA levels of Ncf1 and Cybb. The same samples in Fig. 4 were used. b Immunoblot analysis of NCF1 and CYBB. The same samples in Fig. 5B (50 μg of protein) were used. Band intensities were measured densitometrically, normalized to those of actin, and then normalized to hepatic levels of mice in the vehicle group. The groups and numbers of mice were the same as Fig. 2
Fig. 9.
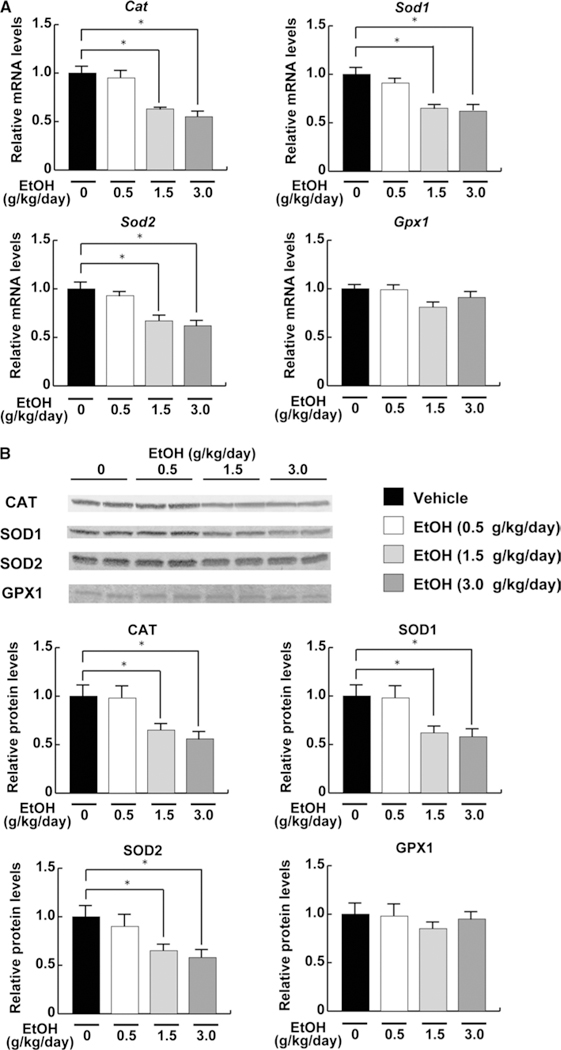
Hepatic expression of the ROS-eliminating enzymes in mice receiving ethanol treatment. a The mRNA levels of Cat, Sod1, Sod2, and Gpx1. The same samples in Fig. 4 were used. b Immunoblot analysis of these enzymes. The same samples in Fig. 5b (50 μg of protein) were used. Band intensities were measured densitometrically, normalized to those of actin, and then normalized to hepatic levels of mice in the vehicle group. The groups and numbers of mice were the same as Fig. 2. *P < 0.05 between the vehicle and indicated ethanol treatment groups
Downregulation of these 3 ROS-scavenging enzymes seemed to be associated with increased hepatic lipid peroxides by the middle- and high-dose ethanol treatment. Overall, these results demonstrated the relationship among increased oxidative stress, suppression of hepatic CST, and decreased serum sulfatide levels by heavy ethanol consumption. Increased serum TF by middle- and high-dose ethanol treatment
Serum concentrations of TF, one of the major pro-coagulant factors, were determined in order to examine the relationship between the changes in sulfatides and thrombosis. Serum TF levels were not changed in the low-dose ethanol group, but were significantly increased in the middle- and high-dose ethanol groups (Fig. 10). Such increases in serum TF were likely related to the decreases in serum sulfatide levels (Fig. 3a). Therefore, these results suggested the association between heavy ethanol consumption, decreases in serum sulfatide levels, and thrombogenicity.
Fig. 10.
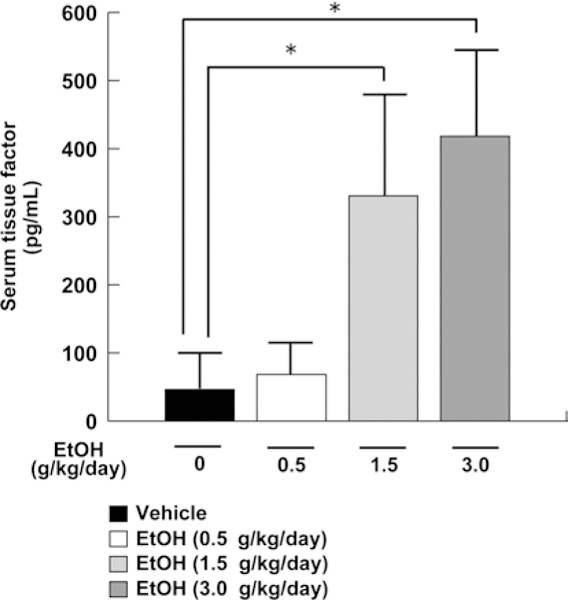
Serum TF levels in mice receiving ethanol treatment. Serum TF levels were measured by ELISA. Data are expressed as mean ± SD. The groups and numbers of mice were the same as in Fig. 2. *P < 0.05 between the vehicle and indicated ethanol treatment groups
Discussion
Sulfatides have anti-thrombotic properties in blood, and the reduction is associated with the occurrence of CVD (Xiaowei et al. 2009). The present study demonstrated that serum/liver sulfatide levels were significantly decreased and serum TF levels were increased in mice with middle- and high-dose ethanol treatment. These changes in sulfatide levels were associated with downregulation of hepatic CST expression, which is one of the key enzymes involved in sulfatide synthesis. This is the first report that heavy ethanol consumption significantly decreases serum/ liver sulfatide levels and increases serum TF in mice. Additionally, low-dose ethanol did not induce these alterations, indicating that the effect of ethanol on sulfatide metabolism is dose-dependent.
We found that the suppression of CST might be associated with increased oxidative stress in the liver. However, the precise mechanism remains unknown. Searching upstream of promoter regions of the mouse Cst gene (Match; http://www.gene-regulation.com/cgi-bin/pub/programs/match/bin/match.cgi) revealed the presence of several anti-oxidant response element-like sequences: –915/–905 (GGTGACTCAGG), –788/–778 (TCTGACGTGGC), and –595/–585 (AGTGACTCGGC) on exon 1a; +33/+43 (AGTGACTCACA) on exon 1d; –1,256/–1,246 (TATGA CGTCTG) and –526/–516 (AGTGACTTCGC) on exon 1f; and –2,523/–2,513 (ACTGACTAAGC), –790/–780 (GGTGACGTGCC), and –361/–351 (GCTGACTCAAC) on exon lg. These sites could be bound by NF-E2-related factor 2 (Motohashi and Yamamoto 2004), Bachl (Dohi et al. 2008), and activating transcription factor 3 (Okamoto et al. 2006), all of which are induced/activated in response to oxidative stress. These transcription factors could directly or indirectly modulate the transcription of Cst. Further studies are necessary to clarify the molecular mechanism for regulating Cst transcription.
SOD converts O2– into hydrogen peroxide, and catalase further catalyzes it to water and oxygen. In this study, increased oxidative stress by middle- and high-dose ethanol loading was associated with reductions in SOD and catalase expression. Such alterations are consistent with results of a previous study demonstrating significant decreases in the activities of SOD and catalase after binge drinking (Carmiel-Haggai et al. 2003). These antioxidant enzymes are known to be prone to inactivation under conditions in which oxidative stress is generated by chronic ethanol exposure. Therefore, ethanol may amplify hepatic oxidative stress and decrease the expression of antioxidant enzymes, which may lead to suppression of hepatic CST expression.
It is well known that obesity and hepatic steatosis can enhance ethanol toxicity to the liver. For example, obese fa/fa Zucker rats are sensitive to liver injury by binge drinking compared with the lean counterparts (Carmiel-Haggai et al. 2003). In this study, body weight and serum lipid profiles were not changed by middle- and high-dose ethanol treatment. Additionally, accumulation of TG and cholesterol in the liver was not noted in mice under chronic ethanol consumption. Therefore, the changes in serum/liver sulfatide levels likely stem from singular effect of ethanol, probably mediated by oxidative stress. Oxidative stress is a crucial contributor to the pathogenesis of several liver diseases, such as ALD (Okiyama et al. 2009), nonalcoholic steatohepatitis (Tanaka et al. 2012), toxicant-induced liver injury (Matsubara et al. 2012), cholestatic disease (Matsubara et al. 2011), and hepatocellular carcinoma (Tanaka et al. 2008a). Evaluating the changes in sulfatides will be important using other disease models.
Another interesting finding in this study is that serum TF was markedly decreased in mice with middle- and highdose ethanol administration. Serum concentrations of TF seemed to be inversely correlated with those of sulfatides (Figs. 3a, 10), suggesting the possible relationship between sulfatides and TF. We found significant decreases in hepatic sulfatide contents after middle- and high-dose ethanol treatment, likely due to the enhancement of oxidative stress. Recently, TF activity was reported to be induced by 4-HNE in human monocytic cells (Vatsyayan et al. 2013). This finding enables us to consider that increased oxidative stress may result in decreases in sulfatides and increases in TF in the liver. Additionally, TF is expressed on the surface of endothelial cells and its expression is suppressed by annexin A5 (Ravassa et al. 2005). Annexin A5 exerts anti-thrombotic properties by interacting with sulfatides and heparin (Cederholm and Frostegård, 2007). Therefore, we can speculate that a reduction in serum sulfatides might weaken the function of annexin A5 to suppress the expression of TF, which may lead to the increases in serum TF concentrations. We are examining the relationship between sulfatides, other coagulation factors, and thrombogenicity in various physiological/pathological conditions.
In this study, intraperitoneal injection was selected instead of oral administration for the purpose of making serum ethanol levels as high as possible and minimizing the production of immunoregulatory cytokines on contact of ethanol with the stomach (Carson and Pruett 1996). This procedure has been used for several previous studies that need to raise serum ethanol concentrations as possible (Vasiliou et al. 2006; Guo and Ren 2010; Guo et al. 2010; Ma et al. 2009; Malcolm and Alkana 1981; Walker et al. 2009). Our preliminary experiment showed that the maximum serum ethanol concentrations after intraperitoneal administration of 3.0 g/kg ethanol were significantly higher than those after oral administration. Recently, Bertola et al. (2013) proposed that 5 % ethanol-containing Lieber-DeCarli diet for 10 days plus a single binge ethanol administration would be very useful for the study of ALD compared with standard long-term feeding. However, blood ethanol levels 2 h after ethanol administration in this 10-day-plus-binge model were approximately 10-fold lower than those in our model (Supplemental Fig. 1, Bertola et al. 2013). We adopted intraperitoneal injection to make closer condition to heavy ethanol consumption as possible in this study, but it may be of interest to examine whether serum sulfatide/TF levels change in other mouse models of heavy ethanol consumption.
We used Sv/129 mice according to the previous studies of acute ethanol toxicity (Vasiliou et al. 2006; Zhou et al. 2003). C57/B6 mice are known to be more sensitive for ALD compared with Sv/129. However, the decreases in serum/liver sulfatides by heavy ethanol consumption were not related to liver pathologies such as steatosis and steatohepatitis, but to oxidative stress. Additionally, hepatic glutathione depletion, an indicator of oxidative stress, was observed after ethanol consumption in both mouse strains (Tsuchiya et al. 2012). Therefore, similar alterations in sulfatides might be seen in C57/B6 mice with high-dose ethanol treatment.
The findings in this study lead us to speculate that serum sulfatide levels may be decreased in heavy drinkers and patients with ALD. Future assays using samples from human patients may uncover the contribution of sulfatides to the pathogenesis of CVD that develops in heavy drinkers.
In conclusion, heavy ethanol consumption reduces serum sulfatide levels by increasing oxidative stress and decreasing the expression of CST in the liver. These findings could provide a mechanism by which chronic heavy ethanol drinking increases the risk of thrombotic events, such as stroke and myocardial infarction.
Supplementary Material
Abbreviations
- ALD
Alcoholic liver disease
- ALT
Alanine aminotransferase
- ApoB
Apolipoprotein B
- ARSA
Arylsulfatase A
- AST
Aspartate aminotransferase
- CAT
Catalase
- CST
Cerebroside sulfotransferase
- CVD
Cardiovascular disease
- CYBB
NADPH oxidase 2
- GALC
Galactosylceramidase
- GAPDH
Glyceraldehyde-3-phosphate dehydrogenase
- GPX
Glutathione peroxidase
- HDL-C
High-density lipoprotein cholesterol
- LDL-C
Low-density lipoprotein cholesterol
- FABP
Fatty acid-binding protein
- HNE
Hydroxynonenal
- LS
Lysosulfatides
- MALDI-TOF MS
Matrix-assisted laser desorption ionization-time-of-flight mass spectrometry
- MDA
Malondialdehyde
- MTTP
Microsomal triglyceride transfer protein
- NCF
Neutrophil cytosolic factor
- PCR
Polymerase chain reaction
- PPAR
Peroxisome proliferator-activated receptor
- ROS
Reactive oxygen species
- SCP2
Sterol carrier protein 2
- SD
Standard deviation
- SOD
Superoxide dismutase
- TF
Tissue factor
- TG
Triglyceride
- UGT
UDP-glucuronosyltransferase
Footnotes
Electronic supplementary material The online version of this article (doi:10.1007/s00204-013-1132-3) contains supplementary material, which is available to authorized users.
Conflict of interest The authors declare that they have no conflicts of interest.
Contributor Information
Hiroki Kanbe, Department of Metabolic Regulation, Institute on Aging and Adaptation, Shinshu University Graduate School of Medicine, 3-1-1 Asahi, Matsumoto 390-8621, Japan; Basic Discovery Research R & D, Kissei Pharmaceutical Co., Ltd., 4365-1 Kashiwabara, Hotaka, Azumino 399-8304, Japan.
Yuji Kamijo, Department of Metabolic Regulation, Institute on Aging and Adaptation, Shinshu University Graduate School of Medicine, 3-1-1 Asahi, Matsumoto 390-8621, Japan; Department of Nephrology, Shinshu University School of Medicine, 3-1-1 Asahi, Matsumoto 390-8621, Japan.
Takero Nakajima, Department of Metabolic Regulation, Institute on Aging and Adaptation, Shinshu University Graduate School of Medicine, 3-1-1 Asahi, Matsumoto 390-8621, Japan.
Naoki Tanaka, Department of Metabolic Regulation, Institute on Aging and Adaptation, Shinshu University Graduate School of Medicine, 3-1-1 Asahi, Matsumoto 390-8621, Japan; Laboratory of Metabolism, National Cancer Institute, National Institutes of Health, Bethesda, MD 20852, USA.
Eiko Sugiyama, Department of Metabolic Regulation, Institute on Aging and Adaptation, Shinshu University Graduate School of Medicine, 3-1-1 Asahi, Matsumoto 390-8621, Japan; Department of Nutritional Science, Nagano Prefectural College, Nagano 380-8525, Japan.
Lixuan Wang, Department of Histology and Embryology, Hebei Medical University, Shijiazhuang 050017, People’s Republic of China.
Zhong-Ze Fang, Laboratory of Metabolism, National Cancer Institute, National Institutes of Health, Bethesda, MD 20852, USA.
Atsushi Hara, Department of Metabolic Regulation, Institute on Aging and Adaptation, Shinshu University Graduate School of Medicine, 3-1-1 Asahi, Matsumoto 390-8621, Japan.
Frank J. Gonzalez, Laboratory of Metabolism, National Cancer Institute, National Institutes of Health, Bethesda, MD 20852, USA
Toshifumi Aoyama, Department of Metabolic Regulation, Institute on Aging and Adaptation, Shinshu University Graduate School of Medicine, 3-1-1 Asahi, Matsumoto 390-8621, Japan.
References
- Aoyama T, Yamano S, Waxman DJ, Lapenson DP, Meyer UA, Fischer V, Tyndale R, Inaba T, Kalow W, Gelboin HV (1989) Cytochrome P-450 hPCN3, a novel cytochrome P-450 IIIA gene product that is differentially expressed in adult human liver. cDNA and deduced amino acid sequence and distinct specificities of cDNA-expressed hPCN1 and hPCN3 for the metabolism of steroid hormones and cyclosporine. J Biol Chem 264:10388–10395 [PubMed] [Google Scholar]
- Aoyama T, Ueno I, Kamijo T, Hashimoto T (1994) Rat very-long-chain acyl-CoA dehydrogenase, a novel mitochondrial acyl-CoA dehydrogenase gene-product, is a rate-limiting enzyme in long- chain fatty-acid beta-oxidation system—cDNA and deduced amino amino-acid-sequence and distinct specificities of the cDNA-expressed protein. J Biol Chem 269:19088–19094 [PubMed] [Google Scholar]
- Aoyama T, Souri M, Ushikubo S, Kamijo T, Yamaguchi S, Kelley RI, Rhead WJ, Uetake K, Tanaka K, Hashimoto T (1995) Purification of human very-long-chain acyl-coenzyme A dehydrogenase and characterization of its deficiency in seven patients. J Clin Invest 95:2465–2473 [DOI] [PMC free article] [PubMed] [Google Scholar]
- Aoyama T, Peters JM, Iritani N, Nakajima T, Furihata K, Hashimoto T, Gonzalez FJ (1998) Altered constitutive expression of fatty acid-metabolizing enzymes in mice lacking the peroxisome proliferator-activated receptor α (PPARα). J Biol Chem 273:5678–5684 [DOI] [PubMed] [Google Scholar]
- Bertola A, Mathews S, Ki SH, Wang H, Gao B (2013) Mouse model of chronic and binge ethanol feeding (the NIAAA model). Nat Protoc 8:627–637 [DOI] [PMC free article] [PubMed] [Google Scholar]
- Brinton EA (2012) Effects of ethanol intake on lipoproteins. Curr Atheroscler Rep 14:108–114 [DOI] [PubMed] [Google Scholar]
- Carmiel-Haggai M, Cederbaum AI, Nieto N (2003) Binge ethanol exposure increases liver injury in obese rats. Gastroenterology 125:1818–1833 [DOI] [PubMed] [Google Scholar]
- Carr TP, Andresen CJ, Rudel LL (1993) Enzymatic determination of triglyceride, free cholesterol, and total cholesterol in tissue lipid extracts. Clin Biochem 26:39–42 [DOI] [PubMed] [Google Scholar]
- Carson EJ, Pruett SB (1996) Development and characterization of a binge drinking model in mice for evaluation of immunological effects of ethanol. Alcohol Clin Exp Res 20:132–138 [DOI] [PubMed] [Google Scholar]
- Cederholm A, Frostegard J (2007) Annexin A5 as a novel player in prevention of atherothrombosis in SLE and in the general population. Ann N Y Acad Sci 1108:96–103 [DOI] [PubMed] [Google Scholar]
- Djoussé L, Gaziano JM (2008) Alcohol consumption and heart failure: a systematic review. Curr Atheroscler Rep 10:117–120 [DOI] [PMC free article] [PubMed] [Google Scholar]
- Dohi Y, Ikura T, Hoshikawa Y, Katoh Y, Ota K, Nakanome A, Muto A, Omura S, Ohta T, Ito A, Yoshida M, Noda T, Igarashi K (2008) Bach1 inhibits oxidative stress-induced cellular senescence by impeding p53 function on chromatin. Nat Struct Mol Biol 15:1246–1254 [DOI] [PubMed] [Google Scholar]
- Furuta S, Hayashi H, Hijikata M, Miyazawa S, Osumi T, Hashimoto T (1986) Complete nucleotide sequence of cDNA and deduced amino acid sequence of rat liver catalase. Proc Natl Acad Sci USA 83:313–317 [DOI] [PMC free article] [PubMed] [Google Scholar]
- Gaziano JM, Gaziano TA, Glynn RJ, Sesso HD, Ajani UA, Stampfer MJ, Manson JE, Hennekens CH, Buring JE (2000) Light-to-moderate alcohol consumption and mortality in the Physicians’ Health Study enrollment cohort. J Am Coll Cardiol 35:96–105 [DOI] [PubMed] [Google Scholar]
- Guo R, Ren J (2010) Alcohol dehydrogenase accentuates ethanol-induced myocardial dysfunction and mitochondrial damage in mice: role of mitochondrial death pathway. PLoS One 5:e8757 [DOI] [PMC free article] [PubMed] [Google Scholar]
- Guo R, Scott GI, Ren J (2010) Involvement of AMPK in alcohol dehydrogenase accentuated myocardial dysfunction following acute ethanol challenge in mice. PLoS One 5:e11268 [DOI] [PMC free article] [PubMed] [Google Scholar]
- Hara A, Radin NS (1978) Lipid extraction of tissues with a low-toxicity solvent. Anal Biochem 90:420–426 [DOI] [PubMed] [Google Scholar]
- Hara A, Taketomi T (1987) Occurrence of sulfatide as a major glycosphingolipid in WHHL rabbit serum lipoproteins. J Biochem 102:83–92 [DOI] [PubMed] [Google Scholar]
- Hara A, Taketomi T (1991) Characterization and changes of glycosphingolipids in the aorta of the Watanabe hereditable hyperlipidemic rabbit. J Biochem 109:904–908 [DOI] [PubMed] [Google Scholar]
- Hara A, Kutsukake Y, Uemura K, Taketomi T (1993) Anticoagulant activity of sulfatide and its anti-thrombotic effect in rabbit. J Bio-chem 113:781–785 [DOI] [PubMed] [Google Scholar]
- Hara A, Uemura K, Taketomi T (1996) Sulfatide prolongs blood-coagulation time and bleeding time by forming a complex with fibrinogen. Glycoconj J 13:187–194 [DOI] [PubMed] [Google Scholar]
- Hu R, Li G, Kamijo Y, Aoyama T, Nakajima T, Inoue T, Node K, Kannagi R, Kyogashima M, Hara A (2007) Serum sulfatides as a novel biomarker for cardiovascular disease in patients with end-stage renal failure. Glycoconj J 24:565–571 [DOI] [PubMed] [Google Scholar]
- Ishizuka I (1997) Chemistry and functional distribution of sulfogly-colipids. Prog Lipid Res 36:245–319 [DOI] [PubMed] [Google Scholar]
- Kloner RA, Rezkalla SH (2007) To drink or not to drink? That is the question. Circulation 116:1306–1317 [DOI] [PubMed] [Google Scholar]
- Kyogashima M (2004) The role of sulfatide in thrombogenesis and haemostasis. Arch Biochem Biophys 426:157–162 [DOI] [PubMed] [Google Scholar]
- Lakshman R, Garige M, Gong M, Leckey L, Varatharajalu R, Zakhari S (2010) Is alcohol beneficial or harmful for cardioprotection? Genes Nutr 5:111–120 [DOI] [PMC free article] [PubMed] [Google Scholar]
- Li G, Hu R, Kamijo Y, Nakajima T, Aoyama T, Inoue T, Node K, Kannagi R, Kyogashima M, Hara A (2007) Establishment of a quantitative, qualitative and high throughput analysis of sulfatides from small amounts of sera by MALDI-TOF MS. Anal Biochem 362:1–7 [DOI] [PubMed] [Google Scholar]
- Lin Y, Kikuchi S, Tamakoshi A, Wakai K, Kawamura T, Iso H, Ogimoto I, Yagyu K, Obata Y, Ishibashi T (2005) Alcohol consumption and mortality among middle-aged and elderly Japanese men and women. Ann Epidemiol 15:590–597 [DOI] [PubMed] [Google Scholar]
- Ma H, Li J, Gao F, Ren J (2009) Aldehyde dehydrogenase 2 ameliorates acute cardiac toxicity of ethanol. J Am Coll Cardiol 54:2187–2196 [DOI] [PubMed] [Google Scholar]
- Malcolm RD, Alkana RL (1981) Temperature dependence of ethanol depression in mice. J Pharmacol Exp Ther 217:770–775 [PubMed] [Google Scholar]
- Matsubara T, Tanaka N, Patterson AD, Cho JY, Krausz KW, Gonzalez FJ (2011) Lithocholic acid disrupts phospholipid and sphin-golipid homeostasis leading to cholestasis in mice. Hepatology 53:1282–1293 [DOI] [PMC free article] [PubMed] [Google Scholar]
- Matsubara T, Tanaka N, Krausz KW, Manna SK, Kang DW, Anderson ER, Luecke H, Patterson AD, Shah YM, Gonzalez FJ (2012) Metabolomics identifies an inflammatory cascade involved in dioxin- and diet-induced steatohepatitis. Cell Metab 16:634–644 [DOI] [PMC free article] [PubMed] [Google Scholar]
- Motohashi H, Yamamoto M (2004) Nrf2-Keap1 defines a physiologically important stress response mechanism. Trends Mol Med 10:549–557 [DOI] [PubMed] [Google Scholar]
- Nakajima T, Kamijo Y, Tanaka N, Sugiyama E, Tanaka E, Kiyosawa K, Fukushima Y, Peters JM, Gonzalez FJ, Aoyama T (2004) Peroxisome proliferator-activated receptor a protects against alcohol-induced liver damage. Hepatology 40:972–980 [DOI] [PubMed] [Google Scholar]
- Okamoto A, Iwamoto Y, Maru Y (2006) Oxidative stress-responsive transcription factor ATF3 potentially mediates diabetic angiopathy. Mol Cell Biol 26:1087–1097 [DOI] [PMC free article] [PubMed] [Google Scholar]
- Okiyama W, Tanaka N, Nakajima T, Tanaka E, Kiyosawa K, Gonzalez FJ, Aoyama T (2009) Polyenephosphatidylcholine prevents alcoholic liver disease in PPARα-null mice through attenuation of increases in oxidative stress. J Hepatol 50:1236–1246 [DOI] [PMC free article] [PubMed] [Google Scholar]
- Paunio M, Virtamo J, Gref CG, Heinonen OP (1996) Serum high density lipoprotein cholesterol, alcohol, and coronary mortality in male smokers. BMJ 312:1200–1203 [DOI] [PMC free article] [PubMed] [Google Scholar]
- Peters JM, Hennuyer N, Staels B, Fruchart JC, Fievet C, Gonzalez FJ, Auwerx J (1997) Alterations in lipoprotein metabolism in peroxisome proliferator-activated receptor alpha-deficient mice. J Biol Chem 272:27307–27312 [DOI] [PubMed] [Google Scholar]
- Ravassa S, Bennaghmouch A, Kenis H, Lindhout T, Hackeng T, Narula J, Hofstra L, Reutelingsperger C (2005) Annexin A5 down-regulates surface expression of tissue factor: a novel mechanism of regulating the membrane receptor repertoire. J Biol Chem 280:6028–6035 [DOI] [PubMed] [Google Scholar]
- Sesso HD (2001) Alcohol and cardiovascular health: recent findings. Am J Cardiovasc Drugs 1:167–172 [DOI] [PubMed] [Google Scholar]
- Sheng X, Nakajima T, Wang L, Zhang X, Kamijo Y, Takahashi K, Tanaka N, Sugiyama E, Kyogashima M, Aoyama T, Hara A (2012) Attenuation of kidney injuries maintains serum sulfatide levels dependent on hepatic synthetic ability: a possible involvement of oxidative stress. Tohoku J Exp Med 227:1–12 [DOI] [PubMed] [Google Scholar]
- Tanaka N, Moriya K, Kiyosawa K, Koike K, Gonzalez FJ, Aoyama T (2008a) PPARα activation is essential for HCV core protein-induced hepatic steatosis and hepatocellular carcinoma in mice. J Clin Invest 118:683–694 [DOI] [PMC free article] [PubMed] [Google Scholar]
- Tanaka N, Moriya K, Kiyosawa K, Koike K, Aoyama T (2008b) Hepatitis C virus core protein induces spontaneous and persistent activation of peroxisome proliferator-activated receptor α in transgenic mice: implications for HCV-associated hepatocarcino-genesis. Int J Cancer 122:124–131 [DOI] [PubMed] [Google Scholar]
- Tanaka N, Sano K, Horiuchi A, Tanaka E, Kiyosawa K, Aoyama T (2008c) Highly purified eicosapentaenoic acid treatment improves nonalcoholic steatohepatitis. J Clin Gastroenterol 42:413–418 [DOI] [PubMed] [Google Scholar]
- Tanaka N, Zhang X, Sugiyama E, Kono H, Horiuchi A, Nakajima T, Kanbe H, Tanaka E, Gonzalez FJ, Aoyama T (2010) Eicosapentaenoic acid improves hepatic steatosis independent of PPARα activation through inhibition of SREBP-1 maturation in mice. Biochem Pharmacol 80:1601–1612 [DOI] [PMC free article] [PubMed] [Google Scholar]
- Tanaka N, Matsubara T, Krausz KW, Patterson AD, Gonzalez FJ (2012) Disruption of phospholipid and bile acid homeostasis in mice with nonalcoholic steatohepatitis. Hepatology 56:118–129 [DOI] [PMC free article] [PubMed] [Google Scholar]
- Tsuchiya M, Ji C, Kosyk O, Shymonyak S, Melnyk S, Kono H, Tryndyak V, Muskhelishvili L, Pogribny IP, Kaplowitz N, Rusyn I (2012) Interstrain differences in liver injury and one-carbon metabolism in alcohol-fed mice. Hepatology 56:130–139 [DOI] [PMC free article] [PubMed] [Google Scholar]
- Vasiliou V, Ziegler TL, Bludeau P, Petersen DR, Gonzalez FJ, Deitrich RA (2006) CYP2E1 and catalase influence ethanol sensitivity in the central nervous system. Pharmacogenet Genomics 16:51–58 [DOI] [PubMed] [Google Scholar]
- Vatsyayan R, Kothari H, Pendurthi UR, Rao LV (2013) 4-Hydroxy-2-nonenal enhances tissue factor activity in human monocytic cells via p38 mitogen-activated protein kinase activation-dependent phosphatidylserine exposure. Arterioscler Thromb Vasc Biol 33:1601–1611 [DOI] [PMC free article] [PubMed] [Google Scholar]
- Walker JE, Odden AR, Jeyaseelan S, Zhang P, Bagby GJ, Nelson S, Happel KI (2009) Ethanol exposure impairs LPS-induced pulmonary LIX expression: alveolar epithelial cell dysfunction as a consequence of acute intoxication. Alcohol Clin Exp Res 33:357–365 [DOI] [PMC free article] [PubMed] [Google Scholar]
- Wang L, Kamijo Y, Matsumoto A, Nakajima T, Higuchi M, Kannagi R, Kyogashima M, Aoyama T, Hara A (2011) Kidney transplantation recovers the reduction level of serum sulfatide in ESRD patient via processes correlated to oxidative stress and platelet count. Glycoconj J 28:125–135 [DOI] [PubMed] [Google Scholar]
- Xiaowei Z, Nakajima T, Kamijo Y, Li G, Hu R, Kannagi R, Kyogashima M, Aoyama T, Hara A (2009) Acute kidney injury induced by protein-overload nephropathy down-regulates gene expression of hepatic cerebroside sulfotransferase in mice, resulting in reduction of liver and serum sulfatides. Biochem Biophys Res Commun 390:1382–1388 [DOI] [PubMed] [Google Scholar]
- Zhou Z, Wang L, Song Z, Lambert JC, McClain CJ, Kang YJ (2003) A critical involvement of oxidative stress in acute alcohol-induced hepatic TNFα production. Am J Pathol 163:1137–1146 [DOI] [PMC free article] [PubMed] [Google Scholar]
Associated Data
This section collects any data citations, data availability statements, or supplementary materials included in this article.


