Abstract
Theoretical equations are developed for typical decompositions of polymers including those in which the volatilization does not follow a simple “reaction order” and those made up of a composite of several reactions of differing energies of activation. The effects of order, activation energy, heating rate and temperature dependence upon the calculated thermograms is illustrated. The literature on thermogravimetric kinetics is critically reviewed and coalesced into a logical and coherent development stressing the interrelation of methods and employing a consistent system of notation. As a result, a number of improved methods and new methods for the analysis of kinetic data applicable to the complex systems mentioned above are developed. It is concluded that methods involving a variable rate of heating or involving several thermogravimetric traces at different rates of heating are capable of establishing the uniqueness of kinetic parameters. A new method of determining initial parameters from rate-conversion data is developed. A novel concept is employed of programming reaction variables (in this case, the heating rate) in a manner which greatly simplifies the mathematics of the kinetic system and which shows promise of a wide range of applicability in the area of rate processes.
Keywords: Degradation, nonisothermal kinetics, polymers, pyrolysis, thermal decomposition, thermogravimetry, thermolysis, stability of polymers
1. Introduction
Thermogravimetric analysis is used widely as a method to investigate the thermal decomposition of polymers and to assess their relative thermal stabilities [1,2,3,4].l Also, considerable attention has been directed recently toward the exploitation of thermogravimetric data for the determination of kinetic parameters. A number of these methods will be discussed later in this paper.
Many of the methods of kinetic analysis which have been proposed are based on the hypothesis that, from a single thermogravimetric trace, meaningful values may be obtained for parameters such as activation energy, preexponential factor and reaction order.
Thus, many of these methods make two assumptions, viz, these parameters are useful in characterizing a particular polymer degradation, and that the thermogram for each particular set of these parameters is unique.
Therefore, in this paper, we will test the validity of these assumptions by setting up several idealized typical cases of polymer degradation kinetics, observing how the structures of the calculated thermograms are affected by changes in order, activation energy, heating rate and temperature dependence, and determining by means of a critical evaluation of both existing and new methods if there are any general treatments of these data that will permit the determination of parameters that may be useful in the interpretation of degradation mechanisms.
2. Theory
We shall assume for the present that the isothermal rate of conversion, dC/dt, is a linear function of a single temperature-dependent rate constant, k, and some temperature-independent function of the conversion, C, i.e.,
| (1) |
C, the conversion (degree of completion or advancement, extent of reaction), is defined here as the conversion with respect to initial material. Thus C = 1 − (W/W0), where W0 is the initial weight and W is the weight at any time. Therefore, the residual fraction (1 − C = W/W0 and the rate of conversion, dC/dt = − 1/W0 (dW/dt).
Some investigators prefer to define an instantaneous rate of conversion such that dC′/dt = 1/W (dW/dt) and thence C′ is proportional to the logarithm of the residual fraction. However, unless perhaps dealing specifically with first order reaction kinetics, there seems to be little special appeal for this latter definition of conversion.
When the polymer does not completely volatilize at T or t → ∞, or if the volatilization takes place in steps, the conversion may for convenience, or depending upon one’s insight into mechanism, be defined differently based on the total weight loss between two successive horizontal portions of an integral thermogram. Equation (1) excludes composite cases where simultaneous or successive reactions involve several temperature dependent rate constants. Several of these cases will be considered later.
At a constant rate of heating, β = dT/dt, and assuming k independent of C and f(C) independent of T, the variables in eq (1) may be separated and integrated to obtain:
| (2) |
where F(C) is the integrated function of conversion and Φ represents the temperature integral.
In analogy to simple cases in homogeneous reaction kinetics, we express the conversion function by
| (3) |
where n is denned as the order or reaction, n + 1 is the normalization factor for the isothermal cases such that . n is equal in value to n and included only in the calculated curves so that they will exhibit maximum thermogravimetric rates at approximately the same temperature.
Substituting eq (3) into eq (1) and integrating, one obtains
| (4) |
(− kt, if T = const.; − Φ, if T ≠ const.).
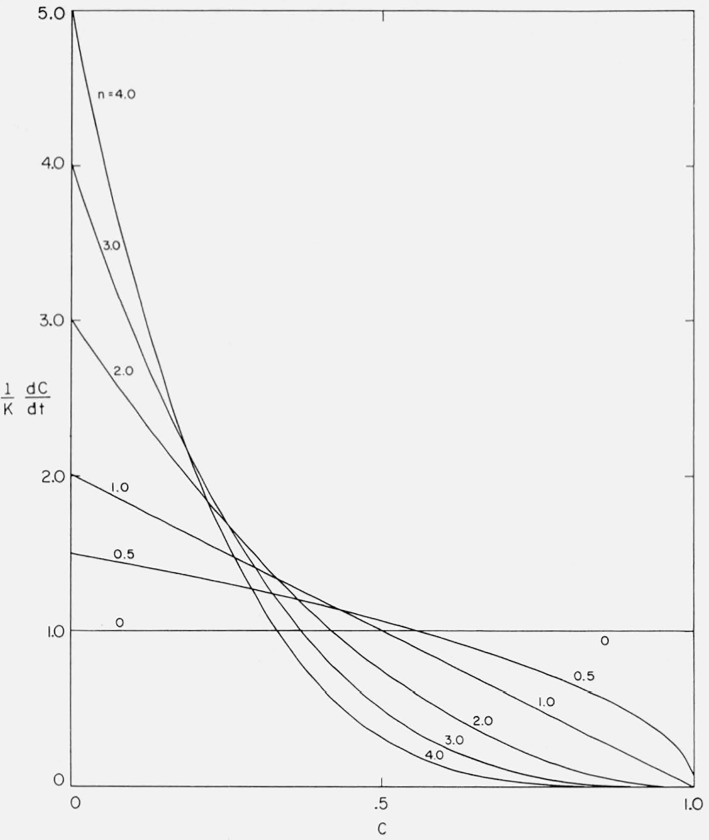
The normalized isothermal curves from eq (4) for rate versus conversion are plotted in figure 1. Some of these curves indeed do approximate ones obtained in polymer degradation studies. For example, if the depolymerization is initiated at chain ends and the zip length of the depropagation reaction is much shorter than the polymer chain length, as is the case in high molecular weight polymethyl methacrylate, then a large portion of the reaction follows zero order kinetics [5]. If the zip length is much larger than the polymer chain length, first order kinetics results [5]. Other cases of degradation kinetics, such as is found for branched polyolefins, may be fitted over a range of conversion by higher order curves [5].
Figure 1.
Effect of order on normalized isothermal rate versus degree of conversion.
However, in a large number of polymer decompositions, the isothermal rate of conversion goes through a maximum value. Such behavior describes a wide spectrum of polymers [5].
Random depolymerization, where most of the early scissions result in fragments too large to distill off, produces an isothermal rate curve with a maximum at 26 percent conversion.
For random depolymerization [6],
| (5) |
where N − 1 is the initial number of carbon atoms in the chain skeleton, L is the number of carbon atoms in the smallest chain that does not evaporate, and α, the fraction of bonds broken.
Differentiating eq (5) with respect to kt,
| (6) |
and eliminating α from eqs (5) and (6) for the simplest case, N ≫ L, L = 2, result in
for the normalized isothermal equation. In formulating the above approximation (Case A), the term for the initial isothermal rate, [L(L + 1)]/N has been assumed equal to zero since in practice N ≫L. Hence the expression goes to zero at C = 0 and is not applicable to initial situations. The solution of eq (5) for a involves an Lth order polynomial so that it is not practicable to obtain f(C) in analytic form for large L. Also, maximum rates are never obtained at greater than 26 percent conversion from random depolymerization. Therefore, an empirical cubic equation was devised to fit several cases found in isothermal degradation kinetics.
For the equation
| (7) |
the following boundary conditions:
are satisfied when
For Case B, we assume the maximum rate at 50 percent conversion and a maximum rate three times the initial rate, (ω = 0.5, γ = 3) and obtain,
For Case C, (ω = 0.25, γ = 3), eq (7) has a minimum as well as a maximum in the range C = 0 to 1. However, Case C was fitted satisfactorily by reduction of the order of eq (7) which gave after normalization,
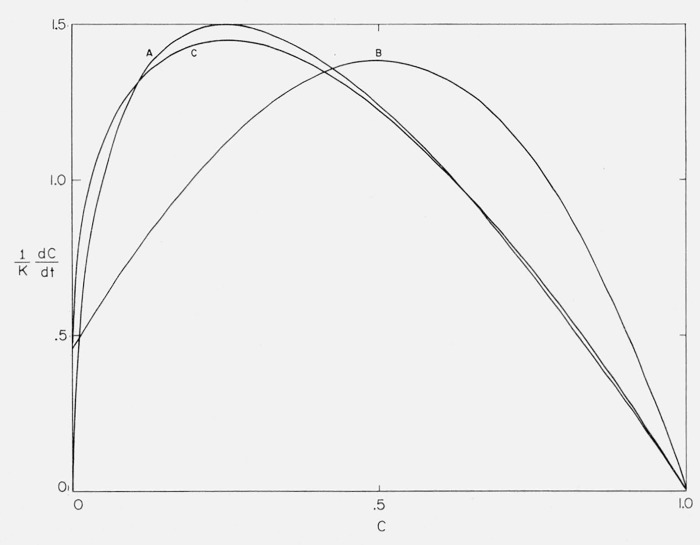
The normalized isothermal rates for Cases A, B, and C are plotted against conversion in figure 2.
Figure 2.
Normalized isothermal rate versus degree of conversion, Cases A, B, and C.
Curves A and C closely resemble theoretical curves for pure random depolymerization or for depolymerizations of moderate zip length involving considerable molecular transfer. Case B is representative of depolymerizations in which the initiation occurs at chain ends, the zip length is moderate and either a slight amount of transfer or random initiation take place. Such curves are characterized by a maximum in the 50 percent conversion region [7].
The equation for Case A may be substituted into eq (1) and integrated and if the solutions of the cubic in the equations for Cases B and C are expressed as partial fractions, substituted into eq (1) and integrated, one obtains:
for Case A,
for Case B,
and for Case C,
(− kt, if T = constant; − Φ, if T ≠ constant).
The Arrhenius equation,
| (8) |
is almost universally assumed for the temperature dependence of k, where A, the “preexponential factor,” is usually assumed to be independent of temperature, E is the energy of activation, and R, the gas constant = 1.987 cal mol−1 (°K)−1 (1 cal = 4.1840 J).
Substituting eq (15) into eq (1), one obtains
| (9) |
which upon integration becomes
| (10) |
where x = (− E/RT). It is assumed that T0 is low enough for the lower limit to be negligible. If f(C) is given by eq (3) then eq (9) becomes,
| (11) |
which, upon integration becomes,
| (12) |
p(x), which includes the exponential integral, has been tabulated for limited ranges [8–11]. There are several series expansions and a semiempirical approximation for p(x). These are given below as they are utilized in many of the kinetic methods which will be discussed later.
2.1. Asymptotic Expansion [12]
| (13a) |
2.2. Expansion in Series of Bernoulli Numbers [12]
| (13b) |
2.3. Schlömilch Expansion [13]
| (13c) |
2.4. Doyle’s Approximation [14]
| (13d) |
Doyle [15] has found that two and three term approximations for eq (13c) are more accurate than the respective approximation for eq (13a). Equation (13b) is almost equivalent to eq (13a) for the first several terms.
At the limits, −20 ≥ x ≥ −60, eq (13d) is accurate within ±3 percent [11].
An extensive table of log p(x) for various x’s was calculated from eq (13b) as this equation gives quite accurate values even for small x. This table was used for the calculation of the thermograms presented subsequently.
If the preexponential factor, A, is linearly dependent on temperature, i.e., A = A1T
| (14) |
then,
| (15) |
where,
| (16) |
A table of log p1(x) values was composed to investigate the effect of temperature dependence.
Vallet [9] has derived expressions for A = A2Tl/2, k = A2T½e(−E/RT) and recursion formulas for calculating the above three cases of temperature dependence.
3. Calculated Thermogravimetric Curves
Integral thermograms were obtained by calculating Φ and T at various x and substituting Φ into eq (17).
| (17) |
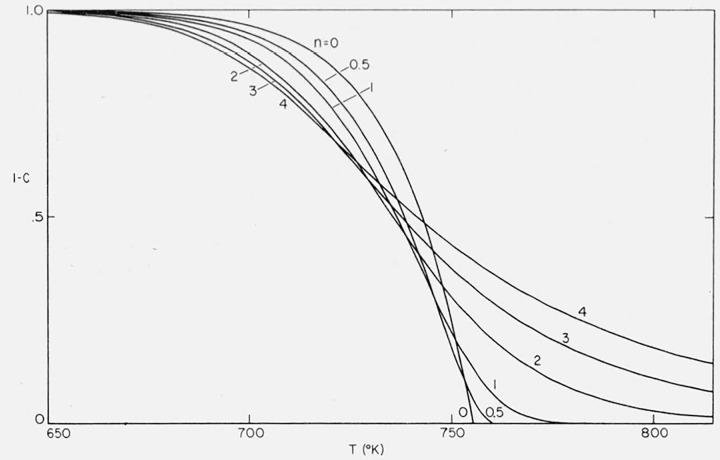
Figure 3 contains curves for the residual fraction, 1 − C, versus temperature for various orders from 0 to 4 for the case A/β = 1016/°K, E = 60,000 cal/mol.
Figure 3.
Effect of order on residual fraction versus temperature.
n = 0, 0.5, 1.0, 2.0, 3.0, and 4.0;
A/β = 1016/°K; E = 60,000 cal/mol.
The differential thermograms corresponding to the integral curves in figure 3 were obtained by substitution of values of Φ at various T into
| (18) |
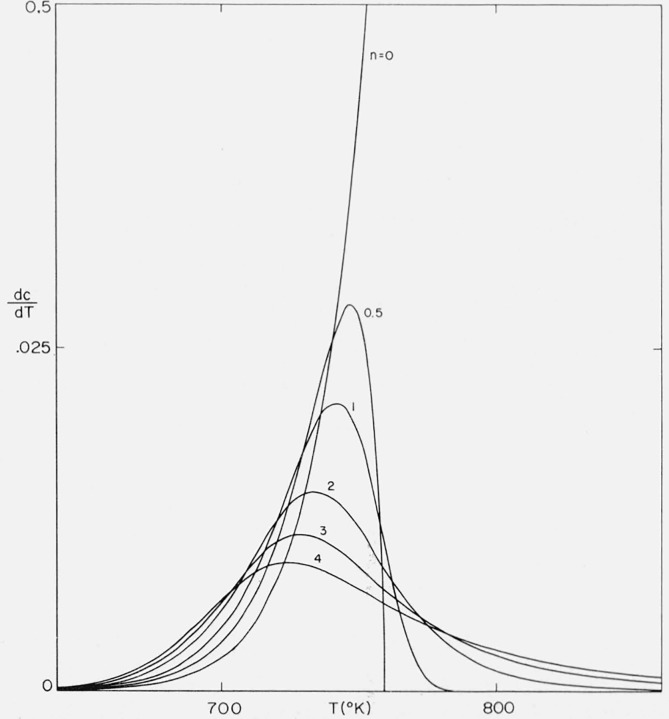
These thermogravimetric rate versus temperature curves are contained in figure 4.
Figure 4.
Effect of order on thermogravimetric rate versus temperature.
n = 0, 0.5, 1.0. 2.0, 3.0, and 4.0;
A/β = 1016/°K; E = 60,000 cal/mol.
Zero and negative orders exhibit ever accelerating rates. Curves for orders between zero and unity go through a maximum rate and, in the idealized case, reach completion at a finite temperature. For curves with n ≥ 1, increasing order results in a more gradual slope and a more gradual asymptotic approach to the abscissa.
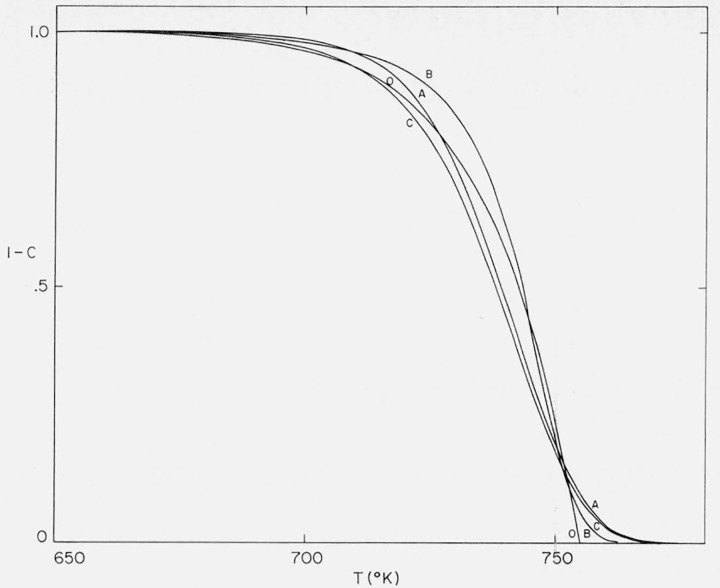
Integral thermograms for the “maximum” Cases A, B, and C were obtained for the same values of A/β and E by calculating Φ at various values of C from the integrated equations for the three cases. The corresponding x and T values were obtained from Φ. Residual fraction versus temperature curves for these cases are contained in figure 5. The early negative-order character of these curves manifests itself by a more precipitous slope than for the zero order curve at the same activation energy.
Figure 5.
Residual fraction versus temperature for Cases A, B, and C.
A/β = 1016/°K; E = 60,000 cal/mol.
The corresponding differential thermograms for Cases A, B, and C were obtained by direct substitution of C and the corresponding T values from the integral calculations into eq (9).
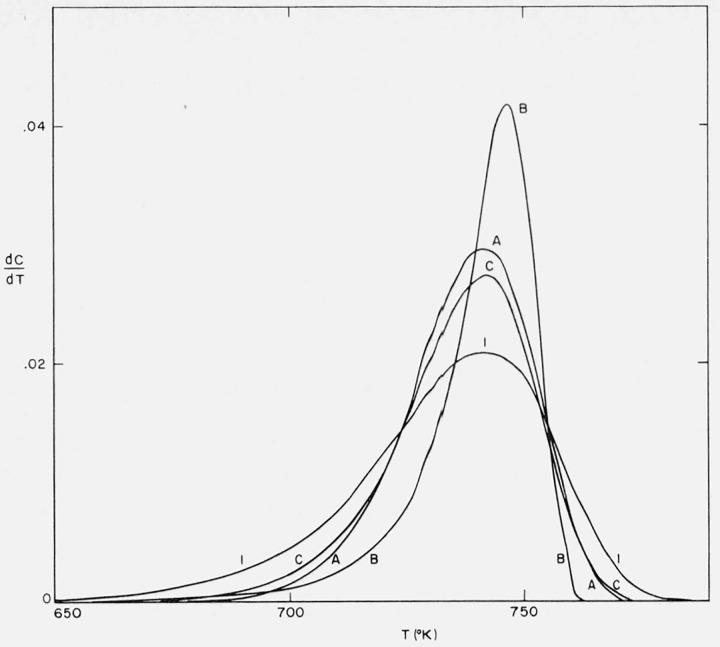
The thermogravimetric rate is plotted against temperature for these cases and the same values of A/β and E in figure 6. The first order curve is included for comparison.
Figure 6.
Thermogravimetric rate versus temperature for Cases A, B, and C.
A/β = 1016/°K; E = 60,000 cal/mol.
The minor detail of the differences among Cases A, B, and C is not significant as these curves are based on asymptotic or semiempirical equations. The slope is greatest in Case B where the maximum isothermal rate is at 50 percent conversion. As γ (maximum rate/initial rate) approaches unity, the curves would more nearly resemble zero order with a tail.
3.1. Thermogravimetric Rate Versus Conversion Curves
The previous figures (figs. 3–6) of residual fraction or thermogravimetric rate versus temperature have been the traditional methods of representing thermogravimetric data. It is surprising that plots of the rate as a function of degree of conversion (dC/dT versus C) have not been utilized as similar presentation has been found to be quite informative in isothermal studies, e.g., figure 1.
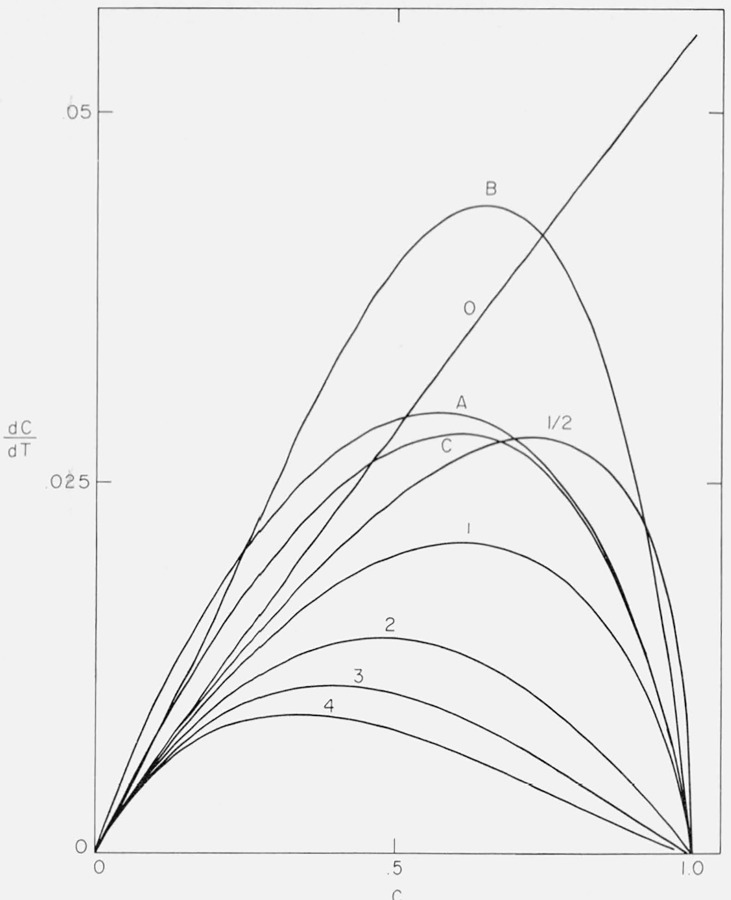
Figure 7 exhibits the thermogravimetric rate as a function of conversion for zero through fourth order and Cases A, B, and C for A/β = 1016/°K and E = 60,000 cal/mol.
Figure 7.
Thermogravimetric rate versus degree of conversion.
n = 0, 0.5, 1.0, 2.0, 3.0, and 4.0
Cases A, B, and C
A/β = 1016/°K; E = 60,000 cal/mol.
The zero order curve is almost linear while higher order curves go through a maximum rate as C → 1. They approach the zero order curve as C → 0. Curves B and C also approach the zero order curve asymptotically at low conversion but deviate in the direction of negative order. Curve A is anomalous at C → 0 as was mentioned previously.
A better insight into the behavior of the curves in figure 7 may be obtained by differentiating eq (9) with respect to conversion to obtain
| (19) |
where f′(C) is the derivative of f(C) with respect to C. If f(C) is given by eq (3), then similar differentiation of eq (11) gives
| (20) |
Thus the slope of the zero order curve will be given by E/RT2. At ordinary activation energies, the absolute temperature is a slowly changing variable over the reaction temperature range so the slope will be essentially a constant. The thermogravimetric rate is quite small at low conversion so all other cases approach the zero order case as C → 0, subject to the condition, f(C = 0) ≠ 0.
Thus, one may obtain a qualitative understanding of the early kinetics from the limiting characteristics of dC/dt versus C. If the curve is initially concave, a negative order character, i.e., an initially increasing isothermal rate as in Cases B and C is indicated. Initial convexity suggests positive order behavior, while approximate linearity connotes kinetics not far removed from zero order. Indeed such a plot may be of great practicable applicability, e.g., to test whether an apparent maximum rate in an isothermal curve is due to an initial temperature lag or an actual initial increase in rate.
3.2. Effects of Activation Energy
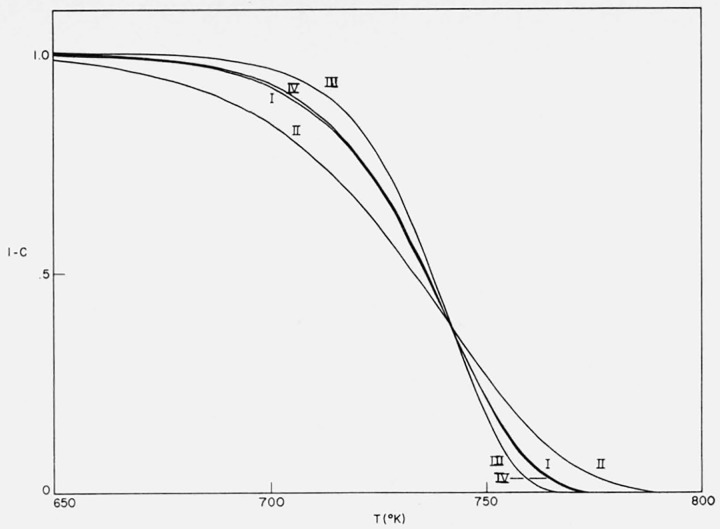
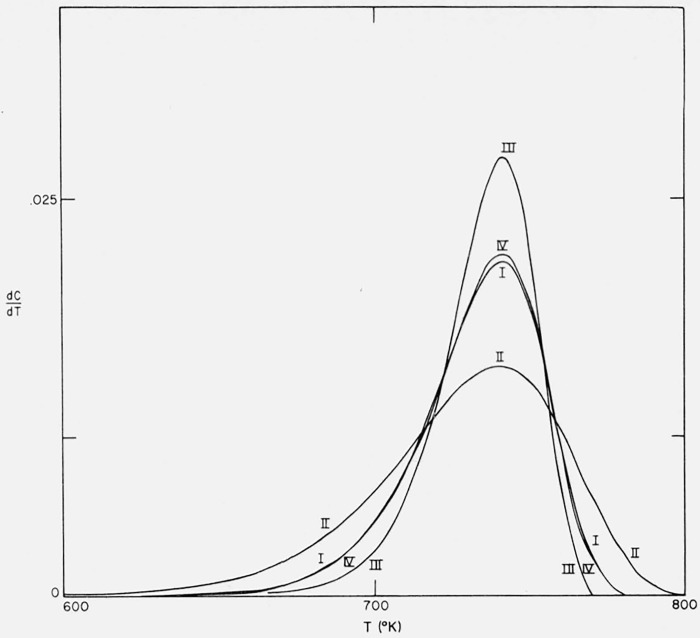
The effect of change in energy of activation upon the character and shape of the thermograms was investigated by considering three cases of first order kinetics–I, E = 60,000 cal/mol, II, E = 40,000 cal/mol, and III, E = 80,000 cal/mol. The parameters A/β were adjusted so that the maximum slopes occur at the same temperature in each case. The integral curves are plotted in figure 8 and the corresponding differential curves in figure 9.
Figure 8.
Effects of activation energy and preexponential temperature dependence on residual fraction versus temperature.
n = 1
I E = 60,000 cal/mol; A/β = 1016/°K
II E = 40,000 cal/mol; A/β = 9.675 × 10⁹/°K
III E = 80,000 cal/mol; A/β = 9.318 × 10²¹/°K
IV E = 60,000 cal/mol; A/β = 1.374 × 10¹³/°K; A(T).
Figure 9.
Effects of activation energy and preexponential temperature dependence on thermogravimetric rate versus temperature.
n = 1
I E = 60,000 cal/mol; A/β = 1016/°K
II E = 40,000 cal/mol; A/β = 9.675 × 10⁹/°K
III E = 80,000 cal/mol; A/β = 9.318 × 10²¹/°K
IV E = 60,000 cal/mol; A/β = 1.374 × 10¹³/°K; A(T).
The maximum slope increases linearly with increasing energy of activation since, from eq (20), at the maximum
| (21) |
Other relationships at the maximum will be discussed in the section on differential methods.
3.3. Effect of a Temperature Dependence of the Preexponential Factor
A slight temperature dependence of the preexponential factor is sometimes noted in isothermal studies. Indeed, according to collision theory, A is proportional to T½ for a bimolecular gas phase reaction and, according to transition state theory, the preexponential factor contains temperature to the first power.
Since in both isothermal and thermogravimetric cases usually the same analytic process is involved in activation energy determination, i.e., the logarithm of some function of a rate is plotted against 1/T(°K), any error resulting from ignoring temperature dependence in the determination of E should be about the same in both cases. If A is linearly dependent on temperature, the differentiation of the logarithm of eq (14) with respect to 1/T results in
| (22) |
Thus, at T = 500 °K, the correction for linear temperature dependence of A on the experimentally obtained activation energy will be about 1 kcal/mol.
In order to observe the effect of linear temperature dependence of the preexponential factor on the shape of a thermogram, Case IV, E = 60,000 cal/mol, A1/β = 1.374 × 10¹³ (°K)−2, was calculated for various orders using p1(x) values obtained from eq (16). The integral and differential curves for first order kinetics may be compared with Case I, E = 60,000 cal/mol, A/β = 1016 (°K)−1 in figures 8 and 9. The difference is trivial for these conditons. The effect is in the direction of increased slope and is greater for higher orders. It will be significant only at very low activation energies.
If a single Arrhenius expression is applied to situations involving simultaneous reactions, the parameters E and A well may exhibit temperature dependence. This aspect is discussed in the section on composite cases.
3.4. Effect of Rate of Heating
Analyses of the changes in thermogravimetric data brought about by variation of the rate of heating, β, are the basis for the most powerful methods for the determination of kinetic parameters and these methods are discussed in subsequent sections.
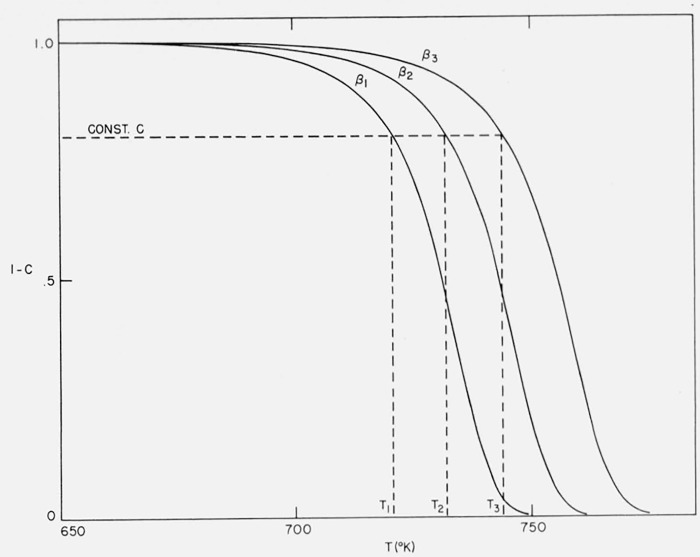
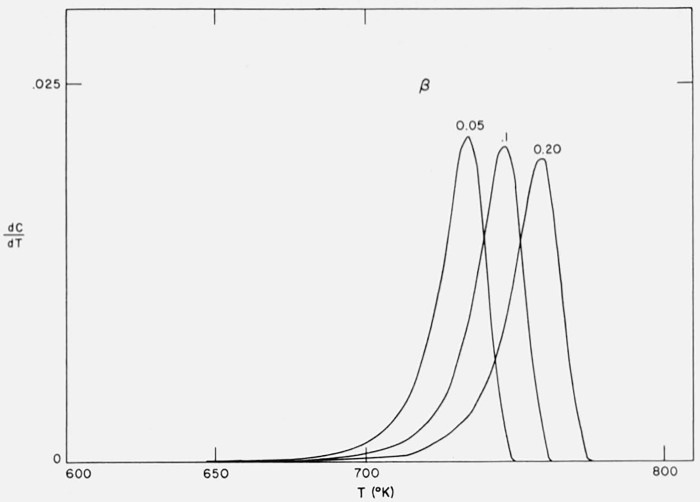
Figure 10 contains the integral curves for Case B with maximum isothermal rate at 50 percent completion for A/β2 = 1016/°K, E = 60,000 cal/mol and heating rates of β1 = 0.05, β2 = 0.10, and β3 = 0.20 °K/sec. Figure 11 contains the thermogravimetric rate curves for the same case and conditions. Not only are the curves shifted to higher temperatures by increased heating rates but they become less steep.
Figure 10.
Effect of heating rate on residual fraction versus temperature.
Case B: A = 1015/sec, E = 60,000 cal/mol, β1 = 0.05, β2 = 0.10, β3 = 0.20 °K/sec.
Figure 11.
Effect of heating rate on thermogravimetric rate versus temperature.
Case B: A = 1015/sec, E = 60,000 cal/mol, β1 = 0.05, β2 = 0.10, β3 = 0.20 °K/sec.
3.5. Composite Cases
The majority of experimental thermograms found in literature represent cases in which two or more volatilization reactions take place. If the values for the kinetic parameters, e.g., E and A, for each reaction are such that the regions of weight loss occur at separated temperature ranges then a stepwise thermogravimetric trace results. In these cases, each curve between successive horizontal portions may be treated separately. However, many cases are more complex. An example is a polymer which undergoes both depolymerization and side group splitting or ring formation, followed by depolymerization of the thermally more stable product polymer.
Here we investigate only two simple cases:
(1) Two Independent First Order Reactions
If a fraction of the material, a, volatilizes by a first order reaction with Arrhenius parameters A1 and E1, and the remainder of the material volatilizes by an independent first order reaction with parameters A2 and E2, the residual fraction will be given by
| (23) |
(2) Two Competitive First Order Reactions
If the total material may be volatilized by two alternative paths, each having a rate proportional to the first power of all remaining volatilizable material and if the respective Arrhenius parameters are A1 and E1 and A2 and E2 for the two paths, then the residual fraction will be
| (24) |
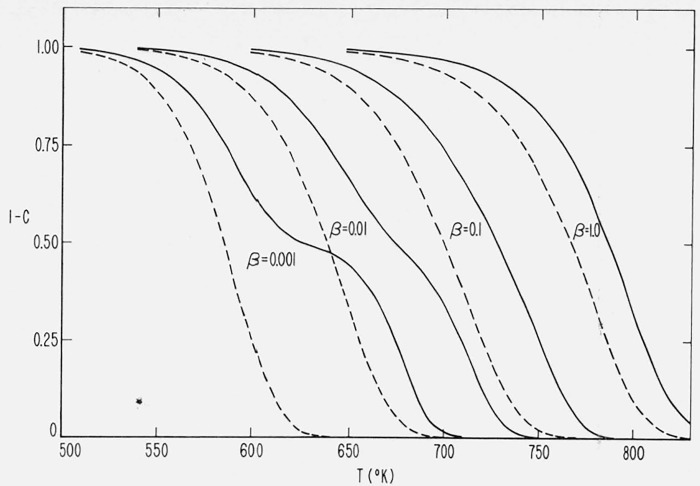
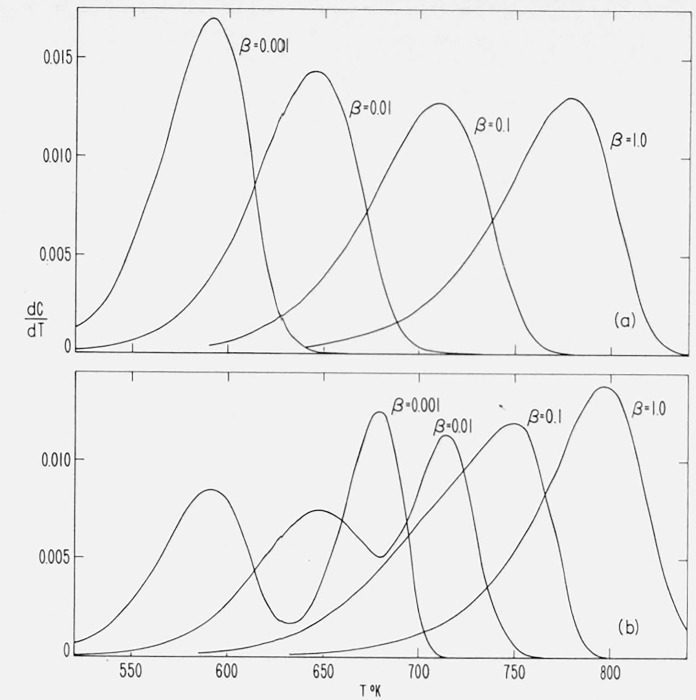
To observe the effect of variation of heating rate in these composite cases, integral and differential curves were calculated for a = 0.5, E1 = 30,000 cal/mol, E2 = 60,000 cal/mol, A2 = 1015/sec and A1 = 4.458 × 10⁶/sec for heating rates of 1.0, 0.1, and 0.01, and 0.001 °K/sec. The value of A1 was selected so that for Case (1) at β = 0.1 °K/sec and C = 0.5, the first reaction contributes 75 percent to 1−C and the second reaction, the remaining 25 percent.
The integral curves are shown in figure 12 and the differential curves in figures 13a and 13b
Figure 12.
Effect of heating rate on residual fraction versus temperature for composite cases.
E, = 30,000 cal/mol; A1 = 4.458 × 10⁶/sec
E2 = 60,000 cal/mol; A2 = 1015/sec
β = 0.001, 0.01, 0.1 and 1.0 °K/sec
_____________Case (1), independent first order reactions
_ _ _ _ _ _ _ _ _Case (2), competitive first order reactions.
Figure 13.
Effect of rate of heating on the thermogravimetric rate versus temperature for composite cases.
E1, E2, A1 and A2 as in figure 12
(a) Case (2) competitive first order reactions
(b) Case (1) independent first order reactions.
for the two cases.
Such a thousand-fold variation in heating rate is not easily realizable experimentally, but was used in these theoretical calculations to illustrate as wide a variety of situations as possible.
It is immediately apparent from inspection of figures 12 and 13 and eqs (23) and (24) that for these cases of two first order reactions with widely differing activation energies, the thermograms for Cases (1) and (2) exhibit quite different variations in structure upon changing the heating rate.
Case (1), (independent reactions), at the highest heating rate (and temperature), (β = 1.0), gives the appearance of one simple thermogram as the two reactions broadly overlap one another. As the heating rate is lowered, (β = 0.1), the curve tends to flatten as the two reactions begin to separate. The decrease in the value of the thermogravimetric rate at the maximum with decreasing β is the opposite of simple reactions as seen in figure 11.
At β = 0.01, the two reactions separate further and two peaks are obtained on the differential curve. It may be noted that at these conditions the “maximum” temperature for the higher activation energy reaction has been shifted five degrees by the perturbing influence of the low energy reaction.
By β = 0.001, the low energy reaction, favored at the lower temperature, is almost completely separated from the high energy reaction.
On the other hand, in Case (2) (competitive reactions), for the values of parameters considered, the low activation energy reaction takes over almost completely at low temperature and heating rates (β = 0.001 and β = 0.01). At the high heating rate, (β = 1.0), the low activation energy reaction dominates only during the first 30 percent of weight loss, with the high energy reaction considerably modifying the latter portion of the thermogram. Again, the inclusion of the high energy reaction causes a temporary increase in (dC/dT)max with increasing β. In simple reactions the maximum rate decreases upon increasing β and Tmax, [see eq (21)].
Two competitive first order reactions with equal activation energies (E1=E2) appear as a simple first order reaction no matter how great the difference in preexponential factors. This is true of any set of competitive reactions of the same order. If they are of differing order, then they are, in theory, resolvable.
The differentiation between two independent first order reactions with the same activation energies depends upon how greatly A1/A2 deviates from unity. The resolution is relatively unaffected by changing the rate of heating.
Thus, the technique of varying the rate of heating in composite cases not only often permits a separation of reactions but often gives information as to the nature of the competition between reactions. This aspect is discussed further in succeeding sections on methods of kinetic analysis.
The application of more complex empirical substitutes for the Arrhenius equation to experimental data involving composite reactions has been discussed by Farmer [16].
4. Critical Survey of Methods of Kinetic Analysis
The methods of kinetic analysis of thermogravimetric data are divided into five categories to facilitate discussion and comparison. These are – (a) “Integral” methods utilizing weight loss versus temperature data directly, (b) “Differential” methods utilizing the rate of weight loss, (c) “Difference-Differential” methods involving differences in rate, (d) Methods specially applicable to initial rates, and (e) Nonlinear or cyclic heating rate methods.
4.1. Integral Methods
The fundamental criticism of integral methods as applied to a single thermogravimetric trace is that “best values” of A, E, and n are inevitably fitted to the data whether or not these parameters have any significance or even utility in the understanding of mechanism. Also to obtain the activation energy the order must be known or vice versa. This latter problem has been met with varying success in several ways.
As many of these methods involve an approximate integration of the exponential integral, they will be compared to eqs (13a, b, c, d) when applicable.
The first serious theoretical treatment of thermogravimetric data was by van Krevelen et al., [17]. These authors approximated the exponential integral by making the substitution
| (25) |
where Tmax is the temperature at the maximum thermogravimetric rate. Thus, they obtained for eq (4) in logarithmic form
| (26) |
and tested for linearity of In T for various values of n. Reactions are insensitive to order at low conversion so in order to obtain n from this or similar methods linearity must be established at high conversion. However, linear plots over much of the conversion range were obtained from eq (26), n = 1, for Cases B and C with maximum isothermal rates. Thus, the method should be limited to cases in which a known isothermal order is followed.
Baur et al. [18], in 1955 applied a graphical solution of the exponential integral to the case of a linearly temperature dependent preexponential factor (eq (15)) for data on the high pressure oxidation of metals and obtained good agreement between experimental values and theoretical values based on a parabolic rate law. Smith and Arnoff [8] in 1958 calculated a table of p(x) values for x = 1 to 50 and used it to fit data on the thermodesorption of gases from solids to first and second order kinetics by a method of trial and error.
Doyle [10], in 1961, presented the most formal method for the precise curve fitting of a single thermogram using calculated tables of log p(x). However, as in other such methods, its applicability is limited to cases of known isothermal order. As the method is quite tedious, Doyle devised an approximate method based on the first two terms of the asymptotic expansion (eq (13a)).
| (27) |
For cases of unknown order, Doyle [10] suggests making calculations as early in the reaction as experimental accuracy allows. However, even using C = 0.05, one obtains appreciable errors in the determined activation energy when this method is applied to maximum Cases A, B, and C. Nevertheless, such integral curve fitting of a single trace is more generally applicable than similar differential methods.
Farmer [16] defines the relative error using the two term asymptotic approximation as
| (28) |
This relative error, r2, and r3, the relative error in using three terms of the asymptotic approximation, are shown for several values of x in table 1.
Table 1.
Relative errors for two- and three-term asymptotic approximations of p(x)a as a function of x = (−E/RT) [15, 16]
| −x | |||||
|---|---|---|---|---|---|
| 10 | 20 | 30 | 40 | 50 | |
| r2 | 0.844 | 0.913 | 0.939 | 0.954 | 0.962 |
| r3 | 1.055 | 1.014 | 1.006 | 1.004 | 1.002 |
a
Farmer [16] substituted eqs (27) and (28) into eq (10) to obtain in logarithmic form
| (29) |
or
where r2 is a slowly changing function of temperature. The second expression was found to be sensitive to data point deviation.
As r3/r2 = 1 + 2/x = 1− (2RT/E), if the first three terms of the asymptotic approximation are utilized and if f(C) is given by eq (3) then
| (30) |
which was developed by Coats and Redfern [2, 19]. A plot of log F(C)/T2 versus 1/T appears to give quite satisfactory results when the kinetics follow a simple order. However, as with previous methods, application to systems of “changing order,” e.g., maximum Case B, results in erroneous values for E.
As Doyle has done, Coats and Redfern [20] have gone to low conversion data to get around the problem of determining order.
Assuming all reactions behave as zero order as C → 0, they obtain from eq (30)
| (31) |
and a plot of log C/T2 versus 1/T for low C or n ≅ 0 should give a straight line with slope of − E/4.6 as log AR/βE[1 − 2RT/E] is again sensibly constant. It is doubtful that this approximation may be generally used up to C = 0.3 as is suggested as for at n = 2, the error in F(C) amounts to 40 percent at C = 0.3.
Horowitz and Metzger [21] simplify the exponential integral with an approximation similar to but simpler than van Krevelen et al., i.e., defining a characteristic temperature, θ, such that θ = T −TS where TS is a reference temperature at which 1 − C = l/e. Then making the approximation
| (32) |
they finally obtain for n = 1,
| (33) |
so that a plot of ln ln(l − C) versus θ should give linearity with a slope of .
For cases in which n ≠ l, more complicated expressions are suggested [21] involving derivative parameters and TS is defined as the temperature at the inflection point.
One may obtain from eq (12) using eq (13d) for log p(x) and making the approximation of eq (32)
| (34) |
which gives the same slope as eq (33). However, eq (34) does not include the condition that TS is the temperature at which 1 − C = 1/e.
Thus, eq (34) suggests the generalization of Horowitz and Metzer’s method to the case where n ≠ 1 and TS is any reference temperature as in eq (35). (The “constant,” 1.052, may be improved upon once an approximate E has been determined from a table of first differences of log p(−E/RT) for various E/RT, [11].)
| (35) |
E may be calculated using eq (33) with fair agreement with theoretical values for E = 60,000 cal/mol, A/β = 1016/°K for n= 1, but theoretical data for n = ½ as well as, for example, maximum Case C, also give nearly linear plots for ln ln(1 − C) versus θ over a wide range and high values for the energy of activation.
Few papers on computational methods have been published [2, 22], but such methods are probably widely used. McCrackin [23], in an unpublished work, has programmed a method in which a series of weights, wi, and temperatures, Ti, are fed to the computer and values of (1 − C)i and F(Ci) are computed for each temperature, assuming n. From equations
| (36) |
where xi = (E/R)Γ−1(E/RT) and Γ−1 is the incomplete gamma function of − 1 order, values of xi are computed for an assumed E and data fitted to eq (36) to determine A/β. Assuming the error in Ci is only experimental and independent of its value, F(Ci) will have a constant variance so the best estimate for A/β will be given by
| (37) |
From eq (36), F(Ci) is computed for each i using the calculated values of A/β. Then, (1− Ci) and Wi are computed. The standard error of fit is
| (38) |
This is computed for various values of n and E and the values that give the smallest σ are chosen.
To summarize, the computer calculates and prints σ for values of E for n = 0, ½, 1, 3/2, 2, and 3. Then, for each n, it chooses the value of E that gives the minimum σ and prints E, σ and A/β for each n. It then prints Wi(calc) − Wi(expt) for these values of E.
Since only if Wi(calc) − Wi(expt) remains sensibly constant over the entire range can the system be said to have a particular n and E, it would appear that McCrackin’s method tests the validity of its assumptions.
Reich and Levi [24] have developed a method involving the determination of the area under the initial part of an integral thermogram to obtain an approximate expression for the energy of activation. Doyle [25] points out that such a method should be less sensitive to experimental scatter than line or slope methods. The corrected derivation [25] of the equations includes the approximation in eq (13d), i.e., p(x) = Gex, to obtain for n = l,
| (39) |
which for two different initial areas becomes
| (40) |
where AI+II/AI is the ratio of initial areas. As will be shown subsequently, the coefficient of E/RT assumed to be unity in eq (39) is a slowly changing function of E/RT and more accurate values may be obtained for E by successive approximations. Also, the general utility of eq (40) depends on the lack of sensitivity to order in the early conversion range.
Reich [26] has pointed out that at small and constant AT from eq (11)
| (41) |
ΔT=constant. Utility of eq (41) is limited to cases in which a particular reaction order, /i, is known to be followed.
Reich [27] using the approximations made by Horowitz and Metzger [21] obtained at constant weight loss for two different heating rates,
| (42) |
by assuming that TS, 1/TS, 2 = T1/T2.
However a simpler expression has been developed [11] by the substitution of eq (13d) into eq (10) to obtain
| (43) |
so at constant conversion for several heating rates a plot of log β versus 1/T will have a slope of
| (44) |
Activation energies may be quite accurately and simply obtained from eq (44) by successive approximations as tables of log p(−E/RT) and A log p(−E/RT) for various E/RT are available [10,11]. Once an approximate E is obtained from eq (44), the “constant,” which changes from 0.477 at E/RT = 20 to 0.449 at E/RT = 60, is redetermined for the approximate E/RT and successively more accurate values of E are obtained.
The independence of E from C and T may be tested by determining E at various constant conversion values.
In an excellent and important paper, recently to come to our attention, Ozawa [27a] also develops eq (44) but employs it without further refinement to calculate E at several C values. He sets up appropriate theoretical master-curves of (1 − C) versus log Φ[= log (AE/βR)p(x)] for, e.g., simple nth order reactions and for the random degradation of polymers [eq (6)] for N ≫ L and L = 2, 3, 4, and 5. A more accurate experimental master curve is obtained by superimposing curves of log β versus 1/T at several heating rates by displacement along the abscissa. Values of C and T from this curve are used to construct a plot of (1− C) versus log [(E/βR)p(E/RT)] which may be matched to the appropriate theoretical curve by displacement of log A along the abscissa, thus determining A and confirming the assumed kinetic equation.
This appears to be one of the best and most generally applicable methods yet developed.
If F(C) may be represented as a simple nth order reaction as in eq (3) then eq (44) becomes,
| (45) |
so for the slopes of plots of log β versus 1/T at constant C, log [(1− C)1−n − 1] versus 1/T at constant β, and log [(1 − C)1−n − 1] versus log β at constant T, one obtains
| (46) |
| (47) |
The right-hand side of eq (46) may be applied to a single thermogravimetric trace and has the advantage over the approximate methods of Farmer [16] and Coats and Redfern [19], [eq (29) and (30)], in that successive approximations in the manner described above can be used to determine accurate values of the parameters. The order, n, may be tested by eq (47), the correct n giving a horizontal plot.
Once β, n, E, T, and C are known, one may substitute into eq (45) to determine A. Thence, constancy of A with changing T and C should be a confirmation of the validity of n.
As this method is the most adaptable of the integral methods, we demonstrate its utility with the theorietical cases of “changing order” (maximum Cases A, B, and C) and “changing activation energy” [composite Cases (1) and (2)].
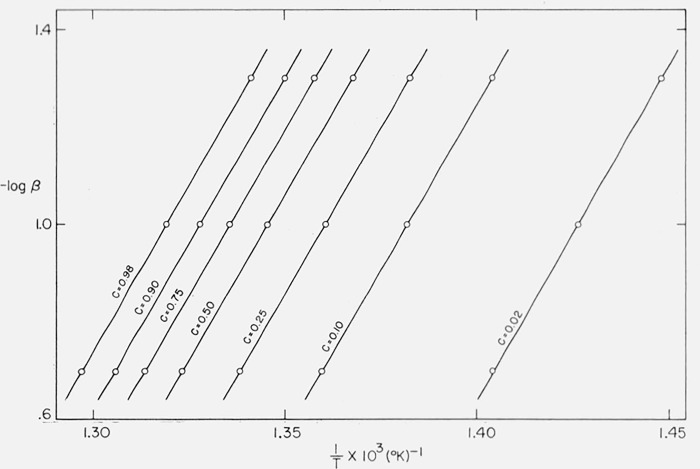
Figure 10 contains the integral curves for β1 = 0.05, β2 = 0.10, and β3 = 0.20 °K/sec for Case B with a maximum isothermal rate at C = 0.5. Values of T at constant C were obtained from these curves for C = 0.02, 0.10, 0.25, 0.50, 0.75, 0.90, and 0.98 and plots of log β versus 1/T are shown in figure 14. The slopes of these lines give, from (eq 44), Eapprox. = 59,300 ± 200 cal/mol. Upon reevaluating the constant in (eq 44) for (E/RT)approx., one obtains Ecorrected = 59,850 cal/mol compared with the theoretical value of 60,000 [11].
Figure 14.
Logarithm of heating rate versus reciprocal absolute temperature for maximum Case B.
A = 1015/sec; E = 60,000 cal/mol
β = 0.05, β2 = 0.10, β3 = 0.20 °K/sec;
C = 0.02, 0.10, 0.25, 0.50, 0.75, 0.90, and 0.98.
Therefore, this not only permits determination of the correct activation energy for this case of “changing order” but establishes its independence of C and T over the reaction range.
Equation (44) should not be expected to apply to composite cases since it was derived assuming a single temperature dependent rate constant. However, application to the independent and competitive first order reactions shown in figure 12 and 13 demonstrate some of the limitations of the method and how it may be utilized to interpret these simple cases.
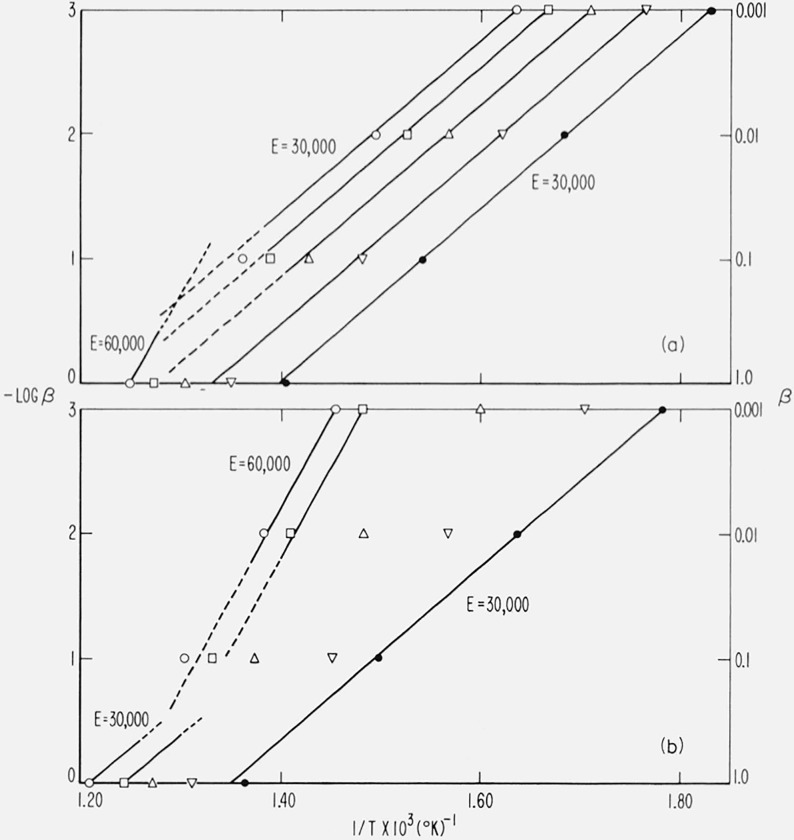
In figure 15, log β is plotted against 1/T for −(a) two first order competitive reaction, and (b) two first order independent reactions, for E1 = 30,000, E2 = 60,000 cal/mol, β = 0.001, 0.01, 0.1 and 1.0 °K/sec and C = 0.10, 0.25, 0.50, 0.75, and 0.90. The theoretical slopes for E1 = 30,000 and E2 = 60,000 cal/mol are included as guidelines.
Figure 15.
Logarithm of heating rate versus reciprocal absolute temperature for composite cases.
E1, E2, A1, A2, and β as in figure 13
(a) Case (2) competitive first order reactions
(b) Case (1) independent first order reactions
●, C = 0.10 □, C = 0.75
▽, C = 0.25 ◯, C = 0.90.
△, C = 0.50
For two competitive reactions, (fig. 15a), at low conversion, (C = 0.10), the low activation energy reaction is dominant at all heating rates so a slope corresponding to 30,000 cal/mol is obtained. At high conversion, (C = 0.90), the low energy reaction is still dominant at slow heating rates but the intrusion of the high activation energy reaction can be observed at fast β. A readjustment of the parameters could set up a situation in which the high energy reaction was dominant except at low C and β.
For two independent first order reactions (fig. 15b), at low conversion and slow β, the low energy reaction is dominant but at low C and fast β the slope is perturbed by the high energy reaction. At high conversion, the high energy reaction is dominant at slow β, but, as before, a mixture of E1 and E2 reactions contribute at fast β.
In general, employing the lowest practicable heating rate will best isolate competing reactions. However, it may occasionally be expedient to raise the heating rate to pick up a high energy reaction that may not be easily discernible under near-isothermal conditions.
We conclude, therefore, that only methods involving several heating rates can give the correct activation energy for cases of “varying order” (Cases A, B, and C) and reveal and, to some extent, resolve cases of “varying activation energy” (Cases (1) and (2)) in which several competing reactions occur.
The integral methods involving a single thermogram appear to be applicable only in special cases in which the isothermal order is known and meaningful. However, integral curve fitting should be considered important corraborative evidence in the testing of mechanism.
4.2. Differential Methods
“Differential” methods based on rate of weight loss versus temperature data have been devised which are much simpler in application and, in some cases, are able to circumvent difficulties found in many “integral” methods. However, they suffer from an inherent weakness – the magnification of experimental scatter – often rendering their application to experimental data difficult, if not impossible.
Van Krevelen et al. [17], calculated solutions for p(x) using two terms of eq (13c) and plotted families of curves for various Tmax for log (T(dC/dT))max and log (ΔT/T)max versus log E/R for first order reactions. ΔT is the half-width of the differential curve.
Turner and Schnitzer [28] used three terms of eq (13c) for p(x) and refined van Krevelen’s relationships for n = 1 to obtain expressions relating E/R to Tmax and ΔT. ΔT, Tmax and (dC/dT)max were estimated from a differential curve for each of several composite reactions and values for the parameters obtained. Turner et al. [29], using an identical development, obtained similar expressions for n = 2/3. However, the equations in references [28] and [29] are in error [15].
Kaesche-Krischer and Heinrick [30] used van Krevelen’s method at several heating rates to investigate the composite kinetics of polyvinyl alcohol decomposition. The utility of this method depends on how closely the assumed order of kinetics is followed. If the kinetics, in reality, behaves as a lower order reaction, then the calculated value for E will be too high, and conversely, if n is greater than its assumed value, the calculated E will be too low. Application of this method to maximum Cases A, B, and C gave activation energies from 70 to 150 kcal/mol compared with the theoretical value of 60. Van Krevelen [17], assuming n = l, obtained activation energies for polystyrene and polyethylene of 82 and 98 kcal/mol. These polymers which often exhibit maximum type isothermal rate curves usually have activation energies of the order of 55 and 70 kcal/mol, respectively [5].
Equation (11) at the maximum rate becomes
| (48) |
which may be combined with eq (21) and eq (30) which utilizes the three term asymptotic approximation to obtain
| (49) |
and
| (50) |
These eqs (48), (49), and (50) were first derived for first order reactions and used by Murry and White [31]. The solution of eq (49) was facilitated by using several heating rates. Kissinger [32] extended Murry and White’s method to any order, n, by deriving eqs (48), (49), and (50) as shown above.
Kissinger [33] differentiated the logarithm of eq (49) to obtain for n = 1
| (51) |
Thus the activation energy may be obtained from the shift of the maximum temperature with heating rate. Equation (51) is identical to eq (42) which was also derived assuming n = 1 and a reference temperature [27, 21]. Substituting eq (50) into (49) and differentiating the logarithm assuming Tmax changes slowly with β, Kissinger [32] again obtains eq (51) now for any n.
Kissinger [32] also has developed a shape index, s, defined as the absolute value of the ratio of the tangents to the differential curves at the inflection points and related to the order by
| (52) |
Such higher derivative methods are seldom practical for polymer degradation studies.
Fuoss et al. [34], suggest determining the three maximum values, Tmax, (dC/dT)max and (1− C)max from the inflection point of the integral curve and determining the activation energy from eq (21). The method as described [34] is applicable only to first order kinetics and not to all orders as is implied by the omission of n from eq (21). Such an omission leads, obviously, to the exceptionally high value for E for polystyrene indicated in this paper [34].
However, (1 − C)max is relatively independent of the heating rate, β. If eq (10) including two terms of the asymptotic approximation, eq (13a), is combined with eq (49) at the maximum, one obtains
| (53) |
Equation (53) was first pointed out by Kissinger [32] and also was derived by Horowitz and Metzger [21] from their nearly equivalent approximation. Thus eq (21) becomes
| (54) |
The last two columns in table 2 give the approximate (1− C)max, [i.e., columns (1 − C)max(x = ∞) and nn/n−1R(x = ∞)], which may be utilized with eq (54) to determine activation energies if the value and constancy of n have been established. If (1− C)max is independent of β, then from eq (21) T2max(dC/dT)max must also be independent. Such independence is inherent in the use of the two term asymptotic approximation as differentiation of eq (48) with respect to β assuming T2max(dC/dT)max and (1 − C)max constant results in eq (51).
Table 2.
Values of (1 − C)max for various orders and x’s
| -x | 10 | 20 | 30 | 40 | 50 | ∞ | nn/n−1R(Cal/mol°K) |
|---|---|---|---|---|---|---|---|
| n | |||||||
| ½ | 0.294 | 0.273 | 0.266 | 0.262 | 0.260 | 0.250 | 3.97 |
| 1 | .430 | .401 | .391 | .385 | .382 | .368, 1/e | 5.40 |
| 3/2 | .516 | .484 | .472 | .465 | .461 | .444 | 6.71 |
| 2 | .578 | .544 | .531 | .523 | .519 | .500 | 7.95 |
| 3 | .661 | .626 | .612 | .603 | .599 | .577 | 10.32 |
| 4 | .716 | .681 | .666 | .658 | .653 | .630 | 12.62 |
| 5 | .755 | .721 | .706 | .698 | .693 | .669 | 14.85 |
It also follows that
| (55) |
and from eq (8) that
| (56) |
so, if n is known, E and A may be determined from a plot of log for several β. Differentiation of eq (56) with respect to β assuming (1 − C)max constant results in
| (57) |
which is an equivalent form of eq (51).
Farmer [16] has developed equations for T½, the temperature at which C = 0.5. The relative error [eq (28)], r2, in using the first two terms of the asymptotic approximation is related to conversion at the maximum by [16]
| (58) |
Therefore the two-term approximation holds exactly (r2 = 1) only at x = −E/RT = ∞. Utilizing values of r2 as functions of x from table 1, we can calculate the (1 − C)max values for several values of x as is shown in table 2.
The approximate values for (1 − C)max(− x = ∞) may be in considerable error for cases of low E/RTmax and use of eq (53) will result in large error in determining n. However, if the approximate E/RTmax is known, appropriate corrections may be made from table 2.
If dC/d1/T is plotted versus 1/T, the maximum rate is
| (21a) |
which is practically independent of temperature. Other equations at the maximum will be modified accordingly.
The actual application of these many mathematical excercises at the maximum rate are limited to cases where n is known and its validity over the entire range of conversion has been established. An example of the magnitude of the error which may result in the misapplication of a single point method may be observed from the calculation of E from Case B. First order kinetics would appear to hold as (1− C)max = 0.35 for this case. However, calculation of E from eq (21) for n = 1 gives Eapparent = 135,000 cal/mol compared with Etheoretical = 60,000 cal/mol. Subsequently, it will be shown that a first order curve will give a deceptively good fit for both the differential and integral curves for such cases of maximum isothermal rate.
The simplest differential method for determining kinetic parameters is an Arrhenius plot of the logarithm of the nth order rate constant, kn, against the reciprocal of the absolute temperature since from eq (11),
| (59) |
or at β = constant,
Kofstand [35] used eq (59) to test for linear (n = 0), parabolic (n = −1) and cubic (n = −2) rate laws and determine activation energies for the oxidation of metals.
Barrer and Bratt, Newkirk, and others [36–40, 2] have employed eq (59) for n = l to determine activation energies from thermogravimetric data. This method may be used early in the reaction to determine initial parameters as the early parts of most reactions are more or less independent of order. However, it has been suggested that this method be used over the whole range of volatilization [2,37] with values for E obtained from linear portions of the log (d ln C)dT versus 1/T plot. As with other differential procedures this will lead to too high values for E if n < 1 and too low values if n > 1. Thus, when this method is applied to Cases B and C, high values are obtained for E. In order to obtain accurate activation energies, one would have to know or guess the approximate value of n that the reaction appeared to follow in the range of determination.
Ingraham and Marier [41] have used this method for a zero order reaction assuming a linear temperature dependence of the preexponential factor and obtained a linear relationship between log 1/T (dC/dT) and 1/T
The differential methods treated thus far assume the existence of a single order, n. At worst, they determine order at a single point such as the maximum rate. At best, they do not rigorously and sufficiently test their initial postulate as to the constancy of the parameters as does the integral method at several heating rates or as does a similar differential method which follows.
As in the case of integral methods, it is necessary to perform experiments at several heating rates in order to reveal changes in the kinetic mechanism which might affect the reliability of parameters determined from the data. Anderson [42] solves the three simultaneous equations for eq (59) at three different β with an electronic computer for the parameters A, n, and E at a series of constant (1− C) values. Any systematic drift in parameters with changing conversion would be indicative that the assumptions – single order and single temperature dependent rate constant – do not hold.
The most generally applicable differential method was developed by Friedman [43] who utilized eq (9) in logarithmic form, i.e.,
| (60) |
(dC/dt) and T are determined at constant C for several β, thus a plot of ln (dC/dt) versus 1/T will have a slope of E/R and an intercept of ln Af(C). If E proves to be constant over a range of C values then, from eq (59) and (60), a plot of ln Af(C) versus ln (1 − C) will have a slope of n and intercept of ln A if an nth order kinetic mechanism is operative.
In general, differentiation of eq (60) at constant C or constant dC/dt gives
| (61) |
or if f(C) = (1 − C)n,
| (62) |
| (63) |
The validity of f(C) = (1 − C)n may be tested from several runs at different β either at constant rates or constant temperature.
The right-hand side of eq (62) may be applied to a single differential plot when n > 0, since under these conditions dC/dt is a dual-valued function. The constancy of E/n may be tested at a series of constant dC/dt values. However, such constancy does not “prove” that the reaction is nth order. Experiments at several heating rates are essential for such proof.
Chatterjee [44] quite recently has expressed eq (63) in terms of W, the weight of sample remaining,
| (64) |
and the order n may be determined at several temperatures from two runs differing only in their initial weights.
It may be noted that the preexponential factor of the dC/dt equation is times the corresponding preexponential factor of the dW/dt equation [45]. Also, if an initial order is determined by this method, a distinction between the “order with respect to initial weight” and the “order with respect to temperature (time)” may be useful in the interpretation of the mechanism of complex reactions. The order with respect to initial weight, nw, may be determined from two or more runs at different W0 from an integral method, since from eq (43)
at constant W and β. After the determination of n, Chatterjee [44] suggests determining E from a single run by a difference-differential method. However, his method may be extended to apply to any f(W) ≠ Wn since eq (62), for two or more runs at different initial sample weights becomes
| (65) |
Chatterjee [44] suggests using eq (64) to determine the order of competitive reactions by first calculating A1 and E1 early in the first reaction and subtracting off the portion of the rate (calculated from A1 and E1) due to the first reaction from the second and so on. When change in n is due to competitive reactions this method may be applied only when the orders of the several reactions are different [16] and the rates of each step are proportional to a power of the total weight of material. An added problem is the determination of n early in the reaction.
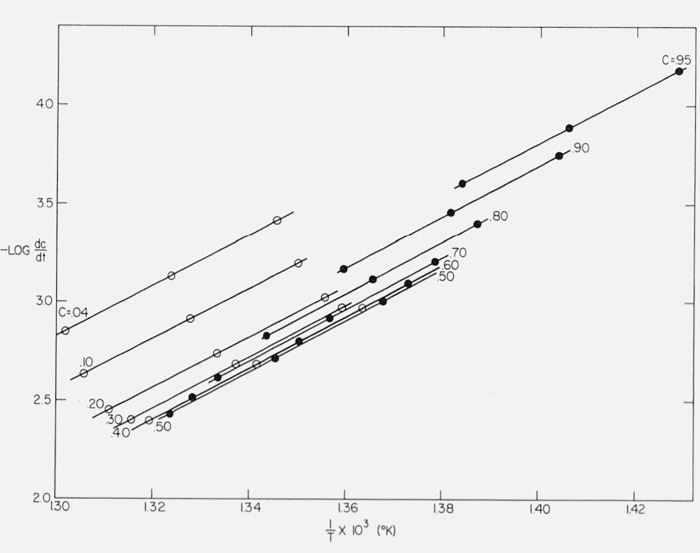
We may test the applicability of Friedman’s method [43] to the cases of “changing order” and “changing activation energy.” Figure 16 is a plot of log dC/dt versus 1/T for Case B with a maximum isothermal rate at 50 percent conversion. As with the integral method, parallel straight lines are obtained for degrees of conversion ranging between 0.04 and 0.95. The average value of Ecalc is 59,800 ± 1500 compared with 60,000 cal/mol, theoretical.
Figure 16.
Logarithm of thermogravimetric rate versus reciprocal absolute temperature for Case B.
A = 10l5/sec: E = 60,000 cal/mol
β1 = 0.05, β2 = 0.10, β3 = 0.20 °K/sec
C = 0.04, 0.10, 0.20, 0.30, 0.40, 0.50, 0.60, 0.70, 0.80, 0.90, and 0.95.
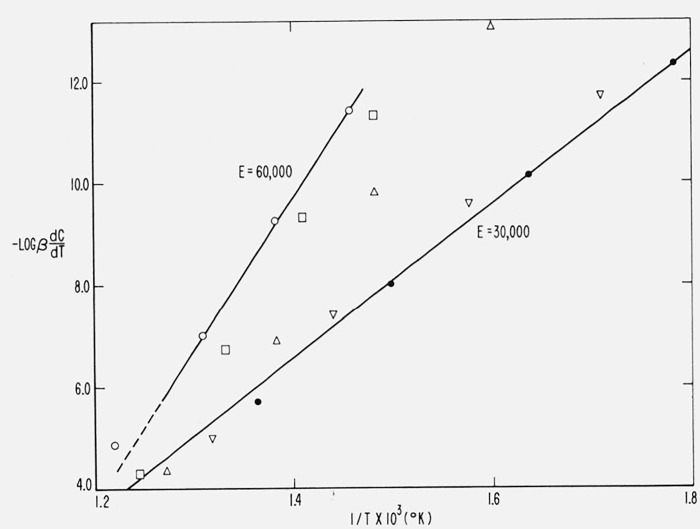
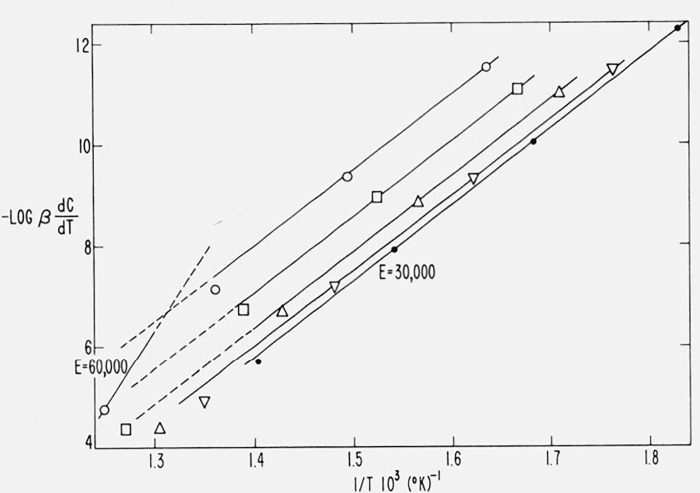
ln β (dC/dT) is plotted against 1/T for two first order independent composite reactions in figure 17, as was done for the integral method in figure 15b. Figure 18 is a similar plot for two first order competitive reactions. Again, theoretical slopes for E1 = 30,000 and E2 = 60,000 cal/mol are included for comparison purposes. The close similarity of these results to those of the integral method is obvious and the interpretation of figures 17 and 18 is identical to that of figure 15. Comparison of (eqs 61) and (44) shows the dominance of Δ ln β over Δ ln (dC/dT) and thus, explains the close similarity of the two methods.
Figure 17.
Logarithm of thermogravimetric rate versus reciprocal absolute temperature for Case (1) independent first order reactions.
E1, E2, A1, A2, β as in figure 13
●, C = 0.10 ◻, C = 0.75
▽, C = 0.25 ◯, C = 0.90.
△, C = 0.50
Figure 18.
Logarithm of thermogravimetric rate versus reciprocal absolute temperature for Case (2) competive first order reactions.
E1, E2, A1, A2, β as in figure 13
●, C = 0.10 ◻, C = 0.75
▽, C = 0.25 ◯. C = 0.90.
△, C = 0.50
The practical merits of the two methods may now be compared. The integral method [eq (44)] is simpler than the differential [eq (61)] method and quicker as it does not involve the determination of rates. However, no successive approximations are necessary for the differential method. (It will be shown that the integral method may become exact by appropriate programming of the heating rate.)
On the other hand, many polymer decompositions are subject to early kinetic irregularities (e.g., a temperature dependent induction period). Such complications may modify parameters obtained from an integral method as they depend upon cumulative values of the experimental parameters. Differential methods which give instanteous values for parameters are not subject to these complications. The preexponential factor, A, and the order, n, if it exists, may be determined directly from the intercept in either method and both methods are equally capable of interpreting cases of changing order or activation energy.
To summarize, of the differential methods, only those involving several thermograms appear to be generally applicable. Methods involving a single thermogravimetric trace should be applied only to systems where all material volatilizes by the same simple kinetic process.
4.3. Difference-Differential Methods
The difference-differential method of Freeman and Carrol [46] and its modification [38] is the most widely used method for the kinetic analysis of thermogravimetric data. It has been applied both to the investigation of inorganic materials [46, 2, 39, 47, 48] and polymers [38, 49, 2, 50, 44].
The difference form of eq (59) is
| (66) |
and the difference forms of eqs (62) and (63) are
| (67) |
| (68) |
| (69) |
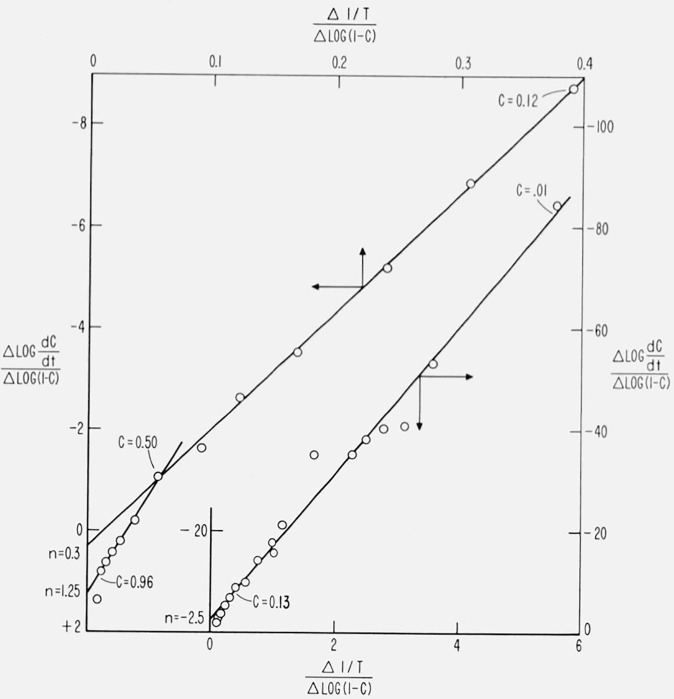
Equations (67) and (69) have been used to obtain the parameters, E and n, from thermogravimetric data with reported success not only for simple inorganic decompositions but also for complex polymeric systems. Therefore it is of interest to apply these equations to Case B with a maximum isothermal rate at 50 percent conversion. Figure 19 is a plot of against for this case with a constant energy of activation of 60,000 cal/mol. Similar results are obtained from eqs (68) and (69).
Figure 19.
versus for Case B.
A =1015 sec; E = 60,000 cal/mol; β = 0.10 °K/sec
intercept = n slope = E/2.3R.
Three conversion ranges of constant slope may be obtained from figure 19 as might be anticipated for a cubic. These give the following values for n and E,
1–13% conversion E = 66,500 cal/mol n = − 2.4
13–50% conversion E = 105,000 cal/mol n = + 0.3
50–95% conversion E = 175,000 cal/mol n = 1.25.
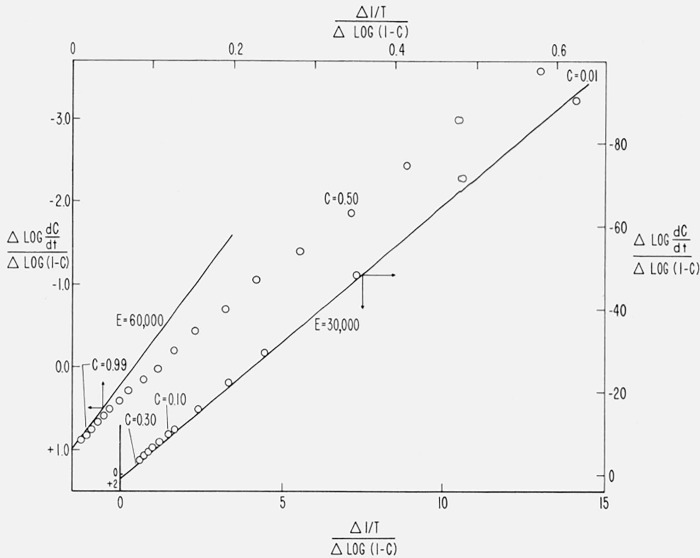
The data may be interpeted as follows: between 1 and 13 percent conversion, the data are fitted by the parameters E = 66,500 cal/mol, and n = − 2.4, etc. Since n is negative initially and becomes positive the isothermal rate must pass through a maximum value. The value of E does not have any correspondence to its theoretical value except in the initial conversion range. Treating each linear range independently does not improve the results. Therefore, the difference-differential method gives a procedural n and E for the different ranges but these have no mechanistic significance, e.g., the activation energies obtained for the middle conversion range of polystyrene and polyethylene in reference [38] may well be in error.
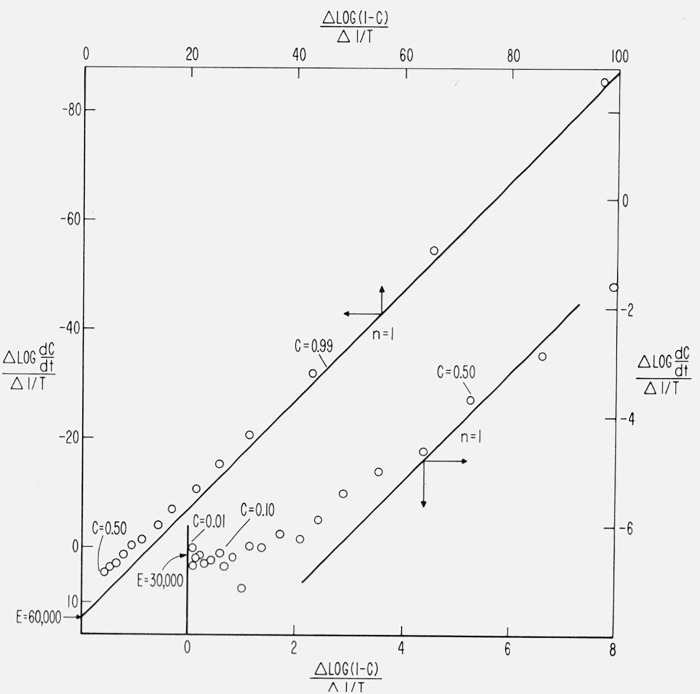
The Freeman-Carrol method is applied to two competitive first order reactions (Case 2) of 30,000 and 60,000 cal/mol, respectively, in figures 20 and 21.
Figure 20.
versus for competitive first order reactions.
E1, E2, A1, A2 and β, as in figure 13.
Figure 21.
versus for competitive first order reactions.
E1, E2, A1, A2, and β as in figure 13.
Analysis of these figures allows a critical investigation of this method as first order kinetics is followed by both reactions. The scatter of points at low conversion in figure 19 due to the determination of 1 − C and dC/dt values from theoretical curves was cut down by determining them directly from the theoretical equations for figures 20 and 21.
in figure 20. The theoretical intercepts at C → 0 for E = 30,000 and 60,000 cal/mol and the theoretical slopes for n = 1 are indicated. As C → 0, the curve approaches the correct intercept, (E = 30,000), but the slight perturbation by the E = 60,000 reaction coupled with the lack of sensitivity toward n at low conversion tends to make the reaction appear to be zero order. The slope approaches n = 1 only at high conversion, but with an intercept of E ≅ 40,000.
in figure 21. The theoretical intercepts at C → 1.0 for n = 1 and the theoretical slopes for E = 30,000 and 60,000 cal/mol are indicated. In the less than 30 percent conversion range, a slope reasonably close to 30,000 may be obtained but the perturbation of the high energy reaction is great enough to throw the intercept toward zero order. The intermediate conversion range gives slopes between 30,000 and 60,000 and intercepts less than unity. Only as C → 1 may n be accurately determined from the intercept.
It is obvious from the above cases that it is difficult to differentiate between deviations from constancy due to “changing order” and “changing activation energy” with this method.
If the reaction follows a simple order, n may best be determined at high conversion either from the slope of eq (69) or the intercept of eq (67). The activation energy may be determined either from the intercept at low conversion for eq (69) or the slope of eq (67).
In general one may obtain the initial parameters only if values of high accuracy can be obtained for Δ dC/dt at low conversions. The experimental scatter, doubly magnified by taking the difference of a derivative, often will not allow the determination of order at low conversion where the dependence on n is slight.
These methods seem to be of limited applicability to polymeric systems where the kinetics often is complex.
4.4. Initial Rates
Even where f(C) in eq (1) is unknown, the activation energy often can be determined as near to initial conditions as possible since all well-behaved reactions approach zero order as C → 0.
Since the initial conditions for a thermally decomposing system are usually those most precisely characterized, the initial values of the kinetic parameters are often particularly useful in determining mechanism. Accurate initial weight-loss values are unattainable in isothermal studies due to an inevitable time-lag in reaching experimental temperature.
This independence of order at low conversion means that a plot of the logarithm of a “zero order rate constant,” e.g., dC/dt, C/T2 [20], C [26], or the logarithm of a “first order rate constant,” e.g., (d ln C)/dT [36–40, 4, 16], log (1 − C) [26], or the logarithm of an “nth order rate constant,” [1/(1 − C)n] dC/dT, [35], versus 1/T or 1/T + a ln T will give approximately the same values for activation energy at low C. Difference-differential equations, e.g., eq (69), to determine initial E have been suggested [44] but are not usually practical for reasons stressed in the previous section.
The ln T term which modifies the reciprocal temperature may enter as a temperature dependence of the preexponential factor, through an integral series approximation or a temperature dependence of the heating rate. It has been shown to be trivial except at low E. In general, if the order assumed in calculating E is higher than is actually the case, the resultant activation energy will be greater than the true value, although, where integral expressions are used other approximations may reverse this effect.
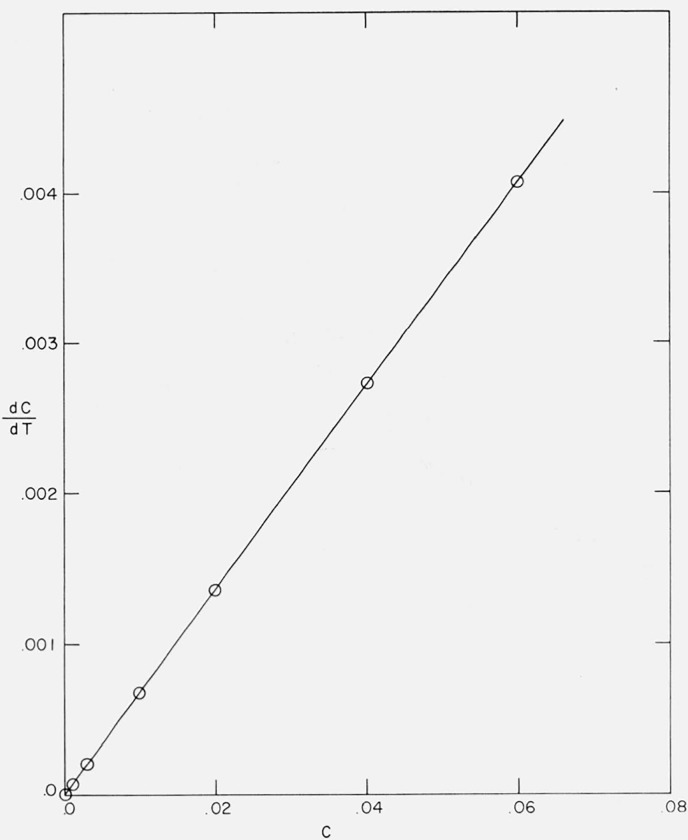
From eqs (19) and (20) for n = 0, the slope of a plot of dC/dT versus C is E/RT2. [In fact, for any n, plots of [1/(1 − C)n] dC/dT versus (1 − C)1−n, (n ≠ 1), and d ln (1 − C)/dT versus ln (1 − C), (n = 1), have a slope of E/RT2.] E may be determined from the initial slope of a dC/dT versus C curve as the second term in eq (19) is negligible at low C. This is shown for Case B in figure 22. From the slope, one obtains (slope) = 6702 × 2 × 0.0068 = 61,000 cal/mol compared with Etheor = 60,000. The error in the calculated E results from difficulty in assigning a value to , the average temperature over which the slope was determined.
Figure 22.
Initial thermogravimetric rate versus conversion for Case B.
A/β = 1016/°K; Etheor = 60,000 cal/mol.
This problem may be overcome by plotting − dC/d(1/T) (= T2(dC/dT)) versus C. The slope then becomes
| (70) |
Thus at low C, the slope will equal where . In practice an average E may be obtained from a set of C, dC/dT and T at low C since
| (71) |
Several methods have been applied to determine the initial activation energies for simple orders and the “maximum” cases. At C = 0.05, Doyle’s method [10] give E = 62,400 cal/mol for Case B. Equation (31) of Coats and Redfern [20] gave E = 61,800 at C = 0.04. Equation (41) of Reich [26] gave a low value of 59,000 as eq (41) differs from eq (31) by 2 ln T.
In general, (dC/dT) versus C plots remain linear to higher conversions than log (dC/dT) versus 1/T plots. Methods involving log kn versus 1/T gave the correct slope up to C ≅ 0.01 for Case B, while dC/dT versus C is linear to C ≅ 0.03.
If a procedural n may be approximated, log [(1/(1 − C)n]dC/dT versus 1/T or [(1/(1 − C)n]dC/dT versus (1 − C)l−n/1 − n may remain linear over a wide range of concentration. However, a linear plot of log kn versus 1/T at low conversion does not imply nth order kinetics as has been stated by some investigators.
The apparent advantage of thermogravimetric over isothermal methods for the determination of initial parameters is not always experimentally realizable. Accurate data are necessary at low conversions and should be obtained at low heating rates to separate any competing reactions such as volatilization of solvent.
4.5. Nonlinear and Cyclic Heating Rates
Techniques involving the programming of reaction variables are as yet a quite undeveloped tool for the elucidation of kinetic mechanisms. In general, we may write,
| (72) |
where the reaction variables, Yi, may include concentration of any reacting species, temperature, light intensity, dose of ionizing radiation, catalyst concentration, inhibitor concentration, product concentration, intermediate concentration, solvent concentration, dielectric constant of solvent, pH, ionic strength, etc.
Time, of course, is a unique monotonously increasing variable. However all other reaction variables may, at least in theory, be programmed to increase or decrease with time during the course of the reaction at a rate given by
| (73) |
β may be any function from zero (isothermal case, if Yj = T) to an integral transform and may include several arbitrary constants and reaction variables.
It may be simpler in some cases, e.g., the pH of an unbuffered solution, to allow a reaction variable to change in a prescribed manner rather than to keep it constant. If the change in a reaction variable may be measured, then an empirical equation may be fitted to its change with time. In such a case, any dependence of the empirical constants on the reaction variables should be investigated.
| (74) |
A judicious selection of g may simplify the kinetics and information concerning the kinetic mechanism may be elicited through the variation of the parameters. Also, this permits the analyses of a large variety of differential expressions of the form − dYi/dYj.
An application of such techniques has been made recently by Ozawa [27a] and is well adapted to his method of kinetic analysis. For simple random degradation of polymers, the rate of change of fraction of bonds broken, dα/dt, is given by a simple first order equation
| (75) |
Equation (75) may be combined, upon integration, with eq (5) to construct master curves of (1 − C) versus Φ for N ≫L and L = 2, 3, 4, 5, . . . . In general, if W = W0(1− C) = g(Yi) and dYi/dt = Ae−E/RT h(Yi), then integration results in relationship between conversion and Φ.
Since E and the reduced time, , are independent of C, Ozawa [27a] suggests that they be used to define thermal stability for materials for which the temperature dependence of the measured property can be expressed by a single Arrhenius equation.
Many of the analytical kinetic procedures discussed in this article may be greatly simplified by the appropriate programming of the heating rate, for if
and the temperature dependence of the preexponential factor is T0, T½, or T1, respectively and then if m = 2, 2½, or 3, respectively, one obtains
| (76) |
which is easily integrated to obtain
| (77) |
eliminating all problems associated with the exponential integral.
Programming of β = aT2, i.e., time proportional to 1/T, should pose no special problem; for example, between 200 and 600 °C only a three-fold increase in heating rate would take place.
All integral approximations are now unnecessary as,
| (13′) |
and, for example,
| (46′) |
| (47′) |
The slope of the rate versus conversion curve now becomes,
| (19′) |
and
| (70′) |
so that
| (71′) |
The relationships at the maximum rate are simplified in some cases,
| (21′) |
or
| (21a′) |
| (50′) |
| (51′) |
etc.
All differential and difference-differential equations are the same if β(dC/dT) = dC/dt is replaced by aT2(dC/dT), thus,
| (61′) |
or
| (62′) |
and eq (63) does not change as is true of all equations at constant temperature.
Thus, in summary, the programming of the heating rate proportional to the square of the temperature greatly simplifies integral methods rendering approximate equations exact. Rate versus composition equations are simpler as are expressions relating rate, composition and temperature at the maximum rate. Rate versus temperature methods are modified by the substitution dC/dt = β(dC/dT) = aT2(dC/dT) = −a dC/(d 1/T).
Other cases of nonlinear heating rates have been developed for the investigation of the ageing of insulating material [51,52]. The case in which the rate of heating increases and decreases as an exponential function of time is of some interest as such behavior approximates the heating and cooling curves of an electrical oven heated at a constant load and then shut off to cool. Thus, at least in theory, once the time constant has been determined, such an apparatus may be used in thermogravimetric investigations without temperature control.
The differential eq (9) is independent of heating rate so in many differential methods in which the simultaneous determination of T, 1−C, and dC/dt (dW/dt) are utilized, the analytic form or the value of the heating rate need not be known. Thus in eq (59), since β (dC/dT) = dC/dt, there is no need to know β or to keep it constant unless a method comparing several heating rates is to be used.
On the other hand, all integrated expressions assume a particular function for β so methods including integral forms depend on assumptions made concerning the rate of heating.
Equations at the maximum, e.g., eq (21), are independent of the conditions used in reaching the maximum but assume that β is constant in the region of the maximum, otherwise an additional term containing the temperature acceleration would be necessary. Many of the other equations at the maximum are combinations of differential and integrated equations.
Equations (61), (62), and (63) should be applicable in a two-point difference form irrespective of the previous variation of β for at any two temperatures at which (dC/dt)1 = (dC/dt)2.
| (62″) |
or if the same temperature is obtained by any rate of heating followed by any rate of cooling, then at T1 = T2,
| (63′) |
In order to utilize the left-hand sides of eqs (61) and (62), in a similar manner, two separate runs must be performed at different rates of heating such that at the same degree of conversion there will be different rates and temperatures so that at (1 − C)1 = (l − C)2
| (61″) |
for any f(C).
Reich, Lee and Levi [53] have applied eq (69) at constant dC/dT,
| (69′) |
to cases where β was changed in magnitude and/or sign during a single run to obtain values for n and E. In runs in which the sample was both heated and cooled, eq (63′) was also used to determine order.
The above methods should be used with caution for polymeric materials. Except for the most simple systems, the initial starting material may undergo one or more condensed phase physical or chemical transformations before volatilization. In such cases, where two samples at the same degree of conversion have different heating histories, the rates of volatilization may not be comparable. Anderson [42] suggests, as a test for compositional constancy, that a series of M identical heating cycles be performed. If the relationship in eq (78)
| (78) |
holds, then the kinetics follow a simple nth order relationship and a plot of the logarithm of the residual fraction after M cycles versus the number of cycles, M, should give a straight line whose slope should equal the logarithm of the residual fraction after the first cycle.
Anderson [54] also suggests that since for a case following a simple order n,
| (79) |
a plot of (dC/dt)M versus M could be matched with curves for various orders. Better still, a plot of log(dC/dt)M versus M log(l − C)1 should yield a slope equal to n.
5. Concerning the Uniqueness of TGA Plots With Respect to Kinetic Parameters
It is quite clear from previous sections that, even for cases in which a single Arrhenius expression is operable, only methods involving several rates of heating determine a reliable activation energy parameter. Single point or even single curve methods may give spurious values for the parameters E and n as both the slope and the inflection point are dependent on f(C) and E/RT. A number of such methods give a reasonable fit for Case B (Etheor = 60,000 cal/mol, isothermal maximum rate at C = 0.5) with a first order reaction but with an activation energy of approximately 135,000 cal/mol.
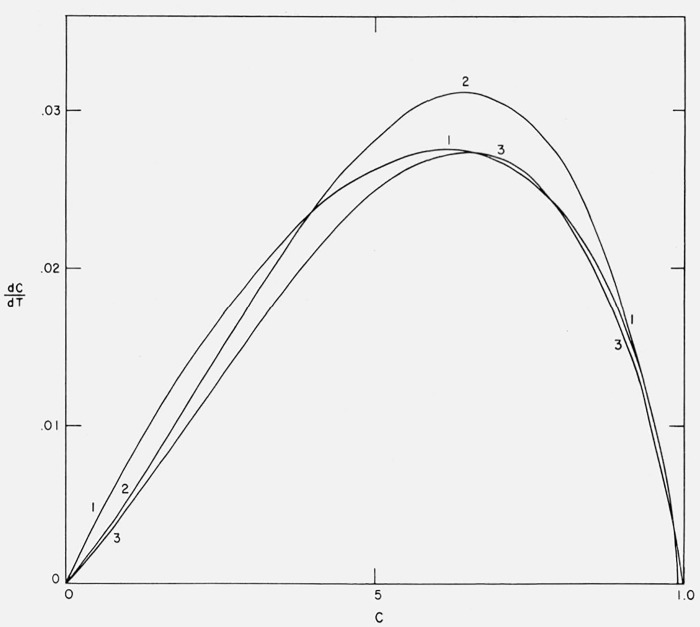
Therefore, in the final three figures, we compare these two cases in which the isothermal kinetics differ so drastically and observe to what extent their thermogravimetric curves are distinguishable.
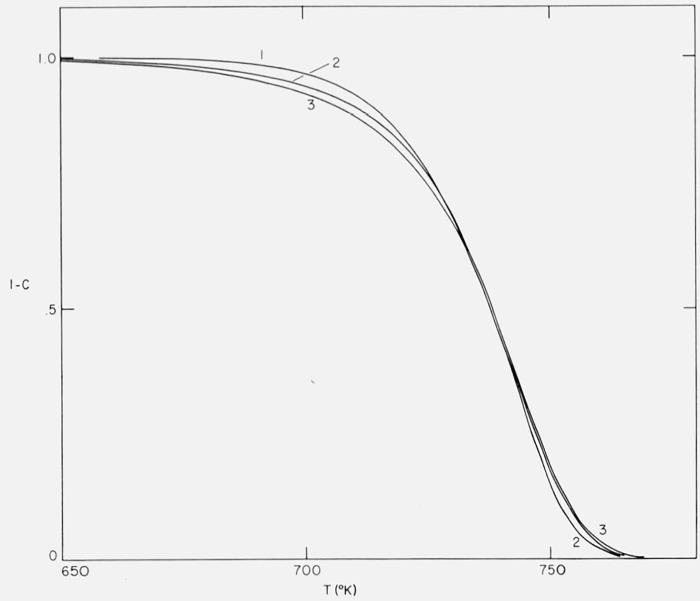
Three integral curves (1 − C versus T) are shown in figure 23. Curve 1 is for n= 1, E = 80,000 cal/mol and A/β = 9.3179 × 10²¹/sec; Curve 2, Case B (isothermal rate rises to a maximum three times the initial rate at 50 percent conversion), E = 40,000 cal/mol, A/β = 1.2057 × 10¹⁰/sec, and Curve 3, Case B, E = 35,000 cal/mol, A/β = 3.6000 × 10⁸/sec. A/β values were adjusted so that the temperatures of the maximum rates would coincide.
Figure 23.
Residual fraction versus temperature.
1. First order E = 80,000 cal/mol;
2. Case B: E = 40,000 cal/mol;
3. Case B: E = 35,000 cal/mol;
The “maximum” Curves 2 and 3 deviate from the first order curves only in the first 20 percent conversion range. Better fit in this range could undoubtedly be obtained with a different value of n.
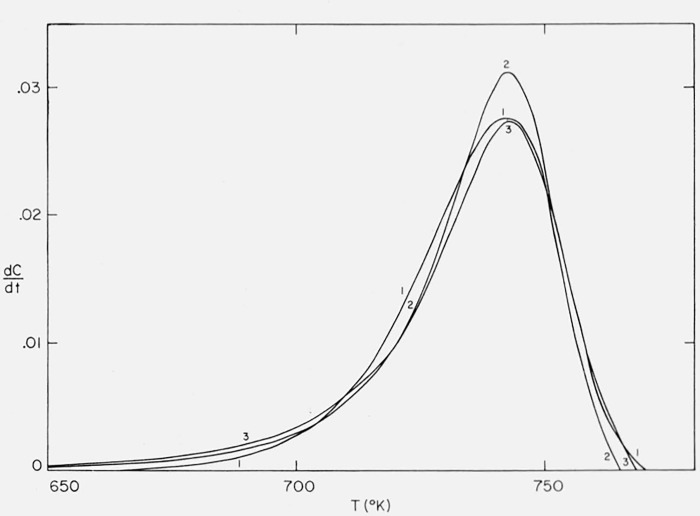
Thermogravimetric rate versus temperature curves are shown in figure 24 for the same cases. The closeness of fit well explains the especially poor results obtained when methods involving maximum temperature, rate, conversion, or half-width are applied to Case B.
Figure 24.
Thermogravimetric rate versus temperature.
1., 2., and 3. as in figure 23.
Thermogravimetric rate versus conversion curves are shown in figure 25 for the same cases. The superiority of this type plot for distinguishing between the two cases is evident. The dependence of the initial slope upon only E and T permits a quick estimate of the initial activation energy whose constancy with increasing conversion may be established through other methods.
Figure 25.
Thermogravimetric rate versus degree of conversion.
1., 2., and 3. as in figure 23.
To conclude, although there are some special cases for which a theoretical order has real significance, in general, n must be looked upon as a purely empirical parameter, sometimes useful in curve fitting.
Footnotes
Figures in brackets indicate the literature references at the end of this paper.
6. References
- [1].Flynn J. H. and Wall L. A., Am. Chem. Soc. Meeting, Polymer preprints 6, 945 (1965). [Google Scholar]
- [2].Coats A. W. and Redfern P. J., Analyst 88, 906 (1963). [Google Scholar]
- [3].Murphy C. B., Analytical Chemistry 36, 347R (1964). [DOI] [PubMed] [Google Scholar]
- [4].Smith D. A., Rubber Chemistry and Technology 37, 937 (1964). [Google Scholar]
- [5].Wall L. A. and Flynn J. H., ibid. 35, 1157 (1962). [Google Scholar]
- [6].Simha R. and Wall L. A., J. Phys. Chem. 56, 707– (1952). [Google Scholar]
- [7].Wall L. A., Straus S., Flynn J. H., McIntyre D., and Simha R., J. Phys. Chem. 70, 53 (1966). [Google Scholar]
- [8].Smith A. W. and Aranoff S., J. Phys. Chem. 62, 684 (1958). [Google Scholar]
- [9].Vallet P., Compt. Rendus hebd. Séances Acad. Sci. (Paris) 249, 823 (1959). [Google Scholar]
- [10].Doyle C. D., Appl J.. Polymer Sci. 5, 285 (1961). [Google Scholar]
- [11].Flynn J. H. and Wall L. A., Polymer Letters 4, 323 (1966). [Google Scholar]
- [12].Jahnke E., Loesch F., and Emde F., Tables of Higher Functions, 6th ed, p. 18 (McGraw-Hill Book Co; New York, N.Y., 1960). [Google Scholar]
- [13].Schlömilch O., Vorlesungen über höheren Analysis, 2d ed, p. 266 (Bruenschweig, 1874; ). [Google Scholar]
- [14].Doyle C. D., Appl J.. Polymer Sci. 6, 639 (1962). [Google Scholar]
- [15].Doyle C. D., Nature 207, 290 (1965). [Google Scholar]
- [16].Farmer R. W., Wright-Patterson Air Force Base, Ohio, Aeronautical Systems Division Tech. Doc. Rept. ASD–TDR–62–1043, Part I (1963). [Google Scholar]
- [17].van Krevelen D. W., van Heerden C., and Huntjens F. J., Fuel 30, 253 (1951). [Google Scholar]
- [18].Baur J. P., Bridges D. W., and Frassell W. M., J. Electro-chem. Soc. 102, 490 (1955). [Google Scholar]
- [19].Coats A. W. and Redfern J. P., Nature 201, 68 (1964). [Google Scholar]
- [20].Coats A. W. and Redfern J. P., Polymer Letters 3, 917 (1965). [Google Scholar]
- [21].Horowitz H. H. and Metzger G., Analytical Chemistry 35, 1464 (1963). [Google Scholar]
- [22].Soulen J. R., Analytical Chemistry 34, 136 (1962). [Google Scholar]
- [23].McCrackin F. L., Polymer Physics Section, National Bureau of Standards, private communication.
- [24].Reich L. and Levi D. W., Makromol. Chem. 66, 102 (1963). [Google Scholar]
- [25].Doyle C. D., Makromol. Chem. 80, 220 (1964). [Google Scholar]
- [26].Reich L., Polymer Letters 3, 231 (1965). [Google Scholar]
- [27].Reich L., Polymer Letters 2, 621 (1964). [Google Scholar]; [27a] Ozawa T., Bul Chem. Soc. Japan 38 [11], 1881–1886 (Nov. 1965). [Google Scholar]
- [28].Turner R. C. and Schnitzer M., Soil Science 93, 225 (1962). [Google Scholar]
- [29].Turner R. C., Hoffman I., and Chen D.. Canadian J. of Chem. 41, 243 (1963). [Google Scholar]
- [30].Kaesche-Krischer B. and Heinrich H. J., Chemie-Ing.-Techn. 32, 598 (1960). [Google Scholar]
- [31].Murry P. and White J., Trans. Brit. Ceram. Soc. 54, 204 (1955). [Google Scholar]
- [32].Kissinger H. E., Analytical Chem. 29, 1702 (1957). [Google Scholar]
- [33].Kissinger H. E., Res J.. NBS 57, 217 (1956). [Google Scholar]
- [34].Fuoss R. M., Salyer I. O., and Wilson H. S., J. Polymer Sci. 2A, 3147 (1964). [Google Scholar]
- [35].Kofstad P., Nature 179, 1362 (1957). [Google Scholar]
- [36].Barrer R. M. and Bratt G. C., J. Phys Chem. Solids 12, 130 (1959). [Google Scholar]
- [37].Newkirk A. E., Analytical Chem. 32, 1558 (1960). [Google Scholar]
- [38].Anderson D. A. and Freeman E. S., J. Polymer Sci. 54, 253 (1961). [Google Scholar]
- [39].Traore K., Soc. Chim. France, 5 serie, Mémoirs, p. 274 (1964). [Google Scholar]
- [40].Magnuson J. A., Analytical Chem. 36, 1807 (1964). [Google Scholar]
- [41].Ingraham T. R. and Marier P., Canadian J. Chem. Eng. 42, 161 (1964). [Google Scholar]
- [42].Anderson H. C., J. Polymer Sci. 6C, 175 (1965). [Google Scholar]
- [43].Friedman H. L., ibid., 6C, 183 (1965). [Google Scholar]
- [44].Chatterjee P. K., J. Polymer Sci. 3A, 4253 (1965). [Google Scholar]
- [45].Flynn J. H., Chem. Eng. 69, 137 (1962). [Google Scholar]
- [46].Freeman E. S. and Carroll B., J. Phys. Chem. 62, 394 (1958). [Google Scholar]
- [47].Lumme P., Suomen Kemistilehti B32, 198 (1959). [Google Scholar]
- [48].Lumme P. and Peltonen J., ibid. B37, 162 (1964). [Google Scholar]
- [49].Anderson H. C., Makromol. Chem. 51, 233 (1962). [Google Scholar]
- [50].Igarashi S. and Kambe H., Bul. Chem. Soc. Japan 37, 176 (1964). [Google Scholar]
- [51].Frentz H.-J., Eiektrotechnische Z. A78, 156 (1957). [Google Scholar]
- [52].Whitman L. C. and Whitman W. W., Amer. Inst. Elect. Eng. Trans. 78, Pt. I, 308 (1959). [Google Scholar]
- [53].Reich L., Lee H. T., and Levi D. W., J. Applied Polymer Sci. 9, 351 (1965). [Google Scholar]
- [54].Anderson H. C., Polymer Letters 2, 115 (1964). [Google Scholar]


