Abstract.
Elevated intraocular pressure (IOP) is an important risk factor for glaucoma. However, the role of IOP in glaucoma progression, as well as retinal physiology in general, remains incompletely understood. We demonstrate the use of visible light optical coherence tomography to measure retinal responses to acute IOP elevation in Brown Norway rats. We monitored retinal responses in reflectivity, angiography, blood flow, oxygen saturation (), and oxygen metabolism over a range of IOP from 10 to 100 mmHg. As IOP was elevated, nerve fiber layer reflectivity was found to decrease. Vascular perfusion in the three retinal capillary plexuses remained steady until IOP exceeded 70 mmHg and arterial flow was noted to reverse periodically at high IOPs. However, a significant drop in total retinal blood flow was observed first at 40 mmHg. As IOP increased, the venous demonstrated a gradual decrease despite steady arterial , which is consistent with increased arterial-venous oxygen extraction across the retinal capillary beds. Calculated total retinal oxygen metabolism was steady, reflecting balanced responses of blood flow and oxygen extraction, until IOP exceeded 40 mmHg, and fell to 0 at 70 and 80 mmHg. Above this, measurements were unattainable. All measurements reverted to baseline when the IOP was returned to 10 mmHg, indicating good recovery following acute pressure challenge. These results demonstrate the ability of this system to monitor retinal oxygen metabolism noninvasively and how it can help us understand retinal responses to elevated IOP.
Keywords: optical coherence tomography, functional monitoring and imaging, glaucoma, oxygen metabolism, total retinal blood flow
1. Introduction
Elevated intraocular pressure (IOP) is the best-characterized risk factor for glaucoma, the second leading cause of blindness worldwide,1 and lowering IOP can preserve vision for many glaucoma patients.2 However, despite the success of IOP-lowering drugs,3 the association of IOP with glaucoma and the mechanisms by which elevated IOP damages the retina as well as the optic nerve remain unclear and require further investigation.4
Optical coherence tomography (OCT) enables noninvasive, dye-less, and three-dimensional visualization of the retina.5 With this technique, nerve fiber layer (NFL) thickness was found to be reduced in glaucoma patients6 as the result of neuronal death.7 Subsequently, measurements by optical coherence tomography angiography (OCTA)8 indicated that capillary density in the radial peripapillary capillary plexus is highly correlated with NFL thickness.9 OCTA has also revealed that the microvascular network near the optic disc is attenuated both globally and focally in glaucoma patients.10 Moreover, the detected densities of vascular plexuses in glaucoma were lower, due to capillary dropout, in both the macular and the optic disc regions compared to that in normal vascular plexuses.11,12
These findings indicate that the retinal vasculature is affected in glaucoma patients. To further investigate retinal response to elevated IOP, researchers have measured capillary perfusion and retinal blood flow in the face of elevated IOP in rat eyes, using infrared OCT systems.13,14 This revealed that, at IOP up to 60 mmHg, total retinal blood flow decreased, and capillary perfusion was unchanged. This suggests that, within this pressure range, capillary transit is slowed, which should be accompanied by increased oxygen extraction. However, this could not be verified at that time with existing technology.
Visible light optical coherence tomography (vis-OCT)15–18 has been developed recently, which enables high-resolution retinal images19–21 and functional measurement of oxygen saturation,15,22–26 oxygen metabolism,27,28 as well as other tissue features.29,30 In this study, we conducted acute IOP elevation protocols in Brown Norway rats similar to those described previously14 and imaged the retina with our recently established vis-OCT system.25,31,32 Comprehensive retinal responses to acute IOP elevation, which include retinal oxygen extraction and oxygen metabolism, as well as structural reflectivity, angiography, and blood flow are all provided with this modality.
2. Method
2.1. Animal Preparation
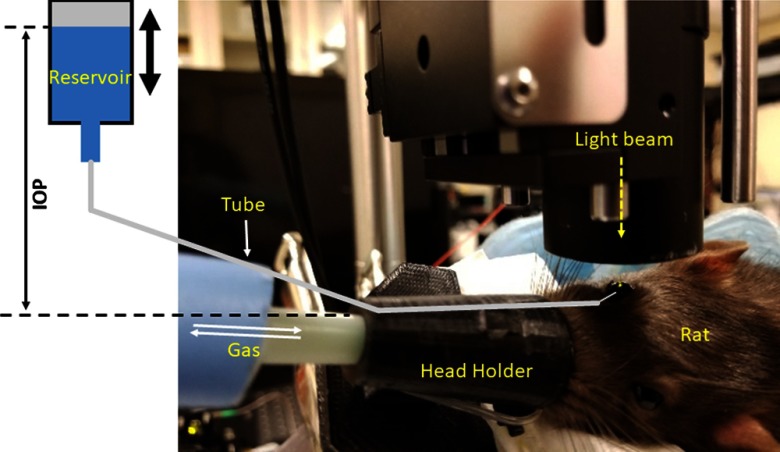
Adult Brown Norway rats (17 weeks old) were included in this study. Seven eyes were randomly chosen (four left eyes and three right eyes from seven animals). Animals were anesthetized with 5% isoflurane initially for 10 min and 2.5% isoflurane during the imaging session, mixed with 100% . Following stabilization in a custom-made imaging stage with multidimensional manipulation, the animal was positioned with the eye facing vertically (Fig. 1). The pupil was dilated with a 1% tropicamide ophthalmic solution. To keep the cornea moist, sterile irrigating salt solution (Alcon Laboratories Inc.) was applied to the eye every other minute. Body temperature was maintained with a 38.5°C water-warming blanket. Exhaust gas, including isoflurane, was removed by a vacuum pump to avoid carbon dioxide accumulation and was collected by an anesthesia gas filter (OMNICON F/air, Bickford) before releasing to the open air.
Fig. 1.
Experimental setup of intraocular pressure elevation in rats. The rats were stabilized in a customized head holder with inhalation gas delivery. A vertically oriented light beam illuminated the eye.
To regulate IOP, the anterior chamber was cannulated with a 31-gauge needle and connected to a reservoir filled with balanced salt solution (BSS PLUS, Alcon Laboratories Inc.). The height of the reservoir was adjustable to increase and decrease IOP (Fig. 1), which was monitored by a calibrated pressure transducer (Harvard Apparatus, Model 724436). Mean arterial blood pressure was continuously monitored by noninvasive CODA tail-cuff tonometry (Kent Scientific, Torrington, Connecticut).
For each imaging session, IOP was increased, starting at 10 mmHg (baseline), in 10-mmHg increments up to 100 mmHg, which was empirically comparable to the measured mean arterial pressure.14 At each IOP level, 3 min were allowed for stabilization before acquiring images. Following 100 mmHg, IOP was returned to baseline, to ascertain recovery from the acute IOP elevation.
All experimental procedures complied with the Association for Research in Vision and Ophthalmology Statement for the Use of Animals in Ophthalmic and Vision Research. The protocols were approved by the Institutional Animal Care and Use Committee (IACUC) of the Oregon Health & Science University (OHSU).
2.2. Image Acquisition
A previously reported fiber-based 50-kHz vis-OCT prototype,31 custom-built by the Center for Ophthalmic Optics and Lasers at OHSU, was used in this study. To analyze , the system wavelength spans from 510 to 610 nm, covering the high absorption contrast region of hemoglobin. The incident power on the cornea was 0.8 mw. A GPU-based real-time interface for visualizing structural and angiographic OCT was used to assist image acquisition.33 The axial resolution was calibrated as in tissue with a maximum sensitivity of 89 dB.
At each IOP level, a volumetric raster scan was acquired for angiography and analysis and three sets of dual-circular scans were acquired for total retinal blood flow measurement. The volumetric raster scan was taken in a field of view. In the fast transverse () scanning direction, 512 axial scans were sampled to form a B-scan. Three consecutive B-scans were captured before moving to the next slow axis () position for motion contrast in OCTA. A total of 512 positions were sampled. The dual circular scans (, ) around the optic disc consisted of 4096 A-lines for each circle with 30 repetitions. The dual circular scan transected all retinal major arteries and veins. The whole experiment for full IOP regulation on a single rat was completed within .
2.3. Data Processing
Postprocessing was performed in the MATLAB platform. The recorded interferometric fringe was processed by DC subtraction, lambda-to-k resampling, and dispersion compensation successively. After that, the dataset was applied by fast Fourier transform to retrieve the depth-resolved structural information.34 Retinal layers were segmented by searching the boundaries automatically and correcting with manual assistance.35
The OCTAs were generated with the split-spectrum amplitude decorrelation algorithm (SSADA) on the volumetric raster scans.8 The vascular/capillary plexuses were then generated by projecting the flow signal within specific slabs. For the superficial vascular plexus (SVP), a slab containing the NFL and ganglion cell layer (GCL) was used. For the intermediate capillary plexus (ICP) and deep capillary plexus (DCP), slabs corresponding to the inner and outer boundaries, respectively, of the inner nuclear layer (INL) were used. The en face images of the vascular plexuses were enhanced by a Gabor filter, and then a Frangi multiscale vessel filter36 was used to delineate the vessel binary mask. The vessel density was calculated as the percentage of area occupied by vascular pixels.
The procedure of measuring was detailed in our previous report.25 Briefly, oxygen saturation is the concentration ratio of oxygenated hemoglobin to total hemoglobin and can be expressed as , where and indicate the concentration of oxygenated and deoxygenated hemoglobin, respectively. To obtain , we fit the obtained OCT spectrum at the posterior vascular pixels25,37 to a model15,38 [Eq. (1)] that contains the absorption features and concentrations of oxygenated and deoxygenated hemoglobin
| (1) |
Here, the spatial- and depth-resolved optical density is defined as the logarithm of the ratio of the reflected intensity spectrum to the source spectrum , where can be calculated by short time Fourier transform spectroscopic analysis to the preprocessed interferometric fringe. Here, is the accumulated absorption length in depth for the selected vessel posterior voxels; and are the wavelength-independent constants, and the extinction coefficients are taken from the literature.39
The blood flow () for each major vessel was determined from dual circular scans according to40
| (2) |
Here, the blood flow velocity () distribution can be calculated from , where is the Doppler phase shift between ultrahigh sampling density adjacent A-lines in the B-scan corrected with automated phase unwrapping.41 Vessel Doppler angle (rad) was calculated from the vessel position shifts between the inner circular scan and the outer circular scan. Given the sampling rate , center wavelength , and refractive index , the blood flow velocity can be calculated as . Mean blood flow velocity can then be obtained by averaging over the vessel region within entire pulsatile periods. The vessel cross-sectional area perpendicular to the flow direction is calculated as with the diameter determined by the axial span of the vessel region.
Oxygen metabolic rate is defined as the oxygen consumption of the tissue over time, which can be deduced from the difference between oxygen content supplied by arteries and that carried away by veins per unit time.27,32,40 In the inner retina, the oxygen demand is supplied by the retinal circulation, where, in the rat eye, all major arteries and veins enter the eye ventral to the optic disc.13,42 Thus, the retina oxygen metabolic rate can be quantified as
| (3) |
where and are the molecular weights of () and oxygenated hemoglobin (), respectively. The total hemoglobin concentration in blood is for rats. The and TRBF are the measured oxygen saturation and total retina blood flow with subscripts and denoting the arteries and veins, respectively. The difference of oxygen transported in by the arteries and transported out by the veins is considered as the amount consumed by retinal metabolism.
3. Results
The blood pressure was recorded every 5 min throughout the experiments. The mean systolic () and diastolic () blood pressure for this group of rats was measured as and , respectively. The heart rate was . No systemic blood pressure or heart rate changes were found with IOP elevation.
Overall, the observed retinal vascular responses were similar to a previous report.14 The capillary filling was well maintained at IOPs lower than 70 mmHg. At IOPs above 70 mmHg, the diameters of major vessels were significantly reduced and the capillaries were progressively unperfused and invisible in all vascular plexuses. These responses were reversible, as the major vessels and capillaries were reperfused when the IOP returned to the 10-mmHg baseline (B10 column in all figures). Additional features, such as arterial flow reversal and increased oxygen extraction compensation during periods of reduced blood flow, were revealed in this study.
To quantitate the retinal responses to acute IOP elevation, we will present results for reflectivity, angiography, blood flow, oxygen saturation, and oxygen metabolism sequentially. Unless specified otherwise, the values were measured on all eyes with standard deviations calculated over the entire population. Paired sample -test was used to assess the significance of the measured metrics at each IOP level compared to the baseline.
3.1. Reflectivity
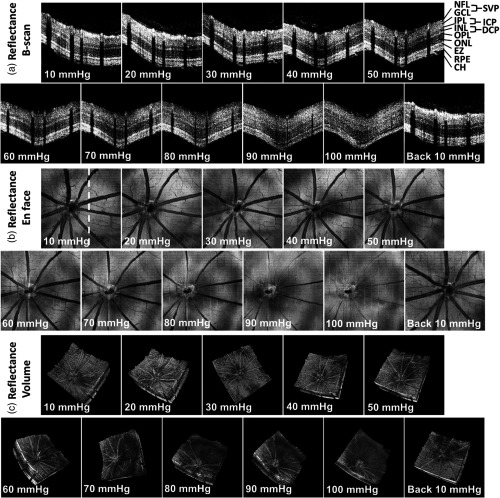
As shown in Fig. 2, the boundaries of the different retinal layers became vague and hard to distinguish at higher IOPs. In addition, the reflectivity of retinal layers was largely reduced at high IOP levels, especially for the NFL. In normal conditions, the NFL is highly reflective and has extraordinary reflectance amplitude shown by structural OCT. However, as shown in the volumetric visualization [Fig. 2(c)], the brightness of the NFL layer diminished as IOP increased. To remove the effect of potential defocus and aberrations due to tissue bending at and to examine the dynamic changes of NFL more objectively, we calculated the relative reflectance (the mean reflectance of the NFL normalized by the mean reflectance of the entire retina). This decreased from at to and at IOPs of 70 and 100 mmHg, respectively, and returned to with IOP back to 10 mmHg.
Fig. 2.
Reflectivity of the retinal NFL is reduced with acute IOP elevation, as demonstrated by sequential darkening in (a) B-scans, (b) en face images (), and (c) volumetric visualization. Each B-scan was averaged by three repeated frames. The white dashed line in (b) indicates the position of B-scans in (a). NFL, nerve fiber layer; IPL, inner plexiform layer; INL, inner nuclear layer; OPL, outer plexiform layer; ONL, outer nuclear layer; EZ, ellipsoid zone; RPE, retinal pigment epithelium; CH, choroid; SVP, superficial vascular plexus; ICP, intermediate capillary plexus; and DCP, deep capillary plexus.
3.2. Angiography
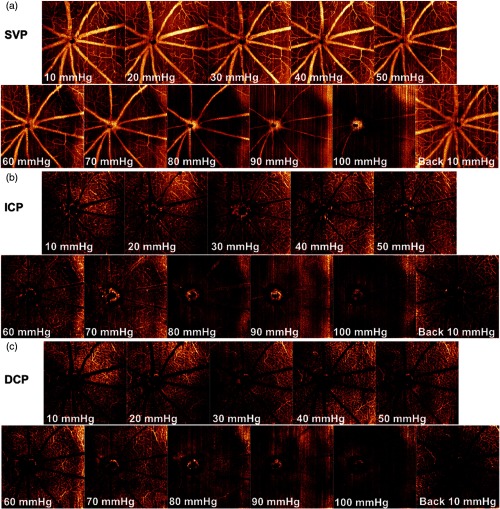
To visualize the responses of vascular perfusion clearly, retinal layers were segmented and en face images of SVP, ICP, and DCP were obtained by projecting the specific slabs described in Sec. 2.3. Figure 3 illustrates that capillary perfusion was well maintained for all three plexuses until IOP exceeded 70 mmHg. Above this, perfusion decreased dramatically, becoming invisible at 90 and 100 mmHg.
Fig. 3.
En face images () showing retinal vascular perfusion responses to acute IOP elevation. (a) SVP en face images were generated from the slabs containing NFL and GCL with first-15-maximum projection. (b) ICP en face images were generated from the slabs adjacent to the inner boundary of the INL with first-15-maximum projection. (c) DCP en face images were generated from the slabs adjacent to the outer boundary of the INL with first-15-maximum projection.
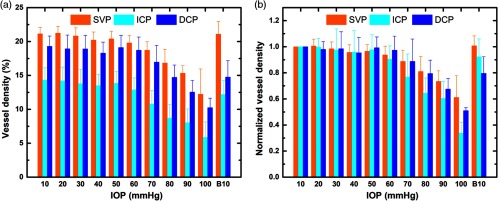
To quantitate the vascular perfusion during IOP elevation, vessel density was calculated as the percentage of the field of view covered by microvasculature. At baseline, the vessel densities were , , and for SVP, ICP, and DCP, respectively. Overall, vessel densities were reduced at high IOPs and recovered when the IOP returned to 10 mmHg [Fig. 4(a)].
Fig. 4.
The (a) actual and (b) normalized to baseline (10 mmHg) vessel densities of the three vascular/capillary plexuses SVP, ICP, and DCP at all IOP levels.
The vessel densities were normalized by baseline values to minimize population variation [Fig. 4(b)]. The normalized vessel densities remained at low IOPs and were significantly affected for IOPs greater than or equal to 70 mmHg ( at ), consistent with a previous report.14 From visual inspection of en face images in Fig. 3, it is clear that the vascular perfusion diminished quickly and the capillaries were hardly seen at IOP levels beyond 70 mmHg. Nonzero vessel densities calculated at these high IOP levels were likely due to the enhanced flow artifacts (background noise) by the vesselness filter36 used before generating vascular binary images.
3.3. Blood Flow
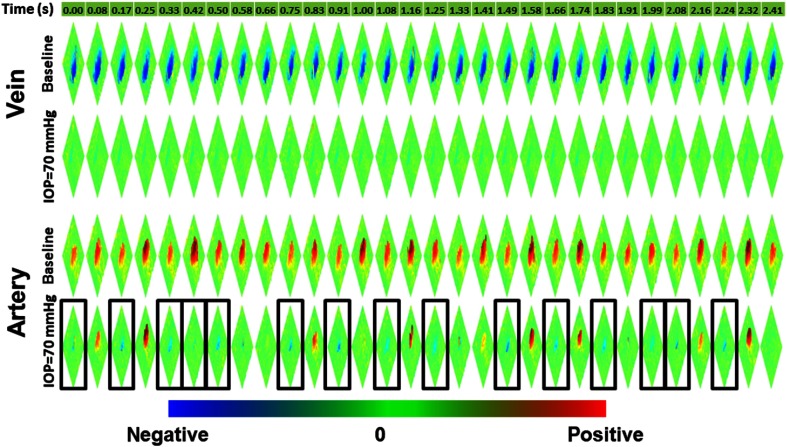
Arteries and veins were differentiated by their opposite flow directions in relation to the optic disc. Doppler OCT frames with reversal of arterial flow were found to appear at IOP of 50 mmHg occasionally and were more frequent at higher IOPs. The reversal could be appreciated by comparing the blood flow velocity distributions from a vein and an artery at and (Fig. 5). Venous blood flow velocities dropped evenly at all frames and remained negative at . However, arterial blood flow velocities were positive at baseline in all frames, but decreased and reversed to negative at in 15 frames (black boxes) out of the total 30 frames.
Fig. 5.
Arterial flow reversal at shown by a series of Doppler OCT (30 frames within 2.4 s) of a representative artery, compared to the constant flow direction in a vein. Doppler OCT images with arterial flow reversal are annotated with black boxes. Red: positive blood flow. Blue: negative blood flow.
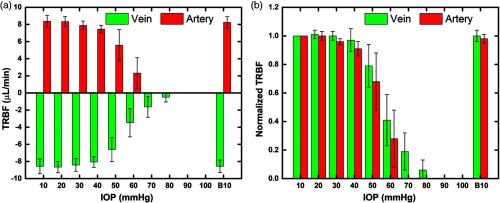
The blood flow for all major retinal vessels was calculated from the dual circular Doppler scans, as described in Sec. 2.3. The total retinal blood flow (TRBF) for arteries and veins was summed up in all major arteries and veins, respectively. The TRBF at was measured at for arteries and for veins [Fig. 6(a)], where positive and negative values indicate flow into and out of the retina, respectively. At high IOP levels, the blood flow was suspended as TRBF approached zero. Owing to the presence of flow reversal in most arteries at IOPs of 70 and 80 mmHg, current frame rate () was not considered able to fully sample this highly irregular dynamic pattern. Therefore, arterial TRBF for these two time points were not included. Furthermore, TRBF was not measurable at IOPs of 90 and 100 mmHg because absent blood flow prevented identification of vessel cross sections.
Fig. 6.
Response of actual (a) and normalized (b) TRBF to the acute IOP elevation. Data points for arterial flow on IOPs of 70 and 80 mmHg were not recorded due to the impact of flow reversal. Data points on IOPs of 90 and 100 mmHg were not available due to severe perfusion loss. TRBF decreased as IOP was elevated and recovered as IOP was returned to 10 mmHg.
Retinal blood flow response to IOP elevation was also revealed by TRBF values normalized to their baselines. As shown in Fig. 6(b), normalized TRBF was set to 1.0 at baseline and remained unaffected at IOPs ( for arteries at ; for veins at IOP ). At 60 mmHg, the normalized TRBF dropped to , even though capillary perfusion (Fig. 4) was unaffected at this pressure. When IOP returned to 10 mmHg, the normalized TRBF recovered to and for arteries and veins, respectively. This retinal blood flow response to elevated IOP was also consistent with a previous report.14
3.4. Oxygen Saturation
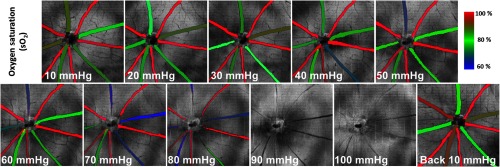
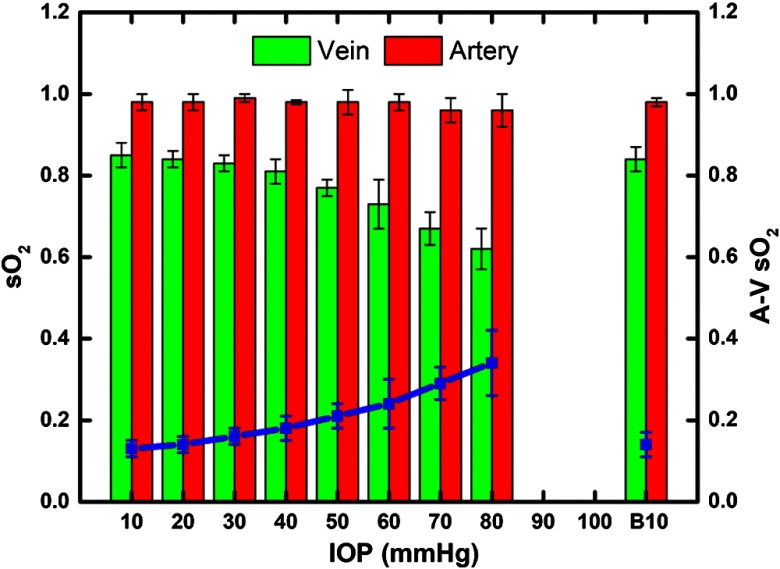
The identification of arteries and veins by level of oxygen saturation agreed with that as determined by the direction of blood flow in all eyes. The in all arteries and veins within each eye was then averaged as the measured arterial and venous level in that eye. The was not measurable at IOPs of 90 and 100 mmHg due to insufficient vascular filling. As shown in Fig. 7, the arterial remained nearly 100% at all IOP levels, whereas venous decreased with higher IOPs ( at ).
Fig. 7.
The measured overlaid with en face images () of retinal vessels at each IOP level. Note that the measurements at and 100 mmHg were not available due to severe nonperfusion.
The oxygen extraction A-V , calculated as the difference between arterial and venous , increased from at baseline to at (Fig. 8). Moreover, this increase seemed to be nonlinear, with increments of 1%, 2%, 3%, 3%, 3%, 5%, and 5% as IOP levels increased from 20 to 80 mmHg. Restoration of A-V was also observed as IOP returned to baseline.
Fig. 8.
Retinal response of in major vessels to acute IOP elevation. As IOP increases, the venous drops in nonlinear fashion while arterial is well maintained, resulting in an increased oxygen extraction (A-V ). Data points at IOPs of 90 and 100 mmHg were not obtainable due to severe nonperfusion.
3.5. Oxygen Metabolism
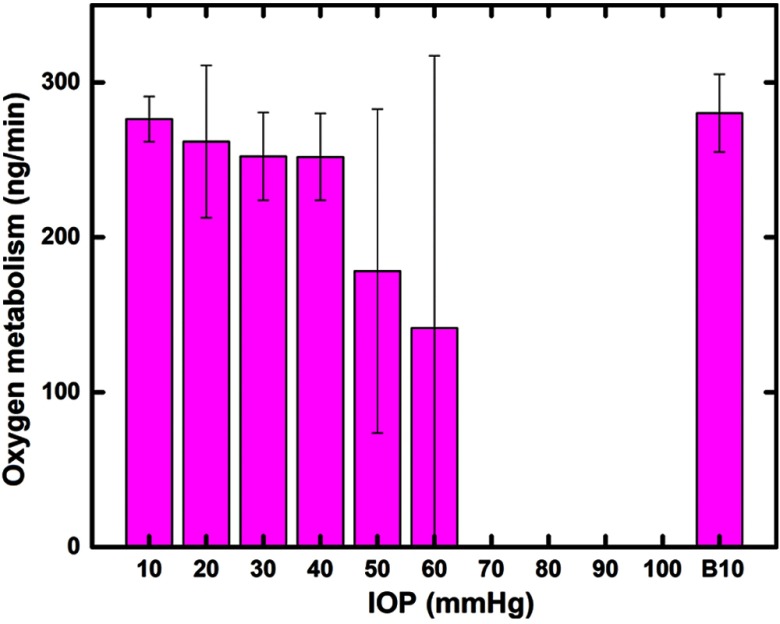
Total retina oxygen metabolic rate was calculated as at baseline and remained until IOP exceeded 40 mmHg (Fig. 9). At IOPs of 50 and 60 mmHg, the arterial blood flow reversal, mentioned above, began to appear sporadically in some frames in some vessels. These reversals, which contributed to the significantly decreased arterial blood supply in Fig. 6(b), produced a reduced calculated oxygen metabolism at these IOP levels, despite the increased oxygen extraction (Fig. 8). However, response to acute IOP elevation differed among subjects, which caused a large variation in calculated oxygen metabolism. The measurements at IOPs of 70 to 100 mmHg were not obtainable due to the lack of blood flow and oxygen saturation results.
Fig. 9.
Calculated retinal response of oxygen metabolism rate to acute IOP elevation. The measurements at IOPs of 70 to 100 mmHg were not attainable due to the lack of blood flow or oxygen saturation results.
4. Discussion
Existing studies offer a nuanced view of retinal function and its disruption in response to elevated IOP. Different regions, such as the NFL,43 ganglion cell,44 lamina cribrosa,45 and retinal pigment epithelium,46 respond uniquely to acutely elevated IOP. Furthermore, the effects may differ with age.47,48 Different metrics, such as retinal layer thickness,49 retinal capillary density,14 birefringence,50 or gene expression,51 can be affected to different degrees by IOP elevation. We believe that vis-OCT, which has the ability to provide structural information, as well as data on perfusion of major retinal vessels and capillary beds and total retinal blood flow, oximetry, oxygen extraction, and oxygen metabolism, offers several advantages that may help in understanding these phenomena.
Our vis-OCT system provided an opportunity to compare capillary bed filling to TRBF over a range of IOPs, revealing that capillary filling was maintained up to an IOP of 70 mmHg, despite a reduction in TRBF. This is in agreement with prior work using a different system,14 where the authors proposed that this would result in slowing of red blood cell transit through capillaries, a situation that may allow greater oxygen extraction. It was suggested that this could help explain electrophysiological observations from other groups in which several components of the electroretinogram (ERG) were unaffected by IOPs up to 70 mmHg, leading to the proposal that this maintenance of function was accomplished by increased oxygen extraction.52–54 Our study using vis-OCT, which has the capability of measuring blood oxygen content, provides strong support for this possibility, showing a nonlinear increase in oxygen extraction within this pressure range.
The higher resolution of vis-OCT, accompanied by close examination of Doppler scans, has allowed us to document, for the first time, the reversal of arterial flow. This reversal started on single B-scan frames of some arteries at and occurred frequently at IOPs of 70 and 80 mmHg. Given the mean systolic and diastolic blood pressures of and , we suspect that this reversal may be due to the negative ocular perfusion pressure OPP (OPP = BP-IOP) during diastole. This is consistent with prior observations that the IOP threshold for reducing retinal capillary filling is lower in animals with lower systemic blood pressure14 and that reduced systemic blood pressure can increase the risk of producing glaucoma in nonhuman primates.55 In terms of the arterial TRBF at IOPs of 70 and 80 mmHg, we suspect that the frame rate of the current system was not sufficient to fully reveal these irregular arterial flow patterns along the cardiac cycles. Thus, a higher speed OCT system that can provide a frame rate of (considering a cardiac cycle of for rats) will be needed to objectively measure the effect of flow reversals on arterial TRBF.
Retinal oxygen metabolism was determined by considering the difference of transported oxygen between arteries and veins. This relies on the assumption that the retina is in steady state and TRBF in arteries and veins are approximately equal. While this is satisfied in most situations, reversal of arterial blood flow occurs at higher levels of acute IOP elevation, contributing to a reduction in calculated oxygen metabolism so that, by 70 mmHg, this calculation is not reliable. This is consistent with reports that exposure to elevated IOP for 90 min does not produce irreversible alterations in the ERG or morphological evidence of retinal damage until the pressure equals or exceeds 70 mmHg.54 However, it is unclear what the physiological impact is, if any, of the wide fluctuations in metabolism seen at levels of 50 and 60 mmHg.
Since the oximetry measurements performed here are limited to major retinal arteries and veins, the resulting metabolism calculations are at best a reflection of average retinal performance and do not provide insights into possible variations in different regions or layers of the retina. Given that retinal damage in human glaucoma and in glaucoma models can be regional,51,56–58 and that the inner retina is preferentially affected, improvements in vis-OCT that will allow us to perform quantitative OCT angiography, velocimetry, and oximetry23,59 at the capillary level will be needed in order to develop a more accurate understanding of how IOP affects oxygen metabolism, particularly in these intermediate pressure ranges. In addition, an alternate way to verify the activation of other bypass pathways of oxygen supply for the inner retina is to measure the oxygen pressure () axial profile with microelectrodes.60 We could then compare the measured axial profile in these extreme conditions with that measured in normal conditions to see if there is any change in depth distributions.
The findings in this study are based on an acute IOP elevation protocol. It would be important to know if these results were duplicated in an animal model undergoing longer periods of controlled IOP elevation. In addition, these observations on the retinal vasculature do not specifically address events within the optic nerve head, the site of initial glaucomatous injury, although earlier OCTA work indicates that perfusion responses in response to IOP in these two regions may be similar.13 Regardless, chronic glaucomatous injury, which damages retinal ganglion cells, may significantly affect the vascular responses and tissue oxygenation within the retina. Further study of these effects may provide important insights into how retinal susceptibility to IOP can be affected in patients with chronic glaucoma.
5. Conclusion
We imaged rat retinas with acute IOP elevation using a vis-OCT system, monitoring structural reflectance, angiographic vascular perfusion, and retinal blood flow, as well as quantitative measurements of retinal oxygen extraction and oxygen metabolism to characterize the retinal responses to elevated IOP. A trend toward decreasing TRBF was observed with increasing IOP. To compensate, retinal blood oxygen extraction was found to increase in order to maintain retinal oxygen demand. Our findings confirm previous reports and provide new insights into retinal responses to acute IOP elevation, which will improve our understanding of the effect of elevated IOP on the retinal vasculature.
Acknowledgments
This work was supported by Grant Nos. R01 EY027833, DP3 DK104397, R01 EY024544, R01 EY023285, R01 EY010145, and P30 EY010572 from the National Institutes of Health (Bethesda, Maryland), an unrestricted departmental funding grant, and a William & Mary Greve Special Scholar Award from Research to Prevent Blindness (New York, New York).
Biography
Biographies of the authors are not available.
Disclosures
David Huang: Optovue Inc. (F, I, P, R). Yali Jia: Optovue Inc. (F, P). Acner Camino: Optovue Inc. (P). Oregon Health & Science University, Acner Camino, Yali Jia, and David Huang have financial interest in Optovue Inc., a company that may have a commercial interest in the results of this research and technology. These potential conflicts of interest have been reviewed and managed by OHSU. Other authors do not have financial interest in this article.
References
- 1.Sommer A., et al. , “Relationship between intraocular pressure and primary open angle glaucoma among white and black Americans: the Baltimore eye survey,” Arch. Ophthalmol. 109, 1090–1095 (1991). 10.1001/archopht.1991.01080080050026 [DOI] [PubMed] [Google Scholar]
- 2.Heijl A., et al. , “Reduction of intraocular pressure and glaucoma progression: results from the early manifest glaucoma trial,” Arch. Ophthalmol. 120, 1268–1279 (2002). 10.1001/archopht.120.10.1268 [DOI] [PubMed] [Google Scholar]
- 3.van der Valk R., et al. , “Intraocular pressure-lowering effects of all commonly used glaucoma drugs: a meta-analysis of randomized clinical trials,” Ophthalmology 112, 1177–1185 (2005). 10.1016/j.ophtha.2005.01.042 [DOI] [PubMed] [Google Scholar]
- 4.Morrison J. C., et al. , “Understanding mechanisms of pressure-induced optic nerve damage,” Prog. Retinal Eye Res. 24, 217–240 (2005). 10.1016/j.preteyeres.2004.08.003 [DOI] [PubMed] [Google Scholar]
- 5.Huang D., et al. , “Optical coherence tomography,” Science 254, 1178–1181 (1991). 10.1126/science.1957169 [DOI] [PMC free article] [PubMed] [Google Scholar]
- 6.Jia Y., et al. , “Optical coherence tomography angiography of optic disc perfusion in glaucoma,” Ophthalmology 121, 1322–1332 (2014). 10.1016/j.ophtha.2014.01.021 [DOI] [PMC free article] [PubMed] [Google Scholar]
- 7.Quigley H. A., “Neuronal death in glaucoma,” Prog. Retinal Eye Res. 18, 39–57 (1999). 10.1016/S1350-9462(98)00014-7 [DOI] [PubMed] [Google Scholar]
- 8.Jia Y., et al. , “Split-spectrum amplitude-decorrelation angiography with optical coherence tomography,” Opt. Express 20, 4710–4725 (2012). 10.1364/OE.20.004710 [DOI] [PMC free article] [PubMed] [Google Scholar]
- 9.Jia Y., et al. , “Wide-field OCT angiography investigation of the relationship between radial peripapillary capillary plexus density and nerve fiber layer thickness,” Invest. Ophthalmol. Visual Sci. 58, 5188–5194 (2017). 10.1167/iovs.17-22593 [DOI] [PMC free article] [PubMed] [Google Scholar]
- 10.Liu L., et al. , “Optical coherence tomography angiography of the peripapillary retina in glaucoma,” JAMA Ophthalmol. 133, 1045–1052 (2015). 10.1001/jamaophthalmol.2015.2225 [DOI] [PMC free article] [PubMed] [Google Scholar]
- 11.Takusagawa H. L., et al. , “Projection-resolved optical coherence tomography angiography of macular retinal circulation in glaucoma,” Ophthalmology 124, 1589–1599 (2017). 10.1016/j.ophtha.2017.06.002 [DOI] [PMC free article] [PubMed] [Google Scholar]
- 12.Suh M. H., et al. , “Deep retinal layer microvasculature dropout detected by the optical coherence tomography angiography in glaucoma,” Ophthalmology 123, 2509–2518 (2016). 10.1016/j.ophtha.2016.09.002 [DOI] [PMC free article] [PubMed] [Google Scholar]
- 13.Zhi Z., et al. , “Impact of intraocular pressure on changes of blood flow in the retina, choroid, and optic nerve head in rats investigated by optical microangiography,” Biomed. Opt. Express 3, 2220–2233 (2012). 10.1364/BOE.3.002220 [DOI] [PMC free article] [PubMed] [Google Scholar]
- 14.Zhi Z., et al. , “Evaluation of the effect of elevated intraocular pressure and reduced ocular perfusion pressure on retinal capillary bed filling and total retinal blood flow in rats by OMAG/OCT,” Microvasc. Res. 101, 86–95 (2015). 10.1016/j.mvr.2015.07.001 [DOI] [PMC free article] [PubMed] [Google Scholar]
- 15.Yi J., et al. , “Visible-light optical coherence tomography for retinal oximetry,” Opt. Lett. 38, 1796–1798 (2013). 10.1364/OL.38.001796 [DOI] [PMC free article] [PubMed] [Google Scholar]
- 16.Shu X., Beckmann L. J., Zhang H. F., “Visible-light optical coherence tomography: a review,” J. Biomed. Opt. 22, 121707 (2017). 10.1117/1.JBO.22.12.121707 [DOI] [PMC free article] [PubMed] [Google Scholar]
- 17.Chong S. P., et al. , “Structural and functional human retinal imaging with a fiber-based visible light OCT ophthalmoscope,” Biomed. Opt. Express 8, 323–337 (2017). 10.1364/BOE.8.000323 [DOI] [PMC free article] [PubMed] [Google Scholar]
- 18.Nafar Z., Wen R., Jiao S., “Visible light OCT-based quantitative imaging of lipofuscin in the retinal pigment epithelium with standard reference targets,” Biomed. Opt. Express 9, 3768–3782 (2018). 10.1364/BOE.9.003768 [DOI] [PMC free article] [PubMed] [Google Scholar]
- 19.Yi J., et al. , “Human retinal imaging using visible-light optical coherence tomography guided by scanning laser ophthalmoscopy,” Biomed. Opt. Express 6, 3701–3713 (2015). 10.1364/BOE.6.003701 [DOI] [PMC free article] [PubMed] [Google Scholar]
- 20.Chong S. P., et al. , “Ultrahigh resolution retinal imaging by visible light OCT with longitudinal achromatization,” Biomed. Opt. Express 9, 1477–1491 (2018). 10.1364/BOE.9.001477 [DOI] [PMC free article] [PubMed] [Google Scholar]
- 21.Kho A., Srinivasan V. J., “Compensating spatially dependent dispersion in visible light OCT,” Opt. Lett. 44, 775–778 (2019). 10.1364/OL.44.000775 [DOI] [PMC free article] [PubMed] [Google Scholar]
- 22.Chong S. P., et al. , “Quantitative microvascular hemoglobin mapping using visible light spectroscopic optical coherence tomography,” Biomed. Opt. Express 6, 1429–1450 (2015). 10.1364/BOE.6.001429 [DOI] [PMC free article] [PubMed] [Google Scholar]
- 23.Chen S., Yi J., Zhang H. F., “Measuring oxygen saturation in retinal and choroidal circulations in rats using visible light optical coherence tomography angiography,” Biomed. Opt. Express 6, 2840–2853 (2015). 10.1364/BOE.6.002840 [DOI] [PMC free article] [PubMed] [Google Scholar]
- 24.Liu R., et al. , “Quantitative quality-control metrics for in vivo oximetry in small vessels by visible light optical coherence tomography angiography,” Biomed. Opt. Express 10, 465–486 (2019). 10.1364/BOE.10.000465 [DOI] [PMC free article] [PubMed] [Google Scholar]
- 25.Pi S., et al. , “Automated spectroscopic retinal oximetry with visible-light optical coherence tomography,” Biomed. Opt. Express 9, 2056–2067 (2018). 10.1364/BOE.9.002056 [DOI] [PMC free article] [PubMed] [Google Scholar]
- 26.Chen S., et al. , “Retinal oximetry in humans using visible-light optical coherence tomography,” Biomed. Opt. Express 8, 1415–1429 (2017). 10.1364/BOE.8.001415 [DOI] [PMC free article] [PubMed] [Google Scholar]
- 27.Yi J., et al. , “Visible light optical coherence tomography measures retinal oxygen metabolic response to systemic oxygenation,” Light Sci. Appl. 4, e334 (2015). 10.1038/lsa.2015.107 [DOI] [PMC free article] [PubMed] [Google Scholar]
- 28.Liu W., et al. , “Increased retinal oxygen metabolism precedes microvascular alterations in type 1 diabetic mice,” Invest. Ophthalmol. Visual Sci. 58, 981–989 (2017). 10.1167/iovs.16-20600 [DOI] [PMC free article] [PubMed] [Google Scholar]
- 29.Song W., et al. , “Fiber-based visible and near infrared optical coherence tomography (vnOCT) enables quantitative elastic light scattering spectroscopy in human retina,” Biomed. Opt. Express 9, 3464–3480 (2018). 10.1364/BOE.9.003464 [DOI] [PMC free article] [PubMed] [Google Scholar]
- 30.Song W., et al. , “Wavelength-dependent optical properties of melanosomes in retinal pigmented epithelium and their changes with melanin bleaching: a numerical study,” Biomed. Opt. Express 8, 3966–3980 (2017). 10.1364/BOE.8.003966 [DOI] [PMC free article] [PubMed] [Google Scholar]
- 31.Pi S., et al. , “Angiographic and structural imaging using high axial resolution fiber-based visible-light OCT,” Biomed. Opt. Express 8, 4595–4608 (2017). 10.1364/BOE.8.004595 [DOI] [PMC free article] [PubMed] [Google Scholar]
- 32.Pi S., et al. , “Rodent retinal circulation organization and oxygen metabolism revealed by visible-light optical coherence tomography,” Biomed. Opt. Express 9, 5851–5862 (2018). 10.1364/BOE.9.005851 [DOI] [PMC free article] [PubMed] [Google Scholar]
- 33.Wei X., et al. , “Real-time cross-sectional and en face OCT angiography guiding high-quality scan acquisition,” Opt. Lett. 44, 1431–1434 (2019). 10.1364/OL.44.001431 [DOI] [PMC free article] [PubMed] [Google Scholar]
- 34.Wojtkowski M., et al. , “Ultrahigh-resolution, high-speed, Fourier domain optical coherence tomography and methods for dispersion compensation,” Opt. Express 12, 2404–2422 (2004). 10.1364/OPEX.12.002404 [DOI] [PubMed] [Google Scholar]
- 35.Guo Y., et al. , “Automated segmentation of retinal layer boundaries and capillary plexuses in wide-field optical coherence tomographic angiography,” Biomed. Opt. Express 9, 4429–4442 (2018). 10.1364/BOE.9.004429 [DOI] [PMC free article] [PubMed] [Google Scholar]
- 36.Frangi A. F., et al. , “Multiscale vessel enhancement filtering,” Lect. Notes Comput. Sci. 1496, 130–137 (1998). 10.1007/BFb0056181 [DOI] [Google Scholar]
- 37.Soetikno B. T., et al. , “Visible-light optical coherence tomography oximetry based on circumpapillary scan and graph-search segmentation,” Biomed. Opt. Express 9, 3640–3652 (2018). 10.1364/BOE.9.003640 [DOI] [PMC free article] [PubMed] [Google Scholar]
- 38.Yi J., Backman V., “Imaging a full set of optical scattering properties of biological tissue by inverse spectroscopic optical coherence tomography,” Opt. Lett. 37, 4443–4445 (2012). 10.1364/OL.37.004443 [DOI] [PMC free article] [PubMed] [Google Scholar]
- 39.Bosschaart N., et al. , “A literature review and novel theoretical approach on the optical properties of whole blood,” Lasers Med. Sci. 29, 453–479 (2014). 10.1007/s10103-013-1446-7 [DOI] [PMC free article] [PubMed] [Google Scholar]
- 40.Song W., et al. , “A combined method to quantify the retinal metabolic rate of oxygen using photoacoustic ophthalmoscopy and optical coherence tomography,” Sci. Rep. 4, 6525 (2014). 10.1038/srep06525 [DOI] [PMC free article] [PubMed] [Google Scholar]
- 41.Pi S., et al. , “Automated phase unwrapping in Doppler optical coherence tomography,” J. Biomed. Opt. 24, 010502 (2019). 10.1117/1.JBO.24.1.010502 [DOI] [PMC free article] [PubMed] [Google Scholar]
- 42.Pazos M., et al. , “Rat optic nerve head anatomy within 3D histomorphometric reconstructions of normal control eyes,” Exp. Eye Res. 139, 1–12 (2015). 10.1016/j.exer.2015.05.011 [DOI] [PMC free article] [PubMed] [Google Scholar]
- 43.Abbott C. J., et al. , “Evaluation of retinal nerve fiber layer thickness and axonal transport 1 and 2 weeks after 8 hours of acute intraocular pressure elevation in rats,” Invest. Ophthalmol. Visual Sci. 55, 674–687 (2014). 10.1167/iovs.13-12811 [DOI] [PMC free article] [PubMed] [Google Scholar]
- 44.Crowston J. G., et al. , “An acute intraocular pressure challenge to assess retinal ganglion cell injury and recovery in the mouse,” Exp. Eye Res. 141, 3–8 (2015). 10.1016/j.exer.2015.03.006 [DOI] [PubMed] [Google Scholar]
- 45.Tun T. A., et al. , “Shape changes of the anterior lamina cribrosa in normal, ocular hypertensive, and glaucomatous eyes following acute intraocular pressure elevation,” Invest. Ophthalmol. Visual Sci. 57, 4869–4877 (2016). 10.1167/iovs.16-19753 [DOI] [PubMed] [Google Scholar]
- 46.Wang Y. X., et al. , “Acute peripapillary retinal pigment epithelium changes associated with acute intraocular pressure elevation,” Ophthalmology 122, 2022–2028 (2015). 10.1016/j.ophtha.2015.06.005 [DOI] [PubMed] [Google Scholar]
- 47.Jiang X., et al. , “The effect of age on the response of retinal capillary filling to changes in intraocular pressure measured by optical coherence tomography angiography,” Microvasc. Res. 115, 12–19 (2018). 10.1016/j.mvr.2017.08.001 [DOI] [PMC free article] [PubMed] [Google Scholar]
- 48.Lim J. K., et al. , “The effect of ageing on ocular blood flow, oxygen tension and retinal function during and after intraocular pressure elevation,” PLoS One 9, e98393 (2014). 10.1371/journal.pone.0098393 [DOI] [PMC free article] [PubMed] [Google Scholar]
- 49.Fortune B., et al. , “The effect of acute intraocular pressure elevation on peripapillary retinal thickness, retinal nerve fiber layer thickness, and retardance,” Invest. Ophthalmol. Visual Sci. 50, 4719–4726 (2009). 10.1167/iovs.08-3289 [DOI] [PMC free article] [PubMed] [Google Scholar]
- 50.Fialová S., et al. , “Posterior rat eye during acute intraocular pressure elevation studied using polarization sensitive optical coherence tomography,” Biomed. Opt. Express 8, 298–314 (2017). 10.1364/BOE.8.000298 [DOI] [PMC free article] [PubMed] [Google Scholar]
- 51.Morrison J. C., et al. , “A period of controlled elevation of IOP (CEI) produces the specific gene expression responses and focal injury pattern of experimental rat glaucoma,” Invest. Ophthalmol. Visual Sci. 57, 6700–6711 (2016). 10.1167/iovs.16-20573 [DOI] [PMC free article] [PubMed] [Google Scholar]
- 52.He Z., et al. , “Blood pressure modifies retinal susceptibility to intraocular pressure elevation,” PLoS One 7, e31104 (2012). 10.1371/journal.pone.0031104 [DOI] [PMC free article] [PubMed] [Google Scholar]
- 53.He Z., et al. , “Coupling blood flow and neural function in the retina: a model for homeostatic responses to ocular perfusion pressure challenge,” Physiol. Rep. 1, e00055 (2013). 10.1002/phy2.55 [DOI] [PMC free article] [PubMed] [Google Scholar]
- 54.Bui B. V., et al. , “Relationship between the magnitude of intraocular pressure during an episode of acute elevation and retinal damage four weeks later in rats,” PLoS One 8, e70513 (2013). 10.1371/journal.pone.0070513 [DOI] [PMC free article] [PubMed] [Google Scholar]
- 55.Liang Y., et al. , “Impact of systemic blood pressure on the relationship between intraocular pressure and blood flow in the optic nerve head of nonhuman primates,” Invest. Ophthalmol. Visual Sci. 50, 2154–2160 (2009). 10.1167/iovs.08-2882 [DOI] [PubMed] [Google Scholar]
- 56.Morrison J. C., et al. , “A rat model of chronic pressure-induced optic nerve damage,” Exp. Eye Res. 64, 85–96 (1997). 10.1006/exer.1996.0184 [DOI] [PubMed] [Google Scholar]
- 57.Schlamp C. L., et al. , “Progressive ganglion cell loss and optic nerve degeneration in DBA/2J mice is variable and asymmetric,” BMC Neurosci. 7, 66 (2006). 10.1186/1471-2202-7-66 [DOI] [PMC free article] [PubMed] [Google Scholar]
- 58.Quigley H. A., Green W. R., “The histology of human glaucoma cupping and optic nerve damage: clinicopathologic correlation in 21 eyes,” Ophthalmology 86, 1803–1827 (1979). 10.1016/S0161-6420(79)35338-6 [DOI] [PubMed] [Google Scholar]
- 59.Liu R., et al. , “Single capillary oximetry and tissue ultrastructural sensing by dual-band dual-scan inverse spectroscopic optical coherence tomography,” Light Sci. Appl. 7, 57 (2018). 10.1038/s41377-018-0057-2 [DOI] [PMC free article] [PubMed] [Google Scholar]
- 60.Linsenmeier R. A., Zhang H. F., “Retinal oxygen: from animals to humans,” Prog. Retinal Eye Res. 58, 115–151 (2017). 10.1016/j.preteyeres.2017.01.003 [DOI] [PMC free article] [PubMed] [Google Scholar]


