
Extended Data Fig. 9. Single-cell RNA-Sequencing.
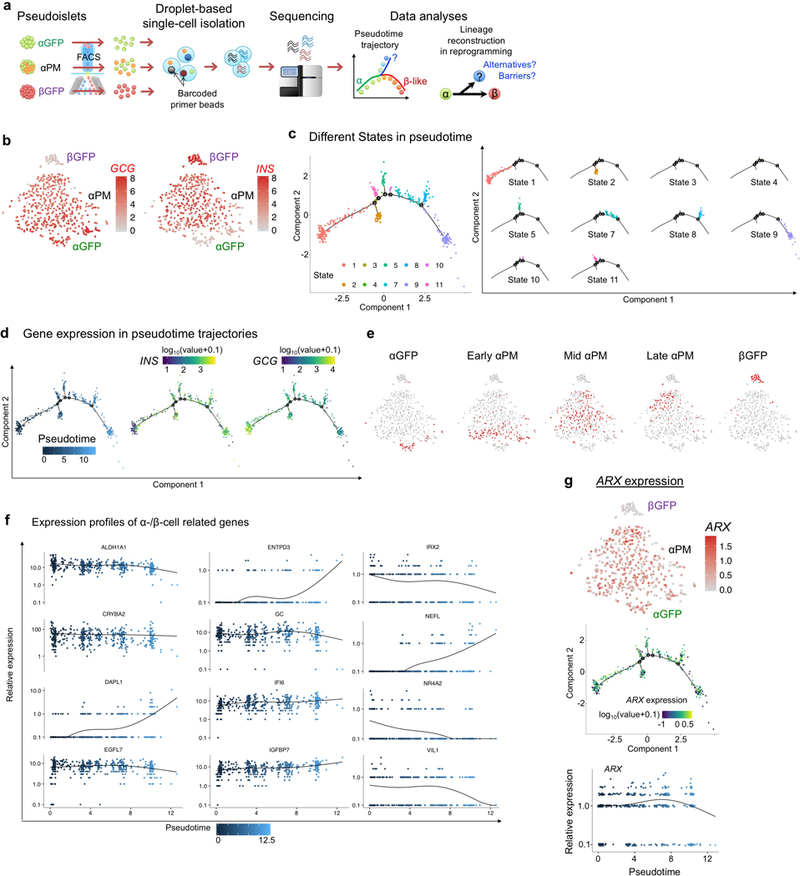
(a) Schematic of scRNA-Seq analyses and pseudotemporal ordering. Monotypic pseudoislets containing labeled human α- (“αGFP” or “αPM”) or β-cells (“βGFP”) were cultured for 1 week and sorted into single cells. Microfluidic device encapsulated each cell individually with a barcoded primer bead in a droplet. cDNA libraries were constructed and sequenced. In silico cell-lineage reconstruction during reprogramming was performed by pseudotime analysis, to dissect the reprogramming path/trajectory. αGFP and βGFP pseudoislets were analyzed as controls. (b) Gene expression of GCG and INS on t-SNE of single-cell transcriptomes from αGFP (n = 47), αPM (n = 434) and βGFP pseudoislets (n = 51) after 1-week-culture (related to Fig. 5a). (c) Cell clustering of αPM cells (n = 434) based on the state along pseudotime trajectory (related to Fig. 5b), showing 10 different states. Although 4 small branches were detected near the main path, most cells were distributed along main stem. (d) Gene expression of INS and GCG on pseudotime trajectory of αPM cells (related to Fig. 5b). (e) Cell distributions of pseudotime-based “early”, “mid” and “late” αPM cells on t-SNE map (related to Fig. 5f). (f) Kinetics of gene expression along pseudotime progression in αPM cells (n = 434) (related to Fig. 5e). (g) ARX expression in cell clusters from t-SNE and pseudotemporal ordering analysis.