
Figure 3. Transcriptomic and proteomic analyses of insulin-producing human α-cells.
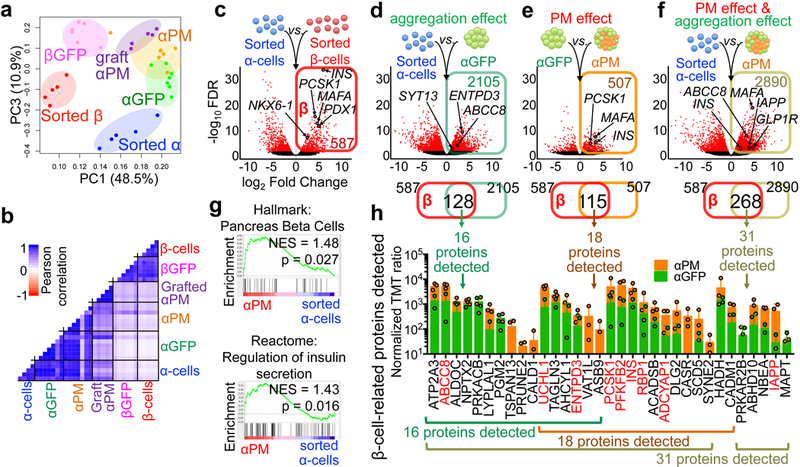
Principal component (a) and Pearson correlation (b) analyses of RNA-Seq samples, showing a gene signature shift from α- to β-cells. Each dot in (a) represents one donor. (c) Volcano plot representing DEGs between sorted α-cells and β-cells (FDR < 0.05, FC > 2). 887 α-cell-enriched genes and 587 β-cell-enriched genes were identified (Supplementary Table 10). (d-f) Volcano plots showing DEGs in: (d) αGFP pseudoislets relative to sorted α-cells, characterizing the cell aggregation effect, (e) αPM relative to αGFP pseudoislets, reflecting the effect of PM overexpression, and (f) αPM pseudoislets relative to sorted α-cells, reflecting the combined effect of reaggregation and PM overexpression. Upregulated DEGs in each condition (colored squares in d-f) were overlapped with β-cell-enriched genes from c, as a measure of β-cell trait acquisition. The Venn diagrams show that 128 “β-like genes” were upregulated in α-cells upon aggregation (d), 115 genes upon PM activation (e), and 268 “β-like genes” by the combined effect of aggregation and PM activation (f). Subsequent proteomic analyses validated many of the identified genes, which were also expressed at the protein level: 16 out of the 128 proteins in d, 18 of 115 in e, and 31 of 268 in f. (g) Gene-set enrichment analysis (GSEA) of αPM pseudoislets compared to sorted α-cells revealed an enhanced expression of β-like gene-sets and genes involved in regulating insulin secretion. (h) Quantitative proteomic analysis of “acquired β-cell signature proteins” in d-f. These proteins were more abundant in αPM than in αGFP pseudoislets. Proteins known to be important for β-cell function are highlighted in red. n=5 (sorted α), n=5 (sorted β), n=7 (αGFP), n=7 (αPM), n=6 (βGFP), n=5 (grafted αPM) in a-g. n=3 from 4 donors (αPM), n=2 from 4 donors (αGFP) in h. Data are mean ± SD.