
Extended Data Fig. 4. γ-cell reprogramming and in vitro kinetics of cell number and gene expression levels in pseudoislets.
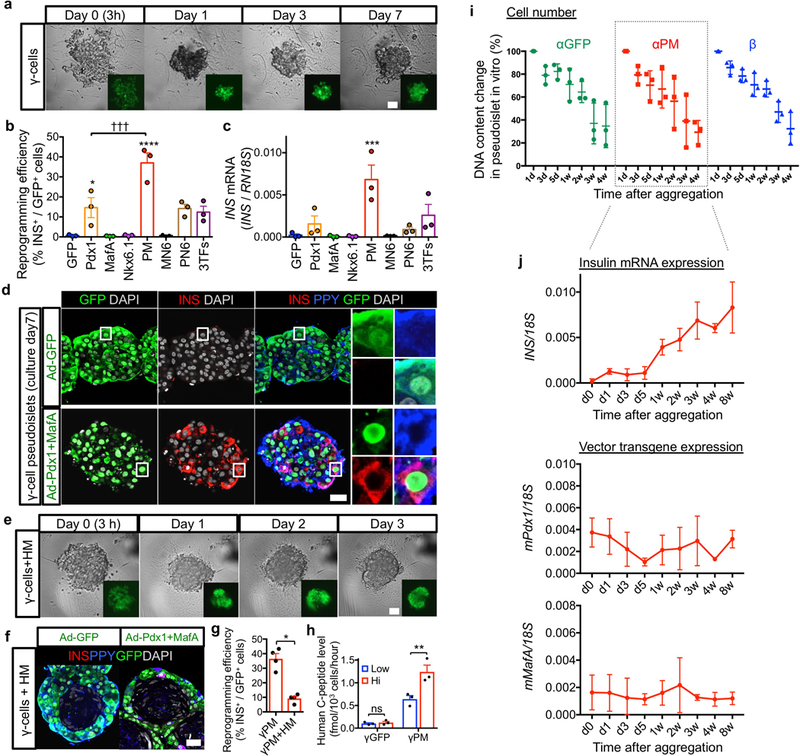
(a) Live imaging during reaggregation into pseudoislets of GFP-transduced γ-cells. Like for α-cell pseudoislets (Fig. 1), sorted γ-cells were transduced with adenoviral vectors, and then seeded on reaggregation plates. (b) Reprogramming efficiency into insulin expression (b, % of insulin+ cells out of GFP+ cells). Seven days after aggregation, γ-cells transduced with the indicated reprogramming factors show the highest reprogramming incidence (PM combination). ****p < 0.0001, *p = 0.046 vs γGFP control; †††p = 0.0008 versus γPM, one-way ANOVA with Tukey’s multiple comparisons test. n = 3 from different donors. (c) qPCR analysis of human insulin gene expression in α-cell pseudoislets. Seven days after aggregation, γ-cells transduced with the indicated reprogramming factors show the highest reprogramming incidence (PM combination). ***p = 0.0009 vs γGFP control, one-way ANOVA with Tukey’s multiple comparisons test. n = 3 from different donors. Data are mean ± s.e.m. (d) Immunofluorescence of γGFP and γPM pseudoislets after 7 days in culture. Most insulin-expressing reprogrammed γ-cells maintain PPY expression (blue in inset). (e) Live imaging of aggregated transduced γ-cells. γPM+HM pseudoislets form faster than γ-cell-only pseudoislets (a). Scale bar: 25 μm. (f, g) Control γ-cells in γGFP+HM pseudoislets do not reprogram (insulin production) (< 1%; left panel in f), yet PM-transduced γ-cells become insulin-producers in γPM+HM pseudoislets (right panel in f). The architecture of γPM+HM pseudoislets is similar that of αPM+HM pseudoislets; however, γ-cell reprogramming efficiency in γPM+HM clusters is lower than in γPM-only pseudoislets (g). *p = 0.029, Mann-Whitney test, two-tailed. n = 4 from different donors. Data are mean ± s.e.m. Scale bars: 25 μm. (h) Glucose-stimulated insulin secretion: γ-cells in γPM-only pseudoislets efficiently secrete insulin in response to glucose stimulation in vitro, but not γGFP pseudoislets. Interestingly, they secrete insulin better than α-cells in αPM+HM pseudoislets (1.24 fmol/103 cells vs 0.27 fmol/103 cells for converted α-cells; h and Fig. 1f). ns (not significant): p = 0.82, **p = 0.0043, two-way RM ANOVA with Holm-Sidak’s multiple comparisons test. n = 3 donor samples. All data shown are means ± s.e.m. Scale bars: 25 μm. All images are representative of 3 (a,e) or 4 (d,f) independent experiments. (i) DNA content was measured by Pico-green tests to assess cell number kinetics in pseudoislets in vitro. Cell numbers dropped mainly between 1 and 2 weeks in α- and β-cell pseudoislets. n = 3 from different donors. Data are mean ± SD. (j) Expression levels of INSULIN and adenoviral vector mouse Pdx1 and MafA were also evaluated by qPCR at indicated time-points. Surprisingly, insulin expression levels were increased with time. Exogenous adenoviral Pdx1 and MafA expression levels were also maintained for 8 weeks in vitro. n = 3 from different donors. Data are mean ± SD.