

Abstract
Metastasis is the most lethal stage of cancer progression. The present study aimed to investigate the underlying molecular mechanisms of melanoma metastasis using bioinformatics. Using the microarray dataset GSE8401 from the Gene Expression Omnibus database, which included 52 biopsy specimens from patients with melanoma metastasis and 31 biopsy specimens from patients with primary melanoma, differentially expressed genes (DEGs) were identified, subsequent to data preprocessing with the affy package, followed by Gene Ontology and Kyoto Encyclopedia of Genes and Genomes (KEGG) pathway enrichment analyses. A protein-protein interaction (PPI) network was constructed. Mutated genes were analyzed with 80 mutated cases with melanoma from The Cancer Genome Atlas. The overall survival of key candidate DEGs, which were within a filtering of degree >30 criteria in the PPI network and involved three or more KEGG signaling pathways, and genes with a high mutation frequency were delineated. The expression analysis of key candidate DEGs, mutant genes and their associated genes were performed on UALCAN. Of the 1,187 DEGs obtained, 505 were upregulated and 682 were downregulated. ‘Extracellular exosome’ processes, the ‘amoebiasis’ pathway, the ‘ECM-receptor interaction’ pathway and the ‘focal adhesion’ signaling pathway were significantly enriched and identified as important processes or signaling pathways. The overall survival analysis of phosphoinositide-3-kinase regulator subunit 3 (PIK3R3), centromere protein M (CENPM), aurora kinase A (AURKA), laminin subunit α 1 (LAMA1), proliferating cell nuclear antigen (PCNA), adenylate cyclase 1 (ADCY1), BUB1 mitotic checkpoint serine/threonine kinase (BUB1), NDC80 kinetochore complex component (NDC80) and protein kinase C α (PRKCA) in DEGs was statistically significant. Mutation gene analysis identified that BRCA1-associated protein 1 (BAP1) had a higher mutation frequency and survival analysis, and its associated genes in the BAP1-associated PPI network, including ASXL transcriptional regulator 1 (ASXL1), proteasome 26S subunit, non-ATPase 3 (PSMD3), proteasome 26S subunit, non ATPase 11 (PSMD11) and ubiquitin C (UBC), were statistically significantly associated with the overall survival of patients with melanoma. The expression levels of PRKCA, BUB1, BAP1 and ASXL1 were significantly different between primary melanoma and metastatic melanoma. Based on the present study, ‘extracellular exosome’ processes, ‘amoebiasis’ pathways, ‘ECM-receptor interaction’ pathways and ‘focal adhesion’ signaling pathways may be important in the formation of metastases from melanoma. The involved genes, including PIK3R3, CENPM, AURKA, LAMA1, PCNA, ADCY1, BUB1, NDC80 and PRKCA, and mutation associated genes, including BAP1, ASXL1, PSMD3, PSMD11 and UBC, may serve important roles in metastases of melanoma.
Keywords: melanoma, metastasis, differentially expressed gene, pathway, overall survival
Introduction
Melanoma is a common malignancy and has one of the poorest prognoses due to its excessive aggression and metastasis (1). In recent years, the incidence of melanoma has increased significantly and the survival rate of patients with melanoma remains poor (2). As metastasis is the most lethal stage of melanoma progression, identifying its underlying molecular mechanisms and determining its molecular biomarkers is important.
Microarray analysis is able to quickly identify all of the genes expressed at any one time-point and is particularly suited to screen for differentially expressed genes (DEGs) (3). Recently, microarray analysis has been widely applied and has produced large amounts of microarray data, which are deposited in public databases. It may be beneficial for further research to integrate and reanalyze this data (4).
In a previous study, the microarray dataset GSE8401 generated by Xu et al (5) was used to validate a ‘metastasis aggressiveness gene expression signature’ derived from human melanoma cells, selected based on their metastatic potential in an immunodeficient mouse metastasis model, and their correlation with the aggressiveness of melanoma metastases in human patients. However, an integral bioinformatics analysis combined with an expression profile analysis has not been yet been conducted, to the best of the authors' knowledge.
In the present study, the DEGs from the GSE8401 dataset were identified, subsequent to data preprocessing with the affy package, followed by Gene Ontology and Kyoto Encyclopedia of Genes and Genomes (KEGG) pathway enrichment analyses. A protein-protein interaction (PPI) network was constructed. Mutated genes were analyzed with 80 mutated cases with melanoma from The Cancer Genome Atlas (TCGA). The overall survival of key candidate DEGs, which were within a filtering of degree >30 criteria in the PPI network and involved three or more KEGG signaling pathways, and genes with a high mutation frequency were delineated. The expression analysis of key candidate DEGs, mutant genes and their associated genes were performed on UALCAN. Of the 1,187 DEGs obtained, 505 were upregulated and 682 were downregulated. ‘Extracellular exosome’ processes, the ‘amoebiasis’ pathway, the ‘ECM-receptor interaction’ pathway and the ‘focal adhesion’ signaling pathway were significantly enriched and identified as important processes or signaling pathways. The overall survival analysis of phosphoinositide-3-kinase regulator subunit 3 (PIK3R3), centromere protein M (CENPM), aurora kinase A (AURKA), laminin subunit α 1 (LAMA1), proliferating cell nuclear antigen (PCNA), adenylate cyclase 1 (ADCY1), BUB1 mitotic checkpoint serine/threonine kinase (BUB1), NDC80, kinetochore complex component (NDC80) and protein kinase C α (PRKCA) in DEGs was statistically significant. Mutation gene analysis identified that BRCA1-associated protein 1 (BAP1) had a higher mutation frequency and survival analysis, and its associated genes in the BAP1-associated PPI network, including ASXL transcriptional regulator 1 (ASXL1), proteasome 26S subunit, non-ATPase 3 (PSMD3), proteasome 26S subunit, non ATPase 11 (PSMD11) and ubiquitin C (UBC), were statistically significantly associated with the overall survival of patients with melanoma. The expression levels of PRKCA, BUB1, BAP1 and ASXL1 were significantly different between primary melanoma and metastatic melanoma. Based on the present study, ‘extracellular exosome’ processes, ‘amoebiasis’ pathways, ‘ECM-receptor interaction’ pathways and ‘focal adhesion’ signaling pathways may be important in the formation of metastases from melanoma. The involved genes, including PIK3R3, CENPM, AURKA, LAMA1, PCNA, ADCY1, BUB1, NDC80 and PRKCA, and mutation associated genes, including BAP1, ASXL1, PSMD3, PSMD11 and UBC, may serve important roles in metastases of melanoma.
Materials and methods
Affymetrix microarray data and clinical information
The gene expression profile dataset GSE8401 was extracted from the Gene Expression Omnibus (GEO) database (https://www.ncbi.nlm.nih.gov/geo/) (6). The GSE8401 dataset was deposited by Xu et al (5), including 52 biopsy specimens from patients with melanoma metastasis and 31 biopsy specimens from patients with primary melanoma, and was based on the platform of the GPL96 (HG-U133A) Affymetrix Human Genome U133A Array (Affymetrix; Thermo Fisher Scientific, Inc., Waltham, MA, USA). These 83 fresh melanoma biopsies from patients undergoing surgery were collected between 1992 and 2001 as a part of the diagnostic or therapeutic strategy. Immediately following surgery, half of each specimen was fixed in formalin and processed for routine histology, and the other half was immediately snap-frozen and stored in liquid nitrogen until use for RNA extraction. Histopathological diagnosis of each tissue specimen was performed independently by two histopathologists. All patient specimens were collected and used, according to the approval by the institutional ethics committee and written informed consent was obtained, according to the ethical standards in the 1964 Declaration of Helsinki.
Data preprocessing and DEG screening
The downloaded data in the series matrix file was preprocessed using the affy package (version 1.50.0) (7) in R language, including normalization and expression calculation. Annotations to the probes were performed, and probes that were not matched to the gene symbols were excluded. The average expression values were taken if different probes mapped to the same gene. DEGs in patients with melanoma metastasis compared with patients with primary melanoma were analyzed using the limma package (8) in R language. The cut-off threshold was set as a P<0.05 and log2 (fold change) >1 or <-1.
GO and pathway enrichment analysis
GO (http://www.geneontology.org/) analysis is commonly used for functional studies of large-scale genomic or transcriptomic data and classifies functions with respect to three criteria: Molecular function (MF), cellular component (CC) and biological process (BP) (9,10). The KEGG (http://www.kegg.jp/) pathway database is widely used for the systematic analysis of gene functions, associating genomic data with higher order functional data (11). The Database for Annotation, Visualization and Integrated Discovery (DAVID; http://david.ncifcrf.gov/) is an integrated biological knowledge base with analytical tools used for the systematic and integrative analysis of large gene lists (12). In the present study, GO terms and KEGG signaling pathway enrichment analyses for DEGs were performed using DAVID. The cutoff threshold was set as P<0.05.
Integration analysis of the PPI network and the KEGG pathway network
Search Tool for the Retrieval of Interacting Gene/Proteins (STRING; http://www.string-db.org/) is an online database that assesses and integrates PPIs (13). In the present study, DEGs were mapped onto the STRING database for PPI analysis, with a combined score of 0.4 as the parameter setting. The PPI network generated with the DEGs was constructed with Cytoscape software (version 3.4.0) (14,15) and the topology scores of the nodes in the PPI network were analyzed using the CentiScape plugin (version 3.4.0; Parameter setting: Without weight) (16). The key candidate genes were screened with a filtering of degree >30 criteria in the PPI network. Networks of significantly enriched (P<0.05) KEGG pathways and their associated genes were constructed using the Cytoscape (version 3.4.0) plugin ClueGO (14) and Cluepedia (15). The cross-talk genes were identified with the filtering criteria of association with at least three signaling pathways.
Mutant genes screening
The cBioPortal (http://www.cbioportal.org/) for Cancer Genomics, which provides the visualization, analysis and download of large-scale cancer genomics datasets, was employed for the mutation analysis (17,18). In total, 80 mutated cases were selected from TCGA database (project ID: TCGA_SKCM; http://cancergenome.nih.gov/) to screen for mutated genes (19). The detailed clinical information of the samples is listed in Table I.
Table I.
Information of the cases with metastasis.
| A, Deceased patients | |||
|---|---|---|---|
| Submitter ID | BAP1 mutation | Tumor stage | Days to mortality |
| TCGA-WC-A88A | Yes | IV | 82 |
| TCGA-WC-A884 | Yes | IIIb | 123 |
| TCGA-WC-A883 | Yes | IIIa | 241 |
| TCGA-WC-A87U | Yes | IIIa | 581 |
| TCGA-VD-A8KF | No | IIIb | 240 |
| TCGA-VD-A8KD | No | IV | 114 |
| TCGA-V4-A9EX | No | IIIa | 730 |
| TCGA-V4-A9EV | No | IIIa | 1,105 |
| TCGA-V4-A9ES | Yes | IIIa | 511 |
| TCGA-V4-A9EQ | Yes | IIIa | 355 |
| TCGA-V4-A9EI | No | IIIb | 389 |
| TCGA-V4-A9E9 | Yes | IIIa | 1,246 |
| TCGA-V4-A9E8 | Yes | IIIa | 458 |
| TCGA-V4-A9E7 | No | IIIa | 565 |
| TCGA-RZ-AB0B | No | IV | 349 |
| B, Alive patients | |||
| Submitter ID | BAP1 mutation | Tumor stage | Days to last follow-up |
| TCGA-YZ-A985 | Yes | IIIa | 1,184 |
| TCGA-YZ-A982 | Yes | IIIb | 895 |
| TCGA-YZ-A980 | Yes | IIIa | 862 |
| TCGA-WC-A880 | Yes | IIIa | 1,258 |
| TCGA-VD-A8KK | Yes | IIIa | 624 |
| TCGA-VD-A8KH | No | IIIb | 1,158 |
| TCGA-VD-A8K7 | No | IIIa | 1,459 |
| TCGA-V4-A9F8 | No | IIIa | 797 |
| TCGA-V4-A9F5 | No | IV | 603 |
| TCGA-V4-A9F4 | No | IIIa | 634 |
| TCGA-V4-A9F3 | No | IIIa | 1543 |
| TCGA-V4-A9F2 | No | IIIa | 934 |
| TCGA-V4-A9F0 | No | IIIb | 1,678 |
| TCGA-V4-A9EY | No | IIIa | 837 |
| TCGA-V4-A9EW | No | IIIa | 1,211 |
| TCGA-V4-A9EU | No | IIIc | 709 |
| TCGA-V4-A9ET | No | IIIb | 1,362 |
| TCGA-V4-A9EO | Yes | IIIa | 973 |
| TCGA-V4-A9EM | No | IIIa | 966 |
| TCGA-V4-A9EL | No | IIIa | 1,082 |
| TCGA-V4-A9EH | No | IIIb | 670 |
| TCGA-V4-A9EF | No | IIIb | 1,165 |
| TCGA-V4-A9ED | No | IIIa | 1,078 |
| TCGA-V4-A9EA | No | IIIa | 1,348 |
| TCGA-V4-A9E5 | No | IIIb | 1,799 |
TCGA, The Cancer Genome Atlas; BAP1, BRCA1-associated protein 1.
Overall survival and expression analysis
Overall survival analyses for key candidate DEGs and mutation associated genes were performed using Gene Expression Profiling Interactive Analysis (http://gepia.cancer-pku.cn/index.html) (20). Briefly, by entering the genes of interest to the website, patients were divided into two groups according to the expression level of gene, and the survival rate was statistically analysed. The hazard ratio (HR) with 95% confidence intervals and log rank P-value were calculated and are presented. The expression analysis of key candidate DEGs and mutation-associated genes in melanoma was performed using UALCAN (http://ualcan.path.uab.edu/analysis.html) (21).
Results
Data normalization and analysis of DEGs
The boxplot demonstrated good normalization of the GSE8401 data (Fig. 1A). In total, 22,283 probes were obtained, among which 1,205 probes were differentially expressed. Following annotation, 1,187 DEGs in patients with melanoma metastasis compared with patients with primary melanoma were identified, including 505 upregulated DEGs and 682 downregulated DEGs (Fig. 1B).
Figure 1.
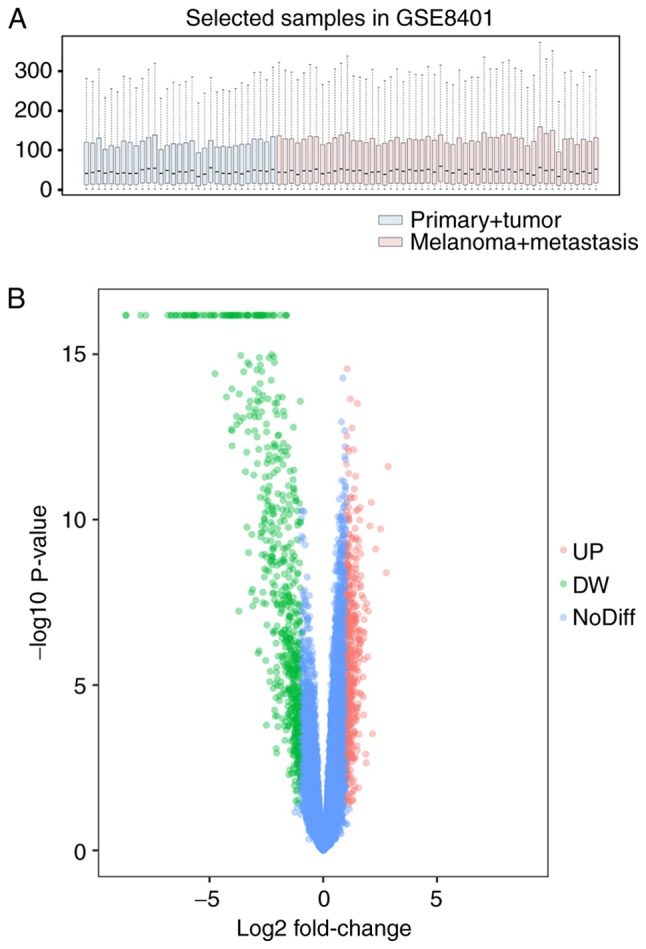
Data normalization and identification of differentially expressed genes in GSE8401. (A) Boxplot for normalized gene expression data and (B) volcano plot of significantly differentially expressed genes. UP, upregulated; DW, downregulated; NoDiff, no difference.
GO and signaling pathway enrichment analysis
GO enrichment analysis for the DEGs was performed. The top 10 most significant GO terms of each group are presented in Fig. 2A. For MF, the DEGs were primarily enriched in ‘structural molecule activity’ processes. For CC, the DEGs were primarily enriched in ‘extracellular exosome’ processes and ‘extracellular space’ processes. For BP, the DEGs were primarily enriched in ‘epidermis development’ processes, ‘keratinocyte differentiation’ processes and ‘cell adhesion’ processes.
Figure 2.


Gene Ontology and signaling pathway enrichment analysis. (A) Gene Ontology and (B) signaling pathway enrichment analysis of differentially expressed genes. MF, molecular function; CC, cellular component; BP, biological process.
The top 20 most significant KEGG pathway terms are presented in Fig. 2B. The genes were primarily enriched in ‘amoebiasis’, ‘ECM-receptor interaction’ and ‘focal adhesion’ signaling pathways.
PPI analysis
Using the STRING online database and Cytoscape software, a total of 447 DEGs of the 1,187 DEGs were mapped onto the PPI network complex (Fig. 3), and 740 of 1,187 DEGs did not fall into the PPI network.
Figure 3.

Differentially expressed gene protein-protein interaction network. Red nodes represent upregulated genes and blue nodes represent downregulated genes. The more the degree of the node, the bigger the nodes.
Cross-talk genes and key candidate gene screening
The cross-talk genes were identified with the filtering criteria of association with at least three signaling pathways, based on the KEGG pathway analysis (Fig. 4). The key candidate genes were screened, including PIK3R3, CENPM, AURKA, LAMA1, PCNA, ADCY1, BUB1, NDC80 kinetochore complex component (NDC80) and PRKCA. Among these genes, PIK3R3, PRKCA, ADCY1 and LAMA1 were enriched in the ‘amoebiasis’ signaling pathway. ADCY1 was additionally involved in ‘pancreatic secretion’, ‘GnRH signaling pathway’, ‘melanogenesis’ and ‘pathways in cancer’ signaling pathways. The majority of these genes were involved in ‘pathways in cancer’, ‘ECM-receptor interaction’ and ‘focal adhesion’ signaling pathways.
Figure 4.

Differentially expressed gene Kyoto Encyclopedia of Genes and Genomes network analysis. The larger size of the nodes represent larger enrichment scores and different colors represent the different enrichment modules.
Overall survival analysis of key candidate genes
The survival analysis sourced from TCGA data was performed and the analysis curves demonstrated that the aberrant expressions of the key candidate genes, including PIK3R3, CENPM, AURKA, LAMA1, PCNA, ADCY1, BUB1, NDC80 and PRKCA, were significantly associated with poor overall survival (Fig. 5).
Figure 5.

Overall survival curves of key candidate genes in the protein-protein network. Overall survival curves of (A) CENPM, (B) BUB1, (C) AURKA, (D) ADCY1, (E) PRKCA, (F) PIK3R3, (G) PCNA, (H) NDC80 and (I) LAMA1. CENPM, centromere protein M; BUB1, BUB1 mitotic checkpoint serine/threonine kinase; AURKA, aurora kinase A; ADCY1, adenylate cyclase 1; PRKCA, protein kinase C α; PIK3R3, phosphoinositide-3-kinase regulator subunit 3; PCNA, proliferating nuclear antigen; NDC80, NDC80 kinetochore complex component; LAMA1, laminin subunit α 1; TPM, transcripts per million.
Mutant genes and their associated gene analysis
The mutation analysis of genes was performed on cBioPortal based on 80 patients with melanoma from TCGA database. The results demonstrated that G protein subunit α q, G protein subunit α 11, BAP1 and slicing factor 3b subunit 1 had the highest mutation frequency (Fig. 6). Only the survival analysis of BAP1 was statistically significant (data not shown).
Figure 6.

Top 50 mutated genes in 80 mutated cases with melanoma.
A BAP1-associated PPI network was constructed (Fig. 7), in which the survival analyses of ASXL1, proteasome 26S subunit, non-ATPase 3 (PSMD3), proteasome 26S subunit, non ATPase 11 (PSMD11) and UBC were statistically significant (Fig. 8). Survival analysis was conducted in 40 melanoma cases with metastasis selected from the 80 patients with melanoma in the TCGA database (14 cases with BAP1 mutations and 26 cases without BAP1 mutations) to identify the prognostic value of BAP1 mutations in melanoma cases with metastasis (Fig. 9); information on the cases is provided in Table I.
Figure 7.
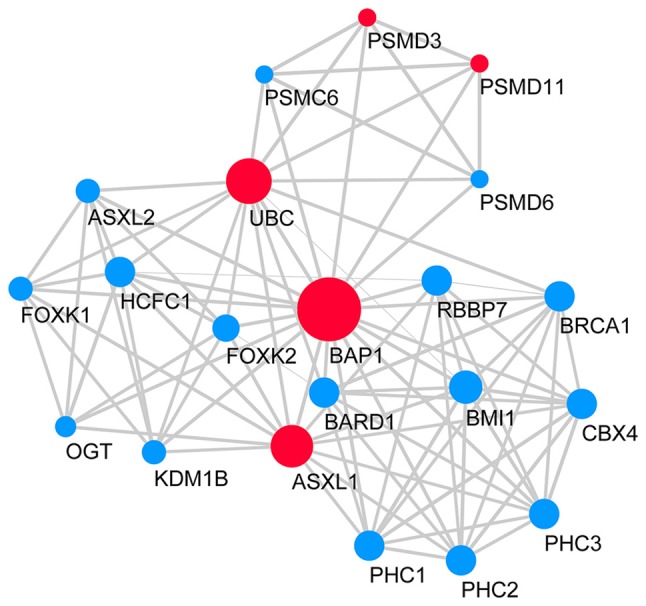
BAP1-associated gene PPI network. Red nodes represent upregulated genes and blue nodes represent downregulated genes. The larger size of the nodes represent more degrees in the global PPI network and lines indicate interactions. BAP1, BRCA1 associated protein 1; PPI, protein-protein interaction.
Figure 8.

Overall survival curves of BAP1 and its associated genes. Overall survival curves of (A) BAP1, (B) PSMD3, (C) PSMD11, (D) UBC and (E) ASXL1. BAP1, BRCA1 associated protein 1; PSMD3, proteasome 26S subunit, non-ATPase 3; PSMD11, proteasome 26S subunit, non ATPase 11; UBC, ubiquitin C; ASXL1, ASXL transcriptional regulator 1; TPM, transcripts per million; HR, hazard ratio.
Figure 9.
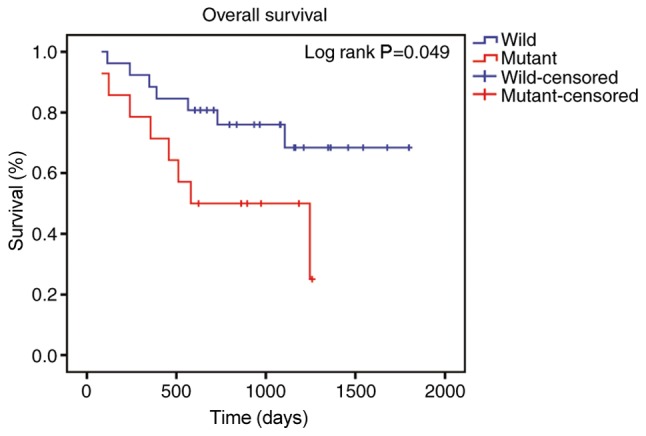
Overall survival curves of associated protein 1 in tumor cases with metastasis.
Discussion
The majority of patients with melanoma are diagnosed at advanced stages and have poor overall survival (22). However, the molecular mechanisms involved in the metastasis and progression of malignant melanoma remain unclear.
In the present study, the raw gene expression data of GSE8401 was obtained from the GEO. The original previous study identified that membrane proteins served an important role in tumor-microenvironment interactions during metastasis (5). However, further investigation is required regarding the clinical value of these genes. In the present study, a comprehensive bioinformatics analysis based on the GSE8401 dataset and TCGA was performed. The results suggested that high expression of PIK3R3, CENPM, AURKA, LAMA1, PCNA, ADCY1, BUB1, NDC80 and PRKCA in patients with melanoma was associated with poor overall survival.
PRKCA serves a critical role in the growth of human melanoma cells and a low expression level of PRKCA promotes cellular proliferation (23). In models of melanoma, activation of PRKCA was associated with increased tumor cell proliferation and invasiveness (24). Small interfering RNA-mediated knockdown of PRKCA resulted in a significant suppression of invasion (25). ADCY1, a member of the adenylate cyclase gene family, encodes adenylate cyclase. ADCY1 demonstrated a downregulated trend in rectal adenocarcinoma metastasis (26). LAMA1 expression was increased in esophageal squamous cell carcinoma tissues, and its overexpression rescued the multiplication suppression and cell apoptosis increases induced by microRNA-202 (27).
In the present study, PRKCA, ADCY1 and LAMA1 were enriched in the ‘amoebiasis’ signaling pathway. Colonic amoebiasis has been commonly demonstrated to mimic colon carcinoma (28–30). A rare case of colonic amoebiasis was identified to coexist with signet-ring cell carcinoma (31). All of these results support the hypothesis that PRKCA may contribute to the metastases of melanoma.
A previous study demonstrated that ADCY1 had a downregulated trend in rectal adenocarcinoma metastasis and was significantly enriched in the ‘pancreatic secretion’ pathway (26). In the present study, ADCY1 was identified to be involved in several melanoma-related pathways such as ‘pathways in cancer’ and ‘melanogenesis’. Previous study has shown that melanogenesis plays a key role in regulation of cellular metabolism of melanoma cell (32).
The diagnostic gene BUB1, a discriminator between melanoma, benign nevi and lymph nodes, contributes to the detection of melanoma micrometastasis in sentinel lymph nodes (33). Utilizing gene microarray analysis and real-time quantitative polymerase chain reactions, the expression level of BUB1 has been identified to be high in metastatic melanoma (34). BUB1 is downstream of sirtuin 1 (SIRT1), which is upregulated in human melanoma, and its inhibition causes an anti-proliferative effect in melanoma cells (35). The expression of BUB1 is suppressed by the inhibition of SIRT1 (35). Therefore, high expression of BUB1 promotes melanoma metastasis and results in a poor prognosis.
AURKA is known to induce the formation of the mitotic spindle and to be involved in cell multiplication and migration (22). AURKA was upregulated in malignant melanoma cells and tissues, and AURKA overexpression promoted human melanoma cell growth (22). Activation of AURKA is driven by the forkhead box protein M1 and the mitogen-activated protein kinase/extracellular-regulated kinase signaling pathway, and is associated with a poor prognosis in patients with melanoma (36). A comprehensive gene expression analysis of melanoma metastasis suggested that BUB1 and AURKA may serve crucial roles in the development and progression of melanoma (37).
NDC80 is a novel oncogene that is involved in the occurrence of various tumors. It is highly expressed in a variety of cancer types, including pancreatic cancer, hepatocellular carcinoma, gastric cancer and colorectal cancer (38–41). Overexpression of NDC80 in cancer cells and tissues promoted multiplication and migration, and was correlated with poor outcomes in those patients with pancreatic cancer (38). In patients with colorectal cancer, NDC80 overexpression was significantly associated with advanced tumor stage and a poor prognosis (41). NDC80 is a downstream gene of polo-like kinase 1, which is a well-documented oncogene that serves a key role in cell reproduction and invasion (42). In bladder cancer, NDC80 was associated with the regulation of cell reproduction, migration and invasion, and was positively associated with metastasis (43). All of these results suggested that NDC80 serves an important role in the metastases of melanoma.
PIK3R3, which activates the protein kinase B/serine/threonine-protein kinase mTOR signaling pathway, serves a crucial role in the survival, proliferation and motility of various tumors (44,45). PIK3R3 is involved in the regulation of the actin cytoskeleton and regulates triple-negative breast cancer cell migration (46). Its expression is high in human hepatocellular carcinoma tissues and glioma tissues (45,47,48). PIK3R3 overexpression augments tumor migration and aggressiveness, and promotes the metastasis of colorectal cancer (49). The basal expression level of PIK3R3 was upregulated in highly metastatic human non-small-cell lung cancer cells (44).
PCNA is a proliferation marker and regulates cell growth (50). In esophageal tumor tissues, upregulation of MAGE family member D1 promoted cell growth by interacting with PCNA (51). CENPM and UBC were additionally identified as key candidate genes in the present study. However, CENPM and UBC have not been previously identified to be involved in cancer. Their function and roles require further experimental verification.
In addition, it was identified that the somatic mutation frequency of BAP1 was high in patients with melanoma and patients with a low expression level of BAP1 had poor overall survival. Conversely, high expression of ASXL1, PSMD3, PSMD11 and UBC, which are BAP1-associated genes, was associated with poor overall survival.
BAP1 is a novel identified tumor suppressor gene and somatic mutations of BAP1 occur in a variety of malignancies (52). BAP1 serves a key role in stabilizing epigenetic regulators, including O-linked N-acetylglucosamine (GlcNAc) transferase, host cell factor C1 and ASXL1, and thus an ASXL/BAP1 complex may inhibit chronic myelomonocytic leukemia, in which ASXL1 is frequently mutated (53). The frequency of BAP1 mutations may be undervalued, and a number of previously unidentified BAP1 and spliceosome mutations were identified in uveal melanoma (54). Inactivating mutations in BAP1 were associated with a high metastatic risk of uveal melanoma (55). In the clinical setting, anti-BAP-1 has been used to detect the presence of BAP-1 mutation (56). Histologically, the melanocytic lesions are located predominantly in the dermis and are composed of epithelioid melanocytes with abundant cytoplasm and distinct nucleoli. Similar lesions develop in the context of somatically acquired BAP-1 loss (57). Immunohistochemistry analysis with anti-BAP-1 demonstrated loss of nuclear staining in melanocytic lesions with BAP-1 mutations (56,58). In the present study, patients with low expression levels of BAP1 had poor overall survival, and the expression of BAP1 was lower in metastatic melanoma compared with primary melanoma. Moreover, mutation of BAP1 was associated with poor prognosis in 40 melanoma cases with metastasis. These results suggested that mutations of BAP1 may serve a key role in the metastases of melanoma.
ASXL1 is involved in polycomb repressive complex 2-dependent transcriptional repression and nuclear hormone receptor- and BAP1-dependent transcriptional regulation. Somatic mutations of ASXL family members occur in human cancer (59). ASXL1 overexpression was identified in cervical cancer (60) and truncation mutations in ASXL1 were identified in various diseases, including chronic lymphocytic leukemia, malignant myeloid diseases, head and neck squamous cell carcinoma, colorectal cancer, liver cancer, prostate cancer and breast cancer (58,59). Furthermore, truncation mutations in ASXL1 resulted in a poor prognosis of myeloid malignancies (61,62). This is inconsistent with the present result that ASXL1 was highly expressed in metastatic melanoma and associated with poor overall survival in patients with melanoma. ASXL1 may have different functions in the metastases of melanoma. This requires further validation.
Silencing of PSMD3 together with human epidermal growth factor receptor 2 resulted in an additive suppression of cell viability, multiplication and protein kinase B signaling pathway activity (63). PSMD3 is downregulated in the long-term survivor subtype of glioblastoma multiforme, suggesting that a low expression level of PSMD3 results in longer survival (64). PSMD11 was overexpressed in breast cancer tissue, and this may be associated with specific biological processes and pathological types of breast cancer (65). PSMD11 is a short-lived protein, and knockdown of PSMD11 via RNA interference partially resulted in the occurrence of acute apoptosis in pancreatic cancer cells (66). It was identified that high expression of PSMD3 and PSMD11 was associated with poor overall survival in patients with melanoma. Therefore, PSMD3 and PSMD11 may be associated with the occurrence of melanoma metastasis.
Among all of the genes discussed, the key candidate genes and the mutated genes that were identified may serve crucial roles in the metastasis of melanoma. These prognostic markers require further study, and the accuracy of diagnosis may be improved based on multiple gene detection. There are specific limitations to the present bioinformatics analysis. Only a single open GEO dataset was included in the present study, considering that there was no suitable dataset for merge analysis and verification. No functional validation was conducted to support the present findings, although a number of the present observations were supported by previous studies. Biological validation is required in future studies. The survival analysis was conducted based on a TCGA dataset with a limited number of cases. The function and role of the candidate genes in the metastases of melanoma requires further validation. Future studies may aim to validate the gene expression in clinical samples. Additionally, the diagnostic value of BAP1 and its associated genes require validation in clinical samples. Further studies are required to investigate the molecular mechanism of the hub genes, selected in the present study, in melanoma metastasis.
In conclusion, 1,187 DEGs were identified in metastatic melanoma compared with primary melanoma. A total of 447 DEGs were mapped onto a PPI network. Based on the PPI network analysis, gene function enrichment analysis, KEGG network analysis and survival analysis, PIK3R3, CENPM, AURKA, LAMA1, PCNA, ADCY1, BUB1, NDC80 and PRKCA, which were associated with poor overall survival, may serve key roles in the metastasis and invasion processes of melanoma. Additionally, BAP1 and its associated genes may contribute to the metastasis and invasion processes of melanoma. The results of the present study may provide valuable prognostic markers and therapeutic targets for melanoma. Further studies are required to validate the function and role of these DEGs in the metastasis and aggressiveness of melanoma.
Acknowledgements
Not applicable.
Funding
The present study was supported in part by Shanghai Municipal Health Bureau General Project (grant no. 20134381 to Jia Chen) and Science and Technology Commission of Shanghai Municipal Health Bureau Youth Project (grant no. 20114Y057 to Yongxian Lai).
Availability of data and materials
The datasets used and/or analyzed during the current study are available from the corresponding author on reasonable request.
Authors' contributions
JC, YLa and YLi conceived and designed the study; JC, FW and YS performed data analysis; FW designed the figures. YS and YLa reviewed the literature. JC and YLi wrote the paper. DY and MX participated in the study design and revised the paper critically for important intellectual content.
Ethics approval and consent to participate
All patient specimens were collected and used according to the approval by the institutional Ethics Committee, and written informed consent was obtained, according to the ethical standards in the 1964 Declaration of Helsinki.
Patient consent for publication
Not applicable.
Competing interests
The authors declare no conflict of interest.
References
- 1.Palmieri G, Capone M, Ascierto ML, Gentilcore G, Stroncek DF, Casula M, Sini MC, Palla M, Mozzillo N, Ascierto PA. Main roads to melanoma. J Transl Med. 2009;7:86. doi: 10.1186/1479-5876-7-86. [DOI] [PMC free article] [PubMed] [Google Scholar]
- 2.Pessina F, Navarria P, Tomatis S, Cozzi L, Franzese C, Di Guardo L, Ascolese AM, Reggiori G, Franceschini D, Del Vecchio M, et al. Outcome evaluation of patients with limited brain metastasis from malignant melanoma, treated with surgery, radiation therapy, and targeted therapy. World Neurosurg. 2017;105:184–190. doi: 10.1016/j.wneu.2017.05.131. [DOI] [PubMed] [Google Scholar]
- 3.Vogelstein B, Papadopoulos N, Velculescu VE, Zhou S, Diaz LA, Jr, Kinzler KW. Cancer genome landscapes. Science. 2013;339:1546–1558. doi: 10.1126/science.1235122. [DOI] [PMC free article] [PubMed] [Google Scholar]
- 4.Guo Y, Bao Y, Ma M, Yang W. Identification of key candidate genes and pathways in colorectal cancer by integrated bioinformatical analysis. Int J Mol Sci. 2017;18:E722. doi: 10.3390/ijms18040722. [DOI] [PMC free article] [PubMed] [Google Scholar]
- 5.Xu L, Shen SS, Hoshida Y, Subramanian A, Ross K, Brunet JP, Wagner SN, Ramaswamy S, Mesirov JP, Hynes RO. Gene expression changes in an animal melanoma model correlate with aggressiveness of human melanoma metastases. Mol Cancer Res. 2008;6:760–769. doi: 10.1158/1541-7786.MCR-07-0344. [DOI] [PMC free article] [PubMed] [Google Scholar]
- 6.Edgar R, Domrachev M, Lash AE. Gene Expression Omnibus: NCBI gene expression and hybridization array data repository. Nucleic Acids Res. 2002;30:207–210. doi: 10.1093/nar/30.1.207. [DOI] [PMC free article] [PubMed] [Google Scholar]
- 7.Gautier L, Cope L, Bolstad BM, Irizarry RA. affy-analysis of Affymetrix GeneChip data at the probe level. Bioinformatics. 2004;20:307–315. doi: 10.1093/bioinformatics/btg405. [DOI] [PubMed] [Google Scholar]
- 8.Smyth GK. Linear models and empirical bayes methods for assessing differential expression in microarray experiments. https://doi.org/10.2202/1544-6115.1027. Stat Appl Genet Mol Biol. doi: 10.2202/1544-6115.1027. [DOI] [PubMed]
- 9.Hulsegge I, Kommadath A, Smits MA. Globaltest and GOEAST: Two different approaches for Gene Ontology analysis. BMC Proc. 2009;3(Suppl 4):S10. doi: 10.1186/1753-6561-3-S4-S10. [DOI] [PMC free article] [PubMed] [Google Scholar]
- 10.Ashburner M, Ball CA, Blake JA, Botstein D, Butler H, Cherry JM, Davis AP, Dolinski K, Dwight SS, Eppig JT, et al. The Gene Ontology Consortium Gene ontology: Tool for the unification of biology. Nat Genet. 2000;25:25–29. doi: 10.1038/75556. [DOI] [PMC free article] [PubMed] [Google Scholar]
- 11.Kanehisa M, Goto S. KEGG: Kyoto encyclopedia of genes and genomes. Nucleic Acids Res. 2000;28:27–30. doi: 10.1093/nar/28.1.27. [DOI] [PMC free article] [PubMed] [Google Scholar]
- 12.Huang W, Sherman BT, Lempicki RA. Systematic and integrative analysis of large gene lists using DAVID bioinformatics resources. Nat Protoc. 2009;4:44–57. doi: 10.1038/nprot.2008.211. [DOI] [PubMed] [Google Scholar]
- 13.Szklarczyk D, Franceschini A, Wyder S, Forslund K, Heller D, Huerta-Cepas J, Simonovic M, Roth A, Santos A, Tsafou KP, et al. STRING v10: Protein-protein interaction networks, integrated over the tree of life. Nucleic Acids Res. 2015;43(D1):D447–D452. doi: 10.1093/nar/gku1003. [DOI] [PMC free article] [PubMed] [Google Scholar]
- 14.Bindea G, Mlecnik B, Hackl H, Charoentong P, Tosolini M, Kirilovsky A, Fridman WH, Pagès F, Trajanoski Z, Galon J. ClueGO: A Cytoscape plug-in to decipher functionally grouped gene ontology and pathway annotation networks. Bioinformatics. 2009;25:1091–1093. doi: 10.1093/bioinformatics/btp101. [DOI] [PMC free article] [PubMed] [Google Scholar]
- 15.Bindea G, Galon J, Mlecnik B. CluePedia Cytoscape plugin: Pathway insights using integrated experimental and in silico data. Bioinformatics. 2013;29:661–663. doi: 10.1093/bioinformatics/btt019. [DOI] [PMC free article] [PubMed] [Google Scholar]
- 16.Scardoni G, Petterlini M, Laudanna C. Analyzing biological network parameters with CentiScaPe. Bioinformatics. 2009;25:2857–2859. doi: 10.1093/bioinformatics/btp517. [DOI] [PMC free article] [PubMed] [Google Scholar]
- 17.Gao J, Aksoy BA, Dogrusoz U, Dresdner G, Gross B, Sumer SO, Sun Y, Jacobsen A, Sinha R, Larsson E, et al. Integrative analysis of complex cancer genomics and clinical profiles using the cBioPortal. Sci Signal. 2013;6:pl1. doi: 10.1126/scisignal.2004088. [DOI] [PMC free article] [PubMed] [Google Scholar]
- 18.Cerami E, Gao J, Dogrusoz U, Gross BE, Sumer SO, Aksoy BA, Jacobsen A, Byrne CJ, Heuer ML, Larsson E, et al. The cBio cancer genomics portal: An open platform for exploring multidimensional cancer genomics data. Cancer Discov. 2012;2:401–404. doi: 10.1158/2159-8290.CD-12-0095. [DOI] [PMC free article] [PubMed] [Google Scholar]
- 19.Guan J, Gupta R, Filipp FV. Cancer systems biology of TCGA SKCM: Efficient detection of genomic drivers in melanoma. Sci Rep. 2015;5:7857. doi: 10.1038/srep07857. [DOI] [PMC free article] [PubMed] [Google Scholar]
- 20.Tang Z, Li C, Kang B, Gao G, Li C, Zhang Z. GEPIA: A web server for cancer and normal gene expression profiling and interactive analyses. Nucleic Acids Res 45 (W1) 2017:W98–W102. doi: 10.1093/nar/gkx247. [DOI] [PMC free article] [PubMed] [Google Scholar]
- 21.Chandrashekar DS, Bashel B, Balasubramanya SAH, Creighton CJ, Ponce-Rodriguez I, Chakravarthi BVSK, Varambally S. UALCAN: A Portal for Facilitating Tumor Subgroup Gene Expression and Survival Analyses. Neoplasia. 2017;19:649–658. doi: 10.1016/j.neo.2017.05.002. [DOI] [PMC free article] [PubMed] [Google Scholar]
- 22.Chang X, Zhang H, Lian S, Zhu W. miR-137 suppresses tumor growth of malignant melanoma by targeting aurora kinase A. Biochem Biophys Res Commun. 2016;475:251–256. doi: 10.1016/j.bbrc.2016.05.090. [DOI] [PubMed] [Google Scholar]
- 23.Krasagakis K, Lindschau C, Fimmel S, Eberle J, Quass P, Haller H, Orfanos CE. Proliferation of human melanoma cells is under tight control of protein kinase C alpha. J Cell Physiol. 2004;199:381–387. doi: 10.1002/jcp.10434. [DOI] [PubMed] [Google Scholar]
- 24.Lahn MM, Sundell KL. The role of protein kinase C-alpha (PKC-alpha) in melanoma. Melanoma Res. 2004;14:85–89. doi: 10.1097/00008390-200404000-00002. [DOI] [PubMed] [Google Scholar]
- 25.Kabbarah O, Nogueira C, Feng B, Nazarian RM, Bosenberg M, Wu M, Scott KL, Kwong LN, Xiao Y, Cordon-Cardo C, et al. Integrative genome comparison of primary and metastatic melanomas. PLoS One. 2010;5:e10770. doi: 10.1371/journal.pone.0010770. [DOI] [PMC free article] [PubMed] [Google Scholar]
- 26.Hua Y, Ma X, Liu X, Yuan X, Qin H, Zhang X. Identification of the potential biomarkers for the metastasis of rectal adenocarcinoma. APMIS. 2017;125:93–100. doi: 10.1111/apm.12633. [DOI] [PubMed] [Google Scholar]
- 27.Meng X, Chen X, Lu P, Ma W, Yue D, Song L, Fan Q. MicroRNA-202 inhibits tumor progression by targeting LAMA1 in esophageal squamous cell carcinoma. Biochem Biophys Res Commun. 2016;473:821–827. doi: 10.1016/j.bbrc.2016.03.130. [DOI] [PubMed] [Google Scholar]
- 28.Fernandes H, D'Souza CR, Swethadri GK, Naik CN. Ameboma of the colon with amebic liver abscess mimicking metastatic colon cancer. Indian J Pathol Microbiol. 2009;52:228–230. doi: 10.4103/0377-4929.48927. [DOI] [PubMed] [Google Scholar]
- 29.Ayari H, Rebii S, Ghariani W, Daghfous A, Hasni R, Rehaiem R, Rezgui-Marhoul L, Zoghlami A. Colonic amoebiasis simulating a cecal tumor: Case report. Med Sante Trop. 2013;23:274–275. doi: 10.1684/mst.2013.0186. (In French) [DOI] [PubMed] [Google Scholar]
- 30.Moorchung N, Singh V, Srinivas V, Jaiswal SS, Singh G. Caecal amebic colitis mimicking obstructing right sided colonic carcinoma with liver metastases: A rare case. J Cancer Res Ther. 2014;10:440–442. doi: 10.4103/0973-1482.136684. [DOI] [PubMed] [Google Scholar]
- 31.Grosse A. Diagnosis of colonic amebiasis and coexisting signet-ring cell carcinoma in intestinal biopsy. World J Gastroenterol. 2016;22:8234–8241. doi: 10.3748/wjg.v22.i36.8234. [DOI] [PMC free article] [PubMed] [Google Scholar]
- 32.Slominski A, Kim TK, Brożyna AA, Janjetovic Z, Brooks DL, Schwab LP, Skobowiat C, Jóźwicki W, Seagroves TN. The role of melanogenesis in regulation of melanoma behavior: Melanogenesis leads to stimulation of HIF-1α expression and HIF-dependent attendant pathways. Arch Biochem Biophys. 2014;563:79–93. doi: 10.1016/j.abb.2014.06.030. [DOI] [PMC free article] [PubMed] [Google Scholar]
- 33.Lewis TB, Robison JE, Bastien R, Milash B, Boucher K, Samlowski WE, Leachman SA, Dirk Noyes R, Wittwer CT, Perreard L, Bernard PS. Molecular classification of melanoma using real-time quantitative reverse transcriptase-polymerase chain reaction. Cancer. 2005;104:1678–1686. doi: 10.1002/cncr.21372. [DOI] [PubMed] [Google Scholar]
- 34.Riker AI, Enkemann SA, Fodstad O, Liu S, Ren S, Morris C, Xi Y, Howell P, Metge B, Samant RS, et al. The gene expression profiles of primary and metastatic melanoma yields a transition point of tumor progression and metastasis. BMC Med Genomics. 2008;1:13. doi: 10.1186/1755-8794-1-13. [DOI] [PMC free article] [PubMed] [Google Scholar]
- 35.Singh CK, George J, Nihal M, Sabat G, Kumar R, Ahmad N. Novel downstream molecular targets of SIRT1 in melanoma: A quantitative proteomics approach. Oncotarget. 2014;5:1987–1999. doi: 10.18632/oncotarget.1898. [DOI] [PMC free article] [PubMed] [Google Scholar]
- 36.Puig-Butille JA, Vinyals A, Ferreres JR, Aguilera P, Cabré E, Tell-Martí G, Marcoval J, Mateo F, Palomero L, Badenas C, et al. AURKA Overexpression Is Driven by FOXM1 and MAPK/ERK Activation in Melanoma Cells Harboring BRAF or NRAS Mutations: Impact on Melanoma Prognosis and Therapy. J Invest Dermatol. 2017;137:1297–1310. doi: 10.1016/j.jid.2017.01.021. [DOI] [PubMed] [Google Scholar]
- 37.Quan L, Shi J, Tian Y, Zhang Q, Zhang Y, Zhang Y, Hui Q, Tao K. Identification of potential therapeutic targets for melanoma using gene expression analysis. Neoplasma. 2015;62:733–739. doi: 10.4149/neo_2015_087. [DOI] [PubMed] [Google Scholar]
- 38.Meng QC, Wang HC, Song ZL, Shan ZZ, Yuan Z, Zheng Q, Huang XY. Overexpression of NDC80 is correlated with prognosis of pancreatic cancer and regulates cell proliferation. Am J Cancer Res. 2015;5:1730–1740. [PMC free article] [PubMed] [Google Scholar]
- 39.Qu Y, Li J, Cai Q, Liu B. Hec1/Ndc80 is overexpressed in human gastric cancer and regulates cell growth. J Gastroenterol. 2014;49:408–418. doi: 10.1007/s00535-013-0809-y. [DOI] [PubMed] [Google Scholar]
- 40.Chen ZH, Wang WT, Huang W, Fang K, Sun YM, Liu SR, Luo XQ, Chen YQ. The lncRNA HOTAIRM1 regulates the degradation of PML-RARA oncoprotein and myeloid cell differentiation by enhancing the autophagy pathway. Cell Death Differ. 2016;24:212–224. doi: 10.1038/cdd.2016.111. [DOI] [PMC free article] [PubMed] [Google Scholar]
- 41.Yan X, Huang L, Liu L, Qin H, Song Z. Nuclear division cycle 80 promotes malignant progression and predicts clinical outcome in colorectal cancer. Cancer Med. 2018;7:420–432. doi: 10.1002/cam4.1284. [DOI] [PMC free article] [PubMed] [Google Scholar]
- 42.Ahonen LJ, Kallio MJ, Daum JR, Bolton M, Manke IA, Yaffe MB, Stukenberg PT, Gorbsky GJ. Polo-like kinase 1 creates the tension-sensing 3F3/2 phosphoepitope and modulates the association of spindle-checkpoint proteins at kinetochores. Curr Biol. 2005;15:1078–1089. doi: 10.1016/j.cub.2005.05.026. [DOI] [PubMed] [Google Scholar]
- 43.Zhang Z, Zhang G, Gao Z, Li S, Li Z, Bi J, Liu X, Li Z, Kong C. Comprehensive analysis of differentially expressed genes associated with PLK1 in bladder cancer. BMC Cancer. 2017;17:861. doi: 10.1186/s12885-017-3884-2. [DOI] [PMC free article] [PubMed] [Google Scholar]
- 44.Yu T, Li J, Yan M, Liu L, Lin H, Zhao F, Sun L, Zhang Y, Cui Y, Zhang F, et al. MicroRNA-193a-3p and −5p suppress the metastasis of human non-small-cell lung cancer by downregulating the ERBB4/PIK3R3/mTOR/S6K2 signaling pathway. Oncogene. 2015;34:413–423. doi: 10.1038/onc.2013.574. [DOI] [PubMed] [Google Scholar]
- 45.Cao G, Dong W, Meng X, Liu H, Liao H, Liu S. MiR-511 inhibits growth and metastasis of human hepatocellular carcinoma cells by targeting PIK3R3. Tumour Biol. 2015;36:4453–4459. doi: 10.1007/s13277-015-3085-z. [DOI] [PubMed] [Google Scholar]
- 46.Klahan S, Wu MS, Hsi E, Huang CC, Hou MF, Chang WC. Computational analysis of mRNA expression profiles identifies the ITG family and PIK3R3 as crucial genes for regulating triple negative breast cancer cell migration. BioMed Res Int. 2014;2014:536591. doi: 10.1155/2014/536591. [DOI] [PMC free article] [PubMed] [Google Scholar]
- 47.Liu K, Li X, Cao Y, Ge Y, Wang J, Shi B. MiR-132 inhibits cell proliferation, invasion and migration of hepatocellular carcinoma by targeting PIK3R3. Int J Oncol. 2015;47:1585–1593. doi: 10.3892/ijo.2015.3112. [DOI] [PubMed] [Google Scholar]
- 48.Zhu Y, Zhao H, Rao M, Xu S. MicroRNA-365 inhibits proliferation, migration and invasion of glioma by targeting PIK3R3. Oncol Rep. 2017;37:2185–2192. doi: 10.3892/or.2017.5458. [DOI] [PubMed] [Google Scholar]
- 49.Wang G, Yang X, Li C, Cao X, Luo X, Hu J. PIK3R3 induces epithelial-to-mesenchymal transition and promotes metastasis in colorectal cancer. Mol Cancer Ther. 2014;13:1837–1847. doi: 10.1158/1535-7163.MCT-14-0049. [DOI] [PubMed] [Google Scholar]
- 50.Calderón A, Ortiz-Espín A, Iglesias-Fernández R, Carbonero P, Pallardó FV, Sevilla F, Jiménez A. Thioredoxin (Trxo1) interacts with proliferating cell nuclear antigen (PCNA) and its overexpression affects the growth of tobacco cell culture. Redox Biol. 2017;11:688–700. doi: 10.1016/j.redox.2017.01.018. [DOI] [PMC free article] [PubMed] [Google Scholar]
- 51.Yang Q, Ou C, Liu M, Xiao W, Wen C, Sun F. NRAGE promotes cell proliferation by stabilizing PCNA in a ubiquitin-proteasome pathway in esophageal carcinomas. Carcinogenesis. 2014;35:1643–1651. doi: 10.1093/carcin/bgu084. [DOI] [PubMed] [Google Scholar]
- 52.Kadariya Y, Cheung M, Xu J, Pei J, Sementino E, Menges CW, Cai KQ, Rauscher FJ, Klein-Szanto AJ, Testa JR. Bap1 Is a bona fide tumor suppressor: Genetic evidence from mouse models carrying heterozygous germline Bap1 mutations. Cancer Res. 2016;76:2836–2844. doi: 10.1158/0008-5472.CAN-15-3371. [DOI] [PMC free article] [PubMed] [Google Scholar]
- 53.Dey A, Seshasayee D, Noubade R, French DM, Liu J, Chaurushiya MS, Kirkpatrick DS, Pham VC, Lill JR, Bakalarski CE, et al. Loss of the tumor suppressor BAP1 causes myeloid transformation. Science. 2012;337:1541–1546. doi: 10.1126/science.1221711. [DOI] [PMC free article] [PubMed] [Google Scholar]
- 54.Field MG, Durante MA, Anbunathan H, Cai LZ, Decatur CL, Bowcock AM, Kurtenbach S, Harbour JW. Punctuated evolution of canonical genomic aberrations in uveal melanoma. Nat Commun. 2018;9:116. doi: 10.1038/s41467-017-02428-w. [DOI] [PMC free article] [PubMed] [Google Scholar]
- 55.Smit KN, van Poppelen NM, Vaarwater J, Verdijk R, van Marion R, Kalirai H, Coupland SE, Thornton S, Farquhar N, Dubbink HJ, et al. Combined mutation and copy-number variation detection by targeted next-generation sequencing in uveal melanoma. Mod Pathol. 2018;31:763–771. doi: 10.1038/modpathol.2017.187. [DOI] [PubMed] [Google Scholar]
- 56.Pitcovski J, Shahar E, Aizenshtein E, Gorodetsky R. Melanoma antigens and related immunological markers. Crit Rev Oncol Hematol. 2017;115:36–49. doi: 10.1016/j.critrevonc.2017.05.001. [DOI] [PubMed] [Google Scholar]
- 57.Garfield EM, Walton KE, Quan VL, VandenBoom T, Zhang B, Kong BY, Isales MC, Panah E, Kim G, Gerami P. Histomorphologic spectrum of germline-related and sporadic BAP1-inactivated melanocytic tumors. J Am Acad Dermatol. 2018;79:525–534. doi: 10.1016/j.jaad.2018.05.005. [DOI] [PubMed] [Google Scholar]
- 58.Tetzlaff MT, Torres-Cabala CA, Pattanaprichakul P, Rapini RP, Prieto VG, Curry JL. Emerging clinical applications of selected biomarkers in melanoma. Clin Cosmet Investig Dermatol. 2015;8:35–46. doi: 10.2147/CCID.S49578. [DOI] [PMC free article] [PubMed] [Google Scholar]
- 59.Balasubramani A, Larjo A, Bassein JA, Chang X, Hastie RB, Togher SM, Lähdesmäki H, Rao A. Cancer-associated ASXL1 mutations may act as gain-of-function mutations of the ASXL1-BAP1 complex. Nat Commun. 2015;6:7307. doi: 10.1038/ncomms8307. [DOI] [PMC free article] [PubMed] [Google Scholar]
- 60.Scotto L, Narayan G, Nandula SV, Arias-Pulido H, Subramaniyam S, Schneider A, Kaufmann AM, Wright JD, Pothuri B, Mansukhani M, Murty VV. Identification of copy number gain and overexpressed genes on chromosome arm 20q by an integrative genomic approach in cervical cancer: Potential role in progression. Genes Chromosomes Cancer. 2008;47:755–765. doi: 10.1002/gcc.20577. [DOI] [PubMed] [Google Scholar]
- 61.Katoh M. Functional and cancer genomics of ASXL family members. Br J Cancer. 2013;109:299–306. doi: 10.1038/bjc.2013.281. [DOI] [PMC free article] [PubMed] [Google Scholar]
- 62.Katoh M. Functional proteomics of the epigenetic regulators ASXL1, ASXL2 and ASXL3: A convergence of proteomics and epigenetics for translational medicine. Expert Rev Proteomics. 2015;12:317–328. doi: 10.1586/14789450.2015.1033409. [DOI] [PubMed] [Google Scholar]
- 63.Sahlberg KK, Hongisto V, Edgren H, Mäkelä R, Hellström K, Due EU, Moen Vollan HK, Sahlberg N, Wolf M, Børresen-Dale AL, et al. The HER2 amplicon includes several genes required for the growth and survival of HER2 positive breast cancer cells. Mol Oncol. 2013;7:392–401. doi: 10.1016/j.molonc.2012.10.012. [DOI] [PMC free article] [PubMed] [Google Scholar]
- 64.Patel VN, Gokulrangan G, Chowdhury SA, Chen Y, Sloan AE, Koyutürk M, Barnholtz-Sloan J, Chance MR. Network signatures of survival in glioblastoma multiforme. PLOS Comput Biol. 2013;9:e1003237. doi: 10.1371/journal.pcbi.1003237. [DOI] [PMC free article] [PubMed] [Google Scholar]
- 65.Deng S, Zhou H, Xiong R, Lu Y, Yan D, Xing T, Dong L, Tang E, Yang H. Over-expression of genes and proteins of ubiquitin specific peptidases (USPs) and proteasome subunits (PSs) in breast cancer tissue observed by the methods of RFDD-PCR and proteomics. Breast Cancer Res Treat. 2007;104:21–30. doi: 10.1007/s10549-006-9393-7. [DOI] [PubMed] [Google Scholar]
- 66.Qi T, Zhang W, Luan Y, Kong F, Xu D, Cheng G, Wang Y. Proteomic profiling identified multiple short-lived members of the central proteome as the direct targets of the addicted oncogenes in cancer cells. Mol Cell Proteomics. 2014;13:49–62. doi: 10.1074/mcp.M113.027813. [DOI] [PMC free article] [PubMed] [Google Scholar]
Associated Data
This section collects any data citations, data availability statements, or supplementary materials included in this article.
Data Availability Statement
The datasets used and/or analyzed during the current study are available from the corresponding author on reasonable request.